
Form DEF 14A Broadcom Ltd For: Apr 04
Table of Contents
UNITED STATES
SECURITIES AND EXCHANGE COMMISSION
Washington, D.C. 20549
SCHEDULE 14A
Proxy Statement Pursuant to Section 14(a) of the
Securities Exchange Act of 1934
(Amendment No. )
Filed by the Registrant ☒ Filed by a Party other than the Registrant ☐
Check the appropriate box:
| ☐ | Preliminary Proxy Statement |
| ☐ | Confidential, for Use of the Commission Only (as permitted by Rule 14a-6(e)(2)) |
| ☒ | Definitive Proxy Statement |
| ☐ | Definitive Additional Materials |
| ☐ | Soliciting Material Pursuant to §240.14a-12 |
BROADCOM LIMITED
(Name of Registrant as Specified In Its Charter)
(Name of Person(s) Filing Proxy Statement, if other than the Registrant)
Payment of Filing Fee (Check the appropriate box):
| ☒ | No fee required. | |||
| ☐ | Fee computed on table below per Exchange Act Rules 14a-6(i)(1) and 0-11. | |||
| (1) | Title of each class of securities to which transaction applies:
| |||
| (2) | Aggregate number of securities to which transaction applies:
| |||
| (3) | Per unit price or other underlying value of transaction computed pursuant to Exchange Act Rule 0-11 (set forth the amount on which the filing fee is calculated and state how it was determined):
| |||
| (4) | Proposed maximum aggregate value of transaction:
| |||
| (5) | Total fee paid:
| |||
| ☐ | Fee paid previously with preliminary materials. | |||
| ☐ | Check box if any part of the fee is offset as provided by Exchange Act Rule 0-11(a)(2) and identify the filing for which the offsetting fee was paid previously. Identify the previous filing by registration statement number, or the Form or Schedule and the date of its filing. | |||
| (1) | Amount Previously Paid:
| |||
| (2) | Form, Schedule or Registration Statement No.:
| |||
| (3) | Filing Party:
| |||
| (4) | Date Filed:
| |||
Table of Contents

BROADCOM LIMITED
Incorporated in the Republic of Singapore
Company Registration Number 201505572G
NOTICE OF ANNUAL GENERAL MEETING OF SHAREHOLDERS
To Be Held on April 4, 2018
To our shareholders:
You are cordially invited to attend, and NOTICE IS HEREBY GIVEN of, the 2018 Annual General Meeting of Shareholders (the “2018 AGM”) of Broadcom Limited (“Broadcom”), which will be held at 1320 Ridder Park Drive, San Jose, California 95131, U.S.A., at 11:00 a.m., Pacific Time, on Wednesday, April 4, 2018, for the following purposes, as more fully described in the proxy statement accompanying this notice (the “Proxy Statement”):
As Ordinary Business
| 1. | To elect each of the following persons to our board of directors (the “Board”), to serve until the next annual general meeting of shareholders: |
| (a) | Mr. Hock E. Tan; |
| (b) | Mr. James V. Diller; |
| (c) | Ms. Gayla J. Delly; |
| (d) | Mr. Lewis C. Eggebrecht; |
| (e) | Mr. Kenneth Y. Hao; |
| (f) | Mr. Eddy W. Hartenstein; |
| (g) | Mr. Check Kian Low; |
| (h) | Mr. Donald Macleod; |
| (i) | Mr. Peter J. Marks; and |
| (j) | Dr. Henry Samueli. |
| 2. | To approve the re-appointment of PricewaterhouseCoopers LLP to serve as our independent registered public accounting firm and independent Singapore auditor for the fiscal year ending November 4, 2018, and to authorize the Audit Committee of the Board to fix PricewaterhouseCoopers LLP’s remuneration for services provided through our 2019 Annual General Meeting of Shareholders (the “2019 AGM”). |
As Special Business
| 3. | To pass the following as an Ordinary Resolution: |
RESOLVED THAT, pursuant to the provisions of Section 161 of the Singapore Companies Act, Chapter 50 (the “Singapore Companies Act”), and also subject otherwise to the provisions of the Singapore Companies Act and our Constitution, authority be, and hereby is, given to our directors:
(a) to:
| (i) | allot and issue ordinary shares in our capital; |
| (ii) | subject to the provisions of our Constitution, allot and issue Special Preference Shares (as defined below) bearing the rights and obligations as set out in our Constitution; and/or |
1
Table of Contents
| (iii) | make, grant or enter into, offers or agreements and issue options or other instruments (including the equity awards and equity-based securities pursuant to our equity-based incentive plans and agreements in effect or assumed from time to time) that might or would require ordinary shares to be allotted and issued, whether such allotment or issuance would occur during or after the expiration of this authority (including, but not limited to, the creation and issuance of warrants, rights, units, purchase contracts, debentures or other instruments (including debt instruments) convertible or exchangeable into ordinary shares), |
at any time to and/or with such persons and upon such terms and conditions, for such purposes and for such consideration as our directors may in their sole discretion deem fit, and with such rights or restrictions as our directors may think fit to impose and as are set forth in our Constitution; and
(b) to allot and issue shares in our capital pursuant to any offer, agreement, award or other instrument made, granted, assumed or otherwise authorized by our directors while this resolution is or was in effect, regardless of whether the authority conferred by this resolution may have ceased to be in effect at the time of the allotment and issuance,
and that such authority, if approved by our shareholders, shall continue in effect until the earlier of the conclusion of our 2019 AGM or the expiration of the period within which our 2019 AGM is required by law to be held.
| 4. | To consider and put to a non-binding, advisory vote, the following resolution: |
RESOLVED THAT, shareholders approve, on an advisory basis, the compensation of Broadcom’s named executive officers, as disclosed in “Compensation Discussion and Analysis” and in the compensation tables and accompanying narrative disclosure under “Executive Compensation” in the accompanying Proxy Statement.
This resolution is being proposed to shareholders as required pursuant to Section 14A of the U.S. Securities Exchange Act of 1934, as amended. The shareholders’ vote on this resolution is advisory and non-binding in nature, will have no legal effect and will not be enforceable against Broadcom or our Board.
As Ordinary Business
| 5. | To transact any other business as may properly be transacted at the 2018 AGM. |
Notes About the 2018 Annual General Meeting of Shareholders
Singapore Statutory Financial Statements. At the 2018 AGM, our shareholders will have the opportunity to discuss and ask questions regarding our Singapore audited financial statements for our fiscal year ended October 29, 2017, together with the directors’ statement and auditors’ report thereon, in compliance with the laws of Singapore. Shareholder approval of our Singapore audited financial statements is not being sought by the Proxy Statement and will not be sought at the 2018 AGM.
Proxy Materials on the Internet. We use the internet as the primary means of furnishing proxy materials to our beneficial owners. We are sending a Notice of Internet Availability of Proxy Materials to our beneficial owners with instructions on how to access the proxy materials online or request a printed copy of the materials. We believe this allows us to provide our shareholders with the information they need, while lowering the costs of delivery and reducing the environmental impact of our annual general meeting of shareholders.
Receipt of Notice; Eligibility to Vote at Annual General Meeting of Shareholders. Our Board has fixed the close of business on February 12, 2018, as the record date for determining which of our shareholders are entitled to receive copies of this notice and the accompanying Proxy Statement or the Notice of Internet Availability of Proxy Materials. However, only holders of our ordinary shares and the holder of our non-economic voting preference shares (“Special Voting Shares” or “Special Preference Shares”) on April 4, 2018 will be entitled to vote at the 2018 AGM.
2
Table of Contents
Quorum. Representation at the 2018 AGM of shareholders entitled to vote, in person or by proxy or by representative, and holding among them at least a majority of all issued and outstanding ordinary shares and Special Voting Shares, treated as a single class, is required to constitute a quorum. Accordingly, it is important that your shares be represented at the 2018 AGM, either in person or by proxy.
Proxies. A registered shareholder, entitled to attend and vote at the 2018 AGM, is entitled to appoint one or more proxies to attend the meeting and vote on his or her behalf. A proxy need not also be a shareholder. Whether or not you plan to attend the meeting, please complete, date and sign the enclosed proxy card and return it in the enclosed envelope. A registered shareholder may revoke his or her proxy at any time prior to the time it is voted. Registered shareholders who are present at the meeting may (but are not required) to revoke their proxies and vote in person. The collection, use and disclosure by us and our agents, representatives and service providers of a shareholder’s, and their proxies’ or representatives’, personal data in connection with the 2018 AGM and related solicitation of proxies is governed by Article 102 of our Constitution.
If you are a beneficial owner of ordinary shares, you may vote by proxy over the Internet by following the instructions provided in the Notice of Internet Availability of Proxy Materials or, if you requested printed copies of the proxy materials by mail, you may vote by mail.
Holders of restricted exchangeable units in our subsidiary, Broadcom Cayman, L.P. (the “Partnership”), may instruct Computershare Trust Company, N.A. (“Computershare”), as the registered shareholder of all of the outstanding Special Voting Shares, how to vote their corresponding number of Special Voting Shares, in accordance with the Voting Trust Agreement, dated February 1, 2016, by and among Broadcom, the Partnership and Computershare as trustee.
For detailed information regarding eligibility to vote at, and voting procedures for, the 2018 AGM, please refer to “Voting Rights and Solicitation of Proxies”, starting on page 1 of the accompanying Proxy Statement.
FOR ADMISSION TO THE ANNUAL GENERAL MEETING, EACH SHAREHOLDER WILL BE ASKED TO PRESENT VALID PICTURE IDENTIFICATION, SUCH AS A DRIVER’S LICENSE OR PASSPORT, AND PROOF OF OWNERSHIP OF OUR ORDINARY SHARES AS OF THE MEETING DATE, SUCH AS A RECENT BROKERAGE STATEMENT, REFLECTING SHARE OWNERSHIP, OR A LEGAL PROXY TO VOTE SPECIAL VOTING SHARES FROM COMPUTERSHARE TRUST COMPANY N.A. PLEASE SEE PAGE 3 OF THE PROXY STATEMENT FOR MORE INFORMATION.
Important Notice Regarding the Internet Availability of Proxy Materials for the Annual Meeting of
Shareholders to be held on April 4, 2018:
The notice of meeting, Proxy Statement and annual report to shareholders are available at
http://investors.broadcom.com/phoenix.zhtml?c=203541&p=proxy.
By Order of the Board,

Hock E. Tan
Director, Chief Executive Officer and President
February 20, 2018
You should read the entire accompanying Proxy Statement carefully prior to voting.
3
Table of Contents
BROADCOM LIMITED
PROXY STATEMENT
FOR
2018 ANNUAL GENERAL MEETING OF SHAREHOLDERS
| Page | ||||
| i | ||||
| i | ||||
| 1 | ||||
| 5 | ||||
| 10 | ||||
| 17 | ||||
| 19 | ||||
| ORDINARY RESOLUTION TO AUTHORIZE SHARE ALLOTMENTS AND ISSUANCES |
21 | |||
| NON-BINDING, ADVISORY VOTE TO APPROVE EXECUTIVE COMPENSATION |
23 | |||
| 24 | ||||
| 26 | ||||
| 47 | ||||
| 48 | ||||
| 58 | ||||
| 60 | ||||
| SECURITY OWNERSHIP OF CERTAIN BENEFICIAL OWNERS, DIRECTORS AND EXECUTIVE OFFICERS |
61 | |||
| 65 | ||||
| 66 | ||||
| 66 | ||||
| 67 | ||||
| 68 | ||||
| 68 | ||||
| 69 | ||||
| A-1 | ||||
| B-1 | ||||
Table of Contents
ELECTRONIC DELIVERY OF OUR SHAREHOLDER COMMUNICATIONS
We strongly encourage our shareholders to conserve natural resources, as well as significantly reduce our printing and mailing costs, by signing up to receive shareholder communications via e-mail. With electronic delivery, we will notify you when our annual reports and proxy statements are available on the Internet. Electronic delivery can also help reduce the number of bulky documents in your personal files and eliminate duplicate mailings. To sign up for electronic delivery:
| 1. | If you are a registered shareholder (i.e., you hold your Broadcom ordinary shares in your own name through our transfer agent, Computershare Trust Company, N.A.), visit: www-us.computershare.com/investor/ or call (877) 373-6374 within the U.S., U.S. Territories and Canada, or +1 (781) 575-3100 outside the U.S., U.S. Territories and Canada. |
| 2. | If you are a beneficial holder (i.e., your ordinary shares are held by a broker, bank or other nominee), the voting instruction form provided by most brokers or banks will contain instructions for enrolling in electronic delivery. |
Your electronic delivery enrollment will be effective until you cancel it. If you have questions about electronic delivery, please call Computershare at the number above or your broker or bank.
INTERNET AVAILABILITY OF PROXY MATERIALS
Important Notice Regarding the Internet Availability of Proxy Materials for the
Annual Meeting of Shareholders to be held on April 4, 2018:
The notice of meeting, proxy statement and annual report to shareholders are available at
http://investors.broadcom.com/phoenix.zhtml?c=203541&p=proxy.
i
Table of Contents
PROXY STATEMENT
for the
2018 ANNUAL GENERAL MEETING
of
SHAREHOLDERS
of
BROADCOM LIMITED
To Be Held on Wednesday, April 4, 2018
11:00 a.m. (Pacific Time) at
1320 Ridder Park Drive, San Jose, California 95131, U.S.A.
We are making this proxy statement (the “Proxy Statement”) available in connection with the solicitation by the board of directors of Broadcom Limited (the “Board”) of proxies to be voted at the 2018 Annual General Meeting of Shareholders, or at any adjournments or postponements thereof (the “2018 AGM”), for the purposes set forth in the accompanying Notice of Annual General Meeting of Shareholders (the “Notice”).
Broadcom Limited is the successor to Avago Technologies Limited (“Avago”). Following Avago’s acquisition of Broadcom Corporation (“BRCM”) on February 1, 2016, Broadcom Limited became the ultimate parent holding company of Avago and BRCM. Information reported in this Proxy Statement for the period prior to this acquisition relates to our predecessor, Avago. Unless the context otherwise requires, references in this Proxy Statement to “Broadcom,” “the Company,” “our Company,” “we,” “our,” “us” and similar terms are to Broadcom Limited from and after the effective time of this acquisition.
Proxy Mailing. This Proxy Statement, the enclosed proxy card and the Notice were first made available on or about February 20, 2018 to our shareholders as of February 12, 2018.
Costs of Solicitation. We will bear the cost of soliciting proxies. We have retained D. F. King & Co., Inc., an independent proxy solicitation firm, to assist us in soliciting proxies for an estimated fee of $15,000 plus reimbursement of reasonable expenses. We and/or our agents, including certain of our officers, directors and employees, may solicit proxies by mail, telephone, e-mail, fax or in person. No additional compensation will be paid to our officers, directors or employees for such services. We will reimburse banks, brokerage firms and other custodians, nominees, trustees and fiduciaries for reasonable out-of-pocket expenses incurred by them in sending proxy materials to and soliciting proxies from beneficial holders of our ordinary shares or non-economic voting preference shares.
Our Registered Office. The mailing address of our registered office is 1 Yishun Avenue 7, Singapore 768923. Please note, however, that any communications from holders of our ordinary shares should be directed to the attention of our Chief Legal Officer at Broadcom Limited, 1320 Ridder Park Drive, San Jose, California 95131, U.S.A.
Financial Statements; Presentation. In accordance with the laws of Singapore, our Singapore statutory financial statements for our fiscal year ended October 29, 2017 are provided with this Proxy Statement. Except as otherwise stated herein, all monetary amounts in this Proxy Statement have been presented in U.S. dollars.
VOTING RIGHTS AND SOLICITATION OF PROXIES
We have two classes of shares outstanding, (i) our ordinary shares, no par value, and (ii) our non-economic voting preference shares, no par value (the “Special Voting Shares” or “Special Preference Shares”), with each class of shares having one vote per share.
All Special Voting Shares outstanding are held by Computershare Trust Company, N.A. (“Computershare”) pursuant to the Voting Trust Agreement, dated February 1, 2016 (the “Voting Trust”), among Broadcom, Broadcom Cayman L.P., a subsidiary of Broadcom (the “Partnership”), and Computershare, as trustee (the
1
Table of Contents
“Trustee”). The number of Special Voting Shares outstanding is equal to the number of outstanding restricted exchangeable units in the Partnership (the “Restricted Units”). As of February 1, 2017, the Restricted Units are exchangeable for our ordinary shares, on a one-for-one basis, which obligation we may elect to settle either in cash or in ordinary shares, at our option.
Ordinary shares and Special Voting Shares issued and outstanding on April 4, 2018 are entitled to be voted at the 2018 AGM, voting together as a single class, on each matter being put before the meeting.
If you are a holder of Restricted Units, you are entitled to direct the Trustee to vote one Special Voting Share for each Restricted Unit that you hold, pursuant to the terms of the Voting Trust.
Record Date. The close of business on February 12, 2018, is the record date for holders of our ordinary shares and Special Voting Shares entitled to receive notice of the 2018 AGM (the “Record Date”). As of the Record Date, we had 410,487,054 ordinary shares and 22,097,111 Special Voting Shares issued and outstanding, and there were 22,097,111 Restricted Units in the Partnership issued and outstanding.
Voting Instructions. Unless otherwise noted below, voting instructions for all ordinary shares and Special Voting Shares must be received by 9:00 a.m. (Pacific Time) on April 2, 2018.
Ordinary Shares
If your ordinary shares are registered directly in your name with our transfer agent, Computershare, you are the “registered shareholder” with respect to those shares. If your shares are held by a brokerage firm, bank, trustee or other nominee, you are the “beneficial owner” of shares held in “street name”.
Registered Holders
A registered shareholder entitled to attend and vote at the 2018 AGM may vote in person at the meeting or by completing and returning the enclosed proxy card. A registered shareholder has the right to revoke his or her proxy at any time prior to voting at the 2018 AGM by:
| (i) | submitting a subsequently dated proxy, which, if not delivered in person at the meeting, must be received by us at c/o Proxy Services, c/o Computershare Investor Services, P.O. Box 43101, Providence, RI 02940-5067, no later than 9:00 a.m. (Pacific Time) on April 2, 2018; or |
| (ii) | by attending the meeting and voting in person. |
If you are an institution holding your shares in a participant account with The Depository Trust Company (“DTC”), vote your shares through DTC’s procedures. You may not vote your shares in person at the 2018 AGM unless you obtain a legal proxy from DTC.
Beneficial Owners
If you are a beneficial owner of shares, you have the right to instruct the broker, bank or other nominee that holds your shares on how to vote them. Your broker, bank or nominee will send you a voting instruction form for you to use to direct how your shares should be voted. Your shares must be voted by such time as may be specified by your broker, bank or nominee, which may be earlier than 9:00 a.m. (Pacific Time) on April 2, 2018. If you wish to change or revoke your voting instructions, you must contact your broker, bank or other nominee holding your ordinary shares and follow their instructions. You may not vote your shares in person at the 2018 AGM unless you obtain a legal proxy from your broker, bank or other nominee giving you the right to vote the shares.
If you hold ordinary shares as, or through, a participant in DTC, we understand that in order for your vote to be counted at the 2018 AGM, you must have been a holder of ordinary shares as at, and with effect from the Record Date. If you become a beneficial owner of ordinary shares after the Record Date but before the meeting date and you wish to vote your shares at the 2018 AGM, you must become a registered shareholder prior to the
2
Table of Contents
meeting date and (i) request a proxy card and return it to Computershare Investor Services in accordance with the procedures noted above or (ii) attend the meeting and vote in person. Please contact your broker, bank or other nominee holding your shares if you wish to become a registered shareholder.
Special Voting Shares
Only the Trustee may vote Special Voting Shares, either by proxy or in person at the 2018 AGM. If you hold Restricted Units, you must instruct the Trustee on how to vote your corresponding number of Special Voting Shares. The Trustee will inform you as to how such voting instructions are to be given to the Trustee, including the date and time by which such instructions must be received by the Trustee. If you wish to change or revoke your voting instructions, you must contact the Trustee and follow the Trustee’s instructions. If you do not provide instructions to the Trustee on how to vote the Special Voting Shares corresponding to your Restricted Units, those shares will not be voted at the 2018 AGM. You may not vote at or attend the 2018 AGM unless you obtain a legal proxy from the Trustee, giving you the right to vote your corresponding number of Special Voting Shares.
If you exchange any Restricted Units after the Record Date but prior to the 2018 AGM, a corresponding number of Special Voting Shares will be cancelled, and the related voting rights under the Voting Trust with respect to those Restricted Units will be terminated and will not be exercised at the 2018 AGM. If you receive ordinary shares upon exchange of your Restricted Units and you wish to vote those shares at the 2018 AGM, you must become a registered shareholder prior to the meeting date and (i) request a proxy card and return it to Computershare Investor Services in accordance with the procedures noted above or (ii) attend the meeting and vote in person. Please contact your broker, bank or other nominee holding your shares if you wish to become a registered shareholder.
Meeting Attendance and Admission. If you are a registered shareholder on April 4, 2018, you are entitled to attend the 2018 AGM. If you are a beneficial owner of shares held in “street name”, in order to attend the 2018 AGM you will need to bring a letter or recent account statement from that broker, bank or other nominee that confirms you are the beneficial owner of those shares, as well as a picture identification, such as a valid driver’s license or passport, for purposes of personal identification.
Holders of Restricted Units wishing to attend the 2018 AGM must bring a legal proxy from the Trustee in respect of the corresponding number of Special Voting Shares, as well as picture identification, such as a valid driver’s license or passport, for purposes of personal identification.
Quorum. Representation at the 2018 AGM of shareholders entitled to vote, in person or by proxy or representative, and holding among them at least a majority of all issued and outstanding ordinary shares and Special Voting Shares, treated as a single class, is required to constitute a quorum.
Proxies. Ordinary shares and Special Voting Shares represented by proxies that are properly executed and received by us in accordance with the instructions set forth in the Notice will be voted by the individuals named therein—Hock E. Tan, Thomas H. Krause, Jr. or Mark D. Brazeal or any of them, with full power of substitution (together, the “Proxy Holders”)—at the 2018 AGM in accordance with the shareholders’ instructions set forth in the proxy. A Proxy Holder need not also be a shareholder. The collection, use and disclosure by us and our agents, representatives and service providers of a shareholder’s, and their proxies’ or representatives’, personal data in connection with the 2018 AGM and related solicitation of proxies is governed by Article 102 of our Constitution.
If you sign and return your proxy but do not indicate how your ordinary shares are to be voted, then shares represented by proxies will be voted by the Proxy Holders in accordance with our Board’s recommendations as follows:
| • | FOR the election of each of our Board nominees named in Proposals 1(a) to 1(j); and |
| • | FOR each of Proposals 2 to 4. |
3
Table of Contents
Management does not know of any matters to be presented at the 2018 AGM other than those set forth in this Proxy Statement and in the accompanying Notice, nor have we received notice of any matter by the deadline prescribed by Securities and Exchange Commission (“SEC”) Rule 14a-4(c). Without limiting our ability to apply the advance notice provisions in our Constitution with respect to the procedures that must be followed for a matter to be properly presented at an annual general meeting of shareholders, if other matters should properly come before the 2018 AGM, the Proxy Holders will vote on such matters in accordance with their best judgment.
Required Vote. Holders of ordinary shares and Special Voting Shares will vote together as a single class for each of the proposals to be voted upon at the 2018 AGM. The vote required for each proposal is as follows:
| Proposals 1(a) to (j) (election of directors): |
Majority of votes cast | |
| Proposal 2 (re-appointment of PricewaterhouseCoopers LLP): | Majority of votes cast | |
| Proposal 3 (authorization of share allotments and issuances): | Majority of votes cast | |
| Proposal 4 (advisory vote on executive compensation): | Majority of votes cast | |
Proposal 4 is being proposed to shareholders as required pursuant to Section 14A of the Securities Exchange Act of 1934, as amended (the “Exchange Act”). Shareholders’ vote on Proposal 4 is advisory and non-binding in nature, will have no legal effect and will not be enforceable against us or our Board.
Abstentions and Broker Non-Votes. Abstentions and “broker non-votes” are counted in determining whether a quorum is present at the 2018 AGM, but are not counted in, and have no effect on, determining whether a proposal has been approved. A “broker non-vote” occurs when a broker, bank or other nominee holding ordinary shares on behalf of a beneficial owner cannot vote those shares because it (1) has not received voting instructions from such beneficial owner and (2) lacks discretionary voting power to vote those shares. If you are a beneficial owner of ordinary shares, your broker, bank or other nominee is entitled to vote your shares on “routine” matters, even if it does not receive voting instructions from you. The routine matters to be voted on at the 2018 AGM are Proposals 2 and 3. Without instructions from the beneficial owner, a broker, bank or other nominee will not be entitled to vote shares held for a beneficial owner on Proposals 1(a) to (j) and 4, which are non-routine matters.
Voting Procedures and Tabulation. We have appointed a representative of Computershare as the inspector of elections of the 2018 AGM. The inspector of elections will determine the number of ordinary shares and Special Voting Shares outstanding and represented at the 2018 AGM and the validity of proxies and ballots, and will count and tabulate all votes. The determination of the inspector as to the validity of proxies will be final and binding.
4
Table of Contents
General
Pursuant to the Singapore Companies Act, Chapter 50 (the “Singapore Companies Act”) and our Constitution, our Board must have at least one director who ordinarily resides in Singapore. Our Constitution also stipulates that our Board consist of no more than 13 directors. Our Board currently consists of 10 members.
Director Nominees
Each director is elected annually at the annual general meeting of shareholders to hold office until the next annual general meeting of shareholders. Upon the recommendation of the Nominating and Corporate Governance Committee, our Board has nominated the 10 individuals below for election as directors, all of whom are currently directors. Our Board expects that each of the nominees listed below will be available to serve as a director. Shareholders may not vote their proxies for a greater number of persons than the number of nominees named below.
In considering whether the director nominees have the experience, qualifications, attributes and skills, taken as a whole, to serve as directors of Broadcom, in light of our business and structure, the Nominating and Corporate Governance Committee and our Board focused primarily on the information discussed in each of the director nominee’s biographical information set forth below. Our Board believes that each nominee has the relevant experience, personal and professional integrity, the ability to make independent, analytical inquiries, experience with and understanding of our business and business environment, and the willingness and ability to devote adequate time to Board duties. We also believe that the director nominees together have the skills and experience to form a board that is well suited to oversee our Company.
The following table sets forth certain information concerning the nominees for directors of Broadcom as of February 12, 2018.
| (a) Hock E. Tan Age 66 President, Chief Executive Officer and Director since March 2006 |
Mr. Tan has served as our President and Chief Executive Officer since March 2006. From September 2005 to January 2008, he served as Chairman of the board of directors of Integrated Device Technology, Inc. (“IDT”). Prior to becoming chairman of IDT, Mr. Tan was the President and Chief Executive Officer of Integrated Circuit Systems, Inc. (“ICS”), from June 1999 to September 2005. Prior to ICS, Mr. Tan was Vice President of Finance with Commodore International, Ltd. from 1992 to 1994, and previously held senior management positions with PepsiCo, Inc. and General Motors Corporation. Mr. Tan served as managing director of Pacven Investment, Ltd., a venture capital fund in Singapore from 1988 to 1992, and served as managing director for Hume Industries Ltd. in Malaysia from 1983 to 1988. Mr. Tan’s qualifications to serve on our Board include his role as our Chief Executive Officer, his extensive career in the technology industry in general and in the semiconductor industry in particular, including service as the chairman of the board of directors of a publicly-traded semiconductor company, and his extensive knowledge of our business developed over the course of his career at our Company. | |
| (b) James V. Diller Age 82 Chairman of the Board Director since April 2006 |
Mr. Diller was a founder of PMC-Sierra, Inc., serving as PMC’s Chief Executive Officer from 1983 to July 1997 and President from 1983 to July 1993. Mr. Diller also served as a director of PMC since its formation in 1983 until December 2013. Mr. Diller was Chairman of PMC’s board of directors from July 1993 until February 2000, and was its Vice Chairman from February 2000 until December 2013. Mr. Diller served as a director of Intersil Corporation from May 2002 to April 2015 and as its interim President | |
5
Table of Contents
| and Chief Executive Officer from December 2012 to March 2013. Mr. Diller’s qualifications to serve on our Board include his more than 50 years of experience in semiconductor company management and oversight in positions such as Chief Executive Officer, President and General Manager and chairman of the board of directors, and his experience as a product development engineer. | ||
| (c) Gayla J. Delly Age 58 Director since December 2017 |
Ms. Delly served as Chief Executive Officer of Benchmark Electronics Inc. (“Benchmark”), a company that provides contract manufacturing, design, engineering, test and distribution services to manufacturers of computers, medical devices, telecommunications equipment and industrial control and test instruments, from January 2012 to September 2016, and served as a director from 2011 to September 2016. At Benchmark, she previously served as President from 2006 to December 2011, Executive Vice President and Chief Financial Officer from 2001 to 2006, and as Corporate Controller and Treasurer from 1995 to 2001. Ms. Delly is a certified public accountant and was a senior audit manager at KPMG before joining Benchmark. Ms. Delly serves as an independent director of Flowserve Corporation, a public company listed on the New York Stock Exchange, and serves as chair of Flowserve’s audit committee and a member of its corporate governance and nominating committee. Ms. Delly’s qualifications to serve on our Board include her leadership experience in senior executive and financial management positions, her international manufacturing experience, her education and experience as an accounting professional, and her experience serving as a director of other public companies. | |
| (d) Lewis C. Eggebrecht Age 74 Director since April 2014 |
Mr. Eggebrecht served as Vice President and Chief Scientist of ICS from 1998 through May 2003. Mr. Eggebrecht has held various other technical and executive management positions for more than 30 years, including as Chief Multimedia Architect at Phillips Semiconductor Manufacturing Inc., as Graphics Architect at S3 Graphics Limited, and Vice President of Research and Development at Commodore International Limited, and as a small systems architect for 15 years at International Business Machines Corporation (“IBM”). While at IBM, Mr. Eggebrecht was the Chief Architect and Design Team Leader on the original IBM PC. He has also previously served on the board of directors of a number of public and private companies. Mr. Eggebrecht holds six patents on the IBM PC and has authored two books on PC architecture, over 20 IBM Technical Disclosure Bulletins and trade press articles. Mr. Eggebrecht’s qualifications to serve on our Board include his extensive experience in personal computer architecture, integrated circuit design and networking, wireless and timing technologies, as well as his experience serving on the board of directors of other public technology companies. | |
| (e) Kenneth Y. Hao Age 49 Director since September 2005 |
Mr. Hao is a Managing Partner and Managing Director of Silver Lake Partners (“Silver Lake”). Prior to joining Silver Lake in 2000, Mr. Hao was an investment banker with Hambrecht & Quist for 10 years, most recently serving as a Managing Director in the Technology Investment Banking group. Mr. Hao has spent his career investing in and advising technology companies. Mr. Hao also serves or has served on the board of directors of a number of Silver Lake portfolio companies, including Symantec Corporation, where he also serves on its compensation and leadership development | |
6
Table of Contents
| committee. Mr. Hao’s qualifications to serve on our Board include his depth of experience in financial and investment matters and his familiarity with a broad range of companies in technology industries. | ||
| (f) Eddy W. Hartenstein Age 67 Director since February 2016 |
Mr. Hartenstein was the publisher and Chief Executive Officer of the Los Angeles Times from August 2008 to August 2014. In addition, he served as co-President of the Tribune Company from October 2010 to May 2011 and as President and Chief Executive Officer from May 2011 to January 2013. Previously, Mr. Hartenstein was Vice Chairman and a member of the board of directors of The DIRECTV Group Inc. (formerly Hughes Electronics Corp.), from December 2003 until his retirement in December 2004. He served as Chairman and Chief Executive Officer of DIRECTV Inc. from late 2001 through 2004 and as President from its inception in 1990 to 2001. He currently serves as a director of tronc, Inc. (formerly known as Tribune Publishing Company); as lead independent director of the board of SIRIUS XM Holdings Inc., where he also serves on the audit committee; and as a director of TiVo Corporation, where he also serves on the compensation and strategic committees. Mr. Hartenstein also served as a director of BRCM from June 2008 through January 2016; SanDisk Corporation from 2005 to May 2016; Rovi Corporation from September 2015 until its acquisition by TiVo in September 2016; and as a director of Yahoo, Inc. from April 2016 to June 2017. Mr. Hartenstein’s qualifications to serve on our Board include his business leadership and extensive senior management experience, including successfully creating and entering new markets, as well as his considerable public company directorial and governance experience. | |
| (g) Check Kian Low Age 58 Director since December 2016 |
Mr. Low was one of the founding partners and is a director of NewSmith Capital Partners LLP, an independent partnership providing corporate finance advice and investment management services, for which he manages the Asia Pacific offices. He is also an owner, and has served as a director of, Cluny Capital Limited (BVI) since February 2007. Prior to founding NewSmith in 2003, Mr. Low served as Senior Vice-President and Member of the Executive Management Committee of Merrill Lynch & Co., as well as its Chairman for the Asia Pacific Region, where he held various positions since the start of his employment with that firm in October 1995. Mr. Low serves as the lead independent director of Singapore Telecommunications Limited, a public company listed on the Singapore Exchange Securities Trading Limited (“SGX-ST”), where he also serves on the corporate governance & nominations and finance & investment committees. He also serves on the board of directors of a number of private companies and is a trustee of the Singapore London School of Economics Trust and the Nanyang Technological University. Mr. Low previously served as a director of the following public companies listed on the SGX-ST: Neptune Orient Lines Limited from April 2011 to June 2016, Fibrechem Technologies Limited from January 2005 to September 2012 and Singapore Exchange Limited from July 2000 to October 2011. Mr. Low’s qualifications to serve on our Board include his considerable public company directorial experience with Singapore-based companies, as well as his considerable executive management and financial and investment experience. | |
7
Table of Contents
| (h) Donald Macleod Age 69 Director since November 2007 |
Mr. Macleod served as President and Chief Executive Officer of National Semiconductor Corporation (“NSC”) from November 2009 to September 2011, when NSC was acquired by Texas Instruments Incorporated. He served as its President and Chief Operating Officer from the beginning of 2005 until November 2009, and before that he held various other executive and senior management positions at the company including Executive Vice President and Chief Operating Officer and Executive Vice President, Finance and Chief Financial Officer. Mr. Macleod serves as a director of Knowles Corporation, where he also serves on its nominating & governance and compensation committees. Mr. Macleod also serves on the board of directors of a number of private companies and business organizations. Mr. Macleod served as the Chairman of the board of directors of NSC from May 2010 to September 2011 and as the Chairman of the board of directors of Intersil Corporation from December 2012 until its acquisition in February 2017 by Renesas Electronics Corporation. Mr. Macleod’s qualifications to serve on our Board include his more than 30 years of experience in senior management and executive positions in the semiconductor industry, both in Europe and in the United States, and his accounting and finance qualifications and experience. | |
| (i) Peter J. Marks Age 64 Director since December 2013 |
Mr. Marks is the Chief Executive Officer of Executive Consultant, which he founded in 2013, where he advises business leaders on leadership. Prior to this, Mr. Marks served in various senior management roles with Robert Bosch GmbH, which he originally joined in 1977 and where he remained until December 2011. Most recently, from 2006 until his departure in December 2011, Mr. Marks served as Chairman, President and Chief Executive Officer of Robert Bosch LLC, where he managed all of its business sectors in the Americas, and as a member of Board of Management of Robert Bosch GmbH, with responsibility for worldwide coordination for manufacturing and capital investment. Prior to that he also served as a senior executive of Robert Bosch GmbH responsible for various divisions: automotive electronics, semiconductors, body electronics/electric drivers and energy systems. Mr. Marks’ qualifications to serve on our Board include his extensive leadership experience in senior management and executive positions with a large, multinational organization, as well as his familiarity with operational and strategic issues relating to technology focused companies with international operations. | |
| (j) Henry Samueli, Ph.D. Age 63 Chief Technical Officer and Director since February 2016 |
Dr. Samueli has served as our Chief Technical Officer since February 1, 2016. He was a co-founder of BRCM and served as its Chief Technical Officer from its inception in 1991 to May 2008 and from December 2009 through January 2016. Dr. Samueli also served as BRCM’s Vice President of Research and Development from 1991 to May 2003 and as a technology advisor from May 2008 to December 2009. Dr. Samueli has also been a Professor in the Electrical Engineering Department at the University of California, Los Angeles since 1985 (on leave of absence since 1995) and a Distinguished Adjunct Professor in the Electrical Engineering and Computer Science Department of the University of California, Irvine since 2003. Prior to BRCM, Dr. Samueli was the Chief Scientist and one of the founders of PairGain Technologies. From 1980 until 1985, he was employed in various engineering management positions in the Electronics and Technology Division of TRW, Inc. Dr. Samueli is a Fellow of the Institute of Electrical and | |
8
Table of Contents
| Electronics Engineers (IEEE), a Fellow of the American Academy of Arts and Sciences, and a Member of the National Academy of Engineering. Dr. Samueli served as Chairman or Co-Chairman of the board of directors of BRCM from 1991 to May 2008 and from May 2011 to January 2016. He received a B.S., M.S. and Ph.D. in Electrical Engineering from the University of California, Los Angeles. He is a named inventor in 75 U.S. patents. Dr. Samueli’s qualifications to serve on our Board include his over 35 years of advanced engineering and leadership experience in the fields of communications systems and semiconductors. In addition, his co-founding of BRCM and his service as its Chief Technical Officer provide unique insights into, and understanding of, our operations, technologies and industry. |
Mr. Low is our Singapore resident director. Due to the Singapore Companies Act requirement that we have at least one director who ordinarily resides in Singapore in office at all times, in the event that Mr. Low is not elected at the 2018 AGM, he will continue to serve as a director after the 2018 AGM until his qualifying successor (i.e., a Singapore resident director) is appointed.
In the event that a director resigns from our Board or otherwise becomes unwilling or unable to serve after the mailing of this Proxy Statement but before the 2018 AGM, our intention would be to make a public announcement of such resignation and either reduce the size of our Board or appoint a substitute nominee in accordance with our Constitution. If we reduce the size of our Board, this would reduce the number of director nominees to be elected at the 2018 AGM. Votes received in respect of such director would not be counted in such circumstances. In the event that we instead propose to elect a different director nominee at the 2018 AGM to fill any such vacancy, it is intended that the shares represented by the proxy will be voted for such substitute nominee as may be designated by our Board.
There are no family relationships between any of our directors or executive officers.
Our Board recommends a vote FOR the election of each of the director nominees in Proposals 1(a) to (j) listed above to our Board.
9
Table of Contents
Board of Directors
Our Constitution gives our Board general powers to manage our business. Our Board oversees and provides policy guidance on our strategic and business planning processes, oversees the conduct of our business by senior management and is principally responsible for the succession planning for our key executives, including our President and Chief Executive Officer.
Our Board held 6 meetings during the fiscal year ended October 29, 2017 (“Fiscal Year 2017”). During Fiscal Year 2017, each director attended at least 75% of the aggregate number of meetings of our Board and all committees of our Board on which he or she served, counting only those meetings during which such person was a member of our Board and of the relevant committee(s). Our independent directors met at regularly scheduled executive sessions without management participation.
Our Board has adopted a policy that encourages each director to attend the annual general meetings of our shareholders. All of our directors then serving attended our 2017 Annual General Meeting of Shareholders (“2017 AGM”).
Director Independence
Our Board annually reviews the independence of each director and nominee for director and considers whether any director or nominee for director has a material relationship with us that could compromise his or her ability to exercise independent judgment in carrying out his or her responsibilities. Our Board has made the determination that transactions or relationships between us and an entity where a director or nominee for director serves as a non-employee director and/or is the beneficial owner, directly or indirectly of less than 10% of such entity, or where a director or nominee for director serves on a non-employee advisory board of, or in a non-employee advisory capacity to, such an entity, are presumed immaterial for the purposes of assessing a director’s independence.
In reviewing the directors’ independence, with respect to Mr. Hao, our Board considered that (i) from time to time, representatives of Silver Lake have provided advice and assistance to us in connection with obtaining debt financing for acquisition transactions, for which no payment is made and (ii) Silver Lake offered to provide up to $5 billion in convertible debt financing in connection with our proposed acquisition of Qualcomm Incorporated (“Qualcomm”). Our Board also considered our commercial relationships with Silver Lake portfolio companies (a) of which Mr. Hao serves as a director and/or (b) in which Silver Lake has an ownership interest of 10% or more (and in each such case, Mr. Hao’s indirect personal interest is less than 1%). Transactions between each of these companies and Broadcom represented less than 5% of Broadcom’s and the other entity’s revenue in their respective 2016 and 2017 fiscal years.
As a result of its review, our Board has determined that Messrs. Diller, Eggebrecht, Hao, Hartenstein, Low, Macleod and Marks and Ms. Delly, representing eight of our 10 director nominees are currently “independent directors” as defined under the applicable rules and regulations of the SEC and the Nasdaq Stock Market (“Nasdaq”). In addition, our Board has determined that each of the members of:
| • | the Audit Committee meets the additional requirements for financial literacy, and satisfies the heightened independence standards established by the SEC and Nasdaq for membership of that committee; and |
| • | the Compensation Committee satisfies the heightened independence standards established by the SEC and Nasdaq for membership of that committee, and is a non-employee director within the meaning of Section 16 of the Exchange Act. |
10
Table of Contents
Board Committees
Our Board has an Audit Committee, a Compensation Committee, a Nominating and Corporate Governance Committee and an Executive Committee. Each committee can engage outside experts, advisors and counsel to assist the committee in its work. The table below provides the membership for each of the committees as of February 12, 2018, and the number of meetings held by each committee during Fiscal Year 2017.
| Director | Audit Committee |
Compensation Committee |
Nominating and Corporate Governance Committee |
Executive Committee | ||||||||||||||||
| James V. Diller |
X | X | (C) | X | (C) | |||||||||||||||
| Gayla J. Delly(1) |
X | X | ||||||||||||||||||
| Lewis C. Eggebrecht |
X | |||||||||||||||||||
| Eddy W. Hartenstein |
X | X | (C) | X | ||||||||||||||||
| Check Kian Low |
X | |||||||||||||||||||
| Donald Macleod |
X | (C) | X | X | ||||||||||||||||
| Peter J. Marks |
X | X | ||||||||||||||||||
| Hock E. Tan |
X | |||||||||||||||||||
| Number of meetings in Fiscal Year 2017 |
8 | 6 | 4 | 1 | ||||||||||||||||
| (C) | Denotes the Chairperson of the committee. |
| (1) | Ms. Delly was appointed to the Audit Committee and the Nominating and Corporate Governance Committee in December 2017, in connection with her appointment to the Board. |
The functions performed by these committees, which are set forth in more detail in their respective charters, are summarized below. Each of the Audit Committee, the Compensation Committee and the Nominating and Corporate Governance Committee operates under a charter that satisfies the applicable standards of the SEC and Nasdaq. The charters for all four committees are available in the “Investor Center—Corporate Governance—Documents” section of our website (http://investors.broadcom.com/phoenix.zhtml?c=203541&p=irol-govhighlights). Shareholders may also request a copy in print from: Investor Relations, Broadcom Limited, 1320 Ridder Park Drive, San Jose, California 95131, U.S.A.
Audit Committee
The Audit Committee is responsible for assisting our Board with its oversight responsibilities regarding the following:
| • | the quality and integrity of our financial statements and internal controls; |
| • | the appointment, compensation, retention, qualifications and independence of our independent registered public accounting firm; |
| • | the performance of our internal audit function and independent registered public accounting firm; |
| • | our compliance with legal and regulatory requirements; and |
| • | related party transactions. |
Our Board has determined that Ms. Delly and Mr. Macleod are each an audit committee financial expert under applicable SEC rules, and has the requisite financial sophistication required by applicable Nasdaq rules.
11
Table of Contents
Compensation Committee
The Compensation Committee is responsible for:
| • | determining our executives’ base compensation and incentive compensation (other than that of our Chief Executive Officer); |
| • | providing input and recommendations to the independent members of our Board (the “Independent Directors”) regarding our Chief Executive Officer’s compensation; |
| • | designing (in consultation with management or our Board) and evaluating our compensation plans, policies and programs, and recommending same to our Board for approval; and |
| • | administering our equity-based plans and approving the terms of equity-based grants pursuant to those plans. |
To the extent permitted by applicable law, our Constitution and the Nasdaq rules, the Compensation Committee may delegate its responsibilities to a subcommittee or to individual directors or executive officers, and may authorize members of our Human Resources department to carry out certain administrative duties regarding our compensation programs.
For information on the processes and procedures followed by the Compensation Committee and our Board, and the role of its compensation consultant and our Chief Executive Officer, in the consideration and determination of executive compensation, see the “Compensation Discussion and Analysis” section beginning on page 26 of this Proxy Statement.
Nominating and Corporate Governance Committee
The Nominating and Corporate Governance Committee is responsible for:
| • | identifying and recommending to our Board qualified candidates to become directors; |
| • | overseeing the annual evaluation of our Board and its committees; and |
| • | taking a leadership role in shaping our corporate governance policies and procedures. |
The Nominating and Corporate Governance Committee will consider candidates for director who are recommended by its members, by other Board members and members of our management, as well as those identified by any third-party search firms retained by it to assist in identifying and evaluating possible candidates. The Nominating and Corporate Governance Committee will also consider recommendations for director candidates submitted by our shareholders if they meet the specific criteria set forth under “Shareholder Nominations to Our Board of Directors” below. The Nominating and Corporate Governance Committee will evaluate and recommend to our Board qualified candidates for election, re-election or appointment to our Board, as applicable.
When evaluating director candidates, the Nominating and Corporate Governance Committee seeks to ensure that our Board has the requisite skills, experience and expertise and that its members consist of persons with appropriately diverse and independent backgrounds. The Nominating and Corporate Governance Committee will consider all aspects of a candidate’s qualifications in the context of the needs of Broadcom, including: independence from management; personal and professional integrity, ethics and values; experience and expertise as an officer in corporate management; experience in our industry and international business and familiarity with Broadcom; experience as a board member of another publicly traded company; practical and mature business judgment; current Board size and composition and the extent to which a candidate would fill a present need on our Board; and the other ongoing commitments and obligations of the candidate. The Nominating and Corporate Governance Committee also routinely considers diversity as part of their deliberations, including with respect to the appointment of Ms. Delly to the Board, which is discussed below. However, the Nominating and Corporate Governance Committee does not have any minimum criteria for director candidates. Consideration of new director candidates will typically involve a series of internal discussions, review of information concerning candidates and interviews with selected candidates. Ms. Delly,
12
Table of Contents
who joined our Board in December 2017, was first suggested as a prospective Board candidate by a third party search firm retained by the Nominating and Corporate Governance Committee. Ms. Delly was then evaluated by the Nominating and Corporate Governance Committee according to its practice described above.
Executive Committee
The Executive Committee has the authority, among other things and subject to specified limitations, to review and approve on behalf of our Board:
| • | investments, acquisitions, dispositions and capital expenditures; |
| • | new or incremental debt financings or borrowings, or amendments thereto, or refinancings thereof, including convertible debt; and |
| • | treasury, cash management and other banking matters. |
In addition, the Executive Committee may review and provide recommendations to our Board on matters requiring full Board approval, including:
| • | business opportunities, strategies and proposals, and other strategic matters; |
| • | business plans, annual budgets, targets, operational plans, capital structure and dividend policy; |
| • | proposed transactions that exceed the Executive Committee’s approval thresholds; and |
| • | efficient organization and management structure of our Company. |
Board Leadership Structure and Role in Risk Management
Our Board believes that Broadcom and its shareholders are best served by a Board leadership structure in which the roles of the Chief Executive Officer and the Chairman of the Board are held by different individuals. Under this structure our Chief Executive Officer is generally responsible for setting the strategic direction of our Company and for the day-to-day leadership of our operations. The Chairman provides strong independent leadership to assist our Board in fulfilling its role of overseeing the management of Broadcom and our risk management practices, approves the agenda for meetings of our Board and presides over Board meetings and over the meetings of our independent directors in executive session. Currently, Mr. Tan serves as our President and Chief Executive Officer and Mr. Diller, an independent director, serves as Chairman of the Board.
Our Board is responsible for overseeing the management of risks facing our Company, both as a whole and through its committees. Our Board regularly reviews and discusses with management information regarding our operations, liquidity and credit, as well as the risks associated with each. The Audit Committee reviews and discusses with management significant financial, legal and regulatory risks and the steps management takes to monitor, control and report such exposures. It also oversees our periodic enterprise-wide risk evaluations conducted by our management. The Compensation Committee oversees management of risks relating to our compensation plans and programs for executives and employees in general. The Nominating and Corporate Governance Committee oversees management of risks associated with corporate governance, director independence and conflicts of interest. Additional details regarding the responsibilities of each of these committees are discussed in more detail above, under “Board Committees”. The committees report regularly to our Board on matters relating to the specific areas of risk the committees oversee. Members of management report, at least annually, on our risk management policies and practices to the relevant committees and to the full Board.
Compensation Committee Interlocks and Insider Participation
The current members of the Compensation Committee, Messrs. Diller, Eggebrecht, Hartenstein and Macleod, are not, and have never been, officers or employees of Broadcom. During Fiscal Year 2017, none of our executive officers served on the board of directors or compensation committee of any other entity that has one or more executive officers serving as a member of our Board or the Compensation Committee.
13
Table of Contents
Risk Assessment and Compensation Practices
Our management conducted its annual review of our compensation policies and practices for our employees, as they relate to our risk management, in January 2018, and reported their findings to the Compensation Committee. Management has concluded that our compensation policies and practices (described in more detail under “Compensation Discussion and Analysis” and “Executive Compensation” below) balance short- and long-term goals and awards, as well as the mix of the cash and equity components. Based upon this review, management believes the elements of our compensation programs do not encourage unnecessary or excessive risk-taking, and are not reasonably likely to have a material adverse effect on our Company in the future.
Shareholder Communications With Our Board
Holders of our ordinary shares may communicate with our Board at the following address:
The Board of Directors
Broadcom Limited
c/o Chief Legal Officer
1320 Ridder Park Drive
San Jose, California 95131
U.S.A.
Communications are distributed to our Board or to any individual director, as appropriate, depending on the facts and circumstances outlined in the communication. Communications that are unduly hostile, threatening, illegal or similarly unsuitable will be excluded, but will be made available to any director upon request.
Shareholder Nominations to Our Board of Directors
Under our Constitution, no person is eligible for appointment as a director at any general meeting of shareholders (including an incumbent director), without the recommendation of our Board for election. In addition, a person may be appointed as director if such person is proposed by (a) a shareholder or shareholders who in aggregate hold(s) more than 50% of the total number of our issued and paid-up ordinary shares (excluding treasury shares), which shareholder or shareholders, not less than 10 days before, or (b) a shareholder or shareholders who in aggregate hold(s) more than five percent of the total number of our issued and paid-up ordinary shares (excluding treasury shares), which shareholder or shareholders, not less than 120 days before, the date of the notice provided to shareholders in connection with the general meeting lodges at our registered office in Singapore a written notice signed by such shareholder or shareholders (other than the person to be proposed for appointment), who (i) are qualified to attend and vote at the meeting for which such notice is given, and (ii) have held ordinary shares representing the prescribed threshold in (a) or (b) above, for a continuous period of at least one year prior to the date on which such notice is given. Such a notice must also include the consent of the person nominated to serve as a director, if elected, as well as the information specified below.
Holders of our ordinary shares can recommend qualified candidates for our Board by submitting recommendations to our Chief Legal Officer Broadcom Limited, 1320 Ridder Park Drive, San Jose, California 95131, U.S.A. Submissions that include the following requirements will be forwarded to our Nominating and Corporate Governance Committee for review and consideration:
| • | the candidate’s name and personal and business addresses; |
| • | a resume or curriculum vitae describing the candidate’s principal occupation, business experience, education and other relevant qualifications, and an explanation that clearly indicates how he or she has the necessary experience, skills and qualifications to serve as a director; |
14
Table of Contents
| • | a description of any relationship, agreement or understanding between the candidate or any affiliate of the candidate and any customer, supplier or competitor of our, or any other relationship or understanding that might be relevant to a determination of the independence of the candidate as director, or affect the independent status of our independent registered public accounting firm; |
| • | a statement as to whether or not, during the past 10 years, the candidate has been convicted in a criminal proceeding (excluding minor traffic violations) and, if so, the dates, the nature of the conviction, the name or other disposition of the case, and whether the individual has been involved in any other legal proceeding during the past 10 years, and any other information that would be required under SEC rules to be included in a proxy statement soliciting proxies for the election of such candidate as a director; |
| • | a signed statement from the candidate that he or she consents to serve on our Board if elected and that he or she is not disqualified under the Singapore Companies Act from acting as a director; and |
| • | a statement from the person submitting the candidate that he or she is the registered holder of ordinary shares, or if the shareholder is not the registered holder, a written statement from the broker, bank or other nominee holder of the ordinary shares verifying that at the time the shareholder submitted the candidate that he or she was a beneficial owner of ordinary shares. |
Qualified director candidates suggested by holders of our ordinary shares will be evaluated in the same manner as any other candidate for election to our Board (other than those standing for re-election).
Code of Ethics and Business Conduct
Our Board has adopted a Code of Ethics and Business Conduct that is applicable to all members of our Board, executive officers and employees, including our Chief Executive Officer, Chief Financial Officer and principal accounting officer. A copy of the Code of Ethics and Business Conduct is available in the “Investor Center—Corporate Governance—Documents” section of our website (http://investors.broadcom.com/phoenix.zhtml?c=203541&p=irol-govhighlights). Shareholders may also request a copy in print from: Investor Relations, Broadcom Limited, 1320 Ridder Park Drive, San Jose, California 95131, U.S.A.
Corporate Governance Guidelines
Our Board is committed to using sound corporate governance practices to help fulfill our responsibilities to our shareholders. As such, our Board has adopted Corporate Governance Guidelines, a copy of which is available in the “Investor Center—Corporate Governance—Documents” section of our website (http://investors.broadcom.com/phoenix.zhtml?c=203541&p=irol-govhighlights). Shareholders may also request a copy in print from: Investor Relations, Broadcom Limited, 1320 Ridder Park Drive, San Jose, California 95131, U.S.A. Among the policies included in our Corporate Governance Guidelines are the following:
Directors with Significant Job Change
Any director who retires from his or her present employment, or who materially changes his or her position, is required to submit an offer of resignation as a director of our Board. Our Board will then evaluate whether the individual should continue to sit on our Board in light of his or her new occupational status and decide whether or not to accept the director’s offer of resignation.
Director’s Offer of Resignation at Age 75
Our Board does not currently believe that a mandatory retirement age for non-employee directors is necessary, and that continued service by a particular director may be in the best interests of our Company and our shareholders, regardless of such director’s age. However, when a non-employee director reaches the age of 75 years, he or she is required to offer his or her resignation to our Board, to be effective as of the next annual general meeting of shareholders. Our Board will determine, based on individual circumstances, the needs of our Board and the interests of our Company and our shareholders, whether or not to accept such resignation.
15
Table of Contents
Accordingly, no person would be eligible to stand for election or re-election to our Board after attaining the age of 75 without being specifically nominated as a candidate by our Board.
Director Share Ownership Guidelines
The director share ownership guidelines, as adopted in February 2016, encourage our non-employees directors to hold our ordinary shares having a fair market value equal to three times the annual cash retainer paid to non-employee directors for service on our Board (which amounts to $240,000 currently), measured using the closing price per ordinary share as quoted on the Nasdaq Global Select Market on the date of valuation. Outstanding restricted share units (“RSUs”) held by a director count in full toward achieving the guideline level of share ownership. The guidelines encourage our non-employee directors to reach this goal within five years of the date of their appointment or election to our Board, and to hold at least such minimum value in shares for as long as he or she serves on our Board. As of February 12, 2018, all of our non-employee directors, other than Ms. Delly, who was appointed to our Board in December 2017, have achieved the guideline level of share ownership.
Forward-Looking Statements
This Proxy Statement contains forward-looking statements. We have based these forward-looking statements largely on our current expectations and projections about future events. Forward-looking statements contained in this Proxy Statement should be considered in light of the many uncertainties that affect our business and specifically those factors discussed from time to time in our public reports filed with the SEC, such as those discussed under the heading, “Risk Factors,” in our Annual Report on Form 10-K for Fiscal Year 2017 (the “2017 Form 10-K”), and as may be updated in our subsequent SEC filings.
16
Table of Contents
Our non-employee directors receive cash and equity compensation in consideration for their service on our Board, as set forth in more detail below. Non-employee directors are reimbursed, or we pay, for travel and other out-of-pocket expenses related to their attendance at Board and committee meetings and other travel at our request. Non-employee directors do not receive any non-equity incentive compensation, or participate in any company pension plan or deferred compensation plan. Under the laws of Singapore, our shareholders must approve all cash compensation paid to our non-employee directors. We do not compensate Mr. Tan and Dr. Samueli for their service on our Board or any committee of our Board.
Non-Employee Directors’ Cash Compensation
At our 2016 AGM, our shareholders approved the cash compensation arrangements for our non-employee directors currently in effect. Our non-employee directors are entitled to receive the following annual cash compensation, payable quarterly:
| Annual Fees | |||||||||||||||
| Board membership (including the Chairperson of the Board) |
$ 80,000 | ||||||||||||||
| Additional amounts, as applicable, payable to: |
|||||||||||||||
| Chairperson of the Board |
$ 150,000 | ||||||||||||||
| Chairperson of the Audit Committee |
$ 35,000 | ||||||||||||||
| Chairperson of the Compensation Committee |
$ 22,500 | ||||||||||||||
| Chairperson of the Nominating and Corporate Governance Committee |
$ 18,000 | ||||||||||||||
| Member of the Audit Committee (other than chairperson) |
$ 12,500 | ||||||||||||||
| Member of the Compensation Committee (other than chairperson) |
$ 10,000 | ||||||||||||||
| Member of the Nominating and Corporate Governance Committee |
$ 6,000 | ||||||||||||||
Non-Employee Directors’ Equity Compensation
Our non-employee directors are also entitled to receive the following equity compensation:
| • | upon appointment to our Board, an initial RSU award using a target value of $200,000, prorated based on the expected portion of a year to be served between the time of such director’s appointment and the anticipated date of our annual general meeting of shareholders immediately following the director’s appointment, issued under the Avago Technologies Limited 2009 Equity Incentive Award Plan (the “2009 Plan”), and vesting in full on the earlier of (i) the first anniversary of the grant date or (ii) the date on which the annual general meeting of shareholders immediately following the grant date is held, subject to the director’s continued service on our Board; and, thereafter, |
| • | an annual RSU award issued under the 2009 Plan using a target value of $200,000, to be granted on the date of each annual general meeting of shareholders, subject to the director’s re-election at such meeting, with such award vesting in full on the earlier of (i) the first anniversary of the grant date or (ii) the date on which the annual general meeting of shareholders immediately following the grant date is held, subject to the director’s continued service on our Board. |
To determine the number of shares to be awarded to a non-employee director pursuant to any such grants, the value of the grant is divided by the average of our per share closing market prices, as quoted on the Nasdaq Global Select Market, over the 30 calendar days immediately preceding the effective date of grant.
17
Table of Contents
Directors’ Compensation for Fiscal Year 2017
The following table sets forth information regarding compensation earned by our non-employee directors during Fiscal Year 2017.
| Name | Fees Earned or Paid in Cash |
Share Awards(1) |
Dividends(2) | Total | ||||||||||||||||
| James V. Diller |
$ | 257,750 | $ | 193,041 | $ | 489,600 | (3) | $ | 940,391 | |||||||||||
| Lewis C. Eggebrecht |
$ | 90,000 | $ | 193,041 | — | $ | 283,041 | |||||||||||||
| Kenneth Y. Hao |
$ | 80,000 | $ | 193,041 | $ | 204,000 | (4) | $ | 477,041 | |||||||||||
| Eddy W. Hartenstein |
$ | 105,500 | $ | 193,041 | — | $ | 298,541 | |||||||||||||
| Check Kian Low |
$ | 63,000 | $ | 259,001 | — | $ | 322,001 | |||||||||||||
| Donald Macleod |
$ | 120,000 | $ | 193,041 | — | $ | 313,041 | |||||||||||||
| Peter J. Marks |
$ | 95,500 | $ | 193,041 | — | $ | 288,541 | |||||||||||||
| Justine F. Page(5) |
$ | 60,500 | — | — | $ | 60,500 | ||||||||||||||
| Lucien Y. K. Wong(6) |
$ | 20,000 | — | — | $ | 20,000 | ||||||||||||||
| (1) | Represents the grant date fair value of RSU awards granted in Fiscal Year 2017, determined in accordance with Accounting Standards Codification Topic Number 718 (“ASC 718”), which is the closing market price of our ordinary shares on the date of grant, reduced by the present value of dividends expected to be paid on our ordinary shares prior to vesting. The amounts shown represent the grant date fair value of an RSU award for 906 ordinary shares granted to the director on April 5, 2017 following his or her election to our Board. With respect to Mr. Low, the amount shown also includes the grant date fair value of an RSU award for 388 ordinary shares granted on December 15, 2016 in connection with his appointment to our Board. The table below shows the aggregate number of ordinary shares underlying the share options and RSUs held by our non-employee directors as of October 29, 2017: |
| Name | Number of Ordinary Shares Underlying Restricted Share Units (#) |
Number of Ordinary Shares Underlying Outstanding Share Options (#) |
|||||||||||||
| James V. Diller |
906 | 15,077 | |||||||||||||
| Lewis C. Eggebrecht |
906 | 5,121 | |||||||||||||
| Kenneth Y. Hao |
906 | 15,077 | |||||||||||||
| Eddy W. Hartenstein |
906 | — | |||||||||||||
| Check Kian Low |
1,294 | — | |||||||||||||
| Donald Macleod |
906 | 5,223 | |||||||||||||
| Peter J. Marks |
906 | 23,474 | |||||||||||||
| (2) | Represents dividends paid on ordinary shares received upon exercise of share options previously granted to the director as compensation prior to our adoption of ASC 718, as dividends were not factored into the grant date fair value for such options. These share option awards were accounted for under Accounting Principles Board Opinion No. 25, “Accounting for Stock Issued to Employees,” and related interpretations and provided the required pro forma disclosures of SFAS No. 123, “Accounting for Stock-Based Compensation.” |
| (3) | Ordinary shares on which dividends were paid are held by Mr. Diller as trustee for a family trust. |
| (4) | Pursuant to Mr. Hao’s arrangement with Silver Lake, dividends on ordinary shares received by Mr. Hao upon the exercise of certain share options or the vesting of certain RSUs received as director compensation are required to be remitted to Silver Lake. |
| (5) | Ms. Page did not stand for re-election at the 2017 AGM and ceased to be a director on April 5, 2017. |
| (6) | Mr. Wong resigned from our Board effective December 15, 2016. |
18
Table of Contents
APPROVAL OF THE RE-APPOINTMENT OF INDEPENDENT REGISTERED PUBLIC
ACCOUNTING FIRM AND INDEPENDENT SINGAPORE AUDITOR FOR FISCAL YEAR 2018 AND
AUTHORIZATION OF THE AUDIT COMMITTEE TO FIX ITS REMUNERATION
PricewaterhouseCoopers LLP (“PwC”) is our independent registered public accounting firm in the United States and audits our consolidated financial statements. During Fiscal Year 2017, PwC in Singapore was our independent Singapore auditor of our Singapore statutory financial statements. Pursuant to Section 205(2) and 205(4) of the Singapore Companies Act, any appointment after our Board’s initial appointment of our independent Singapore auditor, or its subsequent removal, requires the approval of our shareholders. The Audit Committee has approved, subject to shareholder approval, the re-appointment of PwC as our independent registered public accounting firm and independent Singapore auditor for the fiscal year ending November 4, 2018 (“Fiscal Year 2018”). Pursuant to Section 205(16) of the Singapore Companies Act, the remuneration of a company’s auditors shall be fixed by the shareholders in a general meeting or the shareholders may authorize directors to fix the remuneration. Our Board believes that it is appropriate for the Audit Committee, as part of its oversight responsibilities, to fix the auditors’ remuneration. Our Board is therefore also requesting that the shareholders authorize the Audit Committee to fix the auditors’ remuneration for services rendered through our 2019 Annual General Meeting of Shareholders (the “2019 AGM”). We expect a representative from PwC to be present at the 2018 AGM. This representative will have the opportunity to make a statement if he or she so desires and is expected to be available to respond to appropriate questions.
Principal Accounting Fees and Services
Set forth below are the fees for all services rendered by PwC to us relating to Fiscal Year 2017. Also set forth below are audit fees for services rendered by PwC to us and Avago, our predecessor, relating to the fiscal year ended October 30, 2016 (“Fiscal Year 2016”), as well as fees billed for audit-related services, tax services and all other services rendered by PwC to Avago from November 2, 2015 to January 31, 2016 and to us from February 1, 2016 to October 30, 2016.
| Fiscal Year 2017 Services to Broadcom |
Fiscal Year 2016 Services to Broadcom and Avago |
||||||||||||||
| ($ in thousands) | |||||||||||||||
| Audit Fees |
$ 9,736 | $ 10,096 | |||||||||||||
| Audit-Related Fees |
941 | 575 | |||||||||||||
| Tax Fees |
1,694 | 1,458 | |||||||||||||
| All Other Fees |
3 | 3 | |||||||||||||
|
|
|
|
|
||||||||||||
| Total |
$ 12,374 | $ 12,132 | |||||||||||||
|
|
|
|
|
||||||||||||
Audit Fees consist of fees billed for professional services provided in connection with the integrated audit of our or Avago’s annual consolidated financial statements, audit of internal controls over financial reporting, the review of our or Avago’s quarterly consolidated financial statements, and audit services that are normally provided by the independent registered public accounting firm in connection with statutory and regulatory filings or engagements for those fiscal years, such as statutory audits. The fees include audit fees related to business combination accounting for our recently closed acquisitions.
Audit-Related Fees consist of fees billed for assurance and related services by PwC that are reasonably related to the performance of the audit or review of our or Avago’s consolidated financial statements and not included in Audit Fees. In both Fiscal Year 2017 and Fiscal Year 2016, these fees also included fees related to merger and acquisition due diligence.
19
Table of Contents
Tax Fees consist of fees billed for professional services for tax compliance, including various transfer pricing studies.
All Other Fees consist of fees for professional services rendered by PwC for permissible non-audit services. In both Fiscal Year 2017 and Fiscal Year 2016, these fees consisted of a license for specialized accounting research software.
In considering the nature of the services provided by PwC, the Audit Committee determined that such services are compatible with the provision of independent audit services. The Audit Committee discussed these services with PwC and our management to determine that they are permitted under the rules and regulation concerning independent registered public accounting firms’ independence promulgated by the SEC, as well as by the American Institute of Certified Public Accountants.
Other than as stated above, no fees were billed to us by PwC for Fiscal Year 2017 and Fiscal Year 2016. The Audit Committee considers the provision of these services to be compatible with maintaining the independence of PwC.
Audit Committee Pre-Approval Policy
The Audit Committee is responsible for selecting the independent registered public accounting firm to be employed by us to audit our financial statements, subject to approval by our shareholders of such appointment. The Audit Committee also assumes responsibility for the retention, compensation, oversight and termination of any independent auditor employed by us. All engagements with our independent registered public accounting firm, regardless of amount, must be authorized in advance by the Audit Committee. The Audit Committee has delegated its pre-approval authority to the Chairperson of the Audit Committee, provided that any matters approved in such manner are presented to the Audit Committee at its next regularly scheduled meeting. Pursuant to the charter of the Audit Committee, committee approval of non-audit services (other than review and attest services) is not required, if such services fall within available exceptions established by the SEC. However, to date, the Audit Committee’s policy has been to approve all services provided by our independent registered public accounting firm. The independent registered public accounting firm and our management are required to periodically report to the Audit Committee regarding the extent of services provided by the independent registered public accounting firm in accordance with the Audit Committee’s pre-approval, and the fees for the services performed to date.
During Fiscal Year 2017 and Fiscal Year 2016, all services provided to either Avago or us by PwC were approved by the Audit Committee pursuant to paragraph (c)(7)(i) of Rule 2-01 of Regulation S-X.
Our Board recommends a vote FOR the resolution to approve the re-appointment of PricewaterhouseCoopers LLP as our independent registered public accounting firm and independent Singapore auditor for Fiscal Year 2018 and to authorize the Audit Committee to fix its remuneration as described in the Notice.
20
Table of Contents
ORDINARY RESOLUTION TO AUTHORIZE SHARE ALLOTMENTS AND ISSUANCES
Under the laws of Singapore, our directors may issue shares and make offers, agreements, options or other instruments (including the grant of equity awards) that might or would require the allotment and issuance of shares only with the prior approval of our shareholders. We are submitting this proposal to authorize our directors to allot and issue our shares from time to time, as set forth in the Notice, because we are required to do so under the laws of Singapore before we can issue any (i) ordinary shares in connection with our equity compensation plans, possible future strategic transactions, or public and private offerings or (ii) Special Preference Shares in accordance with our Constitution.
If this proposal is approved, the authorization would be effective from the date of the 2018 AGM and continue until the earlier of (i) the conclusion of the 2019 AGM or (ii) the expiration of the period within which the 2019 AGM is required by the laws of Singapore to be held. The 2019 AGM is required to be held no later than 15 months after the date of the 2018 AGM or six months after our financial year end, whichever is the earlier. The laws of Singapore allow for an application to be made with the Singapore Accounting and Corporate Regulatory Authority for an extension of up to an additional two months of the time in which to hold an annual general meeting of shareholders, which may be granted in the discretion of that Authority.
Our Board believes that it is advisable and in the best interests of our shareholders for our shareholders to authorize the directors to issue shares and to make, grant or enter into, offers or agreements and issue options or other instruments (including the grant of equity awards and equity-related securities) that might or would require the allotment and issuance of ordinary shares. In the future, the directors may need to issue shares or make agreements that would require the allotment and issuance of new shares. For example:
| • | in connection with strategic transactions and acquisitions; |
| • | pursuant to public and private offerings of our ordinary shares, as well as instruments (including debt instruments) convertible or exchangeable into our ordinary shares; |
| • | in connection with our equity compensation plans and arrangements from time to time; or |
| • | in respect of the Special Preference Shares, as required by our Constitution. |
Notwithstanding this general authorization to allot and issue our ordinary shares, we will be required to seek shareholder approval with respect to future issuances of ordinary shares where required under Nasdaq rules, such as if we were to propose an issuance of ordinary shares that would result in a change in control of Broadcom or in connection with a transaction involving the issuance of ordinary shares representing 20% or more of our outstanding ordinary shares.
We expect that we will continue to issue ordinary shares and grant equity-based awards in the future under circumstances similar to those in the past. As of the date of this Proxy Statement, other than issuances of ordinary shares (i) in connection with our equity compensation plans, awards and arrangements, including any equity compensation plans and awards we have assumed or may assume as a result of any acquisitions we have made or may make, or (ii) as we may choose to issue in exchange for Restricted Units, we have no agreements or commitments that would result in the issuance by our Company of any ordinary shares for which approval of this proposal is required. Nevertheless, our Board believes that it is advisable and in the best interests of our shareholders for our shareholders to provide this general authorization in order to avoid the delay and expense of obtaining shareholder approval at a later date, and to provide us with greater flexibility to pursue strategic transactions and acquisitions and raise additional capital through public and private offerings of our ordinary shares, as well as instruments convertible into our ordinary shares.
We will only issue additional Special Preference Shares if and to the extent required, and in the manner provided, by our Constitution.
21
Table of Contents
If this proposal is approved, our directors would be authorized to allot and issue, during the period described above, ordinary shares subject to and in accordance with our Constitution, applicable Singapore laws and Nasdaq rules. The issuance of a large number of ordinary shares (or instruments convertible into or exchangeable for ordinary shares) could be dilutive to existing shareholders or reduce the trading price of our ordinary shares on the Nasdaq Global Select Market. If this proposal is not approved, we would not be permitted to issue shares under our equity compensation plans (other than ordinary shares issuable on exercise or settlement of outstanding options, RSUs and other instruments convertible or exchangeable into, or exercisable for, ordinary shares or the like, which were previously granted when prior shareholder approved share issuance mandates were in effect). If we are unable to rely upon equity as a component of compensation, we would have to review our compensation practices, and would likely have to substantially increase cash compensation to retain key personnel. If we are unable to rely on equity as a source of capital financing for acquisitions or other transactions, we may be unable to achieve our desired strategic goals which may harm our ability to grow our Company.
Our Board recommends a vote FOR the resolution to authorize share allotments and issuances as described in the Notice.
22
Table of Contents
NON-BINDING, ADVISORY VOTE TO APPROVE EXECUTIVE COMPENSATION
At our 2017 AGM, our Board recommended and shareholders voted in favor of having an annual, non-binding, advisory vote to approve the compensation of our named executive officers, as described in “Compensation Discussion and Analysis” beginning on page 26 and in the tables and accompanying narrative disclosure under “Executive Compensation” beginning on page 48. Accordingly, we are seeking this advisory vote at the 2018 AGM.
Shareholders are encouraged to read the “Compensation Discussion and Analysis” and “Executive Compensation” sections of this Proxy Statement, which discuss our compensation policies, procedures and programs and the Fiscal Year 2017 compensation for our named executive officers listed in the Fiscal Year 2017 Summary Compensation Table included in the “Executive Compensation” section of this Proxy Statement.
Our Board recommends that shareholders vote “FOR” the following resolution as described in the Notice:
“RESOLVED THAT shareholders approve, on an advisory basis, the compensation of Broadcom’s named executive officers, as disclosed in “Compensation Discussion and Analysis” and in the compensation tables and accompanying narrative disclosure under “Executive Compensation” in the accompanying Proxy Statement.”
While the vote on this resolution is advisory and not binding on us, the Compensation Committee or our Board, the Compensation Committee and our Board values thoughtful input from shareholders and will consider the outcome of the vote on this resolution when considering future executive compensation decisions.
Our Board recommends that shareholders vote, on a non-binding, advisory basis, FOR the resolution to approve executive compensation as described in the Notice.
23
Table of Contents
Executive Officers
The following table sets forth certain information about our executive officers as of February 12, 2018:
|
Name
|
Age
|
Title
| ||||
| Hock E. Tan
|
|
66
|
|
President, Chief Executive Officer and Director
| ||
| Thomas H. Krause Jr.
|
|
40
|
|
Chief Financial Officer
| ||
| Charlie B. Kawwas, Ph.D.
|
|
47
|
|
Senior Vice President and Chief Sales Officer
| ||
| Henry Samueli, Ph.D.
|
|
63
|
|
Chief Technical Officer and Director
| ||
| Mark D. Brazeal
|
|
50
|
|
Chief Legal Officer
| ||
| Bryan T. Ingram
|
|
53
|
|
Senior Vice President and General Manager, Wireless Semiconductor Division
| ||
| Kirsten M. Spears
|
|
53
|
|
Chief Accounting Officer, Vice President and
| ||
Hock E. Tan has served as our President, Chief Executive Officer and a director since March 2006. From September 2005 to January 2008, he served as chairman of the board of directors of IDT. Prior to becoming chairman of IDT, Mr. Tan was the President and Chief Executive Officer of ICS, from June 1999 to September 2005. Prior to ICS, Mr. Tan was Vice President of Finance with Commodore International, Ltd. from 1992 to 1994, and previously held senior management positions with PepsiCo, Inc. and General Motors Corporation. Mr. Tan served as managing director of Pacven Investment, Ltd., a venture capital fund in Singapore from 1988 to 1992, and served as managing director for Hume Industries Ltd. in Malaysia from 1983 to 1988.
Thomas H. Krause, Jr. has served as our Chief Financial Officer since October 2016, and served as our Vice President and acting Chief Financial Officer and principal financial officer from March 2016 to October 2016. Mr. Krause also served as our Vice President, Corporate Development from January 2012 to October 2016. Prior to joining us, he was an independent management consultant representing several public and private technology companies. Mr. Krause previously served as Vice President of Business Development at Techwell, Inc., a mixed-signal fabless semiconductor company, and held various roles with Technology Crossover Ventures and Robertson Stephens.
Charles B. Kawwas, Ph.D. has served as our Senior Vice President and Chief Sales Officer since June 2015 and served as our Senior Vice President, Worldwide Sales from May 2014 to June 2015. Dr. Kawwas served as Senior Vice President of Sales for LSI Corporation (“LSI”) from 2010 to May 2014, when we acquired LSI, having joined LSI in 2007 as Vice President of Marketing through its acquisition of Agere Systems. Prior to joining Agere Systems in 2005, he served as the leader of product line management for optical Ethernet and multiservice edge portfolio at Nortel Networks.
Henry Samueli, Ph.D. has served as our Chief Technical Officer and a director since February 1, 2016. He was a co-founder of BRCM and served as its Chief Technical Officer from its inception in 1991 to May 2008 and from December 2009 to January 2016. Dr. Samueli also served as BRCM’s Vice President of Research and Development from 1991 to May 2003 and as a technology advisor from May 2008 to December 2009. Dr. Samueli has also been a Professor in the Electrical Engineering Department at the University of California, Los Angeles since 1985 (on leave of absence since 1995) and a Distinguished Adjunct Professor in the Electrical Engineering and Computer Science Department of the University of California, Irvine since 2003. Prior to BRCM, Dr. Samueli was the Chief Scientist and one of the founders of PairGain Technologies. From 1980 until 1985, he was employed in various engineering management positions in the Electronics and Technology Division of TRW,
24
Table of Contents
Inc. Dr. Samueli is a Fellow of the Institute of Electrical and Electronics Engineers (IEEE), a Fellow of the American Academy of Arts and Sciences, and a Member of the National Academy of Engineering. Dr. Samueli served as Chairman or Co-Chairman of the board of directors of BRCM from 1991 to May 2008 and from May 2011 to January 2016. He received a B.S., M.S. and Ph.D. in Electrical Engineering from the University of California, Los Angeles. He is a named inventor in 75 U.S. patents.
Mark D. Brazeal has served as our Chief Legal Officer since April 2017. Mr. Brazeal is responsible for the legal, governance and compliance functions across the company. Prior to his current role, he served as the Chief Legal Officer and Senior Vice President, IP Licensing for SanDisk Corporation, from December 2014 until it was acquired by Western Digital Corporation in 2016. Before joining SanDisk, Mr. Brazeal spent 15 years at BRCM in various positions of increasing responsibility, most recently as the Senior Vice President and Senior Deputy General Counsel in charge of all commercial, operational, IP licensing and litigation matters for BRCM. Prior to that, Mr. Brazeal was an attorney in the transactional and IP groups at the law firms of Wilson Sonsini Goodrich & Rosati in Palo Alto, CA, Yuasa & Hara in Tokyo, Japan and Howrey & Simon in Washington, D.C. He earned a J.D. and a B.A. in American Government from the University of Virginia.
Bryan T. Ingram has served as our Senior Vice President and General Manager, Wireless Semiconductor Division since November 2015 and prior to that served as our Senior Vice President and Chief Operating Officer from April 2013. Mr. Ingram previously served as our Senior Vice President and General Manager, Wireless Semiconductor Division from November 2007 and as Vice President of that division from December 2005. Prior to the closing of our acquisition of the Semiconductor Products Group (“SPG”) of Agilent Technologies, Inc., Mr. Ingram was the Vice President and General Manager, Wireless Semiconductor Division of SPG. He has held various other positions with Hewlett-Packard Company and Agilent Technologies, Inc. Mr. Ingram joined Hewlett-Packard Company in 1990.
Kirsten M. Spears has served as our Chief Accounting Officer since March 2016 and as our Vice President and Corporate Controller since May 2014. Prior to our acquisition of LSI, Ms. Spears served as Vice President and Corporate Controller of LSI. She joined LSI in September of 1997 and held a number of management positions in accounting and reporting before becoming the Corporate Controller in 2007. Before joining LSI, Ms. Spears worked for Price Waterhouse LLP in audit; for Raychem Corporation, managing a variety of accounting functions; and for Bank of America, managing branch operations.
Our executive officers are appointed by, and serve at the discretion of, our Board. There are no family relationships among our directors and executive officers.
25
Table of Contents
COMPENSATION DISCUSSION AND ANALYSIS
The following Compensation Discussion & Analysis (the “CD&A”) describes the philosophy, objectives and structure of our Fiscal Year 2017 executive compensation program. This CD&A is intended to be read in conjunction with the tables and other information beginning on page 48, which provide further historical compensation information for our named executive officers.
Our named executive officers (our “NEOs”) for Fiscal Year 2017 were:
| • | Hock E. Tan, President and Chief Executive Officer (our “CEO”); |
| • | Thomas H. Krause, Jr., Chief Financial Officer (our “CFO”); |
| • | Charlie B. Kawwas, Ph.D., Senior Vice President and Chief Sales Officer; |
| • | Mark D. Brazeal, Chief Legal Officer; and |
| • | Bryan T. Ingram, Senior Vice President and General Manager, Wireless Semiconductor Division. |
| I. | Executive Summary: Fiscal Year 2017 Company Performance and Key Pay Decisions |
Our Fiscal Year 2017 performance continued to be strong on many measures, with exceptional gains in total shareholder return (“TSR”), robust revenue growth and the successful integration of BRCM. Our executive compensation program is structured around the achievement of near-term financial and operational targets and longer-term business objectives and strategies. We believe in rewarding performance; likewise, we believe pay should reflect underperformance, when that occurs. We seek to closely align our executives’ interests with those of our shareholders and, accordingly, allocate a significant portion of our executives’ compensation opportunity to equity-based compensation, the value of which depends on our performance relative to our peers.
Our Financial Performance
| ➣ | Under our CEO’s leadership, we have established a track record of delivering strong financial results and creating long-term sustained value for our shareholders. |
| • | Total Shareholder Return – Our TSR, based on an investment of $100 in our ordinary shares on the first day of fiscal year 2012, continued to be very strong on both an absolute and relative basis over the last five years. |
| – | For Fiscal Year 2017, our TSR increased 52.1%, significantly surpassing our peer group median, as well as the S&P 500 Index (the “S&P 500”), which rose by 23.9%. |
| – | In the last five fiscal years, our cumulative TSR has increased by 52.0% annually, and has significantly outperformed our peer group median and the S&P 500. |
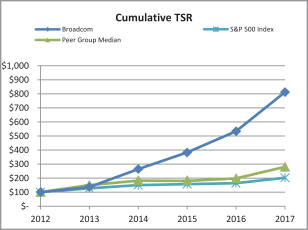
26
Table of Contents
| • | Revenue – Our GAAP revenue continued to show strong growth as well, reaching $17.6 billion in Fiscal Year 2017, a 33% increase over Fiscal Year 2016. |
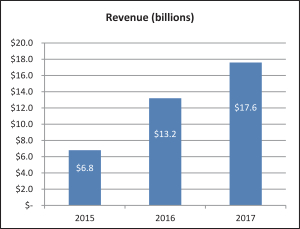
| • | Operating Income – Fiscal Year 2017 GAAP operating income increased $2,792 million or 683% over Fiscal Year 2016. Fiscal Year 2017 non-GAAP operating income increased $2,691 million or 51% over Fiscal Year 2016. Please see page 39 for a reconciliation of GAAP operating income to non-GAAP operating income. |
| • | Cash Flow – We generated $5,482 million in free cash flow (cash flow from operations of $6,551 million less capital expenditures of $1,069 million) in Fiscal Year 2017, a 104% increase over Fiscal Year 2016. Fiscal Year 2017 ended with $11,204 million in cash and cash equivalents, a 262% increase over Fiscal Year 2016, which included $3,980 million of net proceeds from the issuance of debt securities that was subsequently used to fund our acquisition of Brocade Communications Systems, Inc. (“Brocade”). |
| • | Return of Capital to our Shareholders – Our strong cash flow in Fiscal Year 2017 enabled us to return an aggregate of $1,745 million to our shareholders in cash dividends during Fiscal Year 2017, and allowed us to substantially increase our dividend going into Fiscal Year 2018. Over the past five fiscal years we have increased the quarterly interim dividends paid to our shareholders from $0.17 per ordinary share to $1.02 per ordinary share. In our first fiscal quarter of 2018 we paid an interim quarterly dividend of $1.75 per share, an increase of 72% over the quarterly interim dividend paid in the fourth fiscal quarter of 2017. |
Our Strategic Performance
| ➣ | During Fiscal Year 2017, we achieved a number of important strategic objectives, including the successful integration of BRCM, while remaining focused on our core operations and delivering strong operating performance as well as share price performance |
| • | We have completed several major acquisitions since 2013, and have a proven track record of successfully integrating and growing businesses we acquire, to create value for our shareholders, employees and customers. |
| – | We completed our acquisition of BRCM on February 1, 2016, creating a global, diversified leader in wired and wireless communication semiconductors. In less than two years, we successfully completed the integration of BRCM into our infrastructure as planned, de-levering its balance sheet and meaningfully increasing revenues and profitability. Since the completion of the Acquisition, our share price has appreciated 55%, ranking in the top 10% of the S&P 500 during that period. |
27
Table of Contents
| – | We also successfully prepared for, and three weeks after the end of Fiscal Year 2017, successfully completed, our acquisition of Brocade, strengthening our position as a leading provider of enterprise storage and networking solutions and enabling us to better serve our original equipment manufacturing customers. |
| • | We continued to focus the scope of our business, divesting substantially all of the non-core BRCM businesses held for sale. |
| • | We delivered on projected synergies across the combined business. |
Fiscal Year 2017 Compensation Highlights and Key Decisions
| ➣ | Cash Incentive Payouts Reflected Positive 2017 Company Performance. |
Payouts under the Fiscal Year 2017 Annual Performance Bonus Plan (the “APB Plan”), our annual cash incentive bonus plan, were tied to challenging pre-established annual corporate and divisional or functional performance goals, as well as the individual contributions and performance of each executive.
| • | Each of our adjusted non-GAAP revenue and adjusted non-GAAP operating margin (defined below) attainment for the year exceeded the maximum plan performance level, which together resulted in 150% attainment of the corporate performance goals. |
| • | All of the divisional or functional performance attainment exceeded the target plan performance levels and some exceeded the maximum plan performance level. This mix in attainment levels was due in part to differing business conditions across our various businesses. |
| • | As a result of their individual performance, our NEOs received individual performance multipliers ranging from 120% to 150%, including 150% for Mr. Tan, our CEO. These multipliers resulted in APB Plan payouts ranging between 162% and 225% of target for our NEOs under the APB Plan. The aggregate amount paid to our NEOs under the APB Plan increased to $6.3 million in Fiscal Year 2017 from $4.2 million in Fiscal Year 2016. |
| ➣ | No Increases to Base Salaries or Target Bonus Opportunities |
The Compensation Committee and the Independent Directors, in the case of our CEO, reviewed and approved the target cash compensation levels for our NEOs in Fiscal Year 2017 (the sum of base salary and target annual cash incentive bonus opportunity) and determined that, other than in connection with new appointments:
| • | The salaries of our NEOs were determined to be in alignment with the competitive market and, thus, no increases were made to any of their base salaries for Fiscal Year 2017. |
| • | Target annual cash incentive bonus opportunities for Fiscal Year 2017 under the APB Plan were set at the same levels as the prior year for all NEOs. |
| ➣ | Our CEO’s Long-Term Incentive Compensation was 100% Performance-Based. |
During Fiscal Year 2017, the Independent Directors granted Mr. Tan a performance-based RSU (“PSU”) award consisting of an aggregate of 168,000 units, which gives him the opportunity to earn up to 756,000 ordinary shares based on our TSR performance as compared to the S&P 500 (“Relative TSR”), as well as our absolute TSR over a three-year and four-year period. This PSU award is a multi-year grant and when granting the award the Independent Directors intended that no further awards would be granted to Mr. Tan that could be earned or vest through 2021. No service-based awards were granted to Mr. Tan in Fiscal Year 2017, other than a service-based RSU granted in lieu of a cash payment in respect of a portion of his bonus under the Fiscal Year 2016 APB Plan.
Mr. Tan has served as our President and CEO since March 2006 and during that time has delivered exceptional value to our shareholders. Under Mr. Tan’s leadership, our annual revenues have grown from $1.4 billion in Fiscal Year 2006 to $17.6 billion in Fiscal Year 2017, and our market capitalization has grown from $3.2 billion since our initial public offering in 2009 to over $100 billion as of the end of Fiscal Year 2017. The
28
Table of Contents
Independent Directors believe that it is very important to continue to retain and motivate Mr. Tan to lead our Company over the next four years based on this history of exceptional performance.
This PSU award is intended to incentivize Mr. Tan to continue to lead us to sustained, superior financial and operational performance through 2021, to provide a substantial long-term retention incentive to Mr. Tan and to reinforce our pay-for-performance philosophy to our shareholders.
| • | The Independent Directors used a Relative TSR design because the actual value realized by Mr. Tan will be well-aligned with our performance and the value created for our shareholders. While the overall grant value of the award shown in the Fiscal Year 2017 Summary Compensation Table appears substantial (due in part to the multi-year nature of the award and in part to the accounting methodology used to determine the grant date value), the amounts Mr. Tan may earn will only be exceptional if our Relative TSR is exceptional. If our Relative TSR is average, the amounts Mr. Tan earns is intended to align with the market median pay for CEOs within our compensation peer group. For example, if our Relative TSR equals the 50th percentile of the S&P 500 for the performance periods, at a stock price of $237.99 per share (closing price per ordinary share on the grant date), Mr. Tan would realize approximately $10 million per year on an annualized basis (though the award will only be earned in 2020 and 2021). This annualized amount is aligned with our compensation peer group practices for annual long-term CEO compensation grant values. |
| • | The Independent Directors structured this PSU award as a multi-year award in part because the multi-year grant awarded to Mr. Tan in 2013, was very successful and was associated with significant growth for our Company aligned with significant share price appreciation for our shareholders. The Independent Directors also believed that granting Mr. Tan a multi-year award would be more effective than smaller annual awards in retaining his services and incentivizing him to deliver superior long-term performance. |
| • | When designing this PSU award, the Independent Directors also took into account shareholder feedback, the recommendation of the Compensation Committee, and the advice of the Compensation Committee’s external, independent compensation consultant. |
| – | Performance is based on Relative TSR as opposed to share price contingency metrics. |
| – | Maximum potential payout is limited to the target amount if our absolute TSR is negative for a performance period, regardless of how well we outperform the S&P 500. |
The amounts Mr. Tan may earn in 2020 and 2021 under this PSU award are entirely dependent upon, and will be aligned with, our Relative TSR performance.
| • | This PSU award vests in two overlapping performance periods, one three-year performance period ending in 2020 (“Performance Period #1”) and one four-year performance period ending in 2021 (“Performance Period #2,” together with Performance Period 1, the “Performance Periods”) as follows: |
| – | 100% of the target number of ordinary shares (84,000 ordinary shares) will be earned with respect to a Performance Period if our Relative TSR is at or above the 50th percentile of the S&P 500; |
| – | No ordinary shares will be earned with respect to a Performance Period if our Relative TSR is below the 25th percentile of the S&P 500; |
| – | 25% of the target number of ordinary shares (21,000 ordinary shares) will be earned with respect to a Performance Period if our Relative TSR is at or above the 25th percentile of the S&P 500; |
| – | 300% of the target number of ordinary shares (252,000 ordinary shares) will be earned with respect to a Performance Period if our Relative TSR is at or above the 75th percentile of the S&P 500; and |
29
Table of Contents
| – | If our Relative TSR falls between these percentiles, the number of ordinary shares earned will be determined using linear interpolation. |
| • | If our Relative TSR for Performance Period #2 is at or above the 90th percentile of the S&P 500 and our absolute TSR is not negative, Mr. Tan will earn the maximum amount available under the award, which is 756,000 ordinary shares in aggregate over the two Performance Periods. |
| • | No more than the target number of ordinary shares (84,000 ordinary shares) may be earned with respect to a Performance Period if our absolute TSR is negative. This PSU award requires continued service through the completion of each Performance Period to earn the ordinary shares. |
| ➣ | Other NEO Equity Awards Consisted of a Mix of Performance-based and Service-based Awards |
To align our NEOs’ interests with those of our shareholders, in Fiscal Year 2017 a significant portion of the equity compensation awarded to our other NEOs were PSU awards that may be earned, if at all, based on our Relative TSR and absolute TSR performance over four overlapping performance periods beginning on the grant date and ending on each of March 14, 2018, 2019, 2020 and 2021, subject to the NEO remaining employed by us as of the end of each performance period.
Key Takeaways
We recorded substantial financial, operational and strategic achievements in Fiscal Year 2017, delivering exceptional shareholder value. The Compensation Committee and our Board remain committed to ensuring that our executives are focused and incentivized to enhance the long-term sustainable shareholder value.
| ✓ | Our executive compensation program is strongly tied to enhancing shareholder value and increasing our TSR over multi-year periods |
| – | 100% of our CEO’s Fiscal Year 2017 long-term incentive compensation is performance-based |
| – | We have significantly increased our absolute TSR since our initial public offering in 2009 by 1,644%. |
| – | Our PSU awards are tied to our Relative TSR and absolute TSR performance. |
| ✓ | The Compensation Committee’s actions reflect shareholder feedback |
| – | The Compensation Committee and members of management have conducted substantial shareholder outreach over the last several years, as we believe listening to and understanding the concerns and views of our shareholders is an important factor in designing an effective executive compensation program. |
| – | In 2016, the Compensation Committee solicited significant shareholder feedback and they and our Independent Directors took that feedback into consideration when designing our CEO’s Fiscal Year 2017 PSU award. Specifically, the sole performance criteria of his award are pre-established relative and absolute TSR performance objectives, to further align his interests with those of our shareholders. |
| – | Consistent with this emphasis on delivering sustainable long-term value creation, beginning in Fiscal Year 2017, the Compensation Committee designed the PSU awards granted to our other executives to also be subject solely to relative and absolute TSR performance metrics. |
Overview of Our Executive Compensation Program
The Compensation Committee believes that a significant portion of our executives’ target total direct compensation should be dependent upon our performance. Our executive compensation program is designed to reward our executives for producing sustainable growth in share value, consistent with our strategic plan, to attract and retain top talent and to align their interests with the interests of our shareholders.
30
Table of Contents
Our annual, direct compensation consists of three main components:
| Base Salary | Individual salaries are based on an executive’s responsibilities. Salaries are set to be competitive with market and industry norms, and to reflect individual performance. | |||
| Short-Term Incentives (“STI”) |
The APB Plan is intended to reward the achievement of pre-established annual corporate and divisional or functional performance goals, as well as the individual contributions and performance of each executive.
In Fiscal Year 2017, our corporate performance goals were (i) non-GAAP revenue and (ii) non-GAAP operating income as a percentage of non-GAAP revenue, excluding the expenses related to the APB Plan. |
|||
| Long-Term Incentives (“LTI”) |
Equity awards, in the form of service-based RSUs and PSUs, are granted to incentivize our executives to grow long-term sustainable shareholder value. Further, they serve as retention tools for our key executives, and are intended to reflect the value we place on their contribution to our Company. Our CEO’s Fiscal Year 2017 LTI award is 100% performance-based. |
Target Total Direct Compensation
The following charts compare the percentage breakdown of target total direct compensation for Fiscal Year 2017 for our CEO compared to our other NEOs. This consists of base salary, target STI, and target LTI awards granted to the NEOs during the fiscal year (divided between service-based RSUs and PSUs) based on the fair market value of the awards on the grant date. As Mr. Tan’s Fiscal Year 2017 PSU award is a multi-year award, the chart below annualizes this PSU award over four years, assuming target performance level attainment.

31
Table of Contents
Executive Compensation Program Governance
|
Best Practices We Employ
|
Practices We Do Not Employ
| |||||
| ✓
|
Majority of CEO and other NEO compensation tied to long-term performance
|
X
|
No incentive plan designs that encourage excessive risk taking
| |||
| ✓
|
Performance metrics are directly tied to value creation for shareholders
|
X
|
No perquisites, other than in modest amounts | |||
| ✓
|
Caps on cash and equity incentive plan payouts
|
X
|
No hedging and short sales of our securities
| |||
| ✓
|
Change in Control payments and benefits only paid upon “double trigger”
|
X
|
No pledging of our securities
| |||
| ✓
|
Compensation Committee is comprised entirely of independent directors
|
X
|
No re-pricing of underwater share options
| |||
| ✓
|
Compensation Committee engages an independent compensation consultant
|
X
|
No excise tax gross-ups
| |||
| ✓
|
Robust executive stock ownership guidelines
|
X
|
No supplemental retirement and pension benefits
| |||
| ✓
|
Compensation Committee regularly meets in executive session without management present
|
X
|
No guaranteed bonuses. Executive bonuses are 100% performance-based
| |||
| ✓
|
Active shareholder engagement
|
X
|
No ordinary dividends on unvested awards
| |||
| ✓
|
Annual risk assessment of all of our compensation programs
|
|||||
| ✓
|
CEO compensation is reviewed and approved by the Independent Directors
|
|||||
Shareholder Engagement
Over the last several years we have conducted significant shareholder outreach efforts. In Fiscal Year 2016, we contacted shareholders beneficially owning over 45% of our then outstanding ordinary shares to discuss our compensation philosophy, structure and then recent Compensation Committee actions and decisions. Our then Chairman of the Compensation Committee participated in those discussions. Topics that were discussed included:
| • | our Independent Directors’ approach to setting Mr. Tan’s LTI compensation; |
| • | the rationale for choosing our incentive compensation performance goals and related target levels; and |
| • | how our executive compensation program design has provided incentives to Mr. Tan and our other executives for significantly increasing the size and diversification of our Company through acquisitions. |
These shareholders indicated that they were supportive of our then recent compensation actions and decisions and program design. The input received from our shareholders was reported to the Compensation Committee and to our Board.
Say-on-Pay and Frequency Vote
At our 2017 AGM, we submitted our executive compensation program to a non-binding, advisory vote of our shareholders (the “say-on-pay proposal”). Shareholders representing more than 88% of ordinary shares represented in person or by proxy at the meeting and entitled to vote on the matter voted in favor of the say-on-pay proposal. Following the 2017 AGM, the Compensation Committee reviewed the results of the
32
Table of Contents
say-on-pay proposal. In light of this approval, the Compensation Committee did not make any significant changes to our executive compensation program other than setting the performance goals under the performance-based RSUs based on both relative and absolute TSR, rather than based on a share price contingency metric, based, in part, on shareholder feedback received in Fiscal Year 2016 and in connection with our 2017 AGM.
Additionally, at our 2017 AGM, shareholders representing a majority of ordinary shares represented in person or by proxy at the meeting and entitled to vote on the matter voted in favor of voting on a say-on-pay proposal annually, consistent with our Board’s recommendation. Our Board has determined to submit say-on-pay annually until the next required say-on-pay frequency vote.
| II. | Compensation Philosophy and Objectives |
Our executive compensation program is designed to achieve the following:
| • | attract qualified, experienced and talented executives in a highly competitive market; |
| • | retain, motivate and reward these executives whose skills, knowledge and performance are critical to our on-going success; |
| • | encourage our executives to focus on the achievement of our corporate financial and operational performance goals by aligning their APB Plan payout to the achievement of pre-established annual corporate and divisional or functional goals, as well as the individual contributions and performance of each executive; and |
| • | align our executives’ interests with those of our shareholders by linking a significant portion of each executive’s total direct compensation opportunity to returns realizable by our shareholders in the form of PSU awards that are subject to the attainment of pre-established performance-based objectives, and the rest of which vest based on service over four years. |
Equity awards are a long-term retention tool for key executives, intended to reflect the value we place on their expected contributions to our Company. When granting equity awards or, in the case of our CEO, when recommending an equity award to the Independent Directors for approval, the Compensation Committee considers each executive’s level of experience and expertise and overall value to us, as well as how much vested and unvested equity he or she then holds.
The Compensation Committee has adopted a compensation philosophy that is intended to keep our executives’ target total cash compensation (base salary plus target APB Plan opportunities) competitive with that of compensation for similarly situated executives at other companies (i) in our compensation peer group and (ii) included in the third-party market salary surveys it reviews. Generally, where the Compensation Committee believes that the positions in the market match our internal roles, it views target total cash compensation as competitive when the compensation falls within the 25th to 75th percentiles of the competitive market, dependent on the area of responsibility. The Compensation Committee believes that positioning target total cash compensation within this range of the market provides us a competitive position for attracting and retaining executives. However, the Compensation Committee bases its compensation decisions on the needs of our Company and an executive’s level of expertise, experience and marketability and will make exceptions to this philosophy when it determines it to be necessary or appropriate. As a result, target total cash compensation for an executive may fall outside the referenced range from time to time.
| III. | Compensation Determination Process |
Role of the Compensation Committee
The Compensation Committee devotes significant time throughout the year to our executive compensation program to ensure that it aligns executive pay with corporate performance and incentivizes our executives to pursue corporate strategic and financial goals that will create sustainable, long-term shareholder value.
33
Table of Contents
The Compensation Committee reviews and approves compensation for our key executives, except for our CEO, which is reviewed and approved by the Independent Directors based on recommendations from the Compensation Committee.
Individual Executive Compensation Assessment
In addition to market compensation data provided by our independent compensation consultant, the Compensation Committee (and, in the case of our CEO, the Independent Directors) considers the following information for each executive when determining his or her compensation:
| • | current base salary, target ABP Plan opportunities (and prior fiscal year payouts), the accumulated value of outstanding and unvested equity awards and other benefits; and |
| • | our CEO’s recommendation on compensation and individual performance (other than himself), the executive’s performance and his or her importance to our Company, among other things. |
This information helps the Compensation Committee and the Independent Directors, in the case of our CEO, to understand the long-term retentive elements and total compensation being delivered to our executives.
Internal Pay Parity
While we do not maintain a formal policy regarding internal pay parity, it is often considered as a factor by the Compensation Committee and the Independent Directors when determining compensation.
Our CEO is compensated at a higher level than our other executives because he has a significantly higher level of responsibility, accountability and experience. Mr. Tan also receives more of his target total direct compensation in the form of LTI compensation through PSU awards as compared to the other executives. Given Mr. Tan’s responsibility for our overall performance, the Independent Directors believe that compensating him at a higher level than our other executives and weighting his total compensation more heavily toward long-term, performance-based incentive compensation is consistent with market practice, appropriately reflects his contributions and directly aligns his incentives with the interests of our shareholders.
Compensation Risk Oversight
While our Board has overall responsibility for risk oversight, each of the committees of our Board regularly assesses risk in connection with executing their responsibilities. The Compensation Committee reviews and discusses those risks that relate to all of our compensation policies and practices and it does not believe that our compensation policies encourage excessive or inappropriate risk taking.
Role of Compensation Consultant
In Fiscal Year 2017, Compensia, Inc. (“Compensia”) provided consulting services to the Compensation Committee and the Independent Directors, including the preparation of an assessment of executive compensation based on an analysis of market compensation data. In addition, the Compensation Committee relied on Compensia for periodic updates on regulatory developments and market trends related to executive compensation matters. Compensia does not provide any other services to us other than advising the Compensation Committee and the Independent Directors on compensation-related matters.
The Compensation Committee has assessed the independence of Compensia pursuant to the six independence factors set forth in the SEC and Nasdaq rules and has concluded that Compensia is independent, and that its work for the Compensation Committee does not raise any conflict of interest.
| IV. | Compensation Competitive Analysis |
The Compensation Committee works with Compensia to develop a meaningful compensation peer group for purposes of understanding competitive market compensation practices. This peer group is evaluated annually for comparative purposes only; the Compensation Committee does not benchmark any pay
34
Table of Contents
components or target total direct compensation to a specific percentile. However, the Compensation Committee and, in the case of our CEO, the Independent Directors view generally compensation as competitive when it falls within the 25th to 75th percentile range relative to our compensation peer group. In the absence of relevant competitive data, the Compensation Committee reviews industry-based market compensation survey data as described below.
In August 2016, the Compensation Committee approved the compensation peer group for Fiscal Year 2017, which appears below. The following selection criteria were considered when developing our compensation peer group:
| • | Revenues: comparability across annual revenue, generally 0.5 to 2.0 times that of Broadcom’s; |
| • | Market capitalization: market capitalizations that generally fall between 0.3 to 3.0 times that of our Company; and |
| • | Industry: companies in semiconductor-related and other technology-focused industries having a similar scale. |
| Fiscal Year 2017 Peer Group | ||||||
| Agilent Technologies, Inc. |
Corning, Inc. | Micron Technology, Inc. | TE Connectivity Ltd. | |||
| Applied Materials, Inc. |
eBay, Inc. | Oracle Corporation | Texas Instruments, Inc. | |||
| Cisco Systems, Inc. |
Emerson Electric Company | Qualcomm Incorporated | Thermo Fisher Scientific, Inc. | |||
| Cognizant Technology | Intel Corporation | Seagate Technology PLC | Western Digital Corporation | |||
| Solutions Corporation |
Lam Research Corporation | |||||
| Percentile | Revenue ($mm)(1) |
Market Capitalization ($mm)(2) |
||||||||
| Fiscal Year 2017 Peer Group |
25th Median 75th |
|
$10,032 $12,744 $22,200 |
|
$16,321 $30,796 $61,679 |
|||||
| Broadcom Limited |
$10,892 | $61,869 | ||||||||
| Rank | 28% | 75% | ||||||||
(1) Represents publicly reported revenue for the trailing four quarters ended July 30, 2016.
(2) As of July 15, 2016, using publicly reported data available at such date.
In September 2017, the compensation peer group for Fiscal Year 2018 was updated to reflect the growth in our revenue and market capitalization. Agilent Technologies, Inc., Lam Research Corporation and Seagate Technology PLC were removed due to their revenues or market capitalizations falling below the financial selection criteria set forth above. Companies added to the peer group were Mastercard, Inc., NVIDIA Corporation, PayPal Holdings, Inc., The Priceline Group, Inc., and Visa Inc., which were viewed as appropriate peers because they have revenues and market capitalizations aligned with the applicable selection criteria detailed above, even though some of these companies do not operate in the semiconductor-related or other technology-focused industry.
Where the peer group data does not provide sufficient information for a particular executive position, the Compensation Committee reviews industry-based market compensation survey data (“market salary surveys”) from the following data sources:
| • | Radford Global Technology Survey; |
| • | Radford Global Sales Survey; and |
| • | Mercer High Tech Salary Survey (Asia). |
35
Table of Contents
| V. | Elements of Executive Compensation |
The principal components of our executive compensation program are:
| • | base salary; |
| • | an annual cash incentive bonus plan; |
| • | LTI compensation in the form of equity awards, including a substantial weighting toward performance-based RSUs; |
| • | severance and change in control payments and benefits; and |
| • | modest perquisites and other personal benefits. |
Base Salary
We believe that a competitive base salary is an important component of our compensation program designed to attract, engage and retain key executives. Base salaries provide fixed, baseline compensation and are set at levels intended to reflect an executive’s level and scope of responsibility, to be within a competitive range for similar positions at the companies in our compensation peer group and/or in the market salary surveys, and taking into account internal pay parity among our executives. The base salaries of our key executives are reviewed annually by the Compensation Committee.
Our CEO makes recommendations to the Compensation Committee with respect to base salary adjustments for key executives (other than himself). The Compensation Committee reviews and considers several factors in determining annual adjustments to an executive’s base salary, including:
| • | economic and business conditions and outlook; |
| • | individual performance throughout the prior fiscal year, including senior leadership ability and fiscal responsibility; |
| • | the actual pay rate of our executives as compared to market pay rates from the compensation peer group data and market survey data; and |
| • | internal pay parity. |
The Compensation Committee reviews and considers many factors in determining individual performance for the purposes of adjusting base salaries. These factors include such measures as division or function performance against budget, achievement of divisional or functional goals, new product introductions and corporate strategy implementation.
For Fiscal Year 2017, the Compensation Committee and, in the case of our CEO, the Independent Directors elected to maintain the base salary for our NEOs at their Fiscal Year 2016 levels.
| NEO | Title | Base Salary July 1, 2016 |
Base Salary July 1, 2017 |
% Change | ||||||||
| Hock E. Tan |
President and Chief Executive Officer | $1,100,000 | $1,100,000 | 0% | ||||||||
| Thomas H. Krause Jr. |
Chief Financial Officer | $ 371,158 | $ 400,000 | (1) | 7.8% | |||||||
| Charlie B. Kawwas, Ph.D. |
Senior Vice President and Chief Sales Officer | $ 488,529 | $ 488,529 | 0% | ||||||||
| Mark D. Brazeal(2) |
Chief Legal Officer | — | $ 450,000 | 0% | ||||||||
| Bryan T. Ingram |
Senior Vice President and General Manager, Wireless Semiconductor Division | $ 592,250 | $ 592,250 | 0% | ||||||||
| (1) | In connection with his appointment to CFO, Mr. Krause’s base salary was increased to $400,000 effective October 31, 2016. |
| (2) | Mr. Brazeal’s base salary was effective as of his hire date of March 27, 2017. |
36
Table of Contents
Annual Cash Incentive Bonus Plan
We believe that a significant portion of our executives’ target total direct compensation should be dependent upon performance. We use the APB Plan to provide a performance-based annual cash incentive opportunity for our executives. The APB Plan is designed to encourage and motivate our CEO to achieve overall corporate goals and our other executives to achieve both corporate and divisional or functional goals, and to drive positive contribution to our Company’s growth and performance.
Each executive is annually assigned a specified target annual cash incentive bonus opportunity under the APB Plan, expressed as a percentage of his or her base salary. The Compensation Committee considers the compensation peer group data and market survey data as one factor in determining an executive’s target annual cash incentive bonus opportunity and, in the case of our CEO, its recommendation to the Independent Directors. In addition, the Compensation Committee determines or, in the case of our CEO, recommends to the Independent Directors for approval, target annual cash incentive bonus opportunities based on an executive’s experience in his or her role with us and his or her level of responsibility, which the Compensation Committee believes directly correlates to his or her ability to influence corporate and operational results.
Fiscal Year 2017 APB Plan
The target annual cash incentive bonus opportunities for our NEOs for Fiscal Year 2017, other than in connection with new appointments, remained the same as for Fiscal Year 2016.
Target Annual Cash Incentive Bonus Opportunities
| NEO | APB Plan Target Bonus (as a % of base salary) | |
| Hock E. Tan |
150% | |
| Thomas H. Krause Jr.(1) |
75% | |
| Charlie B. Kawwas, Ph.D. |
75% | |
| Mark D. Brazeal |
60% | |
| Bryan T. Ingram |
100% |
| (1) | In connection with Mr. Krause’s appointment as CFO, his target bonus percentage under the APB Plan increased from 60% of base salary to 75% of base salary. |
Annual cash incentive bonuses under the APB Plan are calculated as follows:
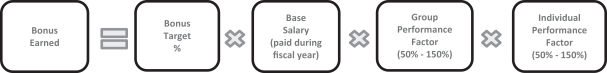
Bonuses under the APB Plan are payable to our NEOs in cash, with the exception of our CEO in certain circumstances. In the event the Independent Directors assign our CEO an individual performance multiplier (discussed in more detail below) greater than 100%, they may elect to pay the difference between the dollar amount of our CEO’s actual annual cash incentive bonus amount and the dollar amount of his annual cash incentive bonus calculated using a performance factor of 100% in the form of an equity award under the 2009 Plan. The type and terms of any such equity award would be determined by the Independent Directors. The Independent Directors believe that this feature gives them the flexibility to further incentivize our CEO to focus on our mid-term to long-term performance and to further provide for value creation for our shareholders, to more closely align our CEO’s interests with those of our shareholders generally, and to provide additional retention incentive to our CEO.
37
Table of Contents
Corporate Performance Components
The corporate performance goals for the Fiscal Year 2017 APB Plan were:
| • | non-GAAP revenue, which included the effect of acquisition-related purchase accounting adjustments relating to licensing revenue; and |
| • | non-GAAP operating income as a percentage of non-GAAP revenue, adjusted to exclude the effects of provisions or accruals for anticipated payouts under the APB Plan, which would otherwise have the effect of reducing non-GAAP operating income margin, referred to as “non-GAAP operating margin.” |
Each goal carried an equal weighting of 50% of the corporate performance component. In determining the actual attainment of these goals, the calculation of non-GAAP revenue and non-GAAP operating margin also excluded the financial effects of extraordinary items not considered when the performance goals were originally set.
The target attainment level for non-GAAP revenue for Fiscal Year 2017 was set at $15,716 million, and the maximum attainment level was set at $16,502 million. The target attainment level for non-GAAP operating margin for Fiscal Year 2017 was set at 44.9%, and the maximum attainment level was set at 46.9%. These target and maximum attainment levels were established by the Compensation Committee, based on the recommendation of our CEO, and approved by the Independent Directors. They were set at levels significantly above our Fiscal Year 2016 actual performance levels and were designed to be difficult to attain and to require substantial effort to achieve.
Divisional or Functional Performance Components
The Compensation Committee, following consideration of our CEO’s recommendations (with respect to executives other than himself), determined an executive’s divisional or functional goals and sets their weightings based on its assessment of the business requirements of the particular division or function to which the goals relate and the relative importance of the goals to the division or function. Each divisional or functional goal was set by the Compensation Committee to be difficult to attain and to require substantial effort on behalf of the division or function, and the NEO in charge of the division or function, to achieve. The table below under “Fiscal Year 2017 APB Plan Attainment and Payout Amounts” sets forth the divisional and functional goals for Fiscal Year 2017.
Individual Performance Multiplier
The final payouts under the APB Plan include the effect of each NEO’s applicable individual performance multiplier. Each individual NEO’s performance multiplier (other than our CEO’s) is approved by the Compensation Committee based, in part, on the recommendations of our CEO and by the Independent Directors in the case of our CEO with input from the Compensation Committee. In evaluating individual performance to determine the multiplier, the Compensation Committee considers the requirements of the NEO’s position, including the achievement of the divisional or functional goals, fiscal responsibility as determined by the Compensation Committee with input from our CEO, the NEO’s senior leadership ability, and how each of these factors impact the overall performance of the NEO’s division or function. Based on their respective division or function’s levels of performance and their individual contribution to that performance, the Compensation Committee or, in the case of our CEO, the Independent Directors, assigns each NEO an individual performance multiplier of between 50% and 150%. NEOs who consistently meet or exceed the requirements of their position, as determined by the Compensation Committee, receive an individual performance multiplier of between 100% and 150%. NEOs who meet some, but not all, of the requirements of their position or for whom the Compensation Committee believes that improvement is needed receive a bonus multiplier of between 50% and 100%.
Fiscal Year 2017 APB Plan Attainment
Corporate Performance Components
In December 2017, the Compensation Committee and the Independent Directors determined that we achieved Fiscal Year 2017 adjusted non-GAAP revenue of $17,658 million and adjusted non-GAAP operating
38
Table of Contents
margin of 48.1%, which were above the pre-established maximum attainment levels of performance. The following tables show the non-GAAP revenue and non-GAAP operating margin actually achieved for Fiscal Year 2017 and used for the purposes of determining the level of achievement of the corporate performance goals under the Fiscal Year 2017 APB Plan.
Non-GAAP Revenue Performance Goal Attainment
| Fiscal Year 2017 Non-GAAP Revenue Target Attainment Level (in millions) |
Fiscal Year 2017 Non- GAAP Revenue Maximum (in millions) |
Fiscal Year 2017 Revenue Achieved (in millions) |
Fiscal Year 2017 Revenue from (in millions) |
Fiscal Year 2017 APB GAAP Revenue Achieved (in millions) | ||||||||||||||||
| $15,716 |
$16,502 | $17,665(1) | $(7)(2) | $17,658 | ||||||||||||||||
| (1) | Non-GAAP revenue is calculated from our consolidated audited financial statements in our 2017 Form 10-K by adding to our $17,636 million of GAAP revenue $29 million of licensing revenue. |
| (2) | Represents revenue from a business acquired after Fiscal Year 2017 performance goals were set. |
Non-GAAP Operating Margin Performance Goal Attainment
|
Fiscal Year
2017 Margin Target |
Fiscal Year 2017 Non-GAAP Operating Margin Maximum Attainment Level |
Fiscal
Year GAAP |
Provisions or Accruals Payouts Under (in millions) |
Other Provisions Accruals, Net (in millions) |
Fiscal Year 2017 APB
Plan (in millions) |
Fiscal Year 2017 APB Plan Adjusted Non-GAAP Operating Margin Achieved | ||||||||||||||||||||||||
| 44.9% |
46.9% | $8,011(1) | $458 | $16(2) | $8,485 | 48.1% | ||||||||||||||||||||||||
| (1) | Non-GAAP operating income is calculated from our consolidated audited financial statements in our 2017 Form 10-K by adding to our $2,383 million GAAP operating income: $29 million related to the acquisition-related purchase accounting revenue adjustment, $4 million related to the acquisition-related purchase accounting effect on inventory, $4,275 million related to the amortization of acquisition-related intangibles ($2,511 million reported as amortization of intangible assets as part of cost of products sold and $1,764 million reported in amortization of intangible assets as part of operating expenses), $920 million related to share-based compensation expense ($64 million reported as part of cost of products sold and $856 million reported as part of operating expenses), $180 million related to restructuring charges ($19 million reported as part of cost of products sold and $161 million reported as part of operating expenses), $98 million in acquisition-related costs ($1 million reported as part of cost of products sold and $97 million reported as part of operating expenses), and $122 million in litigation settlements. |
| (2) | Represents expenses of a business acquired after Fiscal Year 2017 performance goals were set, as well as extraordinary expenses not considered at the time performance goals were set. |
Corporate Performance Attainment Level
| Corporate Performance Goals |
Actual Fiscal Year (in millions) |
As a % of Target Attainment |
Weight | Weighted Attainment | ||||||||||||||||
| Non-GAAP Revenue
|
$17,658
|
150%
|
50%
|
75%
| ||||||||||||||||
| Non-GAAP Operating Margin
|
48.1%
|
150%
|
50%
|
75%
| ||||||||||||||||
| Total Attainment
|
150% | |||||||||||||||||||
Divisional or Functional Performance Components
For purposes of the Fiscal Year 2017 APB Plan, the Compensation Committee determined an executive’s divisional or functional performance percentage based on the achievement of specified goals by the division or function overseen by him or her. In December 2017, the Independent Directors and the Compensation
39
Table of Contents
Committee determined that the divisional or functional goals had been achieved at the levels set forth in the table below under “Fiscal Year 2017 APB Plan Attainment and Payout Amounts”.
Individual Performance Multiplier
The Compensation Committee, with input from our CEO, determined that each of our NEOs (other than the CEO) should receive an individual performance multiplier of between 120% and 130% based on these individuals’ respective contributions towards the corporate goal achievements and their respective divisional or functional achievements.
The Independent Directors, based upon the recommendation of the Compensation Committee, determined that Mr. Tan should receive a performance multiplier of 150% for his performance in delivering extremely strong financial and operational results, above the APB Plan maximum performance goals.
Each of the corporate and divisional or functional goals for our NEOs, and their respective weighting is described in the following table.
Fiscal Year 2017 APB Plan Attainment and Payout Amounts
| Name | Bonus Target Percent |
Fiscal Year 2017 Bonus Goals | Fiscal Year 2017 Bonus Achievement |
Fiscal Year 2017 Payout Amount in Dollars (USD) and as a Percentage of Base Salary Paid(1) |
||||||||
| Hock E. Tan |
150% | Non-GAAP Revenue (50%) | 150% | |||||||||
|
President and Chief Executive Officer |
Non-GAAP Operating Margin (50%) | 150% | ||||||||||
| Fiscal Year 2017 Attainment | 150% | $ 3,712,500 | 337.5% | |||||||||
|
Thomas H. Krause Jr. |
75% | Non-GAAP Revenue (25%) | 150% | |||||||||
|
Chief Financial Officer |
Non-GAAP Operating Margin (25%) | 150% | ||||||||||
| Direct Expenses (50%)(2) | 117% | |||||||||||
| Fiscal Year 2017 Attainment | 134% | $ 520,888 | 130.2% | |||||||||
| Charlie B. Kawwas, Ph.D. |
75% | Non-GAAP Revenue (25%) | 150% | |||||||||
|
Senior Vice President and Chief Sales Officer |
Non-GAAP Operating Margin (25%) | 150% | ||||||||||
| Design Wins (15%) | 122% | |||||||||||
| Direct Expenses (15%)(2) | 120% | |||||||||||
| Product Revenue (10%) | 150% | |||||||||||
| Margin Improvement (10%) | 150% | |||||||||||
| Fiscal Year 2017 Attainment | 141% | $ 672,688 | 137.7% | |||||||||
|
Mark D. Brazeal |
60% | Non-GAAP Revenue (25%) | 150% | |||||||||
|
Chief Legal Officer |
Non-GAAP Operating Margin (25%) | 150% | ||||||||||
| Direct Expenses (35%)(2) | 120% | |||||||||||
| Litigation Expense (15%) | 120% | |||||||||||
| Fiscal Year 2017 Attainment | 135% | $ 243,935(3) | 97.2% | |||||||||
| Bryan T. Ingram |
100% | Non-GAAP Revenue (25%) | 150% | |||||||||
| Senior Vice President and General Manager, Wireless Semiconductor Division |
Non-GAAP Operating Margin (25%) | 150% | ||||||||||
| WSD Revenue (25%) | 150% | |||||||||||
| WSD Operating Margin (25%) | 145% | |||||||||||
| Fiscal Year 2017 Attainment | 149% | $ 1,145,780 | 193.5% | |||||||||
| (1) | Includes the quantitative effect of the NEOs applicable individual performance multiplier. |
| (2) | Represents direct expenses of the division or function, as applicable. |
| (3) | Pro-rated based on approximately seven months of service as Chief Legal Officer. |
Discretionary Bonuses
Each year, the Compensation Committee may supplement the APB Plan payout earned by our NEOs with discretionary bonuses that are awarded based on our CEO’s recommendations, other than with respect to himself, and the Compensation Committee’s assessment of individual contributions. Mr. Krause received a $100,000 discretionary cash bonus due to his contributions outside of the regular scope of his responsibility, in particular due to his significant efforts toward the completion of the acquisition of Brocade.
40
Table of Contents
Long-Term Incentive Compensation
Our equity awards provide a long-term retention tool for our executives and are intended to reflect the value we place on their contribution to our Company. The philosophy behind equity awards is to provide each executive with a strong incentive to remain with, and build value in, us over an extended period of time. The Compensation Committee believes that a combination of service-based RSU and PSU awards promotes long-term retention of our executive. This combination provides an element of certainty of value from their service-based RSU awards, while motivating the executive to improve performance and maximize our TSR, thereby more closely aligning their interests with those of our shareholders generally, through the PSU awards.
The Compensation Committee approves equity awards granted under our annual equity program to our NEOs, other than our CEO whose equity awards are approved by the Independent Directors, typically in March of each year. These awards are 50% service-based and 50% performance-based. In addition, the Compensation Committee may grant additional awards to our NEOs (other than the CEO) from time to time. In granting initial and subsequent equity awards, the Compensation Committee takes into consideration our CEO’s recommendation, except with respect to his own awards, the executive’s position and level, past equity awards, his or her other compensation and the perceived value he or she brings to our Company based on his or her technical experience, expertise and leadership capabilities. The Compensation Committee also reviews annually the amount of vested and unvested equity that an executive holds and the fair market value of the unvested equity awards compared to his or her base salary.
Fiscal Year 2017 Mix of Equity Awards
Consistent with our compensation philosophy, the Compensation Committee granted equity awards to our NEOs (other than our CEO) in Fiscal Year 2017 as set forth in the table below. The awards vest over four years, with 25% of the ordinary shares subject to the awards vesting annually, subject to the executive’s continued service on the vesting dates. The PSU awards however are also subject to the satisfaction of the applicable performance criteria, discussed in more detail below under “Fiscal Year 2017 Performance-Based Equity Awards”.
Fiscal Year 2017 Equity Awards Granted to NEOs other than our CEO
| November 2016(1) | December 2016(2) | March 2017 | April 2017(4) | |||||||||||||||||||||||||
| NEO |
Performance- Based RSUs (Number of Shares) |
Service- Based RSUs (Number of Shares) |
Service-Based (Number of |
PSUs (Maximum of |
Service- Based (Number |
PSUs (Maximum |
Service- Based (Number |
|||||||||||||||||||||
| Thomas H. Krause Jr. |
10,000 | 10,000 | 5,000 | 25,000 | 12,500 | |||||||||||||||||||||||
| Charlie B. Kawwas, Ph.D. |
5,000 | 25,000 | 12,500 | |||||||||||||||||||||||||
| Mark D. Brazeal | 25,000 | 12,500 | ||||||||||||||||||||||||||
| Bryan T. Ingram |
5,000 | 25,000 | 12,500 | |||||||||||||||||||||||||
| (1) | Represents an award granted to Mr. Krause in connection with his appointment as our CFO. |
| (2) | Awards granted to certain executives in recognition of their significant additional contributions during Fiscal Year 2016 with regard to acquisition related activity and for retention purposes. |
| (3) | Represents the maximum number of ordinary shares that can be earned. The target number of ordinary shares that can be earned is 50% of this amount (i.e., 12,500 ordinary shares). |
| (4) | Represents an award granted to Mr. Brazeal upon his appointment as our Chief Legal Officer. |
41
Table of Contents
Fiscal Year 2017 Performance-Based Equity Awards
Share Price Contingency Performance-Based RSUs
The ordinary shares subject to the PSU award granted to Mr. Krause in November 2016 in connection with his promotion to CFO will not be earned unless and until the date on which the average of the closing prices of our ordinary shares (as reported on the Nasdaq Global Select Market), over a period of 20 consecutive trading days is equal to or greater than 120% of the closing price of our ordinary shares on November 15, 2016, the date of grant, and vest over a four-year period at the rate of 25% per year subject to Mr. Krause remaining employed with us through the relevant vesting dates. On November 15, 2016, the closing price per share of our ordinary shares was $166.45; 120% of this price is $199.74 per share.
This share price contingency was met in February 2017 and all ordinary shares subject to this award have the potential to vest (assuming Mr. Krause’s continued service with us).
If the share price contingency had not been met by the fourth anniversary of the grant date or, in the event and at, the time Mr. Krause ceases to provide services to us, the PSU award would not have vested and the award would have expired or immediately terminated, as applicable.
Relative TSR PSUs
To more closely align the NEOs’ interests with those of our shareholders, in Fiscal Year 2017 our NEOs were granted PSU awards that are earned based on our Relative TSR and absolute TSR performance over four overlapping performance periods beginning on the grant date and ending on each of March 14 of 2018, 2019, 2020 and 2021. The number of ordinary shares that may be earned is capped at one-quarter of the target number of ordinary shares for each of the first three performance periods. In the aggregate, each NEO may earn up to 200% of the total target number of ordinary shares, if at the end of the fourth performance period our Relative TSR is at or above the 75th percentile of the S&P 500 and our absolute TSR is not negative. The PSU awards vest on the later of (i) the last day of each performance period and (ii) each anniversary of the grant date, subject to the NEO’s continued employment with us on the relevant vesting date. Within 60 days after the end of each performance period, the Compensation Committee will determine the number of ordinary shares earned based on our Relative TSR over the performance period expressed as a percentile. The number of ordinary shares earned will be determined by multiplying the target number of ordinary shares subject to each performance period (one-quarter of the total target number of ordinary shares) by an achievement factor (the “Achievement Factor”). The Achievement Factor is based on our Relative TSR for the performance period determined as follows:
| • | 100% of the target number of ordinary shares subject to each of the first three performance periods will be earned if our Relative TSR is at the 50th percentile of the S&P 500. |
| • | No ordinary shares will be earned with respect to a performance period if our Relative TSR is not at or above the 25th percentile of the S&P 500. |
| • | 50% of the target number of ordinary shares subject to each of the first three performance periods will be earned if our Relative TSR is at the 25th percentile of the S&P 500. |
| • | If our Relative TSR for the fourth performance period is at or above the 75th percentile of the S&P 500 and our absolute TSR is not negative, each NEO will be entitled to receive, in the aggregate, a maximum of 200% of the total target number of ordinary shares. |
| • | If the Relative TSR is between two of the levels set forth in the table above, the TSR performance multiplier will be determined using linear interpolation. |
The maximum number of ordinary shares that can be earned in the fourth performance period includes ordinary shares that were not earned in the prior three performance periods based on the sum of the Achievement Factors for these three performance periods (the “Prior Achievement Sum”). However, if our
42
Table of Contents
absolute TSR is negative for the fourth performance period, then the maximum number of ordinary shares that may be earned in the fourth performance period is 100% of the target number of ordinary shares.
At the end of each performance period, the Achievement Factor will be determined as follows:
| Relative TSR | TSR Performance Multiplier | |
| Performance Periods 1, 2 and 3
|
||
| At the 50th Percentile of the S&P 500
|
1
| |
| At the 25th Percentile of the S&P 500
|
0.5
| |
| Below the 25th Percentile of the S&P 500
|
0
| |
| Performance Period 4
|
||
| At the 75th Percentile of the S&P 500 |
Absolute TSR Negative = 4 less the Prior Achievement Sum Absolute TSR Neutral or Positive = 8 less the Prior Achievement Sum
| |
| At the 50th Percentile of the S&P 500
|
4 less the Prior Achievement Sum
| |
| At the 25th Percentile of the S&P 500 |
Prior Achievement Sum greater than or equal to 1.5 = 0.5 Prior Achievement Sum less than 1.5 = 2 less the Prior Achievement Sum
| |
| Below the 25th Percentile of the S&P 500
|
0
|
CEO Equity Award
On June 15, 2017, the Independent Directors granted Mr. Tan a PSU award consisting of an aggregate number of 168,000 units, which gives him the opportunity to earn up to a maximum of 756,000 ordinary shares. In designing this award, the Independent Directors consulted with Compensia to create a multi-year grant that would incentivize Mr. Tan to continue to lead us to long-term sustained, superior financial and operational performance. The PSU award emphasizes sustainable shareholder value creation and serves as an effective method to retain and motivate Mr. Tan, who has played a critical role in our exceptional performance since he joined in 2006. The value Mr. Tan will realize from the PSU award will depend on his ability to continue to successfully lead our Company to out-perform our peers over the next three to four years. The actual amounts Mr. Tan realizes under the PSU award will be well-aligned with our Company’s performance over the Performance Periods and the corresponding value created for our shareholders. Target performance under the award will result in an annualized value delivered to Mr. Tan that aligns with market median pay for CEOs in our compensation peer group (based on their annual grant values), as measured at the time of grant. Mr. Tan has the ability to earn significantly higher amounts if he can deliver significant sustained, superior performance over the next four years that creates a corresponding substantial value to our shareholders in comparison to an investment in the S&P 500.
Pursuant to the terms of the PSU award, the number of ordinary shares, if any, that may be earned will depend on the level of performance achieved based on both our Relative TSR and our absolute TSR. This PSU award vests in two overlapping performance periods; Performance Period #1 ending in 2020 and Performance Period #2 ending in 2021, with each Performance Period commencing June 15, 2017.
The number of ordinary shares earned at the end of each Performance Period will be fully vested on the last day of each Performance Period, subject to Mr. Tan’s continued service through such date. Within 60 days after the end of each Performance Period, the Independent Directors will determine the number of ordinary shares that Mr. Tan is entitled to receive by reference to our Relative TSR over the respective Performance Period expressed as a percentile as follows:
| • | 100% of the target number of ordinary shares (84,000 ordinary shares) will be earned with respect to a Performance Period if our Relative TSR is at or above the 50th percentile of the S&P 500; |
43
Table of Contents
| • | No ordinary shares will be earned with respect to a Performance Period if our Relative TSR is not at or above the 25th percentile of the S&P 500; |
| • | 25% of the target number of ordinary shares (21,000 ordinary shares) will be earned with respect to a Performance Period if our Relative TSR is at or above the 25th percentile of the S&P 500; |
| • | 300% of the target number of ordinary shares (252,000 ordinary shares) will be earned with respect to a Performance Period if our Relative TSR is at or above the 75th percentile of the S&P 500; and |
| • | If our Relative TSR is between these percentages, the number of ordinary shares that may be earned will be determined using linear interpolation. |
If our Relative TSR is at or above the 90th percentile of the S&P 500 in Performance Period #2 and our absolute TSR is not negative, Mr. Tan will earn the maximum amount available under the PSU award, which is 756,000 ordinary shares in aggregate over the two Performance Periods.
No more than the target number of ordinary shares (84,000 ordinary shares) may be earned with respect to a Performance Period if our absolute TSR is negative.
| Performance Period #1 | Performance Period #2 | |||||||||
| Relative TSR | % of Target Share Number Earned |
Number of Shares Earned |
% of Target Share Number Earned |
Number of Shares Earned |
Maximum Number
of Catch-Up Shares Earned | |||||
| At or above 90th Percentile of the S&P 500 |
300% | 252,000 | 450% | 378,000 | 378,000 | |||||
| At the 75th Percentile of the S&P 500 |
300% | 252,000 | 300% | 252,000 | 252,000 | |||||
| At the 50th Percentile of the S&P 500 |
100% | 84,000 | 100% | 84,000 | 84,000 | |||||
| At the 25th Percentile of the S&P 500 |
25% | 21,000 | 25% | 21,000 | 21,000 | |||||
| Below the 25th Percentile of the S&P 500 |
0% | - | 0% | - | - | |||||
| VI. | Additional Compensation Practices and Policies |
Executive Share Ownership Guidelines
Based on competitive market data and after consultation with Compensia, the Compensation Committee has set the following executive share ownership guidelines:
| Position | Required Salary Multiple | |
| CEO
|
3x base salary
| |
| Executive Officer |
1x base salary |
Our executive officers, including the CEO, are expected to satisfy the applicable guidelines within five years of the date on which they become an executive officer and to hold at least such minimum value in ordinary shares for so long as he or she is an executive officer.
Ordinary shares held in a trust or other estate-planning vehicle established by an executive officer, which continue to be beneficially owned by such executive officer under SEC rules, count toward the executive officer achieving the applicable guideline level of share ownership. Vested and exercisable option awards held by an executive officer count toward achieving the applicable guideline level of share ownership at a rate of 50%, i.e. two vested option shares will count as one ordinary share. Outstanding service-based RSUs and outstanding performance-based RSUs for which the performance criteria have been met count toward achieving the applicable guideline level of share ownership at a rate of 100%.
44
Table of Contents
As of August 29, 2017, all of our executive officers had achieved their guideline level of share ownership, as reflected above.
The Compensation Committee may, in its discretion, determine whether exceptions should be made in the case of any executive officer who, due to his or her financial circumstances or other special circumstances, would incur a hardship by complying with these share ownership guidelines.
Hedging and Pledging Prohibitions
A core element of our compensation philosophy is to align the interests of our executives with those of our shareholders by providing appropriate long-term incentives. In furtherance of this philosophy, our insider trading policy prohibits our executives from hedging or pledging our securities, from making short sales, or trading in derivative securities related to our securities.
Employee Stock Purchase Plan
Executives employed by our participating subsidiaries, including all of our NEOs, may also participate in our Employee Share Purchase Plan (“ESPP”). Our ESPP provides eligible employees with the opportunity to acquire our ordinary shares through periodic payroll deductions, at a 15% discount, based on a six-month “look-back” period. Our ESPP is structured in the U.S. as a qualified employee stock purchase plan under Section 423 of the Internal Revenue Code. Our ESPP requires participants to hold their purchased ordinary shares for a minimum of six months after any purchase date, unless they cease to be eligible to participate in the ESPP in which case the ordinary shares become freely tradable, subject to applicable securities laws and our insider trading policy.
Severance and Change in Control Benefits
The Compensation Committee believes that change in control and severance arrangements are important parts of the overall compensation program for our NEOs. Change in control provisions help to secure the continued employment and dedication of our NEOs, to reduce any concern that they might have regarding their own continued employment prior to or following a change in control of our Company, and to promote a continuity of management during a corporate transaction. Severance arrangements provide a stable work environment and are used primarily to attract, retain and motivate individuals with the requisite experience and ability to drive our success.
Each of our NEOs is eligible for severance and change in control payments and benefits under his or her respective severance benefits agreement with us. The Compensation Committee provides such payments and benefits to the NEOs based on its review of severance practices at the companies in our compensation peer group and as the result of arms’ length negotiations at the time our NEOs enter into employment with us, when they are requested to take on additional responsibilities, or from time to time if deemed necessary or desirable to achieve parity with other NEOs or otherwise.
The NEOs are entitled to severance and other benefits upon termination of employment without “cause” or for “good reason” (as each of those terms is defined in the agreement) or in the event of death or disability (a “qualifying termination”). The severance benefits agreements generally provide for continued base salary (12 months in the case of Mr. Tan and 9 months in the case of the other NEOs), bonus payment (100% in the case of Mr. Tan and 50% in the case of the other NEOs) and, other than in the case of Mr. Tan, health benefits continuation coverage (for 6 months) upon a qualifying termination.
In the event of a qualifying termination within 12 months following a change in control of our Company (or in the case of Mr. Tan, three months before or 12 months following such a change in control) (a “CIC qualifying termination”), the severance benefits agreements generally provide for continued base salary (24 months in the case of Mr. Tan and 12 months in the case of the other NEOs), bonus (200% in the case of Mr. Tan and 100% in the case of the other NEOs) and, other than in the case of Mr. Tan, health benefits continuation coverage (for 12 months).
45
Table of Contents
In the event of a CIC qualifying termination, the agreements also provide for acceleration of all outstanding service-based equity awards and acceleration of outstanding performance-based equity awards based on actual performance. Vesting of the equity awards held by the NEOs will only accelerate following a CIC qualifying termination of employment, which is commonly referred to as a “double trigger” provision. We believe our double trigger change in control arrangements protects shareholder value by allowing us the opportunity to deliver a motivated management team to any potential acquirer. If we did not offer any such change in control arrangements, our NEOs could be less motivated to pursue a potential acquisition even if such a transaction would benefit our shareholders, due to the possibility that they would lose the potential value of their unvested equity compensation upon an acquisition.
For a summary of the material terms and conditions of these arrangements, as well as an estimate of the post-employment payments and benefits that the NEOs are eligible to receive, see “Severance and Change in Control Agreements with Named Executive Officers; Death and Disability Policy; Employment Arrangements” below.
Other Compensation
The Compensation Committee provides modest perquisites and other personal benefits to our executives on a case-by-case basis. Typically, the Compensation Committee will provide a perquisite to an executive in limited circumstances, such as where it believes that such benefit is appropriate to assist him or her in the performance of his or her duties, to make him or her more efficient and effective, and for recruitment, motivation or retention purposes. In Fiscal Year 2017, Mr. Tan received reimbursement for travel to his residence in Pennsylvania and a car service for business-related travel in the San Francisco Bay Area, both of which were approved by the Independent Directors. For additional information on the perquisites and other personal benefits provided to Mr. Tan in Fiscal Year 2017, see the “Fiscal Year 2017 Summary Compensation Table” below.
Accounting and Tax Considerations
While the Compensation Committee and our Board generally consider the accounting and tax implications of their executive compensation decisions, neither element has been a material consideration in the compensation awarded to our NEOs historically.
In addition, the Compensation Committee and our Board have considered the potential future effects of Section 162(m) of the Internal Revenue Code on the compensation paid to our executive officers. Section 162(m) disallowed a tax deduction for any publicly held corporation for individual compensation exceeding $1 million in any taxable year for our CEO and each of the other NEOs (other than our CFO), referred to as “covered employees”. Prior to the enactment of tax reform legislation on December 22, 2017 (the “2017 Tax Reform Act”), “qualified performance-based compensation” was exempt from this $1 million limitation. As part of the 2017 Tax Reform Act, the ability to rely on this “qualified performance-based compensation” exception was eliminated and the limitation on deductibility generally was expanded to include all NEOs. The Compensation Committee has not previously taken the deductibility limit imposed by Section 162(m) into consideration in setting compensation and as a result of the 2017 Tax Reform Act, a deduction for any compensation paid to our NEOs in excess of $1 million is disallowed.
46
Table of Contents
The Compensation Committee has reviewed and discussed with members of management the Compensation Discussion and Analysis section included in this proxy statement, as required by Item 402(b) of Regulation S-K. Based upon such review and related discussions, the Compensation Committee recommended to our Board that the Compensation Discussion and Analysis be included in this proxy statement for the Company’s 2018 Annual General Meeting of Shareholders.
Submitted by the Compensation Committee of the Board of Directors:
Eddy W. Hartenstein, Chairperson
James V. Diller
Lewis C. Eggebrecht
Donald Macleod
47
Table of Contents
Fiscal Year 2017 Summary Compensation Table
The following table sets forth information about compensation earned by our NEOs during Fiscal Year 2017, Fiscal Year 2016 and Fiscal Year 2015. Our NEOs consist of our CEO, our CFO, and each of our three other most highly compensated executive officers serving at the end of Fiscal Year 2017.
| Name and Principal Positions |
Fiscal Year |
Salary ($) |
Bonus ($) |
Stock Awards ($)(1) |
Non-Equity |
All Other Compensation ($) |
Total ($) |
|||||||||||||||||||||
|
Hock E. Tan |
2017 | 1,100,000 | 0 | 98,322,843 | 3,712,500 | 75,820 | (3) | 103,211,163 | ||||||||||||||||||||
| President and Chief Executive Officer |
2016 | 1,011,662 | 0 | 21,656,268(4) | 1,980,516 | (5) | 43,601 | 24,692,047 | ||||||||||||||||||||
| 2015 | 910,461 | 0 | 0 | 3,061,384 | 53,923 | 4,025,768 | ||||||||||||||||||||||
| Thomas H. Krause Jr. |
2017 | 400,000 | 100,000 | (6) | 10,101,125 | 520,888 | 16,200 | (7) | 11,138,213 | |||||||||||||||||||
| Chief Financial Officer | 2016 | 349,687 | 200,000 | 2,574,300 | 312,924 | 15,900 | 3,452,811 | |||||||||||||||||||||
| Charlie B. Kawwas, Ph.D. |
2017 | 488,529 | 0 | 7,322,750 | 672,688 | 16,200 | (7) | 8,500,167 | ||||||||||||||||||||
| Senior Vice President and Chief Sales Officer |
2016 | 479,007 | 0 | 4,273,410 | 549,885 | 20,278 | 5,322,580 | |||||||||||||||||||||
| 2015 | 424,284 | 300,000 | 3,256,875 | 670,326 | 224,596 | 4,876,081 | ||||||||||||||||||||||
| Mark D. Brazeal(8) |
2017 | 268,269 | 0 | 5,906,188 | 243,935 | 12,462 | (7) | 6,430,854 | ||||||||||||||||||||
| Chief Legal Officer | ||||||||||||||||||||||||||||
|
Bryan T. Ingram |
2017 | 592,250 | 0 | 7,322,750 | 1,145,780 | 16,200 | (7) | 9,076,980 | ||||||||||||||||||||
| Senior Vice President and General Manager, Wireless Semiconductor Division |
2016 | 580,706 | 0 | 3,123,580 | 380,423 | 15,900 | 4,100,609 | |||||||||||||||||||||
| 2015 | 542,308 | 0 | 6,014,925 | 810,577 | 15,900 | 7,383,710 | ||||||||||||||||||||||
| (1) | Represents the grant date fair value of service-based RSUs and PSU awards, determined in accordance with ASC 718. As the PSU awards do not have performance conditions as defined under ASC 718, the maximum grant date fair values for such awards do not differ from the fair values presented in this table. The amounts in this column do not reflect compensation actually received by the NEOs or the actual value that may be recognized by the NEO. For a discussion of valuation assumptions used in the calculations, see Note 2 to the Consolidated Financial Statements included in Part II, Item 8 of our 2017 Form 10-K filed with the SEC on December 21, 2017. |
| (2) | Represents amounts paid under the APB Plan for each fiscal year. Please see the plan description in “Compensation Discussion and Analysis—Elements of Executive Compensation—Annual Cash Incentive Bonus Plan” above. |
| (3) | Represents $23,234 in expense reimbursements for travel to Mr. Tan’s residence in Pennsylvania, $16,200 401(k) employer matching contribution and $36,386 for car service. |
| (4) | Includes the portion of Mr. Tan’s Fiscal Year 2016 APB Plan payout ($990,258 in value) delivered in the form of a service-based RSU award, as determined by the Independent Directors. |
| (5) | Represents the portion of Mr. Tan’s Fiscal Year 2016 APB Plan payout paid in cash. Mr. Tan’s total Fiscal Year 2016 APB Plan payout amount was $2,970,774. However, the Independent Directors determined that $1,980,516 of that amount, which represents his payout based on a performance multiplier of 100%, would be paid in cash and the remaining $990,258 delivered to Mr. Tan in the form of a service-based RSU award. |
| (6) | Represents a discretionary cash bonus paid to Mr. Krause due to his contributions outside the regular scope of his responsibility, in particular his significant efforts toward the completion of the acquisition of Brocade. |
| (7) | Represents 401(k) employer matching contributions. |
| (8) | Mr. Brazeal was appointed Chief Legal Officer on March 27, 2017. |
48
Table of Contents
Fiscal Year 2017 Grants of Plan-Based Awards Table
The following table sets forth information regarding grants of plan-based awards during Fiscal Year 2017 to each of our NEOs. All awards were granted under the 2009 Plan unless otherwise noted.
| Estimated Future Payouts Under Non-Equity Incentive Plan Awards(2) |
Estimated Future Payouts Under Equity Incentive Plan Awards |
All Other (#)(3) |
Grant Date Fair Value of Stock and Option Awards ($)(4) |
|||||||||||||||||||||||||||||||||||||
| Name | Approval Date(1) |
Grant Date(1) |
Threshold ($) |
Target ($) |
Maximum ($) |
Threshold (#) |
Target (#) |
Maximum (#) |
||||||||||||||||||||||||||||||||
|
Hock E. Tan |
206,250 | 1,650,000 | 3,712,500 | |||||||||||||||||||||||||||||||||||||
| 12/7/2016 | 12/15/2016 | 6,010 | (5) | 1,021,700 | ||||||||||||||||||||||||||||||||||||
|
|
6/15/2017
|
|
|
6/15/2017
|
|
|
21,000
|
|
|
168,000
|
(6)
|
|
756,000
|
|
|
98,322,843
|
| |||||||||||||||||||||||
|
Thomas H. Krause Jr. |
18,750 | 300,000 | 675,000 | |||||||||||||||||||||||||||||||||||||
| 10/14/2016 | 11/15/2016 | 10,000 | (7) | 1,214,275 | ||||||||||||||||||||||||||||||||||||
| 10/14/2016 | 11/15/2016 | 10,000 | 1,564,100 | |||||||||||||||||||||||||||||||||||||
| 12/6/2016 | 12/15/2016 | 5,000 | 850,000 | |||||||||||||||||||||||||||||||||||||
| 3/3/2017 | 3/15/2017 | 1,562 | 12,500 | (8) | 25,000 | 3,773,750 | ||||||||||||||||||||||||||||||||||
|
|
3/3/2017
|
|
|
3/15/2017
|
|
|
12,500
|
|
|
2,699,000
|
| |||||||||||||||||||||||||||||
|
Charlie B. Kawwas, Ph.D. |
9,160 | 366,397 | 824,393 | |||||||||||||||||||||||||||||||||||||
| 12/6/2016 | 12/15/2016 | 5,000 | 850,000 | |||||||||||||||||||||||||||||||||||||
| 3/3/2017 | 3/15/2017 | 1,562 | 12,500 | (8) | 25,000 | 3,773,750 | ||||||||||||||||||||||||||||||||||
|
|
3/3/2017
|
|
|
3/15/2017
|
|
|
12,500
|
|
|
2,699,000
|
| |||||||||||||||||||||||||||||
|
Mark D. Brazeal |
5,647 | 150,577 | 338,798 | |||||||||||||||||||||||||||||||||||||
| 3/17/2017 | 4/15/2017 | 1,562 | 12,500 | (8) | 25,000 | 3,389,813 | ||||||||||||||||||||||||||||||||||
|
|
3/17/2017
|
|
|
4/15/2017
|
|
|
12,500
|
|
|
2,516,375
|
| |||||||||||||||||||||||||||||
|
Bryan T. Ingram |
37,016 | 592,250 | 1,332,563 | |||||||||||||||||||||||||||||||||||||
| 12/06/2016 | 12/15/2016 | 5,000 | 850,000 | |||||||||||||||||||||||||||||||||||||
| 3/3/2017 | 3/15/2017 | 1,562 | 12,500 | (8) | 25,000 | 3,773,750 | ||||||||||||||||||||||||||||||||||
| 3/3/2017 | 3/15/2017 | 12,500 | 2,699,000 | |||||||||||||||||||||||||||||||||||||
| (1) | The approval date represents the date on which the award was approved by the Compensation Committee or the Independent Directors, as applicable. The grant date is the date on which the award became effective. |
| (2) | Represents estimated potential payouts under the APB Plan for Fiscal Year 2017. Target bonus amount for Fiscal Year 2017 were as follows: Mr. Tan 150%, Mr. Krause 75%, Dr. Kawwas 75%, Mr. Brazeal 60% and Mr. Ingram 100%, as a percentage of base salary. The threshold amount for Mr. Tan was 12.5% of his target bonus amount, calculated based on the achievement of a single corporate goal at 50% of the target for such goal and with the individual performance multiplier set at target 50%. The threshold amount for each of Messrs. Krause and Ingram was 6.25% of his target bonus amount, calculated based on the achievement of a single corporate or divisional goal at 25% of the target for such goal and with the individual performance multiplier set at target 50%. The threshold amount for Dr. Kawwas was 2.5% of his target bonus amount, calculated based on the achievement of a single corporate or divisional goal at 10% of the target for such goal and with the individual performance multiplier set at target 50%. The threshold amount for Mr. Brazeal was 3.75% of his target bonus amount, calculated based on the achievement of a single corporate or divisional goal at 15% of the target for such goal and with the individual performance multiplier set at target 50%. The maximum bonus payable was 225% of the target bonus amount for Mr. Tan, which assumes maximum (150%) performance for each corporate goal and with the individual performance multiplier set at 150%. The maximum bonus payable was 225% of the target bonus amount for Messrs. Krause, Brazeal and Ingram, and Dr. Kawwas, which assumes maximum (150%) performance for (i) each corporate goal and (ii) each divisional or functional goal and with the maximum individual performance multiplier set at 150%. |
| (3) | Represents service-based RSU awards, which vest at a rate of 25% per year on each anniversary of the grant date, subject to the NEO continued employment with us through the relevant vesting date. |
| (4) | Represents the grant date fair value of the equity awards, as determined in accordance with ASC 718. For a discussion of the valuation assumptions used in the calculations, see Note 2 to the Consolidated Financial Statements included in Part II, Item 8 of our Annual Report on Form 10-K filed with the SEC on December 21, 2017. |
| (5) | Represents a service-based RSU granted to Mr. Tan in respect of a portion of his Fiscal Year 2016 APB Plan bonus payout amount, which vests at a rate of 25% per year on each anniversary of the grant date, subject to Mr. Tan’s continued employment with us through the relevant vesting date. |
49
Table of Contents
| (6) | See footnote 6 to the “Fiscal Year 2017 Outstanding Equity Awards at Fiscal Year-End Table” for details of the vesting of this PSU award. |
| (7) | Represents a PSU award, which is scheduled to vest at a rate of 25% per year on each anniversary of the grant date, subject to the satisfaction of a share price contingency (set at the grant date) and the NEO’s continued employment with us through the relevant vesting dates. The share price contingency provided that the ordinary shares subject to the PSU award will vest only if the average closing price per share of our ordinary shares over a 20 consecutive trading day period equals or exceeds 120% of the fair market value of an ordinary share on the grant date. If this share price contingency is met on or prior to the fourth anniversary of the grant date, then all of the ordinary shares have the potential to vest (assuming continued service). As a result, the threshold, target and maximum amounts are the same. The share price contingency for this PSU award has been met. |
| (8) | Represents a PSU award that will vest at a rate of 25% per year on the later of (i) each anniversary of the grant date and (ii) the last day of the performance period, subject to the NEO’s continued employment with us through the relevant vesting date and subject to the achievement of specified performance goals over each performance period, as determined by the Compensation Committee within 60 days following the end of each performance period. The performance criteria is based on our Relative TSR over four performance periods beginning on the grant date and ending on each of March 14 of 2018, 2019, 2020 and 2021. The number of ordinary shares that may be earned is capped at one-quarter of the target number of ordinary shares for each of the first three performance periods. In the aggregate, the NEO may earn up to 200% of the total target number of ordinary shares subject to the PSU award, if at the end of the fourth performance period our Relative TSR is at or above the 75th percentile of the S&P 500 and our absolute TSR is not negative. If the minimum performance goals are not met, no ordinary shares will be issued and this award will be cancelled. |
Fiscal Year 2017 Outstanding Equity Awards at Fiscal Year-End Table
The following table sets forth information about share options and RSU awards outstanding on October 29, 2017, the last day of Fiscal Year 2017, held by each of our NEOs.
| Option Awards(1) | Restricted Share Unit Awards(1) | |||||||||||||||||||||||||||||||||||
| Name | Grant Date | Number of Securities Underlying Unexercised Options (#) Exercisable |
Number of Securities Underlying Unexercised Options (#) Unexercisable |
Option Exercise Price ($) |
Option Expiration Date |
Number of Shares or Units of Stock that Have Not Vested (#) |
Market Value of Shares or Units of Stock that Have Not Vested ($)(2) |
Equity Incentive Plan Awards: Number of Securities Underlying Unearned Units of Stock (#) |
Market Stock that |
|||||||||||||||||||||||||||
|
Hock E. Tan |
||||||||||||||||||||||||||||||||||||
| 3/8/2011 | 30,000 | — | 32.39 | 3/7/2018 | — | — | — | — | ||||||||||||||||||||||||||||
| 3/12/2013 | 131,250 | — | 35.45 | 3/11/2020 | — | — | — | — | ||||||||||||||||||||||||||||
| 9/13/2013 | 1,547,916 | — | 38.99 | 9/12/2020 | — | — | — | — | ||||||||||||||||||||||||||||
| 1/2/2014 | 562,500 | 187,500(3) | 52.65 | 1/1/2021 | — | — | — | — | ||||||||||||||||||||||||||||
| 6/15/2016 | — | — | — | — | 240,000(4) | 60,696,000 | ||||||||||||||||||||||||||||||
| 12/15/2016 | — | — | 6,010(5) | 1,519,929 | — | — | ||||||||||||||||||||||||||||||
| 6/15/2017 | — | — | — | — | 756,000(6) | 191,192,400 | ||||||||||||||||||||||||||||||
|
Thomas H. Krause Jr. |
|
|||||||||||||||||||||||||||||||||||
| 3/11/2014 | — | 22,500(7) | 62.02 | 3/10/2021 | 7,500(5) | 1,896,750 | — | — | ||||||||||||||||||||||||||||
| 3/15/2015 | — | — | 5,000(5) | 1,264,500 | — | — | ||||||||||||||||||||||||||||||
| 3/15/2015 | — | — | 5,000(8) | 1,264,500 | — | — | ||||||||||||||||||||||||||||||
| 3/15/2016 | — | — | 7,500(5) | 1,896,750 | — | — | ||||||||||||||||||||||||||||||
| 3/15/2016 | — | — | 7,500(8) | 1,896,750 | — | — | ||||||||||||||||||||||||||||||
| 11/15/2016 | — | — | 10,000(5) | 2,529,000 | — | — | ||||||||||||||||||||||||||||||
| 11/15/2016 | — | — | 10,000(8) | 2,529,000 | — | — | ||||||||||||||||||||||||||||||
| 12/15/2016 | — | — | 5,000(5) | 1,264,500 | — | — | ||||||||||||||||||||||||||||||
| 3/15/2017 | — | — | 12,500(5) | 3,161,250 | 25,000(9) | 6,322,500 | ||||||||||||||||||||||||||||||
50
Table of Contents
| Option Awards(1) | Restricted Share Unit Awards(1) | |||||||||||||||||||||||||||||||||||
| Name | Grant Date | Number of Securities Underlying Unexercised Options (#) Exercisable |
Number of Securities Underlying Unexercised Options (#) Unexercisable |
Option Exercise Price ($) |
Option Expiration Date |
Number of Shares or Units of Stock that Have Not Vested (#) |
Market Value of Shares or Units of Stock that Have Not Vested ($)(2) |
Equity Incentive Plan Awards: Number of Securities Underlying Unearned Units of Stock (#) |
Market Stock that |
|||||||||||||||||||||||||||
|
Charlie B. Kawwas, Ph.D. |
|
|||||||||||||||||||||||||||||||||||
| 3/1/2013 | 3,668 | — | 38.92 | 3/1/2020 | — | — | — | — | ||||||||||||||||||||||||||||
| 3/1/2014 | 2,831 | 2,831(10) | 62.63 | 3/1/2021 | 2,859 | (11) | 723,041 | — | — | |||||||||||||||||||||||||||
| 6/10/2014 | 30,000 | 30,000(7) | 71.86 | 6/9/2021 | 10,000 | (5) | 2,529,000 | — | — | |||||||||||||||||||||||||||
| 3/15/2015 | — | — | 7,500 | (5) | 1,896,750 | — | — | |||||||||||||||||||||||||||||
| 3/15/2015 | — | — | 7,500 | (8) | 1,896,750 | — | — | |||||||||||||||||||||||||||||
| 12/15/2015 | — | — | 2,250 | (5) | 569,025 | — | — | |||||||||||||||||||||||||||||
| 3/15/2016 | — | — | 11,250 | (5) | 2,845,125 | — | — | |||||||||||||||||||||||||||||
| 3/15/2016 | — | — | 11,250 | (8) | 2,845,125 | — | — | |||||||||||||||||||||||||||||
| 12/15/2016 | — | — | 5,000 | (5) | 1,264,500 | — | — | |||||||||||||||||||||||||||||
| 3/15/2017 | — | — | 12,500 | (5) | 3,161,250 | 25,000(9) | 6,322,500 | |||||||||||||||||||||||||||||
| Mark D. Brazeal |
4/15/2017 | 12,500 | (5) | 3,161,250 | 25,000(9) | 6,322,500 | ||||||||||||||||||||||||||||||
|
Bryan T. Ingram |
||||||||||||||||||||||||||||||||||||
| 3/11/2014 | — | 60,000(7) | 62.02 | 3/10/2021 | 20,000 | (5) | 5,058,000 | — | — | |||||||||||||||||||||||||||
| 12/9/2014 | — | — | 3,000 | (5) | 758,700 | — | — | |||||||||||||||||||||||||||||
| 3/15/2015 | — | — | 12,500 | (5) | 3,161,250 | — | — | |||||||||||||||||||||||||||||
| 3/15/2015 | — | — | 12,500 | (8) | 3,161,250 | — | — | |||||||||||||||||||||||||||||
| 12/15/2015 | — | — | 3,000 | (5) | 758,700 | — | — | |||||||||||||||||||||||||||||
| 3/15/2016 | — | — | 7,500 | (5) | 1,896,750 | — | — | |||||||||||||||||||||||||||||
| 3/15/2016 | — | — | 7,500 | (8) | 1,896,750 | — | — | |||||||||||||||||||||||||||||
| 12/15/2016 | — | — | 5,000 | (5) | 1,264,500 | — | — | |||||||||||||||||||||||||||||
| 3/15/2017 | — | — | 12,500 | (5) | 3,161,250 | 25,000(9) | 6,322,500 | |||||||||||||||||||||||||||||
| (1) | The awards shown in these columns are awards granted under our 2009 Plan unless otherwise noted. |
| (2) | The amounts shown in this column represent the number of ordinary shares that have not vested multiplied by $252.90, the closing price of an ordinary share on October 27, 2017, the last trading day of Fiscal Year 2017. |
| (3) | Represents a performance-based option that vests at the rate of 25% on each anniversary of the grant date, subject to Mr. Tan’s continued employment with us. This performance-based option only became exercisable as to any tranche of 20% of the ordinary shares covered by the option if the share price target applicable to that tranche was met. In order for a share price target to be met, the average of the closing price of our ordinary shares, over a 30 consecutive trading day period, had to equal or exceed the applicable share price target. The share price targets ranged from $50.00 per share to $75.00 per share. All share price targets for this option have been met. |
| (4) | Represents the PSU award granted in Fiscal Year 2016 based on attainment of the maximum performance level, which vests in full upon completion of the three-year performance period, subject to continued employment with us and achievement of performance goals over the performance period, as determined by the Independent Directors within 60 days following the end of the performance period. The Independent Directors will determine the achievement of two factors (i) Relative TSR over the performance period and (ii) share price growth over the performance period, based on 90-day trailing average prices at the start and end of the performance period. Based upon the level of performance achieved, a maximum of 240,000 ordinary shares may be earned under the PSU award. If the minimum performance goals are not met, no ordinary shares will be issued under this award and it will be cancelled. |
| (5) | Represents RSU awards that vest at a rate of 25% per year on each anniversary of the grant date, subject to the NEO’s continued employment with us through the relevant vesting date. |
| (6) | Represents the PSU award granted in Fiscal Year 2017 based on attainment of the maximum performance level. This PSU award vests in two overlapping performance periods; Performance Period #1 ending in 2020 and Performance Period #2 ending in 2021, with each |
51
Table of Contents
| commencing on June 15, 2017. The ordinary shares earned at the end of each Performance Period will be fully vested on the last day of each Performance Period, subject to Mr. Tan’s continued employment with us through each such date. The number of ordinary shares earned during a Performance Period will depend on the level of performance achieved based on our Relative TSR and our absolute TSR over the Performance Periods, as determined by the Independent Directors within 60 days following the end of each Performance Period. Based upon the level of performance achieved, a maximum of 756,000 ordinary shares may be earned under the PSU award. If the minimum performance goals are not met, no ordinary shares will be issued and this award will be cancelled. |
| (7) | Represents performance-based options that vest at the rate of 25% of the ordinary shares subject thereto on each anniversary of the grant date, subject to the NEO’s continued employment with us through the relevant vesting date. The performance-based options were not exercisable until the date on which the average of the closing prices of our ordinary shares, over a 10 consecutive trading day period, is equal to or greater than 120% of the exercise price of the option. The exercisability condition for these options has been met. |
| (8) | Represents PSU awards that are scheduled to vest at the rate of 25% a year on each anniversary of the grant date, subject to the satisfaction of a share price contingency (set at the grant date) and the NEO’s continued employment with us through the relevant vesting date. No ordinary shares will vest until the average closing price per share of our ordinary shares over a 20 consecutive trading day period is equal to or greater than 120% of the fair market value of an ordinary share on the grant date. The share price contingency for this PSU award was met prior to the fourth anniversary of the grant date and therefore all of the ordinary shares subject to the PSU award have the potential to vest (assuming continued service). If the share price contingency was not met by the fourth anniversary of the grant date or the time the executive ceases to provide services to us, the PSU award would not vest and the award would have expired or immediately terminated, as applicable. |
| (9) | Represents a PSU award based on attainment of the maximum performance level. The PSU award will vest at a rate of 25% per year on the later of (i) each anniversary of the grant date and (ii) the last day of the performance period, subject to the NEO’s continued employment with us through the relevant vesting date and subject to the achievement of specified performance goals over each performance period, as determined by the Compensation Committee within 60 days following the end of each performance period. The performance criteria is based on our Relative TSR over four performance periods beginning on the grant date and ending on each of March 14 of 2018, 2019, 2020 and 2021. The number of ordinary shares that may be earned is capped at one-quarter of the target number of ordinary shares for each of the first three performance periods. In the aggregate, the NEO may earn up to 200% of the total target number of ordinary shares, if at the end of the fourth performance period our Relative TSR is at or above the 75th percentile of the S&P 500 and our absolute TSR is not negative. If the minimum performance goals are not met, no ordinary shares will be issued and this award will be cancelled. |
| (10) | Represents an option assumed in connection with the acquisition of LSI and issued under the LSI Corporation 2003 Equity Incentive Plan (the “LSI Plan”). This option vests in four annual installments of 25% each, commencing on approximately the first anniversary of the grant date, subject to the executive’s continued employment with us. |
| (11) | Represents an RSU award assumed in connection with the acquisition of LSI and issued under the LSI Plan. This RSU award vests in four annual installments of 25% each, commencing on approximately the first anniversary of the grant date, subject to the executive’s continued employment with us. |
Fiscal Year 2017 Option Exercises and Share Vested Table
The following table shows information regarding the exercise of share options and the vesting of RSUs during Fiscal Year 2017. Share option award value realized is calculated by subtracting the aggregate exercise price of the share options exercised from the aggregate market value on the date of exercise of the ordinary shares acquired. RSU award value realized is calculated by multiplying the number of ordinary shares shown in the table by the closing market price of our ordinary shares, as reported on the Nasdaq Global Select Market, on the date the RSUs vested. Value Realized on Exercise and Value Realized on Vesting/Release represent long-term gain over multiple years of service by the NEO and it is not considered as part of an NEO’s Fiscal Year 2017 compensation.
| Option Awards | RSU Awards | |||||||||||||||||||
| Name | Number of Shares Acquired on Exercise (#) |
Value Realized on Exercise ($) |
Number of Shares Acquired on Release (#) |
Value Realized on Vesting/Release ($) | ||||||||||||||||
| Hock E. Tan |
170,000 | 33,020,048 | 20,833 | 4,227,073 | ||||||||||||||||
| Thomas H. Krause Jr. |
28,500 | 4,838,590 | 19,500 | 4,342,175 | ||||||||||||||||
| Charlie B. Kawwas, Ph.D. |
30,000 | 3,690,478 | 34,252 | 7,912,678 | ||||||||||||||||
| Mark D. Brazeal |
— | — | — | — | ||||||||||||||||
| Bryan T. Ingram |
92,000 | 16,777,515 | 46,666 | 10,227,446 | ||||||||||||||||
52
Table of Contents
Fiscal Year 2017 Non-Qualified Deferred Compensation Table
The following table sets forth information regarding contributions and earnings under the Avago Technologies U.S. Inc. Deferred Compensation Plan during Fiscal Year 2017 with respect to our NEOs who participated in this plan. This plan was terminated effective May 31, 2016 and all remaining funds were distributed to participants on or before May 31, 2017.
| Name | Executive Contributions in Fiscal Year 2017 ($) |
Registrant Contributions in Fiscal Year 2017 ($) |
Aggregate Earnings in Fiscal Year 2017 ($)(1) |
Aggregate Withdrawals / Distribution ($) |
Aggregate Balance at ($) | ||||||||||||||||||||
| Bryan T. Ingram |
— | — | 2,221 | 25,962 | — | ||||||||||||||||||||
| (1) | Amounts reflected are not included in the “Fiscal Year 2017 Summary Compensation Table” because the earnings are not above-market. These amounts include dividends, interest and changes in market value. |
Severance and Change in Control Agreements with Named Executive Officers; Death and Disability Policy; Employment Arrangements
Severance Benefit Agreements
Each of our NEOs is party to a severance benefits agreement with us. The severance benefit agreements provide each NEO with a severance payment and other benefits in the event of the termination of the NEO’s employment without cause, because of death or permanent disability or a resignation by the NEO for “good reason” (“qualifying termination”), provided that the NEO timely executes a general release of all claims in our favor. If a qualifying termination takes place within 12 months following (or in the case of Mr. Tan, within three months prior to or 12 months following) a “change in control” (as defined in the severance benefit agreement) of our Company, we must provide the NEO with:
| Name | Continued Base Salary |
Bonus(1) | Health Benefits Continuation Coverage |
Equity Award Vesting Acceleration(2) | ||||||||||||||||
| Hock E. Tan |
24 months | 200 | % | — | 100 | % | ||||||||||||||
| Thomas H. Krause, Jr. |
12 months | 100 | % | 12 months | 100 | % | ||||||||||||||
| Charlie B. Kawwas, Ph.D. |
12 months | 100 | % | 12 months | 100 | % | ||||||||||||||
| Mark D. Brazeal |
12 months | 100 | % | 12 months | 100 | % | ||||||||||||||
| Bryan T. Ingram |
12 months | 100 | % | 12 months | 100 | % | ||||||||||||||
| (1) | Bonus payments are calculated using the lesser of the NEO’s prior year’s actual bonus or prior year’s target bonus. |
| (2) | Upon a qualifying termination of an NEO’s employment in connection with a change in control of our Company, the NEO will receive full acceleration of all outstanding service-based equity awards, and acceleration of outstanding performance-based equity awards to the extent (i) the effective price per share paid by the acquirer meets or exceeds any share price contingency applicable to any share-price performance-based awards or (ii) other performance goals have been deemed satisfied, in the discretion of our Board, based on our performance through the date of the change in control, for all other types of performance-based equity awards. |
53
Table of Contents
If the qualifying termination takes place other than in connection with a change in control of our Company, we must provide the NEO with:
| Name | Continued Base Salary |
Bonus(1) | Health Benefits Continuation Coverage |
|||||||||
| Hock E. Tan |
12 months | 100 | % | — | ||||||||
| Thomas H. Krause, Jr. |
9 months | 50 | % | 6 months | ||||||||
| Charlie B. Kawwas, Ph.D. |
9 months | 50 | % | 6 months | ||||||||
| Mark D. Brazeal |
9 months | 50 | % | 6 months | ||||||||
| Bryan T. Ingram |
9 months | 50 | % | 6 months | ||||||||
| (1) | Bonus payments are calculated using the lesser of the NEO’s prior year’s actual bonus or prior year’s target bonus. |
The definition of “change in control” under the severance benefit agreements is the same as the definition of “change in control” under our 2009 Plan, which captures acquisitions of more than 50% of our voting shares by any person or group, as well as the sale of all or substantially all of our assets. Mr. Tan’s severance benefit agreement was approved by our shareholders, as required by Singapore law, at our 2014 Annual General Meeting of Shareholders.
The definition of “good reason” means any of the following: (A) a material reduction in the NEO’s salary (other than as part of a broad salary reduction program instituted because we are in financial distress); (B) a substantial reduction in the NEO’s duties and responsibilities; (C) the elimination or reduction of the NEO’s eligibility to participate in our benefit programs that is inconsistent with the eligibility of our executive employees to participate therein; (D) we inform the executive of our intention to transfer the NEO’s primary workplace to a location that is more than 50 miles from the location of the NEO’s primary workplace as of such date; (E) our material breach of the severance benefits agreement that is not cured within sixty (60) days written notice thereof; and (F) any serious chronic mental or physical illness of the NEO or a member of the NEO’s family that requires the NEO to terminate his or her employment because of substantial interference with the NEO’s duties; provided, that at our request the NEO provides us with a written physician’s statement confirming the existence of such mental or physical illness.
Policy on Acceleration of Executive Staff Equity Awards in the Event of Death or Disability
In September 2015, our Board approved the Death and Disability Policy. This policy was effective immediately upon adoption, and provides for the full acceleration upon an executive’s death or permanent disability of his or her outstanding and unvested equity awards that would otherwise vest solely based on the executive’s continued service, including performance-based equity awards for which the performance criteria have been met as of such date. The Death and Disability Policy applies in the event of the death or permanent disability, of (i) any officer of our Company, as such term is defined in Exchange Act Rule 16a-1, and (ii) any member of our CEO’s executive staff, including the NEOs, as determined by our CEO.
Continuing Employment Agreement – Mr. Ingram
Pursuant to his Letter Agreement, entered into on October 16, 2015, if Mr. Ingram had experienced a qualifying termination during the period commencing on November 2, 2015 and ending on October 31, 2017 (the “Retention Period”) or he elected in writing within 30 days immediately following the end of the Retention Period (the “Election Period”) to resign as of such date, then his outstanding and unvested equity and equity-linked awards that were granted prior to March 15, 2015 and vest solely based upon his continued service, including performance-based awards for which the performance criteria has been met (“Time-Based Awards”), would have vested in full as of such termination date. The Letter Agreement also provided that if Mr. Ingram remained available to provide limited consulting services through the first anniversary of such termination date and refrained from engaging in a competing business or activity during this time (or if he died or became
54
Table of Contents
permanently disabled during such time), then the Time-Based Awards granted on March 15, 2015 and each performance-based award granted on March 15, 2015 for which the performance criteria had been met following his termination date but prior to the first anniversary of the termination date, would have fully vested on the first anniversary of the termination date.
The Letter Agreement further provided that if Mr. Ingram’s employment was terminated as a result of a Covered Termination or he elected in writing during the Election Period to resign as of such date and such termination date occurred after the end of the fiscal year but prior to the payment date of his cash bonus under the APB Plan in effect for that year, then he would have been entitled to receive his cash bonus, based upon actual performance under the APB Plan in effect on the bonus payment date. Mr. Ingram did not make such an election during the Election Period and, as such, effective as of December 1, 2017, the Letter Agreement terminated by its terms.
Potential Severance Payments and Benefits upon Certain Terminations of Employment
The following table reflects the potential payments and benefits to which the NEOs would be entitled under their severance benefits agreements in effect as of the end of Fiscal Year 2017, in the event of a qualifying termination taking place not in connection with a change in control of our Company. The amounts presented in the table assume an employment termination date of October 29, 2017 and that all eligibility requirements contemplated by the NEO’s respective agreements or our policies and practices, as applicable, were met.
| Name | Cash Severance Base Salary ($) |
Cash Severance Bonus ($) |
Health Benefits Continuation Coverage ($)(1) |
Value of Options Acceleration ($)(2) |
Value of RSU Acceleration ($)(3) |
Total ($) |
|||||||||||||||||||||||||||||
| Hock E. Tan |
1,100,000 | 1,650,000 | — | — | — | 2,750,000 | |||||||||||||||||||||||||||||
| Thomas H. Krause Jr. |
300,000 | 150,000 | 10,566 | — | — | 460,566 | |||||||||||||||||||||||||||||
| Charlie B. Kawwas, Ph.D. |
366,397 | 183,198 | 11,327 | — | — | 560,922 | |||||||||||||||||||||||||||||
| Mark D. Brazeal |
337,500 | 135,000 | 10,419 | — | — | 482,919 | |||||||||||||||||||||||||||||
| Bryan T. Ingram |
444,188 | 296,125 | 10,356 | 11,452,800 | (4) | 5,816,700 | (4) | 18,020,169 | |||||||||||||||||||||||||||
| (1) | Represents the cost of our subsidized continued health benefits, based on our current costs to provide such coverage. |
| (2) | The amount in this column represent, for each share option that would have accelerated, the number of ordinary shares that would have vested multiplied by the difference between $252.90, the closing price per ordinary share on October 27, 2017, the last trading day of Fiscal Year 2017, and the exercise price of the share option. As of such date, all share price contingencies contained in any outstanding performance-based options had been met and all such share options would have accelerated in the event of a qualifying termination. |
| (3) | Includes, for each service-based RSU award, the number of ordinary shares that would have vested multiplied by $252.90, the closing price per ordinary share on October 27, 2017, the last trading day of Fiscal Year 2017. As of such date, all such awards would have accelerated in the event of a qualifying termination. |
| (4) | The letter agreement pursuant to which such acceleration could have occurred expired effective December 1, 2017. |
55
Table of Contents
Potential Severance Payments and Benefits upon Certain Terminations of Employment in Connection with a Change in Control
The following table reflects the potential payments and benefits to which the NEOs would be entitled under their severance benefits agreements in effect as of the end of Fiscal Year 2017 in the event of a qualifying termination taking place within 12 months following a change in control of our Company (or in the case of Mr. Tan three months before or 12 months following a change in control of our Company). The amounts presented in the table assume an employment termination date of October 29, 2017 and that all eligibility requirements contemplated by the NEO’s respective agreements and our policies and practices, as applicable, were met.
| Name | Cash Severance Base Salary ($) |
Cash Severance Bonus ($) |
Health Benefits Continuation Coverage ($)(1) |
Value of Options Acceleration ($)(2) |
Value of RSU/PSU Acceleration ($)(3) |
Total ($) |
||||||||||||||||||||
| Hock E. Tan |
2,200,000 | 3,300,000 | — | 37,546,875 | 146,762,422 | (4) | 189,809,297 | |||||||||||||||||||
| Thomas H. Krause Jr. |
400,000 | 300,000 | 21,132 | 4,294,800 | 22,980,011 | (5) | 27,995,943 | |||||||||||||||||||
| Charlie B. Kawwas, Ph.D. |
488,529 | 366,397 | 22,654 | 5,969,854 | 23,007,578 | (5) | 29,855,012 | |||||||||||||||||||
| Mark D. Brazeal |
450,000 | 270,000 | 20,838 | — | 8,438,261 | (5) | 9,179,099 | |||||||||||||||||||
| Bryan T. Ingram |
592,250 | 592,250 | 20,712 | 11,452,800 | 26,394,161 | (5) | 39,052,173 | |||||||||||||||||||
| (1) | Represents the cost of our subsidized continued health benefits based on our current costs to provide such coverage. |
| (2) | The amounts in this column represent, for each share option that would have accelerated, the number of ordinary shares that would have vested multiplied by the difference between $252.90, the closing price per ordinary share on October 27, 2017, the last trading day of Fiscal Year 2017, and the exercise price of the share option. As of such date, all share price contingencies contained in any outstanding performance-based options had been met and all such share options would have accelerated in the event of a qualifying termination. |
| (3) | The amounts in this column include, for each service-based RSU award and PSU award subject to a share price contingency that had been met, the number of ordinary shares that would have vested multiplied by $252.90, the closing price per ordinary share on October 27, 2017, the last trading day of Fiscal Year 2017. As of such date, all share price contingencies had been met and all such awards would have accelerated in the event of a qualifying termination. |
| (4) | This amount includes, for each PSU award for which the applicable performance goals have been deemed satisfied based on our actual performance immediately prior to October 27, 2017, the last trading day of Fiscal Year 2017, that would have accelerated, the number of ordinary shares that would have vested multiplied by $252.90, the closing price per ordinary share on October 27, 2017. As of such date, 240,000 ordinary shares and 334,308 ordinary shares subject to the PSU awards granted in Fiscal Year 2016 and Fiscal Year 2017, respectively, would have accelerated in the event of a qualifying termination. |
| (5) | This amount includes, for each PSU award for which the applicable performance goals have been deemed satisfied based on our actual performance immediately prior to October 27, 2017, the last trading day of Fiscal Year 2017, that would have accelerated, the number of ordinary shares that would have vested multiplied by $252.90, the closing price per ordinary share on October 27, 2017. As of such date, 167% of the target ordinary shares subject to the PSU awards, would have accelerated in the event of a qualifying termination. |
56
Table of Contents
Potential Payments under the Death and Disability Policy
The following table reflects the potential payments and benefits to which the NEOs would be entitled under the Death and Disability Policy in effect as of October 29, 2017, in the event of death or permanent disability. The amounts presented in the table assume a termination of employment date of October 29, 2017 and that all eligibility requirements contemplated by the Death and Disability Policy were met.
| Name |
Value of Option Acceleration ($)(1) |
Value of RSU/PSU Acceleration ($)(2)(3) |
Total ($) |
|||||||||||||||||
| Hock E. Tan |
37,546,875 | 22,763,529 | (4) | 60,310,404 | ||||||||||||||||
| Thomas H. Krause Jr. |
4,294,800 | 17,703,000 | 21,997,800 | |||||||||||||||||
| Charlie B. Kawwas, Ph.D. |
5,969,854 | 17,730,566 | 23,700,420 | |||||||||||||||||
| Mark D. Brazeal |
— | 3,161,250 | 3,161,250 | |||||||||||||||||
| Bryan T. Ingram |
11,452,800 | 21,117,150 | 32,569,950 | |||||||||||||||||
| (1) | The amounts in this column represent, for each option that would have accelerated, the number of ordinary shares that would have vested multiplied by the difference between $252.90, the closing price per ordinary share on October 27, 2017, the last trading day of Fiscal Year 2017, and the exercise price of the option. As of such date, all share price contingencies contained in any outstanding performance-based options had been met and all such share options would have accelerated in the event of death or permanent disability. |
| (2) | The amounts in this column include for each service-based RSU award and PSU award subject to a share price contingency that had been met, the number of ordinary shares that would have vested multiplied by $252.90, the closing price per ordinary share on October 27, 2017, the last trading day of Fiscal Year 2017. As of such date, all share price contingencies had been met and all such awards would have accelerated. |
| (3) | This amount does not include accelerations of the PSU awards subject to performance goals based on criteria other than share price contingencies, except as noted below, as these awards are not eligible for acceleration upon death or permanent disability. |
| (4) | This amount includes the acceleration of the PSU award granted in Fiscal Year 2017 with respect to 50% of the target number of ordinary shares for each performance period multiplied by $252.90, the closing price per ordinary share on October 27, 2017, the last trading day of Fiscal Year 2017. |
57
Table of Contents
EQUITY COMPENSATION PLAN INFORMATION
Plans Approved by our Shareholders
We have two equity compensation plans that have been approved by our shareholders: the 2009 Plan and the ESPP.
Plans Not Approved by our Shareholders
As at October 29, 2017, we had two equity compensation plans that had not been approved by our shareholders and pursuant to which we may continue to grant equity awards: the LSI Plan, which we assumed in connection with our acquisition of LSI, and the BRCM 2012 Stock Incentive Plan (the “2012 Plan”), which we assumed in connection with our acquisition of BRCM. We have also assumed outstanding equity awards granted under the LSI Plan, the 2012 Plan and under other equity compensation plans or agreements that were assumed by us in connection with our acquisitions of LSI and BRCM and other companies that originally granted those awards.
The following table sets forth the number and weighted-average exercise price of ordinary shares to be issued upon exercise of outstanding share options and RSUs, and the number of securities remaining available for future issuance under all of our equity compensation plans, as at October 29, 2017.
| Plan Category | Number of Ordinary (a) |
Weighted-Average Exercise Price of Outstanding Options, Warrants and Rights ($) (b)(1) |
Number of Ordinary Shares (c) | |||||||
| Equity Compensation plans approve by shareholders |
14,711,780 | (2) | $46.26 | 19,016,705 (3) | ||||||
| Employee stock purchase plans approved by shareholders |
7,962,854 (4) | |||||||||
| Equity compensation plans not approved by shareholders |
13,717,730 | (5) | $73.32 | 85,743,067 (6)(7) | ||||||
| Total |
28,429,510 | $49.54 | 112,722,626 (3)(7) | |||||||
| (1) | Ordinary shares issuable upon vesting of RSUs have been excluded from the calculation of the weighted average exercise price because they have no exercise price associated with them. |
| (2) | Represents 9,156,544 ordinary shares subject to outstanding share options and 5,555,236 ordinary shares that may be issued upon vesting of outstanding RSUs (including PSUs assuming the maximum performance level), in each case pursuant to equity awards issued under the 2009 Plan. |
| (3) | The 2009 Plan has an automatic annual share renewal formula pursuant to which the aggregate number of ordinary shares available for issuance under the 2009 Plan increases automatically on the first day each fiscal year by the least of (i) 6,000,000 ordinary shares, (ii) 3% of the ordinary shares outstanding on the last day of the immediately preceding fiscal year and (iii) such smaller number of ordinary shares as determined by our Board. In accordance with this formula, on October 30, 2017 (the first day of our Fiscal Year 2018), the number of ordinary shares available for future issuance under the 2009 Plan increased by 6,000,000 ordinary shares, which is not reflected in the table. |
| (4) | The ESPP has an automatic annual share renewal formula pursuant to which the aggregate number of ordinary shares available for issuance under the ESPP increases automatically on the first day each fiscal year by the least of (i) 2 million ordinary shares, (ii) 1% of the ordinary shares outstanding on the last day of the immediately preceding fiscal year and (iii) such smaller number of ordinary shares as determined by our Board. Our Board determined not to increase the number of ordinary shares available for issuance under the ESPP for Fiscal Year 2018. |
| (5) | Represents (i) 1,260,770 ordinary shares subject to options and 2,078,798 ordinary shares that may be issued upon vesting of RSUs, all of which were awarded under the LSI Plan, (ii) 10,369,624 ordinary shares that may be issued upon vesting of RSUs (including PSUs assuming the maximum performance level), all of which were awarded under |
58
Table of Contents
| the 2012 Plan, and (iii) 814 ordinary shares subject to share options and 7,724 ordinary shares that may be issued upon vesting of RSUs issued pursuant to other equity compensation plans and agreements assumed by us in connection with our acquisition of LSI, BRCM and other companies that originally established those plans or agreements. |
| (6) | Represents ordinary shares available for issuance under the LSI Plan and the 2012 Plan, of which 1,448,137 ordinary shares and 81,930,261 ordinary shares, respectively, may be used for RSU awards. |
| (7) | The 2012 Plan has an automatic annual share renewal provision pursuant to which the aggregate number of ordinary shares available for issuance under the 2012 Plan increases automatically on the first trading day of January each calendar year by 12,195,965 ordinary shares. In accordance with this provision, on January 2, 2018 (the first trading day in January 2018), the number of ordinary shares available for future issuance under the 2012 Plan increased by 12,195,965 ordinary shares, which is not reflected in the table. |
For additional information regarding our equity compensation plans, please refer to Note 9 of Notes to Consolidated Financial Statements included in Part II, Item 8 of our 2017 Form 10-K.
59
Table of Contents
The Audit Committee is responsible for assisting the Board of Directors with its oversight responsibilities regarding the following:
| • | the quality and integrity of Broadcom Limited’s (the “Company”) financial statements and internal controls; |
| • | the appointment, compensation, retention, qualifications and independence of the Company’s independent registered public accounting firm; |
| • | the performance of the Company’s internal audit function and independent registered public accounting firm; |
| • | the Company’s compliance with legal and regulatory requirements; and |
| • | related party transactions. |
In fulfilling its oversight responsibilities, the Audit Committee reviewed and discussed the Company’s financial statements for the fiscal year ended October 29, 2017 (“Fiscal Year 2017”) with the Company’s management and PricewaterhouseCoopers LLP, the Company’s independent registered public accounting firm. In addition, the Audit Committee has discussed with PricewaterhouseCoopers LLP, with and without management present, the Company’s internal controls over financial reporting and overall quality of the Company’s financial reporting. The Audit Committee also discussed with PricewaterhouseCoopers LLP the matters required to be discussed by Auditing Standard No. 1301, “Communications with Audit Committees,” issued by the Public Company Accounting Oversight Board. The Audit Committee also received the written disclosures and the letter from PricewaterhouseCoopers LLP required by the applicable requirements of the Public Company Accounting Oversight Board regarding the independent accountant’s communications with the Audit Committee concerning independence, and has discussed the independence of PricewaterhouseCoopers LLP with that firm. The Audit Committee’s policy is to pre-approve all audit and permissible non-audit services provided by the Company’s independent registered public accounting firm. All audit and non-audit services performed by our independent registered public accounting firm during Fiscal Year 2017 were pre-approved by the Audit Committee in accordance with established procedures.
Based on the Audit Committee’s review and discussions noted above, as well as such other matters deemed relevant and appropriate by the Audit Committee, the Audit Committee recommended to the Board that the audited financial statements for Fiscal Year 2017 be included in the Company’s Annual Report on Form 10-K for Fiscal Year 2017 for filing with the Securities and Exchange Commission.
The Audit Committee and the Board of Directors have approved, subject to shareholder approval, the selection of PricewaterhouseCoopers LLP as the Company’s independent registered public accounting firm and independent Singapore auditor for the fiscal year ending November 4, 2018.
Submitted by the Audit Committee of the Board of Directors:
Donald Macleod, Chairperson
Gayla J. Delly(1)
Eddy W. Hartenstein
Peter J. Marks
| (1) | Ms. Delly joined the Audit Committee in December 2017. |
60
Table of Contents
SECURITY OWNERSHIP OF CERTAIN BENEFICIAL OWNERS,
DIRECTORS AND EXECUTIVE OFFICERS
The following table sets forth information about (i) the beneficial ownership of our ordinary shares and the Restricted Units in the Partnership, the holders of which are entitled to vote an equal number of our Special Voting Shares, and (ii) aggregate voting power at February 12, 2018 for:
| • | each named executive officer; |
| • | each of our directors and nominees for director; |
| • | each person known to us to be the beneficial owner of more than 5% of our ordinary shares or of the Restricted Units; and |
| • | all of our executive officers and directors as a group. |
We have determined beneficial ownership in accordance with the rules of the SEC. Except as indicated by the footnotes below, we believe, based on the information furnished to us, that the persons and entities named in the table below have sole voting and investment power with respect to all ordinary shares and Restricted Units that they beneficially own.
The terms of the Restricted Units are governed by the Amended and Restated Exempted Limited Partnership Agreement dated February 1, 2016, of the Partnership. Holders of Restricted Units are entitled to direct the Trustee to vote one Special Voting Share for each Restricted Unit that they hold, pursuant to the terms of the Voting Trust. The Trustee is the sole registered shareholder of the 22,097,111 Special Voting Shares outstanding as at February 12, 2018, and the number of Special Voting Shares outstanding is equal to the number of outstanding Restricted Units as at such date. As of February 1, 2017, holders of Restricted Units have the right to exchange their Restricted Units for cash or our ordinary shares, at our discretion. If an exchange is settled in ordinary shares, the holder will receive one ordinary share for each exchanged Restricted Unit.
Ordinary shares subject to options that are currently exercisable or exercisable within 60 days of February 12, 2018 and RSUs that vest within 60 days of February 12, 2018 are deemed to be outstanding and to be beneficially owned by the person holding the equity award for the purpose of computing the percentage ownership of that person but are not treated as outstanding for the purpose of computing the percentage ownership of any other person.
61
Table of Contents
In the table below, percentage ownership is based on 410,487,054 ordinary shares and 22,097,111 Restricted Units outstanding as of February 12, 2018. Total percentage of voting power assumes that all holders of Restricted Units provide proper voting instructions to the Trustee in respect of their corresponding Special Voting Shares, and is based on an aggregate of 432,584,165 ordinary shares and Special Voting Shares outstanding as of February 12, 2018.
|
Voting Securities Beneficially Owned(1) |
||||||||||||||||||||||||
| Name and Address of Beneficial Owner |
Number of Ordinary Shares |
Percentage of Ordinary Shares |
Number of Restricted Units |
Percentage |
Total Shares Beneficially Owned |
Total Percentage of Voting Power(2) |
||||||||||||||||||
| 5% Shareholders:
|
||||||||||||||||||||||||
| Capital World Investors(3) |
43,340,719 | 10.6% | — | — | 43,340,719 | 10.0% | ||||||||||||||||||
| 333 South Hope Street |
||||||||||||||||||||||||
| Los Angeles, CA 90071
|
||||||||||||||||||||||||
| The Vanguard Group(4) |
28,923,720 | 7.0% | — | — | 28,923,720 | 6.7% | ||||||||||||||||||
| 100 Vanguard Blvd. |
||||||||||||||||||||||||
| Malvern, PA 19355 |
||||||||||||||||||||||||
| BlackRock, Inc. (5) |
24,924,721 | 6.1% | — | — | 24,924,721 | 5.8% | ||||||||||||||||||
| 55 East 52nd Street |
||||||||||||||||||||||||
| New York, NY 10055
|
||||||||||||||||||||||||
| Capital Research Global Investors(6) |
24,332,311 | 5.9% | — | — | 24,332,311 | 5.6% | ||||||||||||||||||
| 333 South Hope Street |
||||||||||||||||||||||||
| Los Angeles, CA 90071
|
||||||||||||||||||||||||
| Henry T. Nicholas III(7) |
— | — | 11,457,605 | 51.9% | 11,457,605 | 2.6% | ||||||||||||||||||
| 15 Enterprise Suite 550 |
||||||||||||||||||||||||
| Aliso Viejo, CA 92656
|
||||||||||||||||||||||||
| Named Executive Officers, Directors |
||||||||||||||||||||||||
| Hock E. Tan(8) |
2,504,493 | * | — | — | 2,504,493 | * | ||||||||||||||||||
| Thomas H. Krause, Jr.(9) |
57,215 | * | — | — | 57,215 | * | ||||||||||||||||||
| Charles B. Kawwas, Ph.D. (10) |
71,638 | * | — | — | 71,638 | * | ||||||||||||||||||
| Henry Samueli, Ph.D.(11) |
126,468 | * | 9,514,984 | 43.1% | 9,641,452 | 2.2% | ||||||||||||||||||
| Mark D. Brazeal |
— | — | — | — | — | — | ||||||||||||||||||
| Bryan T. Ingram(12) |
116,570 | * | — | — | 116,570 | * | ||||||||||||||||||
| Gayla J. Delly |
— | — | — | — | — | — | ||||||||||||||||||
| James V. Diller(13) |
143,397 | * | — | — | 143,397 | * | ||||||||||||||||||
| Lewis C. Eggebrecht(14) |
12,647 | * | — | — | 12,647 | * | ||||||||||||||||||
| Kenneth Y. Hao(15) |
1,708,951 | * | — | — | 1,708,951 | * | ||||||||||||||||||
| Eddy W. Hartenstein(16) |
34,141 | * | — | — | 34,141 | * | ||||||||||||||||||
| Check Kian Low(17) |
1,294 | * | — | — | 1,294 | * | ||||||||||||||||||
| Donald Macleod(18) |
58,981 | * | — | — | 58,981 | * | ||||||||||||||||||
| Peter J. Marks(19) |
32,205 | * | — | — | 32,205 | * | ||||||||||||||||||
| All 15 executive officers and directors as |
4,887,798 | 1.2% | 9,514,984 | 43.1% | 14,402,782 | 3.3% | ||||||||||||||||||
| * | Represents beneficial ownership of less than 1%. |
| (1) | Amounts shown in the table above include securities held in the beneficial owner’s name or jointly with others, or in the name of a bank, nominee or trustee for the beneficial owner’s account. |
| (2) | Ordinary shares and Special Voting Shares are entitled to one vote per share and vote as a single class on all matters except any amendment to our Constitution that adversely affects the voting rights of the Special Voting Shares. |
62
Table of Contents
| (3) | Number of ordinary shares is based solely on information reported by Capital World Investors on the Schedule 13G/A filed with the SEC on February 14, 2018, reporting ownership as of December 31, 2017. According to such Schedule 13G/A, Capital World Investors has sole voting power and sole dispositive power over these shares. Ownership percentage assumes the shareowner continued to own the number of shares reflected in the table above on February 12, 2018. |
| (4) | Number of shares is based solely on information reported by The Vanguard Group on the Schedule 13G/A filed with the SEC on February 12, 2018, reporting ownership as of December 31, 2017. According to such Schedule 13G/A, The Vanguard Group has sole voting power over 581,625 of these shares, sole dispositive power over 28,269,362 of these shares, shared voting power over 87,332 of these shares and shared dispositive power over 654,358 of these shares. Ownership percentage assumes the shareowner continued to own the number of shares reflected in the table above on February 12, 2018. |
| (5) | Number of shares is based solely on information reported by BlackRock, Inc. on the Schedule 13G/A filed with the SEC on January 30, 2018, reporting ownership as of December 31, 2017. According to such Schedule 13G/A, BlackRock, Inc. has sole dispositive power over these shares and sole voting power over 21,260,683 of these shares. Ownership percentage assumes the shareowner continued to own the number of shares reflected in the table above on February 12, 2018. |
| (6) | Number of shares is based solely on information reported by Capital Research Global Investors on the Schedule 13G/A filed with the SEC on February 14, 2018, reporting ownership as of December 31, 2017. According to such Schedule 13G/A, Capital Research Global Investors has sole voting power and sole dispositive power over these shares. Ownership percentage assumes the shareowner continued to own the number of shares reflected in the table above on February 12, 2018. |
| (7) | Shares in the table represent 11,456,699 Restricted Units held by Nicholas Technology Holding Trust and 302 Restricted Units held by each of (i) Henry T. Nicholas III Custodian Robert Brett Nicholas UGMA, (ii) Henry T. Nicholas III Custodian Shelby Vanessa Nicholas UGMA and (iii) Henry T. Nicholas III Custodian Matthew Carter Nicholas UGMA. Dr. Nicholas has dispositive power over these Restricted Units and power to direct the vote of the Special Voting Shares associated with these Restricted Units pursuant to the Voting Trust. |
| (8) | Shares shown in the table above include 2,399,166 shares that Mr. Tan has the right to acquire within 60 days after February 12, 2018 upon the exercise of share options. |
| (9) | Shares shown in the table above include 22,500 shares that Mr. Krause has the right to acquire within 60 days after February 12, 2018 upon the exercise of share options and 20,625 shares that he has the right to acquire within 60 days after February 12, 2018 upon the vesting of RSUs. These shares do not include any shares that may be earned pursuant to a PSU award for the performance period ending March 15, 2018. |
| (10) | Shares shown in the table above include 39,330 shares that Dr. Kawwas has the right to acquire within 60 days after February 12, 2018 upon the exercise of share options and 20,984 shares that he has the right to acquire within 60 days after February 12, 2018 upon the vesting of RSUs. These shares do not include any shares that may be earned pursuant to a PSU award for the performance period ending March 15, 2018. |
| (11) | The shares in the table include 6,519 shares that Dr. Samueli has the right to acquire within 60 days after February 12, 2018 upon the vesting of RSUs, but does not include any shares that may be earned pursuant to a PSU award for the performance period ending March 15, 2018. Shares in the table also include (i) 5,752,978 Restricted Units held by HS Portfolio L.P., (ii) 399,918 Restricted Units held by HS Management, L.P., (iii) 459,690 Restricted Units held by H&S Portfolio II L.P., (iv) 2,722,869 Restricted Units held by H&S Investments I L.P., (v) 62,010 Restricted Units held by HS REU LLC, of which 21,951.54 Restricted Units and 40,058.46 Restricted Units are beneficially owned by H&S Investments I L.P. and the Henry Samueli 2016 GRAT, a trust for the benefit of Dr. Samueli, respectively, through their ownership of membership interests in HS REU LLC, (vi) 62,010 Restricted Units held by SFS REU LLC, of which 21,951.54 Restricted Units and 40,058.46 Restricted Units are beneficially owned by H&S Investments I L.P. and the Susan Faye Samueli 2016 GRAT, a trust for the benefit of Dr. Samueli’s spouse, respectively, through their ownership of membership interests in SFS REU LLC, (vii) 1,860 Restricted Units held by H&S Ventures LLC and (viii) 53,649 Restricted Units held directly by Dr. Samueli. Dr. Samueli disclaims beneficial ownership of the shares held by HS Portfolio L.P. and HS Management, L.P., except to the extent of his pecuniary interest therein. H&S Ventures LLC is the general partner of HS Management, L.P., HS Portfolio L.P., H&S Portfolio II, L.P and H&S Investments I, L.P. (collectively, the “H&S Partnerships”). As the indirect owner of H&S Ventures LLC, Dr. Samueli has sole dispositive power over the Restricted Units held by the H&S Partnerships and H&S Ventures LLC, and sole power to direct the vote of the Special Voting Shares associated with these Restricted Units pursuant to the Voting Trust. Dr. Samueli also has sole dispositive power of the Restricted Units held by the HS REU LLC and SFS REU LLC, and sole power to direct the vote of the Special Voting Shares associated with these Restricted Units pursuant to the Voting Trust. |
63
Table of Contents
| (12) | Shares shown in the table above include 60,000 shares that Mr. Ingram has the right to acquire within 60 days after February 12, 2018 upon the exercise of share options and 40,625 shares that he has the right to acquire within 60 days after February 12, 2018 upon the vesting of RSUs. These shares do not include any shares that may be earned pursuant to a PSU award for the performance period ending March 15, 2018. |
| (13) | Shares shown in the table above include 119,500 shares held by the James & June Diller Trust UA dated 7/20/77 and 906 shares that Mr. Diller has the right to acquire within 60 days after February 12, 2018 upon the vesting of RSUs. |
| (14) | Shares shown in the table above include (i) 1,500 shares held by the Lewis & Rebecca Eggebrecht Trust UA dated 6/21/97, (ii) 5,121 shares that Mr. Eggebrecht has the right to acquire within 60 days after February 12, 2018 upon the exercise of share options and (iii) 906 shares that he has the right to acquire within 60 days after February 12, 2018 upon the vesting of RSUs. |
| (15) | Amounts disclosed for Mr. Hao include (i) 1,587,737 shares held by SLP Argo I Ltd. (“Argo I”) and (ii) 30,830 shares held by SLP Argo II Ltd (“Argo II”). |
| Silver Lake Partners IV Cayman (AIV II), L.P. (the “Main Fund”) is the sole shareholder of Argo I. Silver Lake Technology Investors IV Cayman, L.P. (the “Side Fund”) is the sole shareholder of Argo II. Silver Lake Technology Associates IV Cayman, L.P. (the “Lower GP”) is general partner of each of the Main Fund and the Side Fund. Silver Lake (Offshore) AIV GP IV, Ltd. (the “Upper GP”) is the general partner of the Lower GP. Argo I, Argo II, the Main Fund, the Side Fund, the Lower GP and the Upper GP are collectively referred to as the “Silver Lake Entities”. Mr. Hao is a director of the Upper GP. Mr. Hao disclaims beneficial ownership of any shares beneficially owned by the Silver Lake Entities, except to the extent of his pecuniary interest therein. |
| Shares shown in the table also include (i) 64,816 shares acquired by Mr. Hao upon the exercise of a share option, (ii) 9,567 shares acquired by him upon the vesting of RSUs granted to him, (iii) 15,077 shares that he has the right to acquire within 60 days after February 12, 2018 upon the exercise of share options, and (iv) 906 shares that he has the right to acquire within 60 days after February 12, 2018 upon the vesting of RSUs. |
| Pursuant to Mr. Hao’s arrangement with Upper GP with respect to director compensation in the form of securities received by him in his capacity as a representative of Upper GP, he is required to remit the proceeds from the sale of such securities to Upper GP. Accordingly, Mr. Hao disclaims beneficial ownership of the shares described above, except to the extent of his pecuniary interest therein, except for 18 shares, which are held by his family limited partnership, and 9,854 shares that he has the right to acquire upon the exercise of a vested share option. |
| (16) | Shares shown in the table above include 906 shares that Mr. Hartenstein has the right to acquire within 60 days after February 12, 2018 upon the vesting of RSUs. |
| (17) | Shares shown in the table above include 906 shares that Mr. Low has the right to acquire within 60 days after February 12, 2018 upon the vesting of RSUs. |
| (18) | Shares shown in the table above include 5,223 shares that Mr. Macleod has the right to acquire within 60 days after February 12, 2018 upon the exercise of share options and 906 shares that he has the right to acquire within 60 days after February 12, 2018 upon the vesting of RSUs. |
| (19) | Shares shown in the table above include 906 shares that Mr. Marks has the right to acquire within 60 days after February 12, 2018 upon the vesting of RSUs. |
| (20) | Shares shown in the table above include 2,554,667 shares that directors and executive officers have the right to acquire within 60 days after February 12, 2018 upon the exercise of share options and 104,994 shares that directors and executive officers have the right to acquire within 60 days after February 12, 2018 upon the vesting of RSUs. These shares do not include any shares that may be earned by our executive officers pursuant to their respective PSU awards for the performance period ending March 15, 2018. |
64
Table of Contents
CERTAIN RELATIONSHIPS AND RELATED PARTY TRANSACTIONS
Related Party Transactions
Other than compensation and other arrangements described above under “Directors’ Compensation,” “Executive Compensation” and as set forth below, since October 31, 2016, there was not, nor is there currently planned, any transaction or series of similar transactions to which we were or will be a party in which:
| • | the amount involved exceeded or will exceed $120,000; and |
| • | any director, nominee, executive officer, holder of more than 5% of our ordinary shares or the Restricted Units of the Partnership, or any member of their immediate family had or will have a direct or indirect material interest. |
We refer to these types of transactions as “related party transactions.”
Procedures for Approval of Related Party Transactions
As provided by our Audit Committee Charter, the Audit Committee must review all related party transactions on an ongoing basis and all such transactions must be approved by the Audit Committee. The Audit Committee may delegate to one or more designated members of the committee the authority to pre-approve related party transactions, provided such approvals are presented to the Audit Committee at its next scheduled meeting. In approving or rejecting the proposed transaction, the Audit Committee considers the relevant facts and circumstances available and deemed relevant to the Audit Committee, including, but not limited to the risks, costs and benefits to us, the terms of the transaction, the availability of other sources for comparable services or products, and, if applicable, the impact on a director’s independence. Our written Code of Ethics and Business Conduct requires that directors, officers and employees make appropriate disclosure of potential conflicts of interest to (i) the Nominating and Corporate Governance Committee or the Audit Committee, in the case of directors and officers, or (ii) to their supervisor, in the case of employees, who will then seek authorization from our compliance officer. Our Board has authority to approve related party transactions in lieu of the Audit Committee.
Note Purchase Agreement with Silver Lake
In connection with our proposed acquisition of Qualcomm (the “Qualcomm Acquisition”), on February 11, 2018, Broadcom and our newly formed Delaware subsidiary corporation (also named Broadcom Limited and referred to as “Broadcom-Delaware”) entered into a Note Purchase Agreement (“Purchase Agreement”) to sell to Silver Lake Partners V, L.P., an investment fund affiliated with Silver Lake (“SLP Fund”), and the other purchasers named therein $6 billion aggregate principal amount of Broadcom-Delaware’s 3.00% Convertible Senior Notes due seven years from the date of original issuance (the “Convertible Notes”), with $3.5 billion principal amount of the Convertible Notes being issuable to the SLP Fund. Mr. Hao is a Managing Director of Silver Lake. The proceeds from the issuance of the Convertible Notes will be used to fund a portion of the Qualcomm Acquisition.
The issuance and sale of the Convertible Notes is contingent on the consummation of the Qualcomm Acquisition and related debt financing as well as the satisfaction or waiver of customary closing conditions (the “Convertible Notes Closing”) as set forth in the Purchase Agreement. The Convertible Notes will bear interest at a rate of 3.0% per annum payable semiannually in cash. The initial conversion rate is 3.5415 shares of Broadcom-Delaware common stock per $1,000 principal amount of Convertible Notes, which is equivalent to an initial conversion price of approximately $282.37 per share of Broadcom-Delaware common stock. The conversion rate will be subject to adjustment from time to time upon the occurrence of certain events. Holders may surrender their Convertible Notes for conversion under limited circumstances prior to the date that is three months prior to the maturity date of the Convertible Notes.
Broadcom-Delaware and the other investors, including the SLP Fund, will also enter into a Registration Rights Agreement pursuant to which the investors will have certain registration rights with respect to the Convertible Notes and the shares of Broadcom-Delaware common stock issuable upon conversion of the Convertible Notes.
65
Table of Contents
The issuance of the Convertible Notes, and the terms thereof, and entry into the Purchase Agreement, Registration Rights Agreement and all other agreements relating to the issuance of the Convertible Notes to the investors, including the SLP Fund, were reviewed and approved by our Board with Mr. Hao recused from such review and approval.
Other Relationships
From time to time in the ordinary course of business, on an arm’s length basis, we purchase from, and/or sell to, certain entities where one of our directors also serves or served as a director of that entity. During Fiscal Year 2017 these entities were (i) Benchmark, on whose board of directors Ms. Delly served as a director until September 2016, (ii) Symantec Corporation, on whose board of directors Mr. Hao serves as a director, and (iii) TiVo Corporation and SIRUS XM Holdings, Inc., on whose boards of directors Mr. Hartenstein serves as a director.
From time to time, at our request, representatives of Silver Lake, where Mr. Hao is a Managing Partner and Managing Director, have provided advice and assistance to us in connection with obtaining debt financing for acquisition transactions, given their extensive experience with debt financings of this nature. Silver Lake did not receive any compensation for the provision of such services.
In addition, Silver Lake portfolio companies, such as Dell Inc., have from time to time entered into, and may continue to enter into, arrangements with us to purchase our products or to sell products to us in the ordinary course of their and our business, and on an arms’ length basis and such purchases may be substantial.
SECTION 16(a) BENEFICIAL OWNERSHIP REPORTING COMPLIANCE
Under the securities laws of the United States, our directors, executive officers and any persons holding more than 10 percent of our ordinary shares (“Reporting Persons”) are required to report, to the SEC and to Nasdaq, their initial ownership of our ordinary shares and other equity securities and any subsequent changes in that ownership, and to furnish us with copies of all these reports they file. As a matter of practice, we assist our executive officers and directors in preparing initial ownership reports and reporting ownership changes, and typically file these reports on their behalf.
Based solely on our review of the copies of such reports received by us or written representations from the Reporting Persons, we believe that during Fiscal Year 2017, all Reporting Persons complied with all applicable filing requirements except, due to administrative oversight, a Form 4 for Mr. Hao was not timely filed reflecting ordinary shares issued to Mr. Hao upon exercise of share options. Once the omission was discovered, the filing was promptly made to reflect this transaction.
HOUSEHOLDING OF PROXY MATERIALS
Some banks, brokers and other nominee may be participating in the practice of “householding” proxy statements and annual reports. This means that only one copy of our proxy materials and our 2017 Form 10-K may have been sent to multiple shareholders in your household, unless we have received contrary instructions from one or more shareholders in your household. We will promptly deliver a separate copy of either document to you if you request one by writing or calling as follows: Broadcom Limited, Attn: Investor Relations, 1320 Ridder Park Drive, San Jose, California 95131, U.S.A., Telephone: +1 (408) 433-8000. If you want to receive separate copies of our proxy materials or annual reports in the future, or if you are receiving multiple copies and would like to receive only one copy for your household, you should contact your bank, broker or other nominee, or you may contact us at the above address and phone number.
66
Table of Contents
SHAREHOLDER PROPOSALS FOR THE 2019 ANNUAL GENERAL MEETING
Pursuant to Rule 14a-8 under the Exchange Act, some shareholder proposals may be eligible for inclusion in our 2019 proxy statement. Any such shareholder proposal must be submitted, along with proof of ownership of our ordinary shares in accordance with Rule 14a-8(b)(2), to us at Broadcom Limited, Attention: Chief Legal Officer, 1320 Ridder Park Drive, San Jose, California 95131, U.S.A. We must receive all submissions no later than October 19, 2018. We strongly encourage any shareholder interested in submitting a proposal to contact our Chief Legal Officer in advance of this deadline to discuss the proposal, and shareholders may want to consult legal counsel with regard to the detailed requirements of submitting a shareholder proposal under applicable securities laws. Submitting a shareholder proposal does not guarantee that we will include it in our proxy statement. Our Board will review any shareholder proposals. These shareholder proposals may be included in our proxy statement for the 2019 AGM so long as they are provided to us on a timely basis and satisfy the other conditions set forth in our Constitution and applicable rules and regulations promulgated by the SEC. Shareholder proposals are also currently subject to the requirements of the Singapore Companies Act, as described in the following paragraph. The proxies designated by us will have discretionary authority to vote on any matter properly presented by a shareholder for consideration at the 2019 AGM unless notice of such proposal is received by the applicable deadlines prescribed by the Singapore Companies Act.
In addition, under Section 183 of the Singapore Companies Act, only registered shareholders representing not less than 5% of the total voting rights or registered shareholders representing not fewer than 100 registered shareholders having an average paid up sum of at least $500 Singapore Dollars each may, at their expense, request that we include and give notice of their proposal for the 2019 AGM. Subject to satisfaction of the requirements of Section 183 of the Singapore Companies Act, any such requisition must be signed by all the shareholders making the request and be deposited at our registered office in Singapore, 1 Yishun Avenue 7, Singapore 768923, at least six weeks prior to the date of the 2019 AGM in the case of a request requiring notice of a resolution, or at least one week prior to the date of the 2019 AGM in the case of any other request.
Under our Constitution, no person is eligible for appointment as a director at any general meeting of shareholders (including an incumbent director), without the recommendation of our Board for election, except for persons proposed by (a) a shareholder or shareholders who in aggregate hold(s) more than 50% of the total number of our issued and paid-up shares (excluding treasury shares), which shareholder or shareholders, not less than 10 days before, or (b) a shareholder or shareholders who in aggregate hold(s) more than five percent of the total number of our issued and paid-up shares (excluding treasury shares), which shareholder or shareholders, not less than 120 days before, the date of the notice provided to shareholders in connection with the general meeting, lodges at our registered office in Singapore a written notice signed by such shareholder or shareholders (other than the person to be proposed for appointment), who (i) are qualified to attend and vote at the meeting for which such notice is given, and (ii) have held shares representing the prescribed threshold in (a) or (b) above for a continuous period of at least one year prior to the date on which such notice is given. Such a notice must also include the consent to serve as a director of the person nominated.
Redomiciliation
As we previously announced in November 2017, we have decided to restructure our corporate group to cause the parent company of the group to be a Delaware corporation. We are seeking our shareholders’ approval at a special meeting of a Scheme of Arrangement under Singapore law pursuant to which, upon effectiveness, Broadcom-Delaware will become the publicly traded parent of the Broadcom corporate group, thereby effecting this restructuring. A separate proxy statement will be mailed to shareholders in connection with that special meeting. The Scheme of Arrangement provides for the exchange of shareholders’ ordinary shares for shares of common stock of Broadcom-Delaware on a one-for-one basis. Broadcom-Delaware will be the successor to our Company for SEC and financial reporting purposes under the Exchange Act following this restructuring.
67
Table of Contents
We presently expect to complete our restructuring after the date of the 2018 AGM and prior to the date of our 2019 AGM. In such event:
| • | Broadcom-Delaware will provide notice of its 2019 annual stockholder meeting in accordance with Rule 14a-8 under the Exchange Act and the Delaware General Corporation Law (the “DGCL”); |
| • | Broadcom-Delaware stockholders will be entitled to present proposals for consideration at future Broadcom-Delaware stockholders’ meetings provided that they comply with the proxy rules promulgated by the SEC, the Broadcom-Delaware certificate of incorporation and bylaws and the DGCL; and |
| • | The deadline for submission of all stockholder proposals to be considered for inclusion in Broadcom-Delaware’s proxy statement for its 2019 annual meeting is expected to be October 19, 2018, the same as set forth above for our Company, and the procedures and time periods with respect to the submission of proposals required by Broadcom-Delaware’s bylaws and the DGCL will apply. |
INCORPORATION OF CERTAIN DOCUMENTS BY REFERENCE
We incorporate by reference the following sections of our 2017 Form 10-K:
| • | Item 7, “Management’s Discussion and Analysis of Financial Condition and Results of Operations”; |
| • | Item 7A, “Quantitative and Qualitative Disclosures About Market Risk”; and |
| • | Item 8, “Financial Statements and Supplementary Data.” |
The information contained under the captions “Compensation Committee Report” and “Audit Committee Report” in this Proxy Statement shall not be deemed to be “soliciting material” or to be “filed” with the SEC, nor shall such information be incorporated by reference into any filings under the U.S. Securities Act of 1933, as amended, or under the Exchange Act, or be subject to the liabilities of Section 18 of the Exchange Act, except to the extent that we specifically incorporate this information by reference into any such filing.
SINGAPORE STATUTORY FINANCIAL STATEMENTS
Our Singapore audited financial statements for our fiscal year ended October 29, 2017, prepared in conformity with the provisions of the laws of the Singapore Companies Act and the Singapore Financial Reporting Standards, together with the accompanying directors’ statement (together, the “Singapore Statutory Financial Statements”), and the auditors’ report thereon are required under Singapore law to be provided to shareholders for discussion (but not approval) at the 2018 AGM, and have therefore been provided as Appendix A to this Proxy Statement solely to satisfy this requirement.
Neither the Singapore Statutory Financial Statements nor the auditors’ report thereon shall be deemed to be “soliciting material” or to be “filed” with the SEC, nor shall such information be incorporated by reference into any filings under the U.S. Securities Act of 1933, as amended, or under the Exchange Act, or be subject to the liabilities of Section 18 of the Exchange Act, except to the extent that we specifically incorporate this information by reference into any such filing.
68
Table of Contents
Our management does not know of any matters to be presented at the 2018 AGM other than those set forth herein and in the Notice accompanying this Proxy Statement. If any other matters are properly presented for a vote, the enclosed proxy confers discretionary authority to the individuals named as proxies to vote the shares represented by proxy, as to those matters.
Accompanying this Proxy Statement is our 2017 Form 10-K. Copies of this Proxy Statement and the 2017 Form 10-K, as filed with the SEC, are also available free of charge on our website at www.broadcom.com or you can request a copy free of charge by calling Investor Relations at +1 (408) 433-8000.
Upon request, we will furnish without charge to each person to whom this Proxy Statement is delivered a copy of any exhibit listed in our 2017 Form 10-K. You may request a copy of this information, at no cost, by writing or telephoning us at:
Broadcom Limited
Attn: Investor Relations
1320 Ridder Park Dive
San Jose, California 95131 U.S.A.
Telephone: +1 (408) 433-8000
Email: [email protected]
To ensure timely delivery of any materials requested prior to the date of the 2018 AGM, you should request such materials no later than March 21, 2018.
By Order of the Board,
Hock E. Tan
Director, Chief Executive Officer and President
February 20, 2018
San Jose, California
69
Table of Contents
SINGAPORE STATUTORY FINANCIAL STATEMENTS
BROADCOM LIMITED
(Incorporated in Singapore)
ANNUAL REPORT
For the financial year ended October 29, 2017
INDEX
| Page | ||||
| A-2 | ||||
| A-10 | ||||
| A-16 | ||||
| A-18 | ||||
| A-19 | ||||
| A-20 | ||||
| A-22 | ||||
| A-23 | ||||
A-1
Table of Contents
BROADCOM LIMITED AND ITS SUBSIDIARIES
For the financial year ended 29 October 2017
The directors present their statement to the members together with the audited consolidated financial statements of Broadcom Limited and its subsidiaries (the “Group”) for the financial year ended 29 October 2017 and the unconsolidated balance sheet of Broadcom Limited (the “Company” or “Broadcom”) as of 29 October 2017. Broadcom Limited is the successor to Avago Technologies Limited (“Avago”) from and after 1 February 2016. Information contained in this statement for the period prior to 1 February 2016, relates to our predecessor, Avago.
In the opinion of the directors,
| (a) | the balance sheet of the Company and the consolidated financial statements of the Group are drawn up so as to give a true and fair view of the financial positions of the Company and of the Group as of 29 October 2017 and of the results of the business, changes in equity and cash flows of the Group for the financial year then ended; and |
| (b) | at the date of this statement, there are reasonable grounds to believe that the Company will be able to pay its debts as and when they fall due. |
Directors
The directors of the Company in office at the date of this report are as follows.
Gayla J. Delly (appointed on 4 December 2017)
James V. Diller
Lewis C. Eggebrecht
Kenneth Y. Hao
Eddy W. Hartenstein
Check Kian Low
Donald Macleod
Peter J. Marks
Henry Samueli, Ph.D.
Hock E. Tan
Arrangements to Enable Directors to Acquire Shares and Debentures
Neither at the end of, nor at any time during, the financial year was the Company a party to any arrangement whose object was to enable the directors of the Company to acquire benefits by means of the acquisition of shares in, or debentures of, the Company or any other body corporate, other than as disclosed under “Equity Awards”.
A-2
Table of Contents
BROADCOM LIMITED AND ITS SUBSIDIARIES
DIRECTORS’ STATEMENT
For the financial year ended 29 October 2017
Directors’ Interests in Shares or Debentures
| (a) | According to the register of directors’ shareholdings, none of the directors holding office at the end of the financial year had any interest in the shares or debentures of the Company or its related corporations, except as follows: |
| Holdings in which director is deemed to have an Interest |
||||||||
| As of 29 October |
As of 30 October of if later |
|||||||
| Broadcom Limited |
||||||||
| (No. of Ordinary Shares) |
||||||||
| James V. Diller |
127,414 | (1) | 126,589 | |||||
| Lewis C. Eggebrecht |
6,620 | (2) | 4,913 | |||||
| Kenneth Y. Hao |
1,692,968 | (3) | 10,713,355 | |||||
| Eddy W. Hartenstein |
33,235 | 31,648 | ||||||
| Donald Macleod |
52,852 | 51,527 | ||||||
| Peter J. Marks |
7,825 | 5,216 | ||||||
| Henry Samueli, Ph.D. |
86,783 | 30,163 | ||||||
| Hock E. Tan |
104,613 | 106,625 | ||||||
| Broadcom Limited |
||||||||
| (Share Options, RSUs* and Convertible Securities) |
||||||||
| James V. Diller |
15,983 | (4) | 16,402 | |||||
| Lewis C. Eggebrecht |
6,027 | (5) | 11,948 | |||||
| Kenneth Y. Hao |
15,983 | (6) | 24,032 | |||||
| Eddy W. Hartenstein |
906 | 1,587 | ||||||
| Check Kian Low |
1,294 | (7) | — | |||||
| Donald Macleod |
6,129 | (8) | 6,548 | |||||
| Peter J. Marks |
24,380 | (9) | 26,083 | |||||
| Henry Samueli, Ph.D. |
9,637,759 | (10) | 9,714,600 | |||||
| Hock E. Tan |
3,461,176 | (11) | 2,889,999 | |||||
| * | Restricted Share Units |
| (1) | Includes 119,500 shares held in family trusts of which Mr. Diller is a trustee | |
| (2) |
Includes 1,500 shares held in a family trust of which Mr. Eggebrecht is a trustee. | |
| (3) |
(i) Pursuant to Mr. Hao’s arrangement with Silver Lake Partners with respect to director compensation, upon the sale of shares received by him from the exercise of options or the vesting of RSUs, the proceeds of such sale are expected to be remitted to Silver Lake. Accordingly, Mr. Hao disclaims beneficial ownership of such shares, except for 18 shares held by Mr. Hao’s family limited partnership. |
A-3
Table of Contents
BROADCOM LIMITED AND ITS SUBSIDIARIES
DIRECTORS’ STATEMENT
For the financial year ended 29 October 2017
Directors’ Interests in Shares or Debentures (continued)
| (a) | (continued) |
| (ii) Also includes (x) 1,587,737 shares issued held by SLP Argo I Ltd. (“Argo I”) and (y) 30,830 shares held by SLP Argo II Ltd. (“Argo II” and together with Argo I, the “Silver Lake Entities”). The Silver Lake Entities are affiliates of Silver Lake Partners, of which Mr. Hao is a Managing Partner and Managing Director. Silver Lake Partners IV Cayman (AIV II), L.P. (or the “Main Fund”) is the sole shareholder of Argo I. Silver Lake Technology Investors IV Cayman, L.P. (or the “Side Fund”) is the sole shareholder of Argo II. Silver Lake Technology Associates IV Cayman, L.P. (or the “Lower GP”) is general partner of each of the Main Fund and the Side Fund. Silver Lake (Offshore) AIV GP IV, Ltd. (or the “Upper GP”) is the general partner of the Lower GP. Michael Bingle, James Davidson, Sahil Desai, Mark Gillett, Kenneth Hao, Yolande Jun, Karen King, Gregory Mondre, Joseph Osnoss, Andrew Schader and Andrew Wagner are directors of the Upper GP. Each of them, and each of the Main Fund, the Side Fund, the Lower GP and the Upper GP, disclaims beneficial ownership of the shares, except to the extent of their respective pecuniary interest therein. Mr. Hao disclaims beneficial ownership of any shares beneficially owned by the Silver Lake Entities, except to the extent of his pecuniary interest therein. | ||
| (4) |
Mr. Diller has the right to acquire 15,077 of these shares as of 29 October 2017 upon the exercise of share options. |
| (5) | Mr. Eggebrecht has the right to acquire 5,121 of these shares as of 29 October 2017 upon the exercise of share options. |
| (6) | Includes 15,077 shares Mr. Hao has the right to acquire as of 29 October 2017 upon the exercise of share options. Pursuant to Mr. Hao’s arrangement with Silver Lake with respect to director compensation in the form of securities received by him in his capacity as a representative of Silver Lake, he is required to remit the proceeds from the sale of such securities to Silver Lake. Accordingly, Mr. Hao disclaims beneficial ownership of all but 9,854 of these shares. |
| (7) | Mr. Low has the right to acquire 388 of these shares upon the vesting of RSUs within 60 days after 29 October 2017. |
| (8) | Mr. Macleod has the right to acquire 5,223 of these shares as of 29 October 2017 upon the exercise of share options. |
| (9) | Mr. Marks has the right to acquire 23,474 of these shares as of 29 October 2017 upon the exercise of share options. |
| (10) |
(i) Dr. Samueli has the right to acquire 16,582 of these shares upon the vesting of RSUs within 60 days after 29 October 2017. | |
| (ii) Also includes (a) 5,752,978 shares that may be issued upon exchange of restricted exchangeable partnership units in Broadcom Cayman L.P., a subsidiary of the Company (“REUs”), held by HS Portfolio L.P., (b) 399,918 shares that may be issued upon exchange of REUs held by HS Management L.P., (c) 459,690 shares that may be issued upon exchange of REUs held by H&S Portfolio II L.P., (d) 2,722,869 shares that may be issued upon exchange of REUs held by H&S Investments I L.P., (e) 62,010 shares that may be issued upon exchange of REUs held by HS REU LLC, of which 21,951.54 shares and 40,058.46 shares are beneficially owned by H&S Investments I L.P. and the Henry Samueli 2016 GRAT, respectively, through their ownership of membership interests in HS REU LLC, (f) 62,010 shares that may be issued upon exchange of REUs held by SFS REU LLC, of which 21,951.54 shares and 40,058.46 shares are beneficially owned by H&S Investments I L.P. and the Susan Faye Samueli 2016 GRAT, respectively, through their ownership of membership interests in SFS REU LLC, (g) 1,860 shares that may be issued upon exchange of REUs held by H&S Ventures LLC and (h) 53,649 shares that may be issued upon exchange of REUs held directly. |
A-4
Table of Contents
BROADCOM LIMITED AND ITS SUBSIDIARIES
DIRECTORS’ STATEMENT
For the financial year ended 29 October 2017
Directors’ Interests in Shares or Debentures (continued)
| (a) | (continued) |
| (11) | Mr. Tan has the right to acquire 2,271,666 of these shares as of 29 October 2017 upon the exercise of share options and 1,503 of these shares upon the vesting of RSUs within 60 days after 29 October 2017. |
| (b) | According to the register of directors’ shareholdings, directors holding office at the end of the financial year had interests in options and RSUs to subscribe for ordinary shares of the Company (as set forth under “Directors’ Interests in Shares or Debentures” in (a) above) granted pursuant to the Avago Technologies Limited 2009 Equity Incentive Plan (the “2009 Plan”) or the Broadcom Corporation (“BRCM”) 2012 Stock Incentive Plan (the “2012 Plan”), as set out below under the caption “Equity Awards”. Unless otherwise noted, options and RSUs were granted under the 2009 Plan. |
The following table shows for the financial year ended 29 October 2017, certain information regarding options and RSUs granted to, and held at the end of the financial year by the Company’s directors.
| Individual Grant |
||||||||||||||||
| Name |
Number of remaining securities underlying Options outstanding as at end of financial year |
% of Total equity awards outstanding as of end of financial year |
Exercise or base price per share |
Expiration date |
||||||||||||
| US$ | ||||||||||||||||
| James V. Diller |
9,854 | (1) | 0.03 | 35.38 | 04/09/2018 | |||||||||||
| 5,223 | (1) | 0.02 | 62.47 | 04/08/2019 | ||||||||||||
| Lewis C. Eggebrecht |
5,121 | (1) | 0.02 | 62.47 | 04/08/2019 | |||||||||||
| Kenneth Y. Hao |
9,854 | (1) | 0.03 | 35.38 | 04/09/2018 | |||||||||||
| 5,223 | (1) | 0.02 | 62.47 | 04/08/2019 | ||||||||||||
| Donald Macleod |
5,223 | (1) | 0.02 | 62.47 | 04/08/2019 | |||||||||||
| Peter J. Marks |
23,474 | (1) | 0.08 | 46.60 | 12/09/2018 | |||||||||||
| Hock E. Tan |
30,000 | (1) | 0.11 | 32.39 | 03/07/2018 | |||||||||||
| 131,250 | (2) | 0.46 | 35.45 | 03/11/2020 | ||||||||||||
| 1,547,916 | (3) | 5.44 | 38.99 | 09/12/2020 | ||||||||||||
| 750,000 | (3) | 2.64 | 52.65 | 01/01/2021 | ||||||||||||
A-5
Table of Contents
BROADCOM LIMITED AND ITS SUBSIDIARIES
DIRECTORS’ STATEMENT
For the financial year ended 29 October 2017
Directors’ Interests in Shares or Debentures (continued)
| (b) | (continued) |
| Name | Grant date | Number of securities underlying RSUs outstanding as at end |
% of Total equity awards outstanding as at end of financial year | |||||||
| James V. Diller |
04/05/2017 | 906 | (4) | 0.00 | ||||||
| Lewis C. Eggebrecht |
04/05/2017 | 906 | (4) | 0.00 | ||||||
| Kenneth Y. Hao |
04/05/2017 | 906 | (4) | 0.00 | ||||||
| Eddy W. Hartenstein |
04/05/2017 | 906 | (4) | 0.00 | ||||||
| Check Kian Low |
12/15/2016 | 388 | (5) | 0.00 | ||||||
| 04/05/2017 | 906 | (4) | 0.00 | |||||||
| Donald Macleod |
04/05/2017 | 906 | (4) | 0.00 | ||||||
| Peter J. Mark |
04/05/2017 | 906 | (4) | 0.00 | ||||||
| Henry Samueli, Ph.D. |
02/20/2014 | 11,609 | (6) | 0.04 | ||||||
| 02/19/2015 | 36,812 | (7) | 0.13 | |||||||
| 01/25/2016 | 41,864 | (8) | 0.15 | |||||||
| 01/25/2016 | 6,408 | (9) | 0.02 | |||||||
| 03/15/2016 | 8,691 | (10) | 0.03 | |||||||
| 03/15/2016 | 8,691 | (11) | 0.03 | |||||||
| 03/15/2017 | 5,800 | (12) | 0.02 | |||||||
| 03/15/2017 | 2,900 | (10) | 0.01 | |||||||
| Hock E. Tan |
06/15/2016 | 240,000 | (13) | 0.84 | ||||||
| 12/15/2016 | 6,010 | (10) | 0.02 | |||||||
| 06/15/2017 | 756,000 | (14) | 2.66 | |||||||
| (1) | Options vested and exercisable as of 29 October 2017 |
| (2) | This performance-based option vested over four years, with 25% vesting on each anniversary of the date of grant, subject to Mr. Tan’s continued employment with the Group; however, the option only became exercisable when the date on which the average of the closing prices of the Company’s ordinary shares (as reported on the Nasdaq), over a 10 consecutive trading day period equals or exceeds 120% of the exercise price of the option. The exercisability condition for this option has been met. |
| (3) | This performance-based option vests at the rate of 25% the shares subject thereto on each anniversary of the grant date, subject to the executive’s continued employment with the Company. This performance share option only became exercisable as to any tranche of 20% of the shares covered by the option if the price target applicable to that target was met. In order for a price target to be met, the average of the closing prices of the Company’s ordinary shares, over a 30 consecutive trading day period equal or exceed the applicable share price target. The price targets range from US$50.00 per share to US$75.00 per share. All price targets for this option have been met. |
| (4) | Granted during the financial year ended 29 October 2017 and vest in full on the earlier of (i) the first anniversary of the grant date or (ii) the date on which the annual general meeting of shareholders immediately following the grant date is held, subject to the director’s continued service with the Company on the vesting date. |
| (5) | Granted during the financial year ended 29 October 2017 and vest in full on the first anniversary of the grant date, subject to the director’s continued service with the Company on the vesting date. |
| (6) | This RSU was assumed in connection with the acquisition of BRCM on 2/1/2016 and was issued under the 2012 Plan. This RSU vests in equal quarterly instalments and such that the RSU vests in full on February 5, 2018. |
A-6
Table of Contents
BROADCOM LIMITED AND ITS SUBSIDIARIES
DIRECTORS’ STATEMENT
For the financial year ended 29 October 2017
Directors’ Interests in Shares or Debentures (continued)
| (b) | (continued) |
| (7) | This RSU was assumed in connection with the acquisition of BRCM on 2/1/2016 and was issued under the 2012 Plan. This RSU vests in equal quarterly instalments and such that the RSU vests in full on February 5, 2019, subject to the executive’s continued employment with us. |
| (8) | This RSU was assumed in connection with the acquisition of BRCM on 2/1/2016 and was issued under the 2012 Plan. This RSU vests in equal quarterly instalments and such that the RSU vests in full on February 5, 2020, subject to the executive’s continued employment with us. |
| (9) | This RSU was assumed in connection with the acquisition of BRCM on 2/1/2016 and was issued under the 2012 Plan. This RSU vests in equal quarterly instalments and such that the RSU vests in full on February 5, 2021, subject to the executive’s continued employment with us. |
| (10) | This RSU vests in four annual instalments of 25% each on the anniversary of the grant date, subject to the executive’s continued employment with the Company. |
| (11) | This performance-based RSU is scheduled to vest at a rate of 25% a year on each anniversary of the grant date, subject to the executive’s continued employment with us and satisfaction of a share price contingency (set at the grant date). No shares will vest until the average closing price per share of our ordinary shares over a 20 consecutive trading day period is equal to or greater than 120% of the fair market value of an ordinary share on the grant date. The share price contingency was met prior to the fourth anniversary of the grant date and therefore all of the shares subject to the RSU have the potential to vest (assuming continued service). |
| (12) | This performance-based RSU will vest at a rate of 25% per year on the later of (i) each anniversary of the grant date and (ii) the last day of the performance period, subject to the executives continued employment with us through the relevant vesting date and subject to the achievement of specified performance goals over each performance period, as determined by the Compensation Committee within 60 days following the end of each performance period. The performance criteria is based on our total shareholder return (“TSR”) relative to the S&P 500 Index (“Relative TSR”) over four overlapping performance periods beginning on the grant date and ending on each of March 14 of 2018, 2019, 2020 and 2021. The number of ordinary shares that may be earned is capped at one-quarter of the target number of ordinary shares for each of the first three performance periods. In the aggregate, the executive may earn up to 200% of the total target number of ordinary shares subject to the performance-based RSU, if during the fourth performance period our Relative TSR is at or above the 75th percentile of the S&P 500 Index and our absolute TSR is not negative. If the minimum performance criterion is not met, no ordinary shares will be issued and this award will be cancelled. |
| (13) | This performance-based RSUs vests in full upon completion of the three-year performance period, subject to continued employment with us and achievement of specified performance goals over the performance period, as determined by the independent members of the Board within 60 days following the end of performance period. The independent members of the Board will determine the achievement of two factors (i) the Relative TSR over the performance period and (ii) our share price growth over the performance period, based on 90-day trailing average prices at the start and end of the performance period. Based upon the level of performance achieved, a maximum of 240,000 shares may be earned under this award. If the minimum performance goals are not met, no shares will be issued under this award and it will be cancelled. |
| (14) | This performance-based RSU vests in two overlapping performance periods, one over a three-year performance period ending in 2020 (“Performance Period #1”) and one four-year performance period ending in 2021 (“Performance Period #2”, together with Performance Period 1, the “Performance Periods”), with each commencing on June 15, 2017. The shares earned at the end of each Performance Period will be fully vested on the last day of each Performance Period, subject to Mr. Tan’s continued employment with us through each such date. The number of ordinary shares earned during a Performance Period will depend on the level of performance achieved based on our Relative TSR and our absolute TSR over the Performance Periods, as determined by the independent members of the Board within 60 days following the end of each Performance Period. Based upon the level of performance achieved, a maximum of 756,000 shares may be earned under this performance-based RSU. If the minimum performance goals are not met, no shares will be issued under this award and its will be cancelled. |
A-7
Table of Contents
BROADCOM LIMITED AND ITS SUBSIDIARIES
DIRECTORS’ STATEMENT
For the financial year ended 29 October 2017
Equity Awards
A summary of award activities under all of the Company’s equity incentive plans is as set out below:
| Ordinary Shares Underlying Awards Outstanding | ||||||||||||
| Number outstanding |
Weighted- average exercise price per share |
Expiration date |
||||||||||
| (in millions) | (US$) | |||||||||||
| Balance as of 31 October 2016 |
15 | 48.77 | ||||||||||
| Exercised |
(4 | ) | 45.48 | |||||||||
| Cancelled |
(1 | ) | 66.08 | |||||||||
| Balance as of 29 October 2017 |
10 | 49.54 | |
06/12/2017 – 14/03/2022 |
| |||||||
| Balance as of 2 November 2015 |
21 | 47.92 | ||||||||||
| Exercised |
(5 | ) | 44.35 | |||||||||
| Cancelled |
(1 | ) | 53.56 | |||||||||
| Balance as of 30 October 2016 |
15 | 48.77 | |
19/11/2017 – 14/03/2022 |
| |||||||
A summary of RSU activity related to our equity incentive plans for the financial year ended 29 October 2017 is as follows:
| Group RSU Awards Outstanding |
||||||||
| Number Outstanding |
Weighted- Average Grant |
|||||||
| (in millions) | (US$) | |||||||
| Balance as of 31 October 2016 |
17 | 130.71 | ||||||
| Granted |
8 | 199.33 | ||||||
| Vested |
(5 | ) | 126.81 | |||||
| Forfeited |
(2 | ) | 142.78 | |||||
| Balance as of 29 October 2017 |
18 | 163.42 | ||||||
| Balance as of 2 November 2015 |
5 | 95.17 | ||||||
| Assumed in Broadcom Merger |
6 | 135.58 | ||||||
| Granted |
12 | 138.45 | ||||||
| Vested |
(4 | ) | 114.49 | |||||
| Forfeited |
(2 | ) | 130.30 | |||||
| Balance as of 30 October 2016 |
17 | 130.71 | ||||||
A-8
Table of Contents
BROADCOM LIMITED AND ITS SUBSIDIARIES
DIRECTORS’ STATEMENT
For the financial year ended 29 October 2017
Independent auditor
The Company’s independent auditor, PricewaterhouseCoopers LLP, has expressed its willingness to accept re-appointment.
On behalf of the directors
| /s/ James V. Diller |
/s/ Hock E. Tan | |||
| James V. Diller Director |
Hock E. Tan Director |
9 February, 2018
A-9
Table of Contents
INDEPENDENT AUDITOR’S REPORT TO THE MEMBERS OF BROADCOM LTD
Report on the Audit of the Financial Statements
Our opinion
In our opinion, the accompanying consolidated financial statements of Broadcom Limited (“the Company”) and its subsidiaries (“the Group”) and the balance sheet of the Company are properly drawn up in accordance with the provisions of the Singapore Companies Act, Chapter 50 (the “Act”) and Financial Reporting Standards in Singapore (“FRSs”) so as to give a true and fair view of the consolidated financial position of the Group and the financial position of the Company as at 29 October 2017 and of the consolidated financial performance, consolidated changes in equity and consolidated cash flows of the Group for the financial year ended on that date.
What we have audited
The financial statements of the Company and the Group comprise:
| • | the consolidated statement of comprehensive income of the Group for the year ended 29 October 2017; |
| • | the balance sheet of the Group as at 29 October 2017; |
| • | the balance sheet of the Company as at 29 October 2017; |
| • | the consolidated statement of changes in equity of the Group for the year then ended; |
| • | the consolidated statement of cash flows of the Group for the year then ended; and |
| • | the notes to the financial statements, including a summary of significant accounting policies. |
Basis for Opinion
We conducted our audit in accordance with Singapore Standards on Auditing (“SSAs”). Our responsibilities under those standards are further described in the Auditor’s Responsibilities for the Audit of the Financial Statements section of our report. We believe that the audit evidence we have obtained is sufficient and appropriate to provide a basis for our opinion.
Independence
We are independent of the Group in accordance with the Accounting and Corporate Regulatory Authority Code of Professional Conduct and Ethics for Public Accountants and Accounting Entities (“ACRA Code”) together with the ethical requirements that are relevant to our audit of the financial statements in Singapore, and we have fulfilled our other ethical responsibilities in accordance with these requirements and the ACRA Code.
Our Audit Approach
As part of designing our audit, we determined materiality and assessed the risks of material misstatement in the accompanying financial statements. In particular, we considered where management made subjective judgments; for example, in respect of significant accounting estimates that involved making assumptions and considering future events that are inherently uncertain. As in all of our audits, we also addressed the risk of management override of internal controls, including among other matters consideration of whether there was evidence of bias that represented a risk of material misstatement due to fraud.
A-10
Table of Contents
INDEPENDENT AUDITOR’S REPORT TO THE MEMBERS OF BROADCOM LTD
Key Audit Matters
Key audit matters are those matters that, in our professional judgement, were of most significance in our audit of the financial statements for the financial year ended 29 October 2017. These matters were addressed in the context of our audit of the financial statements as a whole, and in forming our opinion thereon, and we do not provide a separate opinion on these matters.
| Key Audit Matter
|
How our audit addressed the Key Audit Matter
| |
| First-time adoption of Singapore Financial Reporting Standards (“FRSs”) Refer to Note 2.1 (Significant accounting policies - FRS101 First-time Adoption of Financial Reporting Standards) to the financial statements.
The Company adopted FRSs for the preparation of the accompanying financial statements. In preparing these financial statements, which are the first set of financial statements of the Group and the Company prepared in accordance with FRSs, management has applied certain optional exemptions from requirements under FRSs and made certain adjustments due to the differences between FRSs and the accounting principles generally accepted in the United States of America (“previous GAAP”), which was used for the preparation of the financial statements in the previous financial years.
We focused on this area due to increased attention required to analyse and audit the differences arising out of conversion from the previous GAAP to FRS, specifically the key judgements made by management in the application of FRSs for the first time.
|
We obtained the analysis prepared by management for all financial statements line items highlighting the potential impact of the differences between the previous GAAP and FRSs. We have performed procedures on the potential impact identified by management, while also considering the appropriateness of management’s judgements in the election of accounting policies and options taken by management in the application of FRSs.
As the FRSs were applied retrospectively to the comparative information, we have also applied the same procedures to the opening balances for the financial year ended 29 October 2017.
We tested the adjustments recorded by management to determine that the differences between the previous GAAP and FRSs have been properly accounted for and appropriately disclosed in the financial statements. |
A-11
Table of Contents
INDEPENDENT AUDITOR’S REPORT TO THE MEMBERS OF BROADCOM LTD
Key Audit Matters (continued)
| Key Audit Matter
|
How our audit addressed the Key Audit Matter
| |
| Uncertain tax positions Refer to Note 3(e) (Critical accounting estimates, assumptions and judgements) and Note 9 (Income taxes) to the financial statements.
The provision for the Group’s tax liabilities is affected by uncertainties in the application of complex tax laws and regulations in a multitude of jurisdictions including transfer pricing. We focused on this area due to the broad range of potential outcomes that can arise from different assumptions and significant management judgement involved in estimating the tax liabilities of the Group. |
We evaluated the design and operating effectiveness of the controls the Group has in place to identify and quantify its transfer pricing tax exposures and to estimate tax provisions and certain unrecognized tax benefits. We assessed the approach applied by the Group in establishing its transfer pricing policies and assessing its tax positions in each of the respective tax jurisdictions in which the Group operates. We used our tax specialists, in the area of transfer pricing; they reviewed the relevant documentation and correspondences to assess the reasonableness of the significant assumptions and methods that support the calculations of the Group’s tax provisions.
Based on our procedures performed, we believe that the management’s assessment of the amount recorded by the Group for uncertain tax positions is acceptable in the context of the Group’s operations and the information currently available. | |
| Impairment assessment on goodwill Refer to Note 3(c) (Critical accounting estimates, assumptions and judgements) and Note 18(a) (Goodwill) to the financial statements.
As at 29 October 2017, goodwill amounted to USD 24,706 million, of which USD 22,992 million relates to the acquisition of Broadcom Corporation during the financial year ended 30 October 2016, and accounted for a significant part of the Group’s total assets.
We focused on this area due to the size of the goodwill balance and because the assessment of the fair values of each of the four Cash Generating Units (CGUs) is highly subjective and involves significant judgement about the inputs and assumptions, including growth rates and discount rates, applied to the business growth projections. |
We evaluated management’s qualitative assessment and considered the macro and Group-specific information in terms of recent historical performance and outlook. We found that management had followed their documented process for assessing qualitative factors around adverse indicators and ensured that the forecast information used in the assessment is consistent with the Board-approved budgets.
The Company used an independent valuation expert to assist in their qualitative assessment and quantification of the headroom between the carrying value and the fair value of each of the four CGUs. Information used in the assessment is consistent with our understanding of the business and overall state of the industry and macro-economic conditions. We validated that the inputs and assumptions used were subjected to review and oversight by management of the Group. The analysis performed indicated significant headroom between the carrying value and fair value of each CGU.
We performed sensitivity analysis on the inputs and assumptions used and calculated the degree to which these assumptions would need to move before an impairment conclusion was triggered. We assessed the likelihood of such a movement with management and agreed with their conclusion that it was unlikely. |
A-12
Table of Contents
INDEPENDENT AUDITOR’S REPORT TO THE MEMBERS OF BROADCOM LTD
Other Information
Management is responsible for the other information. The other information refers to the “Directors’ Statement” section on pages 1 to 8 of the annual report but does not include the financial statements and our auditor’s report thereon, which we obtained prior to the date of this auditor’s report.
Our opinion on the financial statements does not cover the other information and we do not and will not express any form of assurance conclusion thereon.
In connection with our audit of the financial statements, our responsibility is to read the other information identified above and, in doing so, consider whether the other information is materially inconsistent with the financial statements or our knowledge obtained in the audit, or otherwise appears to be materially misstated.
If, based on the work we have performed on the other information that we obtained prior to the date of this auditor’s report, we conclude that there is a material misstatement of this other information, we are required to report that fact. We have nothing to report in this regard.
Responsibilities of Management and Directors for the Financial Statements
Management is responsible for the preparation of financial statements that give a true and fair view in accordance with the provisions of the Act and FRSs, and for devising and maintaining a system of internal accounting controls sufficient to provide a reasonable assurance that assets are safeguarded against loss from unauthorised use or disposition; and transactions are properly authorised and that they are recorded as necessary to permit the preparation of true and fair financial statements and to maintain accountability of assets.
In preparing the financial statements, management is responsible for assessing the Group’s ability to continue as a going concern, disclosing, as applicable, matters related to going concern and using the going concern basis of accounting unless management either intends to liquidate the Group or to cease operations, or has no realistic alternative but to do so.
The directors’ responsibilities include overseeing the Group’s financial reporting process.
Auditor’s Responsibilities for the Audit of the Financial Statements
Our objectives are to obtain reasonable assurance about whether the financial statements as a whole are free from material misstatement, whether due to fraud or error, and to issue an auditor’s report that includes our opinion. Reasonable assurance is a high level of assurance, but is not a guarantee that an audit conducted in accordance with SSAs will always detect a material misstatement when it exists. Misstatements can arise from fraud or error and are considered material if, individually or in the aggregate, they could reasonably be expected to influence the economic decisions of users taken on the basis of these financial statements. As part of an audit in accordance with SSAs, we exercise professional judgement and maintain professional scepticism throughout the audit. We also:
A-13
Table of Contents
INDEPENDENT AUDITOR’S REPORT TO THE MEMBERS OF BROADCOM LTD
Auditor’s Responsibilities for the Audit of the Financial Statements (continued)
| • | Identify and assess the risks of material misstatement of the financial statements, whether due to fraud or error, design and perform audit procedures responsive to those risks, and obtain audit evidence that is sufficient and appropriate to provide a basis for our opinion. The risk of not detecting a material misstatement resulting from fraud is higher than for one resulting from error, as fraud may involve collusion, forgery, intentional omissions, misrepresentations, or the override of internal control. |
| • | Obtain an understanding of internal control relevant to the audit in order to design audit procedures that are appropriate in the circumstances, but not for the purpose of expressing an opinion on the effectiveness of the Group’s internal control. |
| • | Evaluate the appropriateness of accounting policies used and the reasonableness of accounting estimates and related disclosures made by management. |
| • | Conclude on the appropriateness of management’s use of the going concern basis of accounting and, based on the audit evidence obtained, whether a material uncertainty exists related to events or conditions that may cast significant doubt on the Group’s ability to continue as a going concern. If we conclude that a material uncertainty exists, we are required to draw attention in our auditor’s report to the related disclosures in the financial statements or, if such disclosures are inadequate, to modify our opinion. Our conclusions are based on the audit evidence obtained up to the date of our auditor’s report. However, future events or conditions may cause the Group to cease to continue as a going concern. |
| • | Evaluate the overall presentation, structure and content of the financial statements, including the disclosures, and whether the financial statements represent the underlying transactions and events in a manner that achieves fair presentation. |
| • | Obtain sufficient appropriate audit evidence regarding the financial information of the entities or business activities within the Group to express an opinion on the consolidated financial statements. We are responsible for the direction, supervision and performance of the group audit. We remain solely responsible for our audit opinion. |
We communicate with the directors regarding, among other matters, the planned scope and timing of the audit and significant audit findings, including any significant deficiencies in internal control that we identify during our audit.
We also provide the directors with a statement that we have complied with relevant ethical requirements regarding independence, and to communicate with them all relationships and other matters that may reasonably be thought to bear on our independence, and where applicable, related safeguards.
From the matters communicated with the directors, we determine those matters that were of most significance in the audit of the financial statements of the current period and are therefore the key audit matters. We describe these matters in our auditor’s report unless law or regulation precludes public disclosure about the matter or when, in extremely rare circumstances, we determine that a matter should not be communicated in our report because the adverse consequences of doing so would reasonably be expected to outweigh the public interest benefits of such communication.
A-14
Table of Contents
INDEPENDENT AUDITOR’S REPORT TO THE MEMBERS OF BROADCOM LTD
Other Matters
As stated in Note 2 to the financial statements, the Company adopted FRSs on 31 October 2016 with a transition date of 2 November 2015. These standards were applied retrospectively by management to the comparative information in these financial statements, including the statement of financial position as at 30 October 2016 and 2 November 2015, and the consolidated statement of comprehensive income, consolidated statement of changes in equity and consolidated statement of cash flows for the financial year ended 30 October 2016 and related disclosures. We were not engaged to report on the restated comparative information. Our responsibilities as part of our audit of the financial statements of the Group and of the Company for the financial year ended 29 October 2017 have, in these circumstances, included obtaining sufficient appropriate audit evidence that the opening balances as at 31 October 2016 do not contain misstatements that materially affect the financial position as of 29 October 2017 and financial performance and cash flows for the financial year then ended.
The Company has prepared a separate set of financial statements for the year ended 29 October 2017 in accordance with accounting principles generally accepted in the United States of America, on which a separate auditor’s report to the members of Broadcom Limited dated 21 December 2017 was issued.
Report on other Legal and Regulatory Requirements
In our opinion, the accounting and other records required by the Act to be kept by the Company and by those subsidiary corporations incorporated in Singapore, of which we are the auditors, have been properly kept in accordance with the provisions of the Act.
The engagement partner on the audit resulting in this independent auditor’s report is Lee Chian Yorn.
/s/ PricewaterhouseCoopers LLP
PricewaterhouseCoopers LLP
Public Accountants and Chartered Accountants
Singapore,
A-15
Table of Contents
BROADCOM LIMITED AND ITS SUBSIDIARIES
CONSOLIDATED STATEMENT OF COMPREHENSIVE INCOME
For the financial year ended 29 October 2017
| Note |
2017 (US$ millions) |
2016 (US$ millions) |
||||||||||
| Continuing operations |
||||||||||||
| Sales |
4 | 17,636 | 13,240 | |||||||||
| Cost of sales |
5 | (9,127) | (7,300) | |||||||||
|
|
|
|||||||||||
| Gross profit |
8,509 | 5,940 | ||||||||||
| Other income |
62 | 10 | ||||||||||
| Expenses |
||||||||||||
| - Research and development |
5 | (3,292) | (2,674) | |||||||||
| - Selling, general and administrative |
5 | (789) | (806) | |||||||||
| - Other expenses |
5 | (2,047) | (2,869) | |||||||||
|
|
|
|||||||||||
| Operating profit/(loss) |
2,443 | (399) | ||||||||||
| Finance expenses |
8 | (620) | (708) | |||||||||
|
|
|
|||||||||||
| Profit/(loss) before income taxes |
1,823 | (1,107) | ||||||||||
| Income tax expense |
9 | (35) | (642) | |||||||||
|
|
|
|||||||||||
| Profit/(loss) from continuing operations |
1,788 | (1,749) | ||||||||||
| Discontinued operations |
||||||||||||
| Loss from discontinued operations |
10 | (6) | (112) | |||||||||
|
|
|
|||||||||||
| Total Profit/(loss) |
1,782 | (1,861) | ||||||||||
|
|
|
|||||||||||
| Other comprehensive income: |
||||||||||||
| Items that may be reclassified subsequently to profit or loss: |
||||||||||||
| - Unrealised profit/(loss) on defined benefit pension plans and post-retirement benefit plans |
42 | (80) | ||||||||||
| - Reclassification of net income |
1 | 4 | ||||||||||
|
|
|
|||||||||||
| Other comprehensive profit/(loss), net of tax |
43 | (76) | ||||||||||
|
|
|
|||||||||||
| Total comprehensive profit/(loss) |
1,825 | (1,937) | ||||||||||
|
|
|
|||||||||||
| Profit/(loss) attributable to: |
||||||||||||
| Equity holders of the Company |
1,690 | (1,739) | ||||||||||
| Non-controlling interests |
92 | (122) | ||||||||||
|
|
|
|||||||||||
| 1,782 | (1,861) | |||||||||||
|
|
|
|||||||||||
| Profit/(loss) attributable to equity holders of the Company relates to: |
||||||||||||
| Profit/(loss) from continuing operations |
1,696 | (1,633) | ||||||||||
| Loss from discontinued operations |
(6) | (106) | ||||||||||
|
|
|
|||||||||||
| 1,690 | (1,739) | |||||||||||
|
|
|
|||||||||||
The accompanying notes form an integral part of these financial statements.
A-16
Table of Contents
BROADCOM LIMITED AND ITS SUBSIDIARIES
CONSOLIDATED STATEMENT OF COMPREHENSIVE INCOME
For the financial year ended 29 October 2017
| Note |
2017 (US$ millions) |
2016 (US$ millions) |
||||||||||
| Total comprehensive profit/(loss) attributable to: |
||||||||||||
| Equity holders of the Company |
1,733 | (1,815) | ||||||||||
| Non-controlling interests |
92 | (122) | ||||||||||
|
|
|
|||||||||||
| 1,825 | (1,937) | |||||||||||
|
|
|
|||||||||||
| Earnings per share for profit from continuing and discontinued operations attributable to equity holders of the Company (US$ per share) |
||||||||||||
| Basic earnings/(loss) per share |
11(a) | |||||||||||
| From continuing operations |
4.19 | (4.46) | ||||||||||
| From discontinued operations |
(0.01) | (0.29) | ||||||||||
|
|
|
|||||||||||
| Diluted earnings/loss per share |
11(b) | |||||||||||
| From continuing operations |
4.03 | (4.57) | ||||||||||
| From discontinued operations |
(0.01) | (0.29) | ||||||||||
|
|
|
|||||||||||
The accompanying notes form an integral part of these financial statements.
A-17
Table of Contents
BROADCOM LIMITED AND ITS SUBSIDIARIES
As at 29 October 2017
| Note | 29 October 2017 |
30 October 2016 |
2 November 2015 |
|||||||||||||
| (US$ millions) | (US$ millions) | (US$ millions) | ||||||||||||||
| ASSETS |
||||||||||||||||
| Current assets |
||||||||||||||||
| Cash and cash equivalents |
12 | 11,204 | 3,097 | 1,822 | ||||||||||||
| Trade receivables, net |
13 | 2,448 | 2,180 | 1,019 | ||||||||||||
| Inventories |
14 | 1,447 | 1,400 | 524 | ||||||||||||
| Other current assets |
13 | 711 | 423 | 258 | ||||||||||||
|
|
|
|||||||||||||||
| 15,810 | 7,100 | 3,623 | ||||||||||||||
| Asset of disposal group classified as held-for-sale |
10 | 13 | 24 | 21 | ||||||||||||
|
|
|
|||||||||||||||
| 15,823 | 7,124 | 3,644 | ||||||||||||||
|
|
|
|||||||||||||||
| Non-current assets |
||||||||||||||||
| Property, plant and equipment |
17 | 2,599 | 2,509 | 1,460 | ||||||||||||
| Goodwill |
18 | 24,706 | 24,732 | 1,674 | ||||||||||||
| Intangible assets, net |
18 | 10,832 | 15,068 | 3,277 | ||||||||||||
| Other long-term assets |
16 | 437 | 224 | 137 | ||||||||||||
| Deferred income tax assets |
22 | 21 | 308 | 323 | ||||||||||||
|
|
|
|||||||||||||||
| 38,595 | 42,841 | 6,871 | ||||||||||||||
|
|
|
|||||||||||||||
| Total assets |
54,418 | 49,965 | 10,515 | |||||||||||||
|
|
|
|||||||||||||||
| LIABILITIES |
||||||||||||||||
| Current liabilities |
||||||||||||||||
| Trade payables |
19 | 1,105 | 1,261 | 617 | ||||||||||||
| Current income tax liabilities |
981 | 886 | 289 | |||||||||||||
| Borrowings – Current portion of long-term debts |
20 | 117 | 454 | 46 | ||||||||||||
| Employee compensation and benefits |
626 | 517 | 250 | |||||||||||||
| Other current liabilities |
19 | 579 | 750 | 191 | ||||||||||||
|
|
|
|||||||||||||||
| 3,408 | 3,868 | 1,393 | ||||||||||||||
|
|
|
|||||||||||||||
| Non-current liabilities |
||||||||||||||||
| Borrowings – long-term debt |
20 | 17,431 | 13,188 | 3,826 | ||||||||||||
| Deferred income tax liabilities |
22 | 10,019 | 10,287 | 8 | ||||||||||||
| Pension and post-retirement benefit obligations |
7 | 129 | 546 | 475 | ||||||||||||
| Other non-current liabilities |
19 | 262 | 215 | 99 | ||||||||||||
|
|
|
|||||||||||||||
| 27,841 | 24,236 | 4,408 | ||||||||||||||
|
|
|
|||||||||||||||
| Total liabilities |
31,249 | 28,104 | 5,801 | |||||||||||||
|
|
|
|||||||||||||||
| NET ASSETS |
23,169 | 21,861 | 4,714 | |||||||||||||
|
|
|
|||||||||||||||
| EQUITY |
||||||||||||||||
| Capital and reserves attributable to equity holders of the Company |
||||||||||||||||
| Share capital |
23 | 18,805 | 18,462 | * | ||||||||||||
| Other reserves |
32 | 1,594 | 630 | 2,474 | ||||||||||||
| (Accumulated deficit)/Retained profits |
(131) | (215) | 2,240 | |||||||||||||
|
|
|
|||||||||||||||
| 20,268 | 18,877 | 4,714 | ||||||||||||||
| Non-controlling interests |
2,901 | 2,984 | - | |||||||||||||
|
|
|
|||||||||||||||
| Total equity |
23,169 | 21,861 | 4,714 | |||||||||||||
|
|
|
|||||||||||||||
| * | Represents figures less than a million |
The accompanying notes form an integral part of these financial statements.
A-18
Table of Contents
BROADCOM LIMITED AND ITS SUBSIDIARIES
As at 29 October 2017
| Note | 29 October 2017 |
30 October 2016 |
2 November 2015 |
|||||||||||
| (US$ millions) | (US$ millions) | (US$ millions) | ||||||||||||
| ASSETS |
||||||||||||||
| Current assets |
||||||||||||||
| Cash and cash equivalents |
12 | 187 | 53 | 20 | ||||||||||
| Other current assets |
13 | 9 | 42 | 586 | ||||||||||
|
|
|
|||||||||||||
| 196 | 95 | 606 | ||||||||||||
|
|
|
|||||||||||||
| Non-current assets |
||||||||||||||
| Investments in subsidiaries |
15 | 22,494 | 21,229 | 4,121 | ||||||||||
|
|
|
|||||||||||||
| Total assets |
22,690 | 21,324 | 4,727 | |||||||||||
|
|
|
|||||||||||||
| LIABILITIES |
||||||||||||||
| Current liabilities |
||||||||||||||
| Trade payables |
19 | 180 | 155 | 13 | ||||||||||
| Employee compensation and benefits |
- | 6 | - | |||||||||||
|
|
|
|||||||||||||
| 180 | 161 | 13 | ||||||||||||
|
|
|
|||||||||||||
| Total liabilities |
180 | 161 | 13 | |||||||||||
|
|
|
|||||||||||||
| NET ASSETS |
22,510 | 21,163 | 4,714 | |||||||||||
|
|
|
|||||||||||||
| EQUITY |
||||||||||||||
| Capital and reserves attributable to equity holders of the Company |
||||||||||||||
| Share capital |
23 | 18,805 | 18,462 | * | ||||||||||
| Other reserves |
32 | 1,545 | 624 | 2,474 | ||||||||||
| Retained profits |
24 | 2,160 | 2,077 | 2,240 | ||||||||||
|
|
|
|||||||||||||
| Total equity |
22,510 | 21,163 | 4,714 | |||||||||||
|
|
|
|||||||||||||
| * | Represents figures less than a million |
The accompanying notes form an integral part of these financial statements.
A-19
Table of Contents
BROADCOM LIMITED AND ITS SUBSIDIARIES
CONSOLIDATED STATEMENT OF CHANGES IN EQUITY
For the financial year ended 29 October 2017
 Attributable to equity holders of the Company

|
||||||||||||||||||||||||||||||||
| Note | Share capital | Share-based payment reserve |
Retained profits |
Accumulated other comprehensive loss |
Total | Non-controlling interests |
Total equity |
|||||||||||||||||||||||||
| (US$ millions) | (US$ millions) | (US$ millions) | (US$ millions) | (US$ millions) | (US$ millions) | (US$ millions) | ||||||||||||||||||||||||||
| 2017 |
||||||||||||||||||||||||||||||||
| Balance as of 31 October 2016 |
18,462 | 779 | (215 | ) | (149 | ) | 18,877 | 2,984 | 21,861 | |||||||||||||||||||||||
| Profit for the year |
- | - | 1,690 | - | 1,690 | 92 | 1,782 | |||||||||||||||||||||||||
| Other comprehensive income for the year |
- | - | - | 43 | 43 | - | 43 | |||||||||||||||||||||||||
| Total comprehensive income for the year |
18,462 | 779 | 1,475 | (106 | ) | 20,610 | 3,076 | 23,686 | ||||||||||||||||||||||||
| Share-based compensation |
32 | - | 921 | - | - | 921 | - | 921 | ||||||||||||||||||||||||
| Issuance of ordinary shares in connection with equity incentive plans |
23 | 257 | - | - | - | 257 | - | 257 | ||||||||||||||||||||||||
| Exchange of restricted exchangeable partnership units for ordinary shares |
23 | 86 | - | - | - | 86 | (86 | ) | - | |||||||||||||||||||||||
| Dividend paid |
25 | - | - | (1,653 | ) | - | (1,653 | ) | - | (1,653 | ) | |||||||||||||||||||||
| Cash distribution paid by the Partnership on restricted exchangeable partnership units |
- | - | - | - | - | (92 | ) | (92 | ) | |||||||||||||||||||||||
| Cumulative impact of accounting change |
- | - | 47 | - | 47 | 3 | 50 | |||||||||||||||||||||||||
| Total transactions with owners, recognised directly in equity |
343 | 921 | (1,606 | ) | - | (342 | ) | (175 | ) | (517 | ) | |||||||||||||||||||||
| Balance as of 29 October 2017 |
18,805 | 1,700 | (131 | ) | (106 | ) | 20,268 | 2,901 | 23,169 | |||||||||||||||||||||||
The accompanying notes form an integral part of these financial statements.
A-20
Table of Contents
BROADCOM LIMITED AND ITS SUBSIDIARIES
CONSOLIDATED STATEMENT OF CHANGES IN EQUITY
For the financial year ended 29 October 2017
|
Attributable to equity holders of the Company
|
||||||||||||||||||||||||||||||||||
| Note | Share capital | Share-based payment reserve |
Capital reserve | Retained profits |
Accumulated other comprehensive loss |
Total | Non-controlling interests |
Total equity |
||||||||||||||||||||||||||
| (US$ millions) | (US$ millions) | (US$ millions) | (US$ millions) | (US$ millions) | (US$ millions) | (US$ millions) | (US$ millions) | |||||||||||||||||||||||||||
| 2016 |
||||||||||||||||||||||||||||||||||
| Balance as of 2 November 2015 |
* | - | 2,547 | 2,240 | (73 | ) | 4,714 | - | 4,714 | |||||||||||||||||||||||||
| Loss for the year |
- | - | - | (1,739 | ) | - | (1,739 | ) | (122 | ) | (1,861 | ) | ||||||||||||||||||||||
| Other comprehensive income for the year |
- | - | - | - | (76 | ) | (76 | ) | - | (76 | ) | |||||||||||||||||||||||
| Total comprehensive income for the year |
* | - | 2,547 | 501 | (149 | ) | 2,899 | (122 | ) | 2,777 | ||||||||||||||||||||||||
| Share-based compensation |
32 |
- | 690 | - | - | - | 690 | - | 690 | |||||||||||||||||||||||||
| Excess tax benefits from share-based compensation |
32 |
- | 89 | - | - | - | 89 | - | 89 | |||||||||||||||||||||||||
| Issuance of ordinary shares in connection with equity incentive plans |
23 |
295 | - | - | - | - | 295 | - | 295 | |||||||||||||||||||||||||
| Fair value of partially vested equity awards assumed in connection with the acquisition of Broadcom Corporation |
23 |
182 | - | - | - | - | 182 | - | 182 | |||||||||||||||||||||||||
| Issuance by the Partnership of restricted exchangeable partnership units upon the acquisition of Broadcom Corporation |
- | - | - | - | - | - | 3,140 | 3,140 | ||||||||||||||||||||||||||
| Issuance of ordinary shares upon the acquisition of Broadcom Corporation |
23 |
15,438 | - | - | - | - | 15,438 | - | 15,438 | |||||||||||||||||||||||||
| Dividend paid |
25 |
- | - | - | (716 | ) | - | (716 | ) | - | (716 | ) | ||||||||||||||||||||||
| Cash distribution paid by the Partnership on restricted exchangeable partnership units |
- | - | - | - | - | - | (34 | ) | (34 | ) | ||||||||||||||||||||||||
| Effect of capital reorganisation |
32 |
2,547 | - | (2,547 | ) | - | - | - | - | - | ||||||||||||||||||||||||
| Total transactions with owners, recognised directly in equity |
18,462 | 779 | (2,547 | ) | (716 | ) | - | 15,978 | 3,106 | 19,084 | ||||||||||||||||||||||||
| Balance as of 30 October 2016 |
18,462 | 779 | - | (215 | ) | (149 | ) | 18,877 | 2,984 | 21,861 | ||||||||||||||||||||||||
| * | Represents figures less than a million |
The accompanying notes form an integral part of these financial statements.
A-21
Table of Contents
BROADCOM LIMITED AND ITS SUBSIDIARIES
CONSOLIDATED STATEMENT OF CASH FLOWS
For the financial year ended 29 October 2017
| Note |
2017 (US$ millions) |
2016 (US$ millions) |
||||||||||
| Cash flows from operating activities |
||||||||||||
| Total profit / (loss) |
1,782 | (1,861 | ) | |||||||||
| Adjustments for: |
||||||||||||
| - Income tax expense |
35 | 642 | ||||||||||
| - Employee share option expense |
921 | 679 | ||||||||||
| - Amortisation of intangible assets |
4,285 | 2,638 | ||||||||||
| - Depreciation of property, plant and equipment |
451 | 402 | ||||||||||
| - Excess tax benefits from share-based compensation |
- | (89 | ) | |||||||||
| - Non-cash restructuring, impairment and disposal charges |
71 | 662 | ||||||||||
| - Interest expense |
454 | 585 | ||||||||||
| - Deferred taxes |
(173 | ) | 365 | |||||||||
| - Amortisation of debt discount issuance costs and accretion of debt discount |
24 | - | ||||||||||
| - Non-cash portion of debt extinguishment loss, net |
166 | 100 | ||||||||||
| - Others |
7 | (7 | ) | |||||||||
|
|
|
|||||||||||
| 8,023 | 4,116 | |||||||||||
| Change in working capital, net of effects from acquisition and disposal of subsidiaries: |
||||||||||||
| - Inventories and construction work-in-progress |
(39 | ) | 996 | |||||||||
| - Trade and other receivables |
(267 | ) | (491 | ) | ||||||||
| - Trade and other payables |
(97 | ) | 33 | |||||||||
| - Employee compensation and benefits |
109 | 163 | ||||||||||
| - Other current liabilities |
(678 | ) | (596 | ) | ||||||||
| - Other non-current assets and liabilities |
159 | (120 | ) | |||||||||
|
|
|
|||||||||||
| Cash generated from operations |
7,210 | 4,101 | ||||||||||
| Income tax paid |
(349 | ) | (242 | ) | ||||||||
|
|
|
|||||||||||
| Net cash provided by operating activities |
6,861 | 3,859 | ||||||||||
|
|
|
|||||||||||
| Cash flows from investing activities |
||||||||||||
| Acquisition of a subsidiary, net of cash acquired |
(40 | ) | (10,055 | ) | ||||||||
| Additions to property, plant and equipment |
(1,069 | ) | (723 | ) | ||||||||
| Disposal of a subsidiary, net of cash disposed of |
10 | 898 | ||||||||||
| Disposal of property, plant and equipment |
441 | 5 | ||||||||||
| Purchase of investments |
(207 | ) | (58 | ) | ||||||||
| Proceeds from sales and maturities of investments |
200 | 104 | ||||||||||
| Others |
(9 | ) | (11 | ) | ||||||||
|
|
|
|||||||||||
| Net cash used in investing activities |
(674 | ) | (9,840 | ) | ||||||||
|
|
|
|||||||||||
| Cash flows from financing activities |
||||||||||||
| Proceeds from issuance of ordinary shares |
257 | 295 | ||||||||||
| Proceeds from borrowings |
17,426 | 19,510 | ||||||||||
| Repayment of borrowings |
(13,668 | ) | (11,317 | ) | ||||||||
| Interest paid |
(310 | ) | (448 | ) | ||||||||
| Debt issuance cost |
(24 | ) | (123 | ) | ||||||||
| Dividends paid to equity holders of the Company |
(1,745 | ) | (750 | ) | ||||||||
| Excess tax benefits from share-based compensation |
- | 89 | ||||||||||
| Payment of capital lease obligations |
(16 | ) | - | |||||||||
|
|
|
|||||||||||
| Net cash provided by financing activities |
1,920 | 7,256 | ||||||||||
|
|
|
|||||||||||
| Net increase in cash and cash equivalents |
8,107 | 1,275 | ||||||||||
| Cash and cash equivalents |
||||||||||||
| Beginning of financial year |
12 | 3,097 | 1,822 | |||||||||
| Effects of currency translation on cash and cash equivalents |
- | - | ||||||||||
|
|
|
|||||||||||
| End of financial year |
12 | 11,204 | 3,097 | |||||||||
|
|
|
|||||||||||
Reconciliation of liabilities arising from financing activities
| 30 October 2016 (US$ millions) |
Principal and interest payments (US$ millions) |
Proceeds from borrowings (US$ millions) |
Non-cash changes (US$ millions) |
29 October 2017 (US$ millions) |
||||||||||||||||||||
| Debt issuance and extinguishment costs |
Interest expense |
|||||||||||||||||||||||
| Bank borrowings |
13,642 | (14,155 | ) | 17,426 | 181 | 454 | 17,548 | |||||||||||||||||
The accompanying notes form an integral part of these financial statements.
A-22
Table of Contents
BROADCOM LIMITED AND ITS SUBSIDIARIES
NOTES TO THE FINANCIAL STATEMENTS
For the financial year ended 29 October 2017
These notes form an integral part of and should be read in conjunction with the accompanying financial statements.
| 1. | General information |
Broadcom Limited (“the Company” or “Broadcom”) and its subsidiaries (“the Group”) is a leading designer, developer and global supplier of a broad range of semiconductor devices with a focus on complex digital and mixed signal complementary metal oxide semiconductor based devices and analog III-V based products. Broadcom has a history of innovation and offers thousands of products that are used in end products such as enterprise and data center networking, home connectivity, set-top boxes, broadband access, telecommunication equipment, mobile handsets and base stations, data center servers and storage systems, factory automation, power generation and alternative energy systems, and electronic displays. Broadcom has four reportable segments: wired infrastructure, wireless communications, enterprise storage and industrial & others, which align with the Group’s principal target markets.
The Company is listed on the NASDAQ Global Select Market and incorporated and domiciled in Singapore. The address of its registered office is 1 Yishun Avenue 7, Singapore 768923.
The financial statements are presented in U.S. dollar, rounded off to the nearest million. U.S. dollar is the functional currency of the Company.
| 2. | Significant accounting policies |
| 2.1 | Basis of preparation |
These financial statements have been prepared in accordance with Singapore Financial Reporting Standards (“FRS”) under the historical cost convention, except as disclosed in the accounting policies below.
The preparation of financial statements in conformity with FRS requires management to exercise its judgement in the process of applying the Group’s accounting policies. It also requires the use of certain critical accounting estimates and assumptions. The areas involving a higher degree of judgement or complexity, or areas where assumptions and estimates are significant to the financial statements are disclosed in Note 3.
Broadcom operates on a 52- or 53-week financial year ending on the Sunday closest to October 31 in a 52-week year and the first Sunday in November in a 53-week year. The financial year ended 29 October 2017 (“financial year 2017”), was a 52-week financial year. The financial year ended 30 October 2016, (“financial year 2016”), was also a 52-week financial year.
A-23
Table of Contents
BROADCOM LIMITED AND ITS SUBSIDIARIES
NOTES TO THE FINANCIAL STATEMENTS
For the financial year ended 29 October 2017
| 2. | Significant accounting policies (continued) |
| 2.1 | Basis of preparation (continued) |
FRS 101 first-time adoption of Financial Reporting Standards
These financial statements for financial year 2017 are the first set of financial statements the Group and Company prepared in accordance with the FRS. The Group’s previously issued financial statements for periods up to and including financial year 2016 were prepared in accordance with accounting principles generally accepted in the United States of America (“previous GAAP” or “US GAAP”). The board of directors has concluded that it is in the Company’s best interest to adopt FRS.
In adopting FRS on 31 October 2016, the Group is required to apply all of the specific transition requirements in FRS 101 “First-time Adoption of Financial Reporting Standards”. Under FRS 101, these financial statements are required to be prepared using the accounting policies that comply with FRS effective as at 29 October 2017. The board of directors have assessed the accounting policies adopted by the Group in accordance with FRS, and have considered the differences between the requirements of the previous GAAP and those of FRS. Except for those that resulted in differences that are disclosed in Note 2.1, the directors are satisfied that there are no other material differences between the financial statements prepared under FRS and those under the previous GAAP. The same accounting policies are applied throughout all periods presented in these financial statements, subject to mandatory exemptions and optional exemptions under FRS 101. The Group’s opening balance sheet has been prepared as at 2 November 2015, which is Group’s date of transition to FRS (“date of transition”).
| (a) | Optional exemptions applied |
FRS 101 allows the exemption from application of certain requirements under FRS on a retrospective basis. The Group has applied the following exemptions in preparing its first set of financial statements in accordance with FRS:
| (i) | Business combinations |
FRS 103 “Business Combinations” has not been applied to business combinations that occurred before the date of transition. The same classification as in its previous GAAP financial statements have been adopted. In addition, the Group has also applied FRS 27 Consolidated and separate financial statements from the date of transition.
The Group has not applied FRS 21 “The Effects of Changes in Foreign Exchange rates” retrospectively to the fair value adjustments and goodwill from business combinations that occurred before the date of transition of FRS. Such fair value adjustments and goodwill continue to be accounted for using the same basis as under previous GAAP.
A-24
Table of Contents
BROADCOM LIMITED AND ITS SUBSIDIARIES
NOTES TO THE FINANCIAL STATEMENTS
For the financial year ended 29 October 2017
| 2. | Significant accounting policies (continued) |
| 2.1 | Basis of preparation (continued) |
FRS 101 first-time adoption of Financial Reporting Standards (continued)
| (a) | Optional exemptions applied (continued) |
| (ii) | Deemed cost for investments in subsidiaries |
The Group elected to regard the Company’s cost of investments in subsidiaries as their deemed cost at the date of transition. US$4,121 million is the Company’s carrying value of investments in subsidiaries under the previous GAAP at the date of transition.
| (iii) | Accounting for defined benefit pension schemes and other post-retirement benefits |
The Group elected not to apply FRS 101 for pension accounting under FRS 19. All numbers disclosed are based on a full retrospective approach. At transition, the Group recognized all cumulative actuarial gains and losses on defined benefit pension schemes and other post-retirement benefits in shareholders’ equity. Application of the full retrospective approach results in the adjustments described in A4 below.
A-25
Table of Contents
BROADCOM LIMITED AND ITS SUBSIDIARIES
NOTES TO THE FINANCIAL STATEMENTS
For the financial year ended 29 October 2017
| 2. | Significant accounting policies (continued) |
| 2.1 | Basis of preparation (continued) |
FRS 101 first-time adoption of Financial Reporting Standards (continued)
| (b) | Summary of financial impact |
The financial impact on the Group’s and Company’s financial statements that may be adjusted from the adoption of FRS as described above are summarised below:
| (i) | Reconciliation of the Group’s equity reported in accordance with the previous GAAP to FRS |
| Expla- natory Note |
30 October 2016 reported under previous GAAP |
Effect of transition to FRS |
30 October FRS |
2 November 2015 reported under previous GAAP |
Effect of transition to FRS |
2 November 2015 reported under FRS |
||||||||||||||||||||||
| (US$ millions) |
(US$ millions) |
(US$ millions) |
(US$ millions) |
(US$ millions) |
(US$ millions) |
|||||||||||||||||||||||
| ASSETS |
||||||||||||||||||||||||||||
| Current assets |
||||||||||||||||||||||||||||
| Cash and cash equivalents |
3,097 | - | 3,097 | 1,822 | - | 1,822 | ||||||||||||||||||||||
| Trade receivables, net |
2,181 | (1) | 2,180 | 1,019 | - | 1,019 | ||||||||||||||||||||||
| Inventories |
1,400 | - | 1,400 | 524 | - | 524 | ||||||||||||||||||||||
| Other current assets |
A1, A2 | 447 | (24) | 423 | 394 | (136) | 258 | |||||||||||||||||||||
|
|
|
|||||||||||||||||||||||||||
| 7,125 | (25) | 7,100 | 3,759 | (136) | 3,623 | |||||||||||||||||||||||
| Assets of disposal group classified as held-for-sale |
A1 | - | 24 | 24 | - | 21 | 21 | |||||||||||||||||||||
|
|
|
|||||||||||||||||||||||||||
| 7,125 | (1) | 7,124 | 3,759 | (115) | 3,644 | |||||||||||||||||||||||
|
|
|
|||||||||||||||||||||||||||
| Non-current assets |
||||||||||||||||||||||||||||
| Property, plant and equipment |
2,509 | - | 2,509 | 1,460 | - | 1,460 | ||||||||||||||||||||||
| Goodwill |
24,732 | - | 24,732 | 1,674 | - | 1,674 | ||||||||||||||||||||||
| Intangible assets, net |
15,068 | - | 15,068 | 3,277 | - | 3,277 | ||||||||||||||||||||||
| Other long-term assets |
A2 | 532 | (308) | 224 | 345 | (208) | 137 | |||||||||||||||||||||
| Deferred income tax assets |
A2 | - | 308 | 308 | - | 323 | 323 | |||||||||||||||||||||
|
|
|
|||||||||||||||||||||||||||
| 42,841 | - | 42,841 | 6,756 | 115 | 6,871 | |||||||||||||||||||||||
|
|
|
|||||||||||||||||||||||||||
| Total assets |
49,966 | (1) | 49,965 | 10,515 | - | 10,515 | ||||||||||||||||||||||
|
|
|
|||||||||||||||||||||||||||
A-26
Table of Contents
BROADCOM LIMITED AND ITS SUBSIDIARIES
NOTES TO THE FINANCIAL STATEMENTS
For the financial year ended 29 October 2017
| 2. | Significant accounting policies (continued) |
| 2.1 | Basis of preparation (continued) |
FRS 101 first-time adoption of Financial Reporting Standards (continued)
| (b) | Summary of financial impact (continued) |
| (i) | Reconciliation of the Group’s equity reported in accordance with the previous GAAP to FRS (continued) |
| Expla- natory Note |
30 October 2016 reported under previous GAAP |
Effect of transition to FRS |
30 October 2016 reported under FRS |
2 November 2015 reported under previous GAAP |
Effect of transition to FRS |
2 November 2015 reported under FRS |
||||||||||||||||||||||
| (US$ millions) |
(US$ millions) |
(US$ millions) |
(US$ millions) |
(US$ millions) |
(US$ millions) |
|||||||||||||||||||||||
| LIABILITIES |
||||||||||||||||||||||||||||
| Current liabilities |
||||||||||||||||||||||||||||
| Trade payables |
1,261 | - | 1,261 | 617 | - | 617 | ||||||||||||||||||||||
| Current income tax liabilities |
A2 | - | 886 | 886 | - | 289 | 289 | |||||||||||||||||||||
| Borrowings – Current portion of long-term debts |
454 | - | 454 | 46 | - | 46 | ||||||||||||||||||||||
| Employee compensation and benefits |
517 | - | 517 | 250 | - | 250 | ||||||||||||||||||||||
| Other current liabilities and other provisions |
A2 | 846 | (96) | 750 | 206 | (15) | 191 | |||||||||||||||||||||
|
|
|
|||||||||||||||||||||||||||
| 3,078 | 790 | 3,868 | 1,119 | 274 | 1,393 | |||||||||||||||||||||||
|
|
|
|||||||||||||||||||||||||||
| Non-current liabilities |
||||||||||||||||||||||||||||
| Borrowings – Long-term debt |
13,188 | - | 13,188 | 3,826 | - | 3,826 | ||||||||||||||||||||||
| Deferred income tax liabilities |
A2 | - | 10,287 | 10,287 | - | 8 | 8 | |||||||||||||||||||||
| Pension and post-retirement benefit obligations |
A4 | 531 | 15 | 546 | 475 | - | 475 | |||||||||||||||||||||
| Other long-term liabilities |
A2 | 11,293 | (11,078) | 215 | 381 | (282) | 99 | |||||||||||||||||||||
|
|
|
|||||||||||||||||||||||||||
| 25,012 | (776) | 24,236 | 4,682 | (274) | 4,408 | |||||||||||||||||||||||
|
|
|
|||||||||||||||||||||||||||
| Total liabilities |
28,090 | 14 | 28,104 | 5,801 | - | 5,801 | ||||||||||||||||||||||
|
|
|
|||||||||||||||||||||||||||
| NET ASSETS |
21,876 | (15) | 21,861 | 4,714 | - | 4,714 | ||||||||||||||||||||||
|
|
|
|||||||||||||||||||||||||||
A-27
Table of Contents
BROADCOM LIMITED AND ITS SUBSIDIARIES
NOTES TO THE FINANCIAL STATEMENTS
For the financial year ended 29 October 2017
| 2. | Significant accounting policies (continued) |
| 2.1 | Basis of preparation (continued) |
FRS 101 first-time adoption of Financial Reporting Standards (continued)
| (b) | Summary of financial impact (continued) |
| (i) | Reconciliation of the Group’s equity reported in accordance with the previous GAAP to FRS (continued) |
| Expla- natory Note |
30 October 2016 reported under previous GAAP |
Effect of transition to FRS |
30 October FRS |
2 November 2015 reported under previous GAAP |
Effect of transition to FRS |
2 November 2015 reported under FRS |
||||||||||||||||||||||
| (US$ millions) |
(US$ millions) |
(US$ millions) |
(US$ millions) |
(US$ millions) |
(US$ millions) |
|||||||||||||||||||||||
| EQUITY |
||||||||||||||||||||||||||||
| Capital and reserves attributable to equity holders of the Company |
||||||||||||||||||||||||||||
| Share capital |
A3 | 19,241 | (779) | 18,462 | 2,547 | (2,547) | * | |||||||||||||||||||||
| Other reserves |
A3, A4 | - | 630 | 630 | - | 2,474 | 2,474 | |||||||||||||||||||||
| (Accumulated deficit)/Retained profits |
(215) | - | (215) | 2,240 | - | 2,240 | ||||||||||||||||||||||
| Accumulated other comprehensive loss |
A3, A4 | (134) | 134 | - | (73) | 73 | - | |||||||||||||||||||||
| Non-controlling interests |
2,984 | - | 2,984 | - | - | - | ||||||||||||||||||||||
|
|
|
|||||||||||||||||||||||||||
| Total equity |
21,876 | (15) | 21,861 | 4,714 | - | 4,714 | ||||||||||||||||||||||
|
|
|
|||||||||||||||||||||||||||
| * | Represents figures less than a million. |
| A1 | Presentation of assets of disposal group classified as held for sale |
The Group has changed the presentation of certain amounts under “Other current assets” in the balance sheet to meet the presentation requirements under FRS 1 and FRS 105. Under FRS 1, the balance sheet shall present “Assets of disposal group classified as held-for-sale”, which was not presented on the balance sheet under the previous GAAP.
US$24 million and US$21 million of “Other current assets” under the previous GAAP are reclassified to be presented as “Assets of disposal group classified as held-for-sale” in the balance sheet presented as at 30 October 2016 and 2 November 2015, respectively.
A-28
Table of Contents
BROADCOM LIMITED AND ITS SUBSIDIARIES
NOTES TO THE FINANCIAL STATEMENTS
For the financial year ended 29 October 2017
| 2. | Significant accounting policies (continued) |
| 2.1 | Basis of preparation (continued) |
FRS 101 first-time adoption of Financial Reporting Standards (continued)
| (b) | Summary of financial impact (continued) |
| (i) | Reconciliation of the Group’s equity reported in accordance with the previous GAAP to FRS (continued) |
| A2 | Presentation of deferred income tax assets, current income tax liabilities and deferred income tax liabilities |
The Group has changed the presentation of certain amounts under “Other current assets”, “Other current liabilities”, “Other long-term assets” and “Other long-term liabilities” in the balance sheet to meet the presentation requirements under FRS 1 and FRS 12. Under FRS 1, the balance sheet shall present “Deferred income tax assets”, “Current income tax liabilities” and “Deferred income tax liabilities”, which were not required to be presented on the balance sheet under the previous GAAP.
| (i) | US$308 million of “Other long-term assets” under the previous GAAP are reclassified to be presented as “Deferred income tax assets” in the balance sheet presented as at 30 October 2016. |
| (ii) | US$115 million of “Other current assets” and US$208 million of “Other long-term assets” under the previous GAAP are reclassified to be presented as “Deferred income tax assets” in the balance sheet presented as at 2 November 2015. |
| (iii) | US$96 million of “Other current liabilities” and US$790 million of “Other long-term liabilities” under the previous GAAP are reclassified to be presented as “Current income tax liabilities” in the balance sheet presented as at 30 October 2016. |
| (iv) | US$15 million of “Other current liabilities” and US$274 million of “Other long-term liabilities” under the previous GAAP are reclassified to be presented as “Current income tax liabilities” in the balance sheet presented as at 2 November 2015. |
The reclassification of “Other long-term liabilities” to “Current income tax liabilities” as described above pertains to uncertain tax positions that are not expected to be settled within 12 months of the reporting date. Under the previous GAAP, such balances are classified as non-current while under FRS, these balances are presented as current as they pertains to the Group’s probable current tax exposure.
A-29
Table of Contents
BROADCOM LIMITED AND ITS SUBSIDIARIES
NOTES TO THE FINANCIAL STATEMENTS
For the financial year ended 29 October 2017
| 2. | Significant accounting policies (continued) |
| 2.1 | Basis of preparation (continued) |
FRS 101 first-time adoption of Financial Reporting Standards (continued)
| (b) | Summary of financial impact (continued) |
| (i) | Reconciliation of the Group’s equity reported in accordance with the previous GAAP to FRS (continued) |
| A2 | Presentation of deferred income tax assets, current income tax liabilities and deferred income tax liabilities (continued) |
| (v) | US$10,287 million and US$8 million of “Other long-term liabilities” under the previous GAAP are reclassified to be presented as “Deferred income tax liabilities” in the balance sheet presented as at 30 October 2016 and 2 November 2015, respectively. |
| A3 | Classification of other reserves |
The Group has changed the presentation of certain amounts under “Share Capital” to reflect FRS 1 requirement to disclose the ordinary class of share capital and other reserves in equity which is described in detail in Note 32.
US$779 million and US$2,547 million of “Share Capital” under the previous GAAP are reclassified to be presented as “Other reserves” in the balance sheet presented as at 30 October 2016 and 2 November 2015, respectively.
US$134 million and US$73 million of “Accumulated other comprehensive loss” under the previous GAAP are subsumed and presented under “Other reserves” in the balance sheet presented as at 30 October 2016 and 2 November 2015, respectively.
| A4 | Presentation of net pension liabilities |
The Post-Employment Benefit plan consists of the US Group Life plan and the Avago Retiree Medical plan. The US Group Life plan is funded by the Agere Systems Inc. Post-retirement Life Insurance Benefit Trust. As the United States’ Internal Revenue Service’s rules effectively prohibit a reversion of any excess assets in the Trust back to the Company, adjustments are made to the respective balances relating to the US Group Life plan to recognise an irrevocable surplus under FRS 19. FRS 19 limits the amount of net pension liabilities that can be offset on the balance sheet whereas the previous GAAP does not have such limitations.
A-30
Table of Contents
BROADCOM LIMITED AND ITS SUBSIDIARIES
NOTES TO THE FINANCIAL STATEMENTS
For the financial year ended 29 October 2017
| 2. | Significant accounting policies (continued) |
| 2.1 | Basis of preparation (continued) |
FRS 101 first-time adoption of Financial Reporting Standards (continued)
| (b) | Summary of financial impact (continued) |
| (i) | Reconciliation of the Group’s equity reported in accordance with the previous GAAP to FRS (continued) |
| A4 | Presentation of net pension liabilities (continued) |
This resulted in an adjustment of $15 million to the accumulated other comprehensive income, which is currently subsumed and presented under “Other reserves”, and a corresponding adjustment to the “Pension and post-retirement benefit obligations” of the Group.
| (ii) | Reconciliation of the Group’s total comprehensive income reported in accordance with the previous GAAP to FRS |
| Expla- natory Note |
2016 reported under previous GAAP |
Effect of transition to FRS |
2016 reported under FRS |
|||||||||||||
| (US$ millions) |
(US$ millions) |
(US$ millions) |
||||||||||||||
| Sales |
13,240 | - | 13,240 | |||||||||||||
| Cost of sales |
B, B1 | (5,295 | ) | (2,005) | (7,300) | |||||||||||
| Purchase accounting effect on inventory |
B, B1 | (1,185) | 1,185 | - | ||||||||||||
| Amortisation of acquisition-related intangible assets |
B, B1 | (763) | 763 | - | ||||||||||||
| Restructuring charges |
B, B1 | (57) | 57 | - | ||||||||||||
|
|
|
|||||||||||||||
| Gross margin |
5,940 | - | 5,940 | |||||||||||||
| Other income, net |
10 | - | 10 | |||||||||||||
| - Research and development |
(2,674) | - | (2,674) | |||||||||||||
| - Selling, general and administrative |
(806) | - | (806) | |||||||||||||
| - Amortisation of acquisition-related intangible assets |
B, B2 | (1,873) | 1,873 | - | ||||||||||||
| - Restructuring, impairment and disposal charges |
B, B2 | (996) | 996 | - | ||||||||||||
| - Other expenses |
B, B2 | - | (2,869) | (2,869) | ||||||||||||
|
|
|
|||||||||||||||
| Operating loss |
(399) | - | (399) | |||||||||||||
| Interest expense |
B, B3 | (585) | 585 | - | ||||||||||||
| Loss on extinguishment of debt |
B, B3 | (123) | 123 | - | ||||||||||||
| Finance costs |
B, B3 | - | (708) | (708) | ||||||||||||
|
|
|
|||||||||||||||
| Loss before income taxes |
(1,107) | - | (1,107) | |||||||||||||
| Income tax expense |
(642) | - | (642) | |||||||||||||
|
|
|
|||||||||||||||
| Loss from continuing operations |
(1,749) | - | (1,749) | |||||||||||||
| Loss from discontinued operations |
(112) | - | (112) | |||||||||||||
|
|
|
|||||||||||||||
| Total loss |
(1,861) | - | (1,861) | |||||||||||||
|
|
|
|||||||||||||||
A-31
Table of Contents
BROADCOM LIMITED AND ITS SUBSIDIARIES
NOTES TO THE FINANCIAL STATEMENTS
For the financial year ended 29 October 2017
| 2. | Significant accounting policies (continued) |
| 2.1 | Basis of preparation (continued) |
FRS 101 first-time adoption of Financial Reporting Standards (continued)
| (b) | Summary of financial impact (continued) |
| (ii) | Reconciliation of the Group’s total comprehensive income reported in accordance with the previous GAAP to FRS (continued) |
| Expla- natory Note |
2016 reported under previous GAAP |
Effect of transition to FRS |
2016 reported under FRS |
|||||||||||||
| (US$ millions) |
(US$ millions) |
(US$ millions) |
||||||||||||||
| Other comprehensive income: |
||||||||||||||||
| Items that may be reclassified subsequently to profit or loss: |
||||||||||||||||
| Unrealised loss on defined benefit pension plans and post-retirement benefit plans |
A4 | (65) | (15) | (80) | ||||||||||||
| Reclassification of net income |
4 | - | 4 | |||||||||||||
|
|
|
|||||||||||||||
| Other comprehensive loss, net of tax |
(61) | (15) | (76) | |||||||||||||
|
|
|
|||||||||||||||
| Total comprehensive loss |
(1,922) | (15) | (1,937) | |||||||||||||
|
|
|
|||||||||||||||
| Loss attributable to: |
||||||||||||||||
| Equity holders of the Company |
(1,739) | - | (1,739) | |||||||||||||
| Non-controlling interests |
(122) | - | (122) | |||||||||||||
|
|
|
|||||||||||||||
| (1,861) | - | (1,861) | ||||||||||||||
|
|
|
|||||||||||||||
| Total comprehensive loss attributable to: |
||||||||||||||||
| Equity holders of the Company |
(1,800) | (15) | (1,815) | |||||||||||||
| Non-controlling interests |
(122) | - | (122) | |||||||||||||
|
|
|
|||||||||||||||
| (1,922) | (15) | (1,937) | ||||||||||||||
|
|
|
|||||||||||||||
A-32
Table of Contents
BROADCOM LIMITED AND ITS SUBSIDIARIES
NOTES TO THE FINANCIAL STATEMENTS
For the financial year ended 29 October 2017
| 2. | Significant accounting policies (continued) |
| 2.1 | Basis of preparation (continued) |
FRS 101 first-time adoption of Financial Reporting Standards (continued)
| (b) | Summary of financial impact (continued) |
| (ii) | Reconciliation of the Group’s total comprehensive income reported in accordance with the previous GAAP to FRS (continued) |
| B | Presentation of Expenses |
Under the previous GAAP, expenses are presented in a multiple-step format. Under FRS, the Group has reclassified expenses into their functional groups. Expenses based on nature are disclosed in Note 5 of this FRS financial statements. The following explanatory notes reconcile the difference between expenses reported under FRS to those reported under the previous GAAP.
| B1 | Classification of Cost of sales |
Cost of sales amounting to US$7,300 million for the financial year ended 30 October 2016 under FRS represents the aggregated line items under the previous GAAP of “Cost of products sold”, “Purchase accounting effect on inventory”, “Amortisation of acquisition-related intangible assets” and “Restructuring charges” in the financial year.
| B2 | Classification of Other expenses |
Other expenses amounting to US$2,869 million for the financial year ended 30 October 2016 under FRS represent the aggregated line items under the previous GAAP of “Amortisation of acquisition-related intangible assets” and “Restructuring, impairment and disposal charges” in the financial year.
| B3 | Classification of Finance costs |
Finance costs amounting to US$708 million for the financial year ended 30 October 2016 under FRS represent the aggregated line items under the previous GAAP of “Interest expense” and “Loss on extinguishment of debt” in the financial year.
A-33
Table of Contents
BROADCOM LIMITED AND ITS SUBSIDIARIES
NOTES TO THE FINANCIAL STATEMENTS
For the financial year ended 29 October 2017
| 2. | Significant accounting policies (continued) |
| 2.1 | Basis of preparation (continued) |
FRS 101 first-time adoption of Financial Reporting Standards (continued)
| (b) | Summary of financial impact (continued) |
| (iii) | The result and impact of transition to FRS on the Company’s financial statements are as follow: |
| Expla- natory Note |
30 October 2016 | 2 November 2015 | ||||||||||||||||||||||||||
| As previously reported |
As restated | As previously reported |
As restated | |||||||||||||||||||||||||
| (a) | (b) | (c) = (a)+(b) | (d) | (e) | (f) = (d)+(e) | |||||||||||||||||||||||
| US$ millions | US$ millions | US$ millions | US$ millions | US$ millions | US$ millions | |||||||||||||||||||||||
| Non-current asset |
||||||||||||||||||||||||||||
| Cost of investments in subsidiaries |
C1 | 18,958 | 2,271 | 21,229 | 4,121 | - | 4,121 | |||||||||||||||||||||
| Equity |
||||||||||||||||||||||||||||
| (Accumulated deficits)/Retained profits |
C1 | (215) | 2,292 | 2,077 | 2,240 | - | 2,240 | |||||||||||||||||||||
| Share Capital |
C2 | 19,241 | (779) | 18,462 | 2,547 | (2,547) | * | |||||||||||||||||||||
| Other reserves |
C1, C2 | - | 624 | 624 | - | 2,474 | 2,474 | |||||||||||||||||||||
| Accumulated other comprehensive loss |
C1, C2 | (134) | 134 | - | (73) | 73 | - | |||||||||||||||||||||
|
|
|
|||||||||||||||||||||||||||
| 18,892 | 2,271 | 21,163 | 4,714 | - | 4,714 | |||||||||||||||||||||||
|
|
|
|||||||||||||||||||||||||||
| * | Represents figures less than a million. |
| C1 | Deemed cost of investments in subsidiaries |
The Group has elected to adopt deemed cost for investments in subsidiaries as described in Note 2.1(a)(ii) at the date of transition.
As of 30 October 2016, the carrying amount of the cost of investments in subsidiaries is accounted for at costs less accumulated impairment losses in accordance with accounting policy described in Note 2.3. As a result, the carrying amount of the cost of investments increased by US$2,271 million. This is due to the reversal of accounting entries made under the previous GAAP for the share of the Company’s subsidiaries’ accumulated losses and dividends amounting to US$2,292 million and the share of the Company’s subsidiaries’ other reserves and accumulated other comprehensive loss amounting to a net amount of US$21 million. Under the previous GAAP, these amounts were recorded in the cost of investments in subsidiaries using the equity method of accounting.
A-34
Table of Contents
BROADCOM LIMITED AND ITS SUBSIDIARIES
NOTES TO THE FINANCIAL STATEMENTS
For the financial year ended 29 October 2017
| 2. | Significant accounting policies (continued) |
| 2.1 | Basis of preparation (continued) |
FRS 101 first-time adoption of Financial Reporting Standards (continued)
| (b) | Summary of financial impact (continued) |
| (iii) | The result and impact of transition to FRS on the Company’s financial statements are as follow: (continued) |
| C2 | Classification of other reserves |
The Company has changed the presentation of certain amounts under “Share Capital” to reflect FRS 1 requirement to disclose the ordinary class of share capital and other reserves in equity which is described in detail in Note 32.
US$779 million and US$2,547 million of “Share Capital” under the previous GAAP are reclassified to be presented as “Other reserves” in the balance sheet presented as at 30 October 2016 and 2 November 2015, respectively.
US$134 million and US$73 million of “Accumulated other comprehensive loss” under the previous GAAP are reclassified to be presented as “Other reserves” in the balance sheet presented as at 30 October 2016 and 2 November 2015, respectively.
| 2.2 | Revenue recognition |
Sales comprise the fair value of the consideration received or receivable for the sale of goods and rendering of services in the ordinary course of the Group’s activities. Sales are presented, net of value-added tax, rebates and discounts, and after eliminating sales within the Group.
The Group assesses its role as an agent or principal for each transaction and in an agency arrangement the amounts collected on behalf of the principal are excluded from revenue. The Group recognises revenue when the amount of revenue and related cost can be reliably measured, it is probable that the collectability of the related receivables is reasonably assured and when the specific criteria for each of the Group’s activities are met as follows:
| (a) | Sale of goods |
The Group recognises revenue related to sales of products, net of trade discounts and allowances, provided that (i) persuasive evidence of an arrangement exists, (ii) delivery has occurred and title and risk of loss have transferred, (iii) the price is fixed or determinable and (iv) collectability is reasonably assured. Delivery is considered to have occurred when title and risk of loss have transferred to the customer. The Group considers the price to be determinable when the price is not subject to refund or adjustments or when any such adjustments can be
A-35
Table of Contents
BROADCOM LIMITED AND ITS SUBSIDIARIES
NOTES TO THE FINANCIAL STATEMENTS
For the financial year ended 29 October 2017
| 2. | Significant accounting policies (continued) |
| 2.2 | Revenue recognition (continued) |
| (a) | Sale of goods (continued) |
estimated. The Group evaluates the creditworthiness of its customers to determine that appropriate credit limits are established prior to the acceptance of an order. Revenue, including sales to resellers and distributors, is reduced for estimated returns and distributor allowances. The Group recognises revenue from sales of products to distributors upon delivery of product to the distributors. An allowance for distributor credits covering price adjustments is made based on an estimate of historical experience rates as well as considering economic conditions and contractual terms. To date, actual distributor claims activity has been materially consistent with the provisions made based on historical estimates. The Group also records reductions of revenue for rebates, in the same period that the related revenue is recorded. The Group accrues 100% of potential rebates at the time of sale and does not apply a breakage factor. The Group reverses the accrual of unclaimed rebate amounts as specific rebate programs contractually end and when unclaimed rebates are no longer subject to payment and will not be paid. Thus, the reversal of unclaimed rebates may have a positive impact on the Group’s net revenue and results of operations in subsequent periods.
| (b) | Licensing of intellectual property |
The Group recognises revenue from the sales and licensing of its intellectual property when the following fundamental criteria are met: (i) persuasive evidence of an arrangement exists, (ii) delivery has occurred, (iii) the sales price is fixed or determinable, and (iv) collection of resulting receivables is reasonably assured. Revenue from upfront payments for the licensing of the Group’s patents is recognised when the arrangement is mutually signed, if there is no future delivery or future performance obligation and all other criteria are met. Revenue from guaranteed royalty streams are recognised when paid, or collection is reasonably assured and all other criteria are met. When patent licensing arrangements include royalties for future sales of the licensees’ products using the Group’s licensed patented technology, revenue is recognised when the royalty report is received from the licensee, at which time the sales price is determinable, provided that all other criteria have been met.
| (c) | Revenue from development agreement |
The Group enters into development agreements with some of its customers and recognises revenue from these agreements upon completion and acceptance by the customer of contract deliverables or as services are provided, depending on the terms of the arrangement. Revenue is deferred for any amounts billed or received prior to completion or delivery of services. As the Group retains the intellectual property generated from these development agreements, costs related to these arrangements are included in research and development expense.
A-36
Table of Contents
BROADCOM LIMITED AND ITS SUBSIDIARIES
NOTES TO THE FINANCIAL STATEMENTS
For the financial year ended 29 October 2017
| 2. | Significant accounting policies (continued) |
| 2.3 | Group accounting |
| (a) | Subsidiaries |
| (i) | Consolidation |
Subsidiaries are all entities (including structured entities) over which the Group has control. The Group controls an entity when the Group is exposed to, or has rights to, variable returns from its involvement with the entity and has the ability to affect those returns through its power over the entity. Subsidiaries are fully consolidated from the date on which control is transferred to the Group. They are deconsolidated from the date on that control ceases.
In preparing the consolidated financial statements, transactions, balances and unrealised gains on transactions between group entities are eliminated. Unrealised losses are also eliminated unless the transaction provides evidence of an impairment indicator of the transferred asset. Accounting policies of subsidiaries have been changed where necessary to ensure consistency with the policies adopted by the Group.
Non-controlling interests comprise the portion of a subsidiary’s net results of operations and its net assets, which is attributable to the interests that are not owned directly or indirectly by the equity holders of the Company. They are shown separately in the consolidated statement of comprehensive income, statement of changes in equity, and balance sheet. Total comprehensive income is attributed to the non-controlling interests based on their respective interests in a subsidiary, even if this results in the non-controlling interests having a deficit balance.
| (ii) | Acquisitions |
The acquisition method of accounting is used to account for business combinations entered into by the Group. The consideration transferred for the acquisition of a subsidiary or business comprises the fair value of the assets transferred, the liabilities incurred and the equity interests issued by the Group. The consideration transferred also includes any contingent consideration arrangement and any pre-existing equity interest in the subsidiary measured at their fair values at the acquisition date. Acquisition-related costs are expensed as incurred. Identifiable assets acquired and liabilities and contingent liabilities assumed in a business combination are, with limited exceptions, measured initially at their fair values at the acquisition date. On an acquisition-by-acquisition basis, the Group recognises any non-controlling interest in the acquiree at the date of acquisition either at fair value or at the non-controlling interest’s proportionate share of the acquiree’s identifiable net assets.
The excess of (a) the consideration transferred, the amount of any non-controlling interest in the acquiree and the acquisition-date fair value of any previous equity interest in the acquiree over the (b) fair value of the identifiable net assets acquired is recorded as goodwill. Please refer to Note 2.5(a) for the subsequent accounting policy on goodwill.
A-37
Table of Contents
BROADCOM LIMITED AND ITS SUBSIDIARIES
NOTES TO THE FINANCIAL STATEMENTS
For the financial year ended 29 October 2017
| 2. | Significant accounting policies (continued) |
| 2.3 | Group accounting (continued) |
| (a) | Subsidiaries (continued) |
| (iii) | Disposals |
When a change in the Group’s ownership interest in a subsidiary results in a loss of control over the subsidiary, the assets and liabilities of the subsidiary including any goodwill are derecognised. Amounts previously recognised in other comprehensive income in respect of that entity are also reclassified to profit or loss or transferred directly to retained earnings if required by a specific Standard.
Any retained equity interest in the entity is re-measured at fair value. The difference between the carrying amount of the retained interest at the date when control is lost and its fair value is recognised in profit or loss.
Please refer to Note 2.7 for the subsequent accounting policy on investments in subsidiaries.
| (b) | Transactions with non-controlling interests |
Changes in the Group’s ownership interest in a subsidiary that do not result in a loss of control over the subsidiary are accounted for as transactions with equity owners of the Company. Any difference between the change in the carrying amounts of the non-controlling interest and the fair value of the consideration paid or received is recognised within equity attributable to the equity holders of the Company.
| 2.4 | Property, plant and equipment |
| (a) | Measurement |
| (i) | Land and buildings |
Land and buildings are initially recognised at cost. Buildings are subsequently carried at the revalued amounts less accumulated depreciation and accumulated impairment losses.
| (ii) | Other property, plant and equipment |
All other items of property, plant and equipment are initially recognised at cost and subsequently carried at cost less accumulated depreciation and accumulated impairment losses.
A-38
Table of Contents
BROADCOM LIMITED AND ITS SUBSIDIARIES
NOTES TO THE FINANCIAL STATEMENTS
For the financial year ended 29 October 2017
| 2. | Significant accounting policies (continued) |
| 2.4 | Property, plant and equipment (continued) |
| (a) | Measurement (continued) |
| (iii) | Components of costs |
The cost of an item of property, plant and equipment initially recognised includes its purchase price and any cost that is directly attributable to bringing the asset to the location and condition necessary for it to be capable of operating in the manner intended by management. Cost also includes borrowing costs (refer to Note 2.6 on borrowing costs).
| (b) | Depreciation |
Freehold land is not depreciated. Depreciation on other items of property, plant and equipment is calculated using the straight-line method to allocate their depreciable amounts over their estimated useful lives as follows:
| Main Category |
Useful lives | ||||
| Land |
8-40 years | ||||
| Buildings and leasehold improvements |
15-40 years | ||||
| Machinery and equipment |
3-10 years | ||||
The residual values, estimated useful lives and depreciation method of property, plant and equipment are reviewed, and adjusted as appropriate, at each balance sheet date. The effects of any revision are recognised in profit or loss when the changes arise.
| (c) | Subsequent expenditure |
Subsequent expenditure relating to property, plant and equipment that has already been recognised is added to the carrying amount of the asset only when it is probable that future economic benefits associated with the item will flow to the entity and the cost of the item can be measured reliably. All other repair and maintenance expenses are recognised in profit or loss when incurred.
| (d) | Disposal |
On disposal of an item of property, plant and equipment, the difference between the disposal proceeds and its carrying amount is recognised in profit or loss within “other gains and (losses)”.
| 2.5 | Intangible assets |
| (a) | Goodwill |
Goodwill on acquisitions of subsidiaries and businesses, represents the excess of (i) the sum of the consideration transferred, the amount of any non-controlling interest in the acquiree and the
A-39
Table of Contents
BROADCOM LIMITED AND ITS SUBSIDIARIES
NOTES TO THE FINANCIAL STATEMENTS
For the financial year ended 29 October 2017
| 2. | Significant accounting policies (continued) |
| 2.5 | Intangible assets (continued) |
| (a) | Goodwill (continued) |
acquisition-date fair value of any previous equity interest in the acquiree over (ii) the fair value of the identifiable net assets acquired. Goodwill on subsidiaries is recognised separately as intangible assets and carried at cost less accumulated impairment losses.
Gains and losses on the disposal of subsidiaries include the carrying amount of goodwill relating to the entity sold.
| (b) | Acquired identified finite-lived intangible assets |
Identified finite-lived intangible asset acquired such as developed technology, customer contracts and related relationships, order backlog and trade name, are initially recognised at cost and are subsequently carried at cost less accumulated amortisation and accumulated impairment losses. These costs are amortised to profit or loss using the straight-line method over periods up to 25 years, which is the shorter of their estimated useful lives and periods of contractual rights.
| (c) | In-process research and development |
Purchased in-process research and development (“IPR&D”) projects are capitalised at fair value as an indefinite lived intangible asset and assessed for impairment thereafter. Upon completion of each underlying project, IPR&D assets are reclassified to acquired identified finite-lived intangible assets and amortised over their estimated useful lives.
| 2.6 | Borrowing costs |
Borrowing costs are recognised in profit or loss using the effective interest method except for those costs that are directly attributable to the construction or development of properties and assets under construction.
The actual borrowing costs incurred during the period up to the issuance of the temporary occupation permit less any investment income on temporary investment of these borrowings, are capitalised in the cost of the property under development. Borrowing costs on general borrowings are capitalised by applying a capitalisation rate to construction or development expenditures that are financed by general borrowings.
| 2.7 | Investments in subsidiaries |
Investments in subsidiaries are carried at cost less accumulated impairment losses in the Company’s balance sheet. On disposal of such investments, the difference between disposal proceeds and the carrying amounts of the investments are recognised in profit or loss.
A-40
Table of Contents
BROADCOM LIMITED AND ITS SUBSIDIARIES
NOTES TO THE FINANCIAL STATEMENTS
For the financial year ended 29 October 2017
| 2. | Significant accounting policies (continued) |
| 2.8 | Impairment of non-financial assets |
| (a) | Goodwill |
Goodwill recognised separately as an intangible asset is tested for impairment annually and whenever there is indication that the goodwill may be impaired.
For the purpose of impairment testing of goodwill, goodwill is allocated to each of the Group’s cash-generating-units (“CGU”) expected to benefit from synergies arising from the business combination.
An impairment loss is recognised when the carrying amount of a CGU, including the goodwill, exceeds the recoverable amount of the CGU. The recoverable amount of a CGU is the higher of the CGU’s fair value less cost to sell and value-in-use.
The total impairment loss of a CGU is allocated first to reduce the carrying amount of goodwill allocated to the CGU and then to the other assets of the CGU pro-rata on the basis of the carrying amount of each asset in the CGU.
An impairment loss on goodwill is recognised as an expense and is not reversed in a subsequent period.
| (b) | Intangible assets Property, plant and equipment Investments in subsidiaries |
Intangible assets, property, plant and equipment and investments in subsidiaries are tested for impairment whenever there is any objective evidence or indication that these assets may be impaired.
For the purpose of impairment testing, the recoverable amount (i.e. the higher of the fair value less cost to sell and the value-in-use) is determined on an individual asset basis unless the asset does not generate cash inflows that are largely independent of those from other assets. If this is the case, the recoverable amount is determined for the CGU to which the asset belongs.
If the recoverable amount of the asset (or CGU) is estimated to be less than its carrying amount, the carrying amount of the asset (or CGU) is reduced to its recoverable amount.
The difference between the carrying amount and recoverable amount is recognised as an impairment loss in profit or loss.
An impairment loss for an asset other than goodwill is reversed only if, there has been a change in the estimates used to determine the asset’s recoverable amount since the last impairment loss was recognised. The carrying amount of this asset is increased to its revised recoverable amount, provided that this amount does not exceed the carrying amount that would have been determined (net of any accumulated amortisation or depreciation) had no impairment loss been recognised for the asset in prior years.
A-41
Table of Contents
BROADCOM LIMITED AND ITS SUBSIDIARIES
NOTES TO THE FINANCIAL STATEMENTS
For the financial year ended 29 October 2017
| 2. | Significant accounting policies (continued) |
| 2.8 | Impairment of non-financial assets (continued) |
| (b) | Intangible assets Property, plant and equipment Investments in subsidiaries (continued) |
A reversal of impairment loss for an asset other than goodwill is recognised in profit or loss, unless the asset is carried at revalued amount, in which case, such reversal is treated as a revaluation increase. However, to the extent that an impairment loss on the same revalued asset was previously recognised as an expense, a reversal of that impairment is also recognised in profit or loss.
Purchased IPR&D projects are capitalised at fair value as an indefinite lived intangible asset and assessed for impairment thereafter. If an IPR&D project is abandoned, the Group recognises the carrying value of the related intangible asset in the consolidated statements of comprehensive income in the period it is abandoned. On a quarterly basis, the Group monitors factors and changes in circumstances that could indicate carrying amounts of long-lived assets, including purchased intangible assets, and property, plant and equipment, may not be recoverable.
Factors the Group considers important which could trigger an impairment review include (i) significant under-performance relative to historical or projected future operating results, (ii) significant changes in the manner of the use of the acquired assets or the strategy for the overall business, and (iii) significant negative industry or economic trends. An impairment loss must be measured if the sum of the expected future cash flows (undiscounted and before interest) from the use and eventual disposition of the asset (or asset group) is less than the net book value of the asset (or asset group). The amount of the impairment loss will generally be measured as the difference between the net book value of the asset (or asset group) and the estimated fair value.
| 2.9 | Financial assets |
| (a) | Classification |
The Group classifies its financial assets as loans and receivables. The classification depends on the purpose for which the assets were acquired. Management determines the classification of its financial assets at initial recognition.
Loans and receivables
Loans and receivables are non-derivative financial assets with fixed or determinable payments that are not quoted in an active market. They are presented as current assets, except for those expected to be realised later than 12 months after the balance sheet date which are presented as non-current assets. Loans and receivables are presented as “trade receivables and other current assets” (Note 13) and “cash and cash equivalents” (Note 12) on the balance sheet.
A-42
Table of Contents
BROADCOM LIMITED AND ITS SUBSIDIARIES
NOTES TO THE FINANCIAL STATEMENTS
For the financial year ended 29 October 2017
| 2. | Significant accounting policies (continued) |
| 2.9 | Financial assets (continued) |
| (b) | Recognition and derecognition |
Financial assets are derecognised when the rights to receive cash flows from the financial assets have expired or have been transferred and the Group has transferred substantially all risks and rewards of ownership. On disposal of a financial asset, the difference between the carrying amount and the sale proceeds is recognised in profit or loss. Any amount previously recognised in other comprehensive income relating to that asset is reclassified to profit or loss.
| (c) | Initial measurement |
Financial assets are initially recognised at fair value plus transaction costs except for financial assets at fair value through profit or loss, which are recognised at fair value. Transaction costs for financial assets at fair value through profit or loss are recognised immediately as expenses.
| (d) | Impairment |
The Group assesses at each balance sheet date whether there is objective evidence that a financial asset or a group of financial assets is impaired and recognises an allowance for impairment when such evidence exists.
| (i) | Loans and receivables financial assets |
Significant financial difficulties of the debtor, probability that the debtor will enter bankruptcy and default or significant delay in payments are objective evidence that these financial assets are impaired.
The carrying amount of these assets is reduced through the use of an impairment allowance account which is calculated as the difference between the carrying amount and the present value of estimated future cash flows, discounted at the original effective interest rate. When the asset becomes uncollectible, it is written off against the allowance account. Subsequent recoveries of amounts previously written off are recognised against the same line item in profit or loss.
The impairment allowance is reduced through profit or loss in a subsequent period when the amount of impairment loss decreases and the related decrease can be objectively measured. The carrying amount of the asset previously impaired is increased to the extent that the new carrying amount does not exceed the amortised cost had no impairment been recognised in prior periods.
A-43
Table of Contents
BROADCOM LIMITED AND ITS SUBSIDIARIES
NOTES TO THE FINANCIAL STATEMENTS
For the financial year ended 29 October 2017
| 2. | Significant accounting policies (continued) |
| 2.10 | Offsetting of financial instruments |
Financial assets and liabilities are offset and the net amount reported in the balance sheet when there is a legally enforceable right to offset and there is an intention to settle on a net basis or realise the asset and settle the liability simultaneously.
| 2.11 | Financial guarantees |
The Company has issued corporate guarantees to banks for bank borrowings of its subsidiaries. These guarantees are financial guarantees as they require the Company to reimburse the banks if the subsidiaries fail to make principal or interest payments when due in accordance with the terms of their borrowings.
Financial guarantees are initially recognised at their fair values plus transaction costs in the Company’s balance sheet.
Financial guarantees are subsequently amortised to profit or loss over the period of the subsidiaries’ borrowings, unless it is probable that the Company will reimburse the banks for an amount higher than the unamortised amount. In this case, the financial guarantees shall be carried at the expected amount payable to the banks in the Company’s balance sheet.
Intra-group transactions are eliminated on consolidation.
| 2.12 | Borrowings |
Borrowings are presented as current liabilities unless the Group has an unconditional right to defer settlement for at least 12 months after the balance sheet date, in which case they are presented as non-current liabilities.
Borrowings are initially recognised at fair value (net of transaction costs) and subsequently carried at amortised cost. Any difference between the proceeds (net of transaction costs) and the redemption value is recognised in profit or loss over the period of the borrowings using the effective interest method.
| 2.13 | Trade and other payables |
Trade and other payables represent liabilities for goods and services provided to the Group prior to the end of financial year which are unpaid. They are classified as current liabilities if payment is due within one year or less (or in the normal operating cycle of the business if longer). Otherwise, they are presented as non-current liabilities.
Trade and other payables are initially recognised at fair value, and subsequently carried at amortised cost using the effective interest method.
A-44
Table of Contents
BROADCOM LIMITED AND ITS SUBSIDIARIES
NOTES TO THE FINANCIAL STATEMENTS
For the financial year ended 29 October 2017
| 2. | Significant accounting policies (continued) |
| 2.14 | Leases |
| (a) | When the Group is the lessee |
The Group leases certain buildings, machinery and equipment under finance leases and buildings, machinery and equipment under operating leases from non-related parties.
| (i) | Lessee - Finance leases |
Leases where the Group assumes substantially all risks and rewards incidental to ownership of the leased assets are classified as finance leases.
The leased assets and the corresponding lease liabilities (net of finance charges) under finance leases are recognised on the balance sheet as plant and equipment and borrowings, respectively, at the inception of the leases based on the lower of the fair value of the leased assets and the present value of the minimum lease payments.
Each lease payment is apportioned between the finance expense and the reduction of the outstanding lease liability. The finance expense is recognised in profit or loss on a basis that reflects a constant periodic rate of interest on the finance lease liability.
| (ii) | Lessee - Operating leases |
Leases where substantially all risks and rewards incidental to ownership are retained by the lessors are classified as operating leases. Payments made under operating leases (net of any incentives received from the lessors) are recognised in profit or loss on a straight-line basis over the period of the lease.
Contingent rents are recognised as an expense in profit or loss when incurred.
| 2.15 | Inventories |
Inventories are carried at the lower of cost and net realisable value. Cost is determined using the first-in, first-out method. The cost of finished goods and work-in-progress comprises raw materials, direct labour, other direct costs and related production overheads (based on normal operating capacity) but excludes borrowing costs. Net realisable value is the estimated selling price in the ordinary course of business, less the estimated costs of completion and applicable variable selling expenses.
| 2.16 | Income taxes |
Current income tax for current and prior periods is recognised at the amount expected to be paid to or recovered from the tax authorities, using the tax rates and tax laws that have been enacted or substantively enacted by the balance sheet date.
A-45
Table of Contents
BROADCOM LIMITED AND ITS SUBSIDIARIES
NOTES TO THE FINANCIAL STATEMENTS
For the financial year ended 29 October 2017
| 2. | Significant accounting policies (continued) |
| 2.16 | Income taxes (continued) |
Deferred income tax is recognised for all temporary differences arising between the tax bases of assets and liabilities and their carrying amounts in the financial statements except when the deferred income tax arises from the initial recognition of goodwill or an asset or liability in a transaction that is not a business combination and affects neither accounting nor taxable profit or loss at the time of the transaction.
A deferred income tax liability is recognised on temporary differences arising on investments in subsidiaries, except where the Group is able to control the timing of the reversal of the temporary difference and it is probable that the temporary difference will not reverse in the foreseeable future.
A deferred income tax asset is recognised to the extent that it is probable that future taxable profit will be available against which the deductible temporary differences and tax losses can be utilised.
Deferred income tax is measured:
| (i) | at the tax rates that are expected to apply when the related deferred income tax asset is realised or the deferred income tax liability is settled, based on tax rates and tax laws that have been enacted or substantively enacted by the balance sheet date; and |
| (ii) | based on the tax consequence that will follow from the manner in which the Group expects, at the balance sheet date, to recover or settle the carrying amounts of its assets and liabilities measured at fair value is presumed to be recovered entirely through sale. |
Current and deferred income taxes are recognised as income or expense in profit or loss, except to the extent that the tax arises from a business combination or a transaction which is recognised directly in equity. Deferred tax arising from a business combination is adjusted against goodwill on acquisition.
The Group accounts for investment tax credits (for example, productivity and innovative credit) similar to accounting for other tax credits where deferred tax asset is recognised for unused tax credits to the extent that it is probable that future taxable profit will be available against which the unused tax credit can be utilised.
| 2.17 | Provisions |
Provisions for warranty, accrued rebates and restructuring liabilities are recognised when the Group has a present legal or constructive obligation as a result of past events, it is more likely than not that an outflow of resources will be required to settle the obligation and the amount has been reliably estimated.
Other provisions are measured at the present value of the expenditure expected to be required to settle the obligation using a pre-tax discount rate that reflects the current market assessment of the time value of money and the risks specific to the obligation. The increase in the provision due to the passage of time is recognised in the statement of comprehensive income as finance expense.
A-46
Table of Contents
BROADCOM LIMITED AND ITS SUBSIDIARIES
NOTES TO THE FINANCIAL STATEMENTS
For the financial year ended 29 October 2017
| 2. | Significant accounting policies (continued) |
| 2.17 | Provisions (continued) |
Changes in the estimated timing or amount of the expenditure or discount rate are recognised in profit or loss when the changes arise.
| 2.18 | Employee compensation |
Employee benefits are recognised as an expense, unless the cost qualifies to be capitalised as an asset.
| (a) | Defined contribution plans |
Defined contribution plans are post-employment benefit plans under which the Group pays fixed contributions into separate entities such as the Central Provident Fund on a mandatory, contractual or voluntary basis. The Group has no further payment obligations once the contributions have been paid.
| (b) | Share-based compensation |
The Group operates an equity-settled, share-based compensation plan. The value of the employee services received in exchange for the grant of options is recognised as an expense with a corresponding increase in the share option reserve over the vesting period. The total amount to be recognised over the vesting period is determined by reference to the fair value of the options granted on grant date. Non-market vesting conditions are included in the estimation of the number of shares under options that are expected to become exercisable on the vesting date. At each balance sheet date, the Group revises its estimates of the number of shares under options that are expected to become exercisable on the vesting date and recognises the impact of the revision of the estimates in profit or loss, with a corresponding adjustment to the share option reserve over the remaining vesting period.
When the options are exercised, the proceeds received (net of transaction costs) and the related balance previously recognised in the share option reserve are credited to share capital account.
| (c) | Termination benefits |
Termination benefits are those benefits which are payable when employment is terminated before the normal retirement date, or whenever an employee accepts voluntary redundancy in exchange for these benefits. The Group recognises termination benefits at the earlier of the following dates: (a) when the Group can no longer withdraw the offer of those benefits; and (b) when the Group recognises costs for a restructuring that is within the scope of FRS 37 and involves the payment of termination benefits. In the case of an offer made to encourage voluntary redundancy, the termination benefits are measured based on the number of employees expected to accept the offer. Benefits falling due more than 12 months after the end of the reporting period are discounted to their present value.
A-47
Table of Contents
BROADCOM LIMITED AND ITS SUBSIDIARIES
NOTES TO THE FINANCIAL STATEMENTS
For the financial year ended 29 October 2017
| 2. | Significant accounting policies (continued) |
| 2.18 | Employee compensation (continued) |
| (d) | Defined benefit plans |
The Group’s net obligation in respect of defined benefit plans is calculated separately for each plan by estimating the amount of future benefit that employees have earned in the current and prior periods, discounting that amount and deducting the fair value of any plan assets.
The calculation of defined benefit obligations is performed annually by a qualified actuary using the projected unit credit method. When the calculation results in a potential asset for the Group, the recognised asset is limited to the present value of economic benefits available in the form of any future refunds from the plan or reductions in future contributions to the plan. To calculate the present value of economic benefits, consideration is given to any applicable minimum funding requirements.
Re-measurements of the net defined benefit liability, which comprise actuarial gains and losses, the return on plan assets (excluding interest) and the effect of the asset ceiling (if any, excluding interest), are recognised immediately in Other Comprehensive Income. The Group determines the net interest expense (income) on the net defined benefit liability (asset) for the period by applying the discount rate used to measure the defined benefit obligation at the beginning of the annual period to the then net defined benefit liability/(asset), taking into account any changes in the net defined benefit liability/(asset) during the period as a result of contributions and benefit payments. Net interest expense and other expenses related to defined benefit plans are recognised in profit or loss. Actuarial gains and losses arising from experience adjustments and changes in actuarial assumptions are charged to other comprehensive income in the period when they arise. The experience adjustments are not to be reclassified to profit or loss in a subsequent period.
| (i) | Retirement benefits |
Post-retirement benefit plan assets and liabilities are estimates of benefits that the Group expects to pay to eligible retirees. The Group considers various factors in determining the value of the post-retirement net assets, including the number of employees that the Group expects to receive benefits and other actuarial assumptions.
| (ii) | Defined benefit pension plans |
The Group considers various factors in determining the respective pension liabilities and net periodic benefit costs, including the number of employees that the Group expects to receive benefits, their salary levels and years of service, the expected return on plan assets, the discount rate, the timing of the payment of benefits, and other actuarial assumptions. If the actual results and events of the retirement benefit plans differ from current assumptions, the benefit obligations may be over- or under-valued. The key benefit plan
A-48
Table of Contents
BROADCOM LIMITED AND ITS SUBSIDIARIES
NOTES TO THE FINANCIAL STATEMENTS
For the financial year ended 29 October 2017
| 2. | Significant accounting policies (continued) |
| 2.18 | Employee compensation (continued) |
| (d) | Defined benefit plans (continued) |
| (ii) | Defined benefit pension plans (continued) |
assumptions are the discount rate and the expected rate of return on plan assets. The assumptions discussed below are for the U.S. retirement benefit plans. For the non-U.S. plans, the Group chooses assumptions specific to each country.
The U.S. discount rates are based on the results of matching expected plan benefit payments with cash flows from a hypothetical yield curve constructed with high-quality corporate bond yields. The Group bases the salary increase assumptions on historical experience and future expectations. In developing the expected rate of return, the Group considers long-term compound annualized returns based on historical market data, historical and expected returns on the various categories of plan assets, and the target investment portfolio allocation among debt, equity securities and other investments.
| 2.19 | Currency translation |
| (a) | Functional and presentation currency |
Items included in the financial statements of each entity in the Group are measured using the currency of the primary economic environment in which the entity operates (“functional currency”). The financial statements are presented in U.S. dollar which is the functional currency of the Company.
| (b) | Transactions and balances |
Transactions in a currency other than the functional currency (“foreign currency”) are translated into the functional currency using the exchange rates at the dates of the transactions. Currency exchange differences resulting from the settlement of such transactions and from the translation of monetary assets and liabilities denominated in foreign currencies at the closing rates at the balance sheet date are recognised in profit or loss. However, in the consolidated financial statements, currency translation differences arising from borrowings in foreign currencies and other currency instruments designated and qualifying as net investment hedges and net investment in foreign operations, are recognised in other comprehensive income and accumulated in the currency translation reserve.
When a foreign operation is disposed of or any loan forming part of the net investment of the foreign operation is repaid, a proportionate share of the accumulated currency translation differences is reclassified to profit or loss, as part of the gain or loss on disposal.
A-49
Table of Contents
BROADCOM LIMITED AND ITS SUBSIDIARIES
NOTES TO THE FINANCIAL STATEMENTS
For the financial year ended 29 October 2017
| 2. | Significant accounting policies (continued) |
| 2.19 | Currency translation (continued) |
| (b) | Transactions and balances (continued) |
Foreign exchange gains and losses that relate to borrowings are presented in the income statement within “finance cost”. All other foreign exchange gains and losses impacting profit or loss are presented in the income statement within “other gains and losses”.
Non-monetary items measured at fair values in foreign currencies are translated using the exchange rates at the date when the fair values are determined.
| (c) | Translation of Group entities’ financial statements |
The results and financial position of all the Group entities (none of which has the currency of a hyperinflationary economy) that have a functional currency different from the presentation currency are translated into the presentation currency as follows:
| (i) | assets and liabilities are translated at the closing exchange rates at the reporting date; |
| (ii) | income and expenses are translated at average exchange rates (unless the average is not a reasonable approximation of the cumulative effect of the rates prevailing on the transaction dates, in which case income and expenses are translated using the exchange rates at the dates of the transactions); and |
| (iii) | all resulting currency translation differences are recognised in other comprehensive income and accumulated in the currency translation reserve. These currency translation differences are reclassified to profit or loss on disposal or partial disposal of the entity giving rise to such reserve. |
Goodwill and fair value adjustments arising on the acquisition of foreign operations are treated as assets and liabilities of the foreign operations and translated at the closing rates at the reporting date.
Broadcom operates in a U.S. dollar functional currency environment. As such, foreign currency assets and liabilities are re-measured into U.S. dollar at current exchange rates except for non-monetary items such as inventory and property, plant and equipment, which are re-measured at historical exchange rates. The effects of foreign currency re-measurement were not material for any period presented.
| 2.20 | Segment reporting |
Operating segments are reported in a manner consistent with the internal reporting provided to the Chief Executive Officer of Broadcom, who has been identified as the Chief Operating Decision Maker (“CODM”) who is responsible for allocating resources and assessing performance of the operating segments.
A-50
Table of Contents
BROADCOM LIMITED AND ITS SUBSIDIARIES
NOTES TO THE FINANCIAL STATEMENTS
For the financial year ended 29 October 2017
| 2. | Significant accounting policies (continued) |
| 2.21 | Cash and cash equivalents |
For the purpose of presentation in the consolidated statement of cash flows, cash and cash equivalents include cash on hand and deposits with financial institutions which are subjected to an insignificant risk of change in value. For cash subjected to restriction, assessment is made on the economic substance of the restriction and whether they meet the definition of cash and cash equivalents.
| 2.22 | Share capital |
Ordinary shares are classified as equity. Incremental costs directly attributable to the issuance of new ordinary shares are deducted against the share capital account.
| 2.23 | Dividends to Company’s shareholders |
Dividends to the Company’s shareholders are recognised when the dividends are approved for payment.
| 2.24 | Capital reorganisation |
On 1 February 2016, Broadcom effected the Avago Scheme as described in Note 31. Upon completion of the Avago Scheme, shareholders of Avago became shareholders of Broadcom.
The Avago Scheme has been accounted for as a capital reorganisation and is presented as follows:
| (i) | The share capital as of 2 November 2015 amounts to US$2 and represents the share capital of Broadcom before the Avago Scheme. |
| (ii) | The capital reserve as of 2 November 2015 amounts to US$2,547 million and represents the share capital of Avago before the Avago Scheme that would be registered as the legal capital of Broadcom after the Avago Scheme. |
| (iii) | Pursuant to the Avago Scheme, all issued ordinary shares of Avago were exchanged on a one-for-one basis for newly issued ordinary shares of Broadcom on 1 February 2016. This is represented by a reclassification of US$2,547 million from the capital reserve to the share capital of Broadcom. |
| (iv) | The consolidated balance sheets of the Group as at 2 November 2015 and 30 October 2016, the consolidated statements of comprehensive income, the consolidated statements of change in equity and the consolidated statements of cash flow of the Group for the financial year ended 2 November 2015 and 30 October 2016 have been prepared as if Avago had been part of the Group throughout those financial years. |
| (v) | The assets and liabilities of Avago are brought into the Group’s books based on their existing carrying values in the consolidated financial statements of Avago. |
A-51
Table of Contents
BROADCOM LIMITED AND ITS SUBSIDIARIES
NOTES TO THE FINANCIAL STATEMENTS
For the financial year ended 29 October 2017
| 3. | Critical accounting estimates, assumptions and judgements |
Estimates, assumptions and judgements are continually evaluated and are based on historical experience and other factors, including expectations of future events that are believed to be reasonable under the circumstances.
| Critical accounting estimates and assumptions |
| (a) | Revenue recognition |
Broadcom recognises revenue from sales of products to distributors upon delivery of product to the distributors. An allowance for distributor credits covering price adjustments is made based on estimate of historical experience rates as well as considering economic conditions and contractual terms. To date, actual distributor claims activity has been materially consistent with the provisions Broadcom has made based on historical estimates. However, because of the inherent nature of estimates, there is always a risk that there could be significant differences between actual amounts and estimates. Different judgments or estimates could result in variances that might be significant to reported operating results.
Broadcom also records reductions of revenue for rebates, in the same period that the related revenue is recorded. Broadcom accrues 100% of potential rebates at the time of sale and do not apply a breakage factor. The accrual of unclaimed rebate amounts is reversed as specific rebate programs contractually end and when it is assessed that the unclaimed rebates are no longer subject to payment and will not be paid. Thus the reversal of unclaimed rebates may have a positive impact on the net revenue and net income in subsequent periods.
| (b) | Business combinations |
Accounting for business combinations requires management to make significant estimates and assumptions, especially at the acquisition date, including estimates for intangible assets, contractual obligations assumed, restructuring liabilities, pre-acquisition contingencies and contingent consideration, where applicable. Although the assumptions and estimates made in the past have been reasonable and appropriate, they are based, in part, on historical experience and information obtained from the management of the acquired companies and are inherently uncertain. Critical estimates in valuing certain of the intangible assets acquired include, but are not limited to: future expected cash flows from product sales, customer contracts and acquired technologies, expected costs to develop in-process research and development into commercially viable products, estimated cash flows from the projects when completed, and discount rates. The discount rates used to discount expected future cash flows to present value are typically derived from a weighted-average cost of capital analysis and adjusted to reflect inherent risks. Unanticipated events and circumstances may occur that may affect the accuracy or validity of such assumptions, estimates or actual results.
A-52
Table of Contents
BROADCOM LIMITED AND ITS SUBSIDIARIES
NOTES TO THE FINANCIAL STATEMENTS
For the financial year ended 29 October 2017
| 3. | Critical accounting estimates, assumptions and judgements (continued) |
Critical accounting estimates and assumptions (continued)
| (c) | Valuation of goodwill |
Broadcom performs an annual impairment review of goodwill during the fourth financial quarter of each year, and more frequently if indicators for impairment exist. The process of evaluating the potential impairment of goodwill is highly subjective and requires significant judgment. To review for impairment Broadcom assesses qualitative factors to determine whether events or circumstances lead to a determination that the fair value of any of cash generating units (“CGU”) is less than its carrying amount. The qualitative assessment of the recoverability of goodwill, whether performed annually or based on specific events or circumstances, considers various macroeconomic, industry-specific and company-specific factors. Those factors include: (i) severe adverse industry or economic trends; (ii) significant company-specific actions, including exiting an activity in conjunction with restructuring of operations; (iii) current, historical or projected deterioration of financial performance; or (iv) a sustained decrease in market capitalisation below net book value.
Management will assess and compute the fair value of goodwill allocated to each cash generating unit (“CGU”) taking into account the qualitative factor discussed above.
Determining the fair value of a CGU involves the use of significant estimates and assumptions. Management’s goodwill impairment test uses the income approach to estimate a CGU’s fair value. The income approach is based on the discounted cash flow method that uses the CGU estimates for forecasted future financial performance including revenues, operating expenses, and taxes, as well as working capital and capital asset requirements. These estimates are developed as part of Broadcom’s long-term planning process based on assumed market segment growth rates and assumed segment share, estimated costs based on historical data and various internal estimates. Projected cash flows are then discounted to a present value employing a discount rate that properly accounts for the estimated market weighted-average cost of capital, as well as any risk unique to the subjected cash flows.
| (d) | Income taxes |
Significant management judgment is required in developing provision for income taxes, including the determination of deferred tax assets and liabilities and the assessment of recoverability of deferred tax assets. Management has considered projected future taxable income and ongoing prudent and feasible tax planning strategies in assessing the recoverability of deferred tax assets. If management determines, in the future, that a deferred tax asset balance cannot be recovered, an adjustment to the deferred tax assets would increase the tax expense in the period in which such determination is made. In evaluating the exposure associated with various tax filing positions, an accrual of income tax liability is made when such positions do not meet the more-likely-than-not threshold for recognition.
A-53
Table of Contents
BROADCOM LIMITED AND ITS SUBSIDIARIES
NOTES TO THE FINANCIAL STATEMENTS
For the financial year ended 29 October 2017
| 3. | Critical accounting estimates, assumptions and judgements (continued) |
Critical accounting estimates and assumptions (continued)
| (d) | Income taxes (continued) |
The calculation of tax liabilities involves dealing with uncertainties in the application of complex tax law and regulations in a multitude of jurisdictions. Broadcom recognises potential liabilities for anticipated tax audit issues in Singapore and other tax jurisdictions based on management’s estimate of whether, and the extent to which, additional taxes and interest will be due. If estimation of income tax liabilities proves to be less than the actual amount ultimately assessed, a further charge to tax expense would be required. If the payment of these amounts ultimately proves to be unnecessary, the reversal of the accrued liabilities would result in tax benefits being recognised in the period when it is determined that the liabilities no longer exist.
The Group is subjected to Singapore income tax examination for financial years 2011 and later. The Group’s acquired companies are subject to tax examinations in major jurisdictions outside Singapore for financial years 2010 and later. Management has identified a gross unrecognised tax benefits of US$2,256 million for financial year 2017 and US$1,983 million for financial year 2016).
| 4. | Revenue |
| Group |
||||||||
| 2017 | 2016 | |||||||
| (US$ millions) | (US$ millions) | |||||||
| Sale of goods |
17,036 | 12,790 | ||||||
| Revenue from licensing of intellectual property |
338 | 199 | ||||||
| Revenue from development agreement |
262 | 251 | ||||||
| 17,636 | 13,240 | |||||||
A-54
Table of Contents
BROADCOM LIMITED AND ITS SUBSIDIARIES
NOTES TO THE FINANCIAL STATEMENTS
For the financial year ended 29 October 2017
| 5. | Expenses by nature |
The major components of cost of products sold, research and development, selling, general and administrative and other expenses include the following:
| Group |
||||||||
| 2017 | 2016 | |||||||
| (US$ millions) | (US$ millions) | |||||||
| Purchases of inventories and construction materials |
5,735 | 5,650 | ||||||
| Amortisation of intangible assets (Note 18(d)) |
4,285 | 2,638 | ||||||
| Depreciation of property, plant and equipment (Note 17) |
451 | 402 | ||||||
| Write-off of property, plant and equipment (Note 17) |
15 | 151 | ||||||
| Write-off and impairment of intangible assets (Note 18(b),(c)) |
13 | 423 | ||||||
| Total amortisation, depreciation and impairment |
4,764 | 3,614 | ||||||
| Employee compensation (Note 6) |
3,297 | 3,061 | ||||||
| Sub-contractor charges |
230 | 129 | ||||||
| Rental expense on operating leases |
109 | 93 | ||||||
| Manufacturing supplies |
200 | 228 | ||||||
| Professional services |
116 | 145 | ||||||
| Restructuring expense |
129 | 482 | ||||||
| Litigation settlements |
122 | - | ||||||
Litigation settlements relates to matters that existed at the balance sheet date of 29 October 2017, which primarily consists of expenses that became probable and reasonably estimable prior to the issuance of these consolidated financial statements. This amount does not take into consideration the receipt of any potential indemnity or contribution amounts the Group may become entitled to as a result of these settlements because such amounts are not probable or reasonably estimable as of the date hereof.
| 6. | Employee compensation |
| Group |
||||||||
| 2017 | 2016 | |||||||
| (US$ millions) | (US$ millions) | |||||||
| Wages and salaries |
2,087 | 1,778 | ||||||
| Other short-term benefits |
196 | 189 | ||||||
| Employer’s contribution to defined contribution plans |
7 | 13 | ||||||
| Termination benefits |
86 | 417 | ||||||
| Share-based compensation expenses |
921 | 664 | ||||||
| 3,297 | 3,061 | |||||||
A-55
Table of Contents
BROADCOM LIMITED AND ITS SUBSIDIARIES
NOTES TO THE FINANCIAL STATEMENTS
For the financial year ended 29 October 2017
| 7. | Retirement plans and post-retirement benefits |
Defined benefit plans
The U.S. defined benefit pension plans include a management plan and a represented plan. Benefits under the management plan are provided under either an adjusted career-average-pay program or a cash-balance program. Benefits under the represented plan are based on a dollar-per-month formula. Benefit accruals under the management plan were frozen in 2009. Participants in the adjusted career-average-pay program no longer earn service accruals. Participants in the cash-balance program no longer earn service accruals, but continue to earn 4% interest per year on their cash-balance accounts. There are no active participants under the represented plan. The Group also has a non-qualified supplemental pension plan in the United States that principally provides benefits based on compensation in excess of amounts that can be considered under the management plan. The Group also has pension plans covering certain non-U.S. employees.
Post-retirement benefit plans
Certain of the Group’s U.S. employees who were age 49 or younger on January 1, 2005 and who meet the retirement eligibility requirements as of their termination dates, may receive post-retirement medical benefits under the Group’s retiree medical account program. Eligible employees receive a medical benefit spending account of $55,000 upon retirement to pay premiums for medical coverage through the maximum age of 75 as retiree.
The Group’s group life insurance plan offers post-retirement life insurance coverage for certain U.S. employees.
Non-US retirement benefit plans
In addition to the defined benefit plans for certain employees in Taiwan, India, Japan, Israel, Italy and Germany, other eligible employees outside of the United States receive retirement benefits under various defined contribution retirement plans. Eligibility is generally determined based on the terms of the Group’s plans and local statutory requirements.
Net periodic benefit income
| Pension Benefits | Post-Retirement Benefits | |||||||||||||||||||||||||||
| 2017 | 2016 | 2015 | 2017 | 2016 | 2015 | |||||||||||||||||||||||
| (US$ millions) | ||||||||||||||||||||||||||||
| Net periodic benefit income |
||||||||||||||||||||||||||||
| Service cost |
4 | 3 | 3 | - | - | - | ||||||||||||||||||||||
| Interest cost |
53 | 59 | 61 | 3 | 3 | 3 | ||||||||||||||||||||||
| Expected return on plan assets |
(65 | ) | (72 | ) | (77 | ) | (4 | ) | (4 | ) | (5 | ) | ||||||||||||||||
| Net actuarial loss and prior service costs |
2 | 1 | 1 | - | - | - | ||||||||||||||||||||||
| Curtailments |
(1 | ) | - | - | - | - | - | |||||||||||||||||||||
| Settlements |
- | 3 | - | - | - | - | ||||||||||||||||||||||
| Net periodic benefit income |
(7 | ) | (6 | ) | (12 | ) | (1 | ) | (1 | ) | (2 | ) | ||||||||||||||||
| Net actuarial (income)/loss |
(60 | ) | 88 | 36 | (3 | ) | 11 | 1 | ||||||||||||||||||||
A-56
Table of Contents
BROADCOM LIMITED AND ITS SUBSIDIARIES
NOTES TO THE FINANCIAL STATEMENTS
For the financial year ended 29 October 2017
| 7. | Retirement plans and post-retirement benefits (continued) |
| Net periodic benefit income (continued) |
The Group expects to recognise $2 million of net actuarial losses in net periodic benefit income in financial year 2018 related to the Group’s defined benefit pension plans.
Funded status
| Pension Benefits | Post-Retirement Benefits | |||||||||||||||||||
| 2017 | 2016 | 2017 | 2016 | |||||||||||||||||
| (US$ millions) | ||||||||||||||||||||
| Change in plan assets: |
||||||||||||||||||||
| Fair value of plan assets — beginning of period |
1,050 | 1,052 | 78 | 78 | ||||||||||||||||
| Actual return on plan assets |
108 | 64 | 7 | 1 | ||||||||||||||||
| Employer contributions |
361 | 33 | - | - | ||||||||||||||||
| Payments from plan assets |
(93) | (93) | (2) | (1) | ||||||||||||||||
| Settlements |
- | (11) | - | - | ||||||||||||||||
| Plan assets acquired in acquisitions |
- | 5 | - | - | ||||||||||||||||
| Fair value of plan assets — end of period |
1,426 | 1,050 | 83 | 78 | ||||||||||||||||
| Pension Benefits | Post-Retirement Benefits | |||||||||||||||||||
| 2017 | 2016 | 2017 | 2016 | |||||||||||||||||
| (US$ millions) | ||||||||||||||||||||
| Change in benefit obligations: |
||||||||||||||||||||
| Benefit obligations — beginning of period |
1,566 | 1,511 | 79 | 69 | ||||||||||||||||
| Service cost |
4 | 3 | - | - | ||||||||||||||||
| Interest cost |
53 | 59 | 3 | 3 | ||||||||||||||||
| Actuarial (gain) loss |
(13) | 80 | - | 8 | ||||||||||||||||
| Benefit payments |
(93) | (93) | (2) | (1) | ||||||||||||||||
| Curtailments |
(4) | - | - | - | ||||||||||||||||
| Settlements |
(8) | (11) | - | - | ||||||||||||||||
| Benefit obligations assumed in acquisitions |
- | 17 | - | - | ||||||||||||||||
| Foreign currency impact |
3 | - | - | - | ||||||||||||||||
| Benefit obligations — end of period |
1,508 | 1,566 | 80 | 79 | ||||||||||||||||
| Overfunded (underfunded) status of benefit obligations |
(82) | (516) | 3 | (1) | ||||||||||||||||
A-57
Table of Contents
BROADCOM LIMITED AND ITS SUBSIDIARIES
NOTES TO THE FINANCIAL STATEMENTS
For the financial year ended 29 October 2017
| 7. | Retirement plans and post-retirement benefits (continued) |
Funded status (continued)
| Plans with benefit obligations in excess of plan assets: |
| Pension Benefits | Post-Retirement Benefits | |||||||||||||||||||
| 2017 | 2016 | 2017 | 2016 | |||||||||||||||||
| (US$ millions) | ||||||||||||||||||||
| Projected benefit obligations |
701 | 1,565 | - | - | ||||||||||||||||
| Accumulated benefit obligations |
696 | 1,557 | 15 | 16 | ||||||||||||||||
| Fair value of plan assets |
603 | 1,048 | - | - | ||||||||||||||||
| Plans with benefit obligations less than plan assets: |
| Pension Benefits | Post-Retirement Benefits | |||||||||||||||||||
| 2017 | 2016 | 2017 | 2016 | |||||||||||||||||
| (US$ millions) | ||||||||||||||||||||
| Projected benefit obligations |
807 | 1 | - | - | ||||||||||||||||
| Accumulated benefit obligations |
805 | 1 | 65 | 63 | ||||||||||||||||
| Fair value of plan assets |
823 | 2 | 83 | 78 | ||||||||||||||||
The fair value of pension plan assets as at 29 October 2017 and 30 October 2016 included US$20 million and US$21 million, respectively, of assets for the Group’s non-U.S. pension plans. Contributions to the Group’s non-U.S. plans were US$2 million and US$1 million for financial years 2017 and 2016, respectively.
The projected benefit obligations as of 29 October 2017 and 30 October 2016 included US$106 million and US$118 million, respectively, of obligations related to the Group’s non-U.S. plans. The accumulated benefit obligations as of 29 October 2017 and 30 October 2016 included US$100 million and US$110 million, respectively, of obligations related to the Group’s non-U.S. plans. In financial years 2016 and 2017 a settlement of US$3 and US$8 million, respectively, was reached on the pension benefits.
The following table presents amounts recognized on the consolidated balance sheets:
| Pension Benefits | Post-Retirement Benefits | |||||||||||||||||||
| 2017 | 2016 | 2017 | 2016 | |||||||||||||||||
| (US$ millions) | ||||||||||||||||||||
| Other long-term assets |
17 | 1 | 18 | 15 | ||||||||||||||||
| Employee compensation and benefits |
1 | 1 | 1 | 1 | ||||||||||||||||
| Pension and post-retirement benefit obligations |
98 | 516 | 31 | 30 | ||||||||||||||||
| Amounts recognized in accumulated other comprehensive loss, net of taxes: |
||||||||||||||||||||
| Actuarial losses and prior service costs, net of taxes |
(85) | (126) | (21) | (23) | ||||||||||||||||
The Group currently expects to make contributions of US$118 million to its defined benefit pension plans in financial year 2018. The Group does not expect to make any contributions to its post-retirement medical benefit plans in financial year 2018.
A-58
Table of Contents
BROADCOM LIMITED AND ITS SUBSIDIARIES
NOTES TO THE FINANCIAL STATEMENTS
For the financial year ended 29 October 2017
| 7. | Retirement plans and post-retirement benefits (continued) |
Expected Future Benefit Payments
The following table presents expected payments from the Group’s benefit plans over the next 10 financial years as of 29 October 2017:
| Pension Benefits |
Post- Retirement Benefits |
|||||||||||
| 2017 | 2016 | |||||||||||
| (US$ millions) | ||||||||||||
| 2018 |
92 | 3 | ||||||||||
| 2019 |
92 | 3 | ||||||||||
| 2020 |
91 | 3 | ||||||||||
| 2021 |
91 | 3 | ||||||||||
| 2022 |
90 | 3 | ||||||||||
| 2023 - 2027 |
451 | 19 | ||||||||||
| Defined benefit plan investment policy |
Plan assets of the funded defined benefit pension plans are invested in funds held by third-party fund managers or are deposited into government-managed accounts in which the Group has no active involvement in and no control over investment strategy, other than establishing broad investment guidelines and parameters. The plan assets held by third-parties consist primarily of equities, and fixed income funds. As of 30 October 2016, the plan assets also included commingled funds. The fund managers monitor the fund’s asset allocation within the guidelines established by the Group’s plan’s investment committee. In line with plan investment objectives and consultation with the Group’s management, the Group’s investment committee set an allocation benchmark among equity, bond and other assets based on the relative weighting of overall non-U.S. market indices. The overall investment objectives of the plan are 1) to acquire suitable assets of appropriate liquidity which will generate income and capital growth to meet current and future plan benefits, 2) to limit the risk of the assets failing to meet the long-term liabilities of the plan, and 3) to minimize the long-term costs of the plan by maximizing the return on the assets. Performance is regularly evaluated by the investment committee and is based on actual returns achieved by the fund manager relative to its benchmark.
For the defined benefit pension plans, the investment strategy for the U.S. plans is to allocate assets in a manner that seeks both to maximize the safety of promised benefits and to minimize the cost of funding those benefits. The Group directs the overall portfolio allocation and use a third-party investment consultant that has discretion to structure portfolios and select the investment managers within those allocation parameters. Multiple investment managers are utilized, including both active and passive management approaches. The plan assets are invested using a liability driven investment strategy intended to minimize market and interest rate risks, and those assets are periodically rebalanced toward asset allocation targets.
A-59
Table of Contents
BROADCOM LIMITED AND ITS SUBSIDIARIES
NOTES TO THE FINANCIAL STATEMENTS
For the financial year ended 29 October 2017
| 7. | Retirement plans and post-retirement benefits (continued) |
| Defined benefit plan investment policy (continued) |
The target asset allocation for U.S. plans reflects a risk/return profile that the Group believes is appropriate relative to the liability structure and return goals for the plans. The Group periodically reviews the allocation of plan assets relative to alternative allocation models to evaluate the need for adjustments based on forecasted liabilities and plan liquidity needs. The fixed-income allocation is primarily directed toward long-term core bond investments, with smaller allocations to Treasury Inflation-Protected Securities and high-yield bonds. As of 29 October 2017, there are no material equity investments in the plans.
The following table presents the Group’s defined benefit pension plans’ weighted-average asset allocations by category:
| Defined Benefit Pension Plans | ||||||||||||||||||||
| 2017 | 2016 | |||||||||||||||||||
| Actual % | Target % | Actual % | Target % | |||||||||||||||||
| Equity investments |
- | - | 33 | 40 | ||||||||||||||||
| Fixed income |
100 | 100 | 67 | 55 | ||||||||||||||||
| Real estate |
- | - | - | 5 | ||||||||||||||||
| Total |
100 | 100 | 100 | 100 | ||||||||||||||||
Fair Value Measurement of Plan Assets
| 2017 | ||||||||||||||||
| Fair value measurement at reporting date using: |
Total | |||||||||||||||
| Level 1 | Level 2 | Level 3 | ||||||||||||||
| (US$ millions) | ||||||||||||||||
| Cash equivalents |
943 | a | - | - | 943 | |||||||||||
| Equity securities: |
||||||||||||||||
| Non-U.S. equity securities |
7 | b | - | - | 7 | |||||||||||
| Fixed-income securities: |
||||||||||||||||
| U.S. treasuries |
- | 39 | c | - | 39 | |||||||||||
| Corporate bonds |
- | 393 | c | - | 393 | |||||||||||
| Asset-backed and mortgage-backed securities |
- | 1 | c | - | 1 | |||||||||||
| Municipal bonds |
- | 25 | c | - | 25 | |||||||||||
| Government bonds |
- | 18 | c | - | 18 | |||||||||||
| Total plan assets |
950 | 476 | - | 1,426 | ||||||||||||
A-60
Table of Contents
BROADCOM LIMITED AND ITS SUBSIDIARIES
NOTES TO THE FINANCIAL STATEMENTS
For the financial year ended 29 October 2017
| 7. | Retirement plans and post-retirement benefits (continued) |
Defined benefit plan investment policy (continued)
Fair Value Measurement of Plan Assets (continued)
| 2016 | ||||||||||||||||
| Fair value measurement at reporting date using: |
Total | |||||||||||||||
| Level 1 | Level 2 | Level 3 | ||||||||||||||
| (US$ millions) | ||||||||||||||||
| Cash equivalents |
38a | - | - | 38 | ||||||||||||
| Equity securities: |
||||||||||||||||
| U.S. equity securities |
155b | - | - | 155 | ||||||||||||
| Non-U.S. equity securities |
72b | - | - | 72 | ||||||||||||
| Fixed-income securities: |
||||||||||||||||
| U.S. treasuries |
- | 39c | - | 39 | ||||||||||||
| Corporate bonds |
- | 393c | - | 393 | ||||||||||||
| Asset-backed and mortgage-backed securities |
- | 3c | - | 3 | ||||||||||||
| Agency-backed bonds |
- | 3c | - | 3 | ||||||||||||
| Municipal bonds |
- | 25c | - | 25 | ||||||||||||
| Government bonds |
- | 11c | - | 11 | ||||||||||||
| Total assets measured by fair value hierarchy |
265 | 474 | - | 739 | ||||||||||||
| Assets measured at NAV: |
||||||||||||||||
| Commingled funds – equities |
116d | |||||||||||||||
| Commingled funds – bonds |
195e | |||||||||||||||
|
|
|
|||||||||||||||
| Total plan assets |
1,050 | |||||||||||||||
|
|
|
|||||||||||||||
| a | Cash equivalents primarily included short-term investment funds which consisted of short-term money market instruments that were valued based on quoted prices in active markets. |
| b | These U.S. equity securities and non-U.S. equity securities were valued based on quoted prices in active markets. |
| c | These amounts consisted of investments that were traded less frequently than Level 1 securities and were valued using inputs that included quoted prices for similar assets in active markets and inputs other than quoted prices that were observable for the asset, such as interest rates, yield curves, prepayment speeds, collateral performance, broker/dealer quotes and indices that were observable at commonly quoted intervals. |
| d | These amounts consisted of investments in funds not registered with U.S. Securities and Exchange Commission (the “SEC”), with underlying investments primarily in publicly traded U.S. and non-U.S. equity securities, including securities with small and large market capitalization. |
| e | These amounts consisted of investments in funds not registered with the SEC with underlying investments primarily in Treasury Inflation-Protected Securities and high-yield bonds. |
A-61
Table of Contents
BROADCOM LIMITED AND ITS SUBSIDIARIES
NOTES TO THE FINANCIAL STATEMENTS
For the financial year ended 29 October 2017
| 7. | Retirement plans and post-retirement benefits (continued) |
Post-retirement benefit plan investment policy
The Group’s overall investment strategy for the group life insurance plan is to allocate assets in a manner that seeks to both maximize the safety of promised benefits and minimize the cost of funding those benefits. The target asset allocation for plan assets reflects a risk/return profile that the Group believes is appropriate relative to the liability structure and return goals for the plan. The Group periodically review the allocation of plan assets relative to alternative allocation models to evaluate the need for adjustments based on forecasted liabilities and plan liquidity needs. The Group sets the overall portfolio allocation and uses an investment manager that directs the investment of funds consistent with that allocation. The investment manager invests the plan assets in index funds that it manages. Current allocation is a strategic asset mix comprising of (i) equity securities, (ii) government bonds and (iii) other investments.
The following table presents the plan asset allocations by category:
| 2017 |
|
2016 | ||||||||||||||||||
| Actual % | Target % | Actual % | Target % | |||||||||||||||||
| Commingled funds - U.S. equities |
20 | 20 | 20 | 20 | ||||||||||||||||
| Commingled funds - Non-U.S. equities |
20 | 20 | 20 | 20 | ||||||||||||||||
| Commingled funds - bonds |
60 | 60 | 60 | 60 | ||||||||||||||||
|
|
|
|
|
|
|
|||||||||||||||
| Total |
100 | 100 | 100 | 100 | ||||||||||||||||
|
|
|
|
|
|
|
|||||||||||||||
Assumptions
The assumptions used to determine the benefit obligations and expense for the Group’s defined benefit and post-retirement benefit plans are presented in the table below. The expected long-term return on assets shown in the table below represents an estimate of long-term returns on investment portfolios primarily consisting of combinations of debt, equity and other investments, depending on the plan. The Group considers long-term rates of return, which are weighted based on the asset classes (both historical and forecasted) in which the Group expects the pension and post-retirement funds to be invested. Discount rates reflect the current rate at which defined benefit and post-retirement benefit obligations could be settled based on the measurement dates of the plans, which in each case is the financial year end. The range of assumptions that are used for defined benefit pension plans reflects the different economic environments within various countries.
A-62
Table of Contents
BROADCOM LIMITED AND ITS SUBSIDIARIES
NOTES TO THE FINANCIAL STATEMENTS
For the financial year ended 29 October 2017
| 7. | Retirement plans and post-retirement benefits (continued) |
Post-retirement benefit plan investment policy (continued)
Assumptions (continued)
| Assumptions for Benefit Obligations |
Assumptions for Expense Financial Year |
|||||||||||||||||||||
| 2017 | 2016 | 2017 | 2016 | 2015 | ||||||||||||||||||
| Defined benefit pension plans: |
||||||||||||||||||||||
| Discount rate |
0.50%-7.00% | 0.50%-7.00% | 0.50%-7.00% | 0.75%-7.75% | 1.00%-4.10% | |||||||||||||||||
| Average increase in compensation levels |
2.00%-11.00% | 2.00%-9.16% | 2.00%-9.15% | 2.50%-11.72% | 2.50%-6.00% | |||||||||||||||||
| Expected long-term return on assets |
N/A | N/A | 0.25%-8.00% | 1.50%-9.00% | 1.50%-7.30% | |||||||||||||||||
| Post-retirement benefits plans: |
||||||||||||||||||||||
| Discount rate |
3.40%-3.80% | 3.30%-3.90% | 3.30%-3.90% | 3.90%-4.50% | 3.80%-4.40% | |||||||||||||||||
| Average increase in compensation levels |
3.00% | 3.50% | 3.50% | 3.50% | 3.50% | |||||||||||||||||
| Expected long-term return on assets |
N/A | N/A | 4.40% | 5.10% | 5.40% | |||||||||||||||||
| Current healthcare cost trend rate |
7.00% | 7.33% | 7.33% | 7.67% | 8.00% | |||||||||||||||||
| Ultimate healthcare cost trend rate |
3.50% | 3.50% | 3.50% | 3.50% | 3.50% | |||||||||||||||||
| Healthcare cost trend rate decreases to ultimate trend rate in year |
2031 | 2031 | 2031 | 2031 | 2031 | |||||||||||||||||
Changes in the assumed health care cost trend rates could have a significant effect on the amounts reported for the U.S. post-retirement medical benefit plans. A one percentage point change in the assumed healthcare cost trend rates for financial year 2017 would have the following effects:
| 1% increase | 1% Decrease | |||
| (US$ millions) | ||||
| Effect on U.S. post-retirement benefit obligation |
1 | (1) | ||
| Percentage effect on U.S. post-retirement benefit obligation |
1% | (1%) | ||
The effect of a one percentage point increase or decrease in the healthcare cost trend rates on the service and interest cost components of the net periodic benefit cost would have been immaterial.
A-63
Table of Contents
BROADCOM LIMITED AND ITS SUBSIDIARIES
NOTES TO THE FINANCIAL STATEMENTS
For the financial year ended 29 October 2017
| 7. | Retirement plans and post-retirement benefits (continued) |
Post-retirement benefit plan investment policy (continued)
401(k) Defined Contribution Plans
The Group’s eligible U.S. employees participate in company-sponsored 401(k) plans. Under these plans, the Group provides matching contributions to employees up to 6% of their eligible earnings. All matching contributions vest immediately. During fiscal years 2017, 2016 and 2015, the Group made contributions of $61 million, $43 million and $26 million, respectively, to the 401(k) plans.
| 8. | Finance expenses |
| Group | ||||||||||||
| 2017 | 2016 | |||||||||||
| (US$ millions) | (US$ millions) | |||||||||||
| Interest expense |
454 | 585 | ||||||||||
| Loss on extinguishment of debt |
166 | 123 | ||||||||||
| Finance expenses recognised in profit or loss |
620 | 708 | ||||||||||
| 9. | Income taxes |
| Income tax expense |
| Group | ||||||||||||
| 2017 | 2016 | |||||||||||
| (US$ millions) | (US$ millions) | |||||||||||
| Tax expense attributable to profit is made up of: |
||||||||||||
| - Profit/(loss) for the financial year: |
||||||||||||
| From continuing operations |
||||||||||||
| Current income tax |
||||||||||||
| - Singapore |
112 | 59 | ||||||||||
| - Foreign |
158 | 165 | ||||||||||
| 270 | 224 | |||||||||||
| Deferred income tax |
(235 | ) | 418 | |||||||||
| 35 | 642 | |||||||||||
| From discontinued operations |
||||||||||||
| Current income tax |
||||||||||||
| - Foreign |
- | (62 | ) | |||||||||
| 35 | 580 | |||||||||||
| Tax expense is attributable to: |
||||||||||||
| - continuing operations |
35 | 642 | ||||||||||
| - discontinued operations (Note 10(a)) |
- | (62 | ) | |||||||||
| 35 | 580 | |||||||||||
A-64
Table of Contents
BROADCOM LIMITED AND ITS SUBSIDIARIES
NOTES TO THE FINANCIAL STATEMENTS
For the financial year ended 29 October 2017
| 9. | Income taxes (continued) |
Income tax expense (continued)
The tax on the Group’s profit before tax differs from the theoretical amount that would arise using the Singapore standard rate of income tax as follows:
| Group | ||||||||
| 2017 | 2016 | |||||||
| (US$ millions) | (US$ millions) | |||||||
| Profit/(loss) before tax from |
||||||||
| - continuing operations |
1,823 | (1,107 | ) | |||||
| - discontinued operations (Note 10(a)) |
(6 | ) | (216 | ) | ||||
| 1,817 | (1,323 | ) | ||||||
| Tax calculated at tax rate of 17% (2016: 17%) |
309 | (225 | ) | |||||
| Effects of: |
||||||||
| - different tax rates in other countries |
(14 | ) | 1,030 | |||||
| - tax incentives |
(256 | ) | (169 | ) | ||||
| - other |
(4 | ) | 6 | |||||
| Tax charge |
35 | 642 | ||||||
| 10. | Discontinued operations and disposal group classified as held-for-sale |
During financial year 2016, Broadcom Group sold certain Broadcom Corporation (“BRCM”) businesses for aggregate cash proceeds of US$830 million. The following table summarises the selected financial information of discontinued operations:
| (a) | The results of the discontinued operations and the re-measurement of the disposal group are as follows: |
| Group | ||||||||
| 2017 | 2016 | |||||||
| (US$ millions) | (US$ millions) | |||||||
| Revenue |
15 | 103 | ||||||
| Expenses |
(21 | ) | (319 | ) | ||||
| Loss before tax from discontinued operations |
(6 | ) | (216 | ) | ||||
| Tax |
- | - | ||||||
| Loss after tax from discontinued operations |
(6 | ) | (216 | ) | ||||
| Gain on disposal of discontinued operations |
- | 42 | ||||||
| Benefit from income taxes |
- | 62 | ||||||
| After tax gain recognised on the re-measurement of disposal group to fair value less costs to sell |
- | 104 | ||||||
| Loss for the year from discontinued operations |
(6 | ) | (112 | ) | ||||
A-65
Table of Contents
BROADCOM LIMITED AND ITS SUBSIDIARIES
NOTES TO THE FINANCIAL STATEMENTS
For the financial year ended 29 October 2017
| 10. | Discontinued operations and disposal group classified as held-for-sale (continued) |
| (b) | The impact of the discontinued operations on the cash flows of the Group is as follows: |
| Group | ||||||||
| 2017 | 2016 | |||||||
| (US$ millions) | (US$ millions) | |||||||
| Operating cash inflows/(outflows) |
2 | (27 | ) | |||||
| Investing cash inflows |
- | 4 | ||||||
| Total cash inflows/(outflows) |
2 | (23 | ) | |||||
| (c) | As at the balance sheet date, there remains certain discontinued operations that are classified as disposal group classified as held-for-sale. Details of the assets of disposal group classified as held-for-sale are as follows: |
| Group | ||||||||
| 2017 | 2016 | |||||||
| (US$ millions) | (US$ millions) | |||||||
| Property, plant and equipment |
13 | 1 | ||||||
| Trademark and licences |
- | 16 | ||||||
| Goodwill |
- | 5 | ||||||
| Inventory |
- | 2 | ||||||
| 13 | 24 | |||||||
In accordance with FRS 105, the assets of disposal groups classified as held-for-sale and liabilities directly associated with disposal groups classified as held-for-sale were written down to their fair value less costs to sell of US$13 million in financial year 2017 and US$24 million in financial year 2016. This is a non-recurring fair value which is determined on the basis that the disposal groups were recently transacted or that there were agreements in place for sales that would be taking place after the balance sheet date.
A-66
Table of Contents
BROADCOM LIMITED AND ITS SUBSIDIARIES
NOTES TO THE FINANCIAL STATEMENTS
For the financial year ended 29 October 2017
| 11. | Earnings per share |
| (a) | Basic earnings per share |
Basic earnings per share is calculated by dividing the net profit attributable to equity holders of the Company by the weighted average number of ordinary shares outstanding during the financial year.
| Continuing operations |
Discontinued operations |
Total | ||||||||||||||||||||||||||||||
| 2017 | 2016 | 2017 | 2016 | 2017 | 2016 | |||||||||||||||||||||||||||
| Net profit/(loss) attributable to equity holders of the Company (US$ millions) |
1,696 | (1,633) | (6) | (106) | 1,690 | (1,739) | ||||||||||||||||||||||||||
| Weighted average number of ordinary shares outstanding for basic earnings per share (millions) |
405 | 366 | 405 | 366 | 405 | 366 | ||||||||||||||||||||||||||
| Basic earnings/(loss) per share (US$ per share) |
4.19 | (4.46) | (0.01) | (0.29) | 4.18 | (4.75) | ||||||||||||||||||||||||||
| (b) | Diluted earnings per share |
For the purpose of calculating diluted earnings per share, profit attributable to equity holders of the Company and the weighted average number of ordinary shares outstanding are adjusted for the effects of all dilutive potential ordinary shares. The Company’s dilutive potential ordinary shares include Broadcom ordinary shares issuable upon exchange of the partnership restricted exchangeable units (“Partnership REUs”) in Broadcom Cayman L.P. (the “Partnership”) and outstanding equity awards.
For Broadcom ordinary shares issuable upon exchange of the Partnership REUs, the weighted average number of ordinary shares issuable has been adjusted as if exchange was undertaken. The number of shares that could have been issued upon the exchange of all Partnership REUs is added to the denominator as the number of shares issued for no consideration. No adjustment is made to the net profit.
Diluted net income (loss) per share excluded the potentially dilutive effect of the exchange of Partnership REUs for up to 22 million ordinary shares for financial year 2017 and weighted average outstanding equity awards to acquire 12 million ordinary shares for financial year 2016, as their effect was antidilutive.
A-67
Table of Contents
BROADCOM LIMITED AND ITS SUBSIDIARIES
NOTES TO THE FINANCIAL STATEMENTS
For the financial year ended 29 October 2017
| 11. | Earnings per share (continued) |
| (b) | Diluted earnings per share (continued) |
Diluted earnings per share for continuing operations and discontinued operations attributable to equity holders of the Company is calculated as follows:
| Continuing operations |
Discontinued operations |
Total | ||||||||||||||||||||||
| 2017 | 2016 | 2017 | 2016 | 2017 | 2016 | |||||||||||||||||||
| Net profit/(loss) attributable to equity holders of the Company (US$ millions) |
1,696 | (1,749) | (6) | (112) | 1,690 | (1,861) | ||||||||||||||||||
|
|
|
|
|
|
|
|||||||||||||||||||
| Weighted average number of ordinary shares outstanding for basic earnings per share (millions) |
405 | 366 | 405 | 366 | 405 | 366 | ||||||||||||||||||
| Adjustments for (millions) |
||||||||||||||||||||||||
| - Equity awards |
16 | - | 16 | - | 16 | - | ||||||||||||||||||
| - Exchange of REUs for ordinary shares |
- | 17 | - | 17 | - | 17 | ||||||||||||||||||
|
|
|
|
|
|
|
|||||||||||||||||||
| 421 | 383 | 421 | 383 | 421 | 383 | |||||||||||||||||||
|
|
|
|
|
|
|
|||||||||||||||||||
| Diluted earnings/(loss) per share (US$ per share) |
4.03 | (4.57) | (0.01) | (0.29) | 4.02 | (4.86) | ||||||||||||||||||
|
|
|
|
|
|
|
|||||||||||||||||||
| 12. | Cash and cash equivalents |
| Group | Company | |||||||||||||||||||
| 2017 | 2016 | 2017 | 2016 | |||||||||||||||||
| (US$ millions) | (US$ millions) | (US$ millions) | (US$ millions) | |||||||||||||||||
| Cash on hand |
4,302 | 2,075 | 87 | 9 | ||||||||||||||||
| Short-term bank deposits |
6,902 | 1,022 | 100 | 44 | ||||||||||||||||
| 11,204 | 3,097 | 187 | 53 | |||||||||||||||||
Acquisition and disposal of subsidiaries
Please refer to Note 31 for the effects of acquisitions of subsidiaries on the cash flows of the Group. In 2016, US$10,055 million of cash consideration were used in the acquisition of subsidiaries, net of cash acquired, of which US$10,032 million were used in the Broadcom Merger (Note 31(a)(ii)).
A-68
Table of Contents
BROADCOM LIMITED AND ITS SUBSIDIARIES
NOTES TO THE FINANCIAL STATEMENTS
For the financial year ended 29 October 2017
| 12. | Cash and cash equivalents (continued) |
| Acquisition and disposal of subsidiaries (continued) |
On April 28, 2016, the Company signed a definitive agreement to sell its Internet of Things (“IoT”) Business to Cypress Semiconductor Corporation for $550 million. The effects of the disposal on the cash flows of the Group were:
| Group | ||||
| 2016 | ||||
| (US$ millions) | ||||
| Carrying amounts of assets and liabilities disposed of |
||||
| Property, plant and equipment |
8 | |||
| Inventory |
12 | |||
| Intangible assets |
237 | |||
| Goodwill |
267 | |||
| Others |
14 | |||
| Net assets disposed of |
538 | |||
The aggregate cash inflows arising from the disposal of IoT were:
| Group | ||||
| 2016 | ||||
| (US$ millions) | ||||
| Net assets disposed of (as above) |
538 | |||
| Gain on disposal (Note 10(a)) |
12 | |||
| Cash proceeds from disposal |
550 | |||
| Less: cash and cash equivalents in subsidiaries disposed of |
- | |||
| Net cash inflow on disposal |
550 | |||
On May 9, 2016, the Company signed a definitive agreement to sell its µWave Business to MaxLinear, Inc. for $80 million. The effects of the disposal on the cash flows of the Group were:
| Group | ||||
| 2016 | ||||
| (US$ millions) | ||||
| Carrying amounts of assets and liabilities disposed of |
||||
| Property, plant and equipment |
2 | |||
| Inventory |
4 | |||
| Intangible assets |
26 | |||
| Goodwill |
34 | |||
| Others |
1 | |||
| Net assets disposed of |
67 | |||
A-69
Table of Contents
BROADCOM LIMITED AND ITS SUBSIDIARIES
NOTES TO THE FINANCIAL STATEMENTS
For the financial year ended 29 October 2017
| 12. | Cash and cash equivalents (continued) |
| Acquisition and disposal of subsidiaries (continued) |
The aggregate cash inflows arising from the disposal of µWave Business were:
| Group | ||||
| 2016 | ||||
| (US$ millions) | ||||
| Net assets disposed of (as above) |
67 | |||
| Gain on disposal (Note 10(a)) |
13 | |||
| Cash proceeds from disposal |
80 | |||
| Less: cash and cash equivalents in subsidiaries disposed of |
- | |||
| Net cash inflow on disposal |
80 | |||
On August 8, 2016 the Company signed a definitive agreement to sell its Secure Element business to NXP B.V. for $200 million. The effects of the disposal on the cash flows of the Group were:
| Group | ||||
| 2016 | ||||
| (US$ millions) | ||||
| Carrying amounts of assets and liabilities disposed of |
||||
| Property, plant and equipment |
5 | |||
| Inventory |
3 | |||
| Intangible assets |
49 | |||
| Goodwill |
132 | |||
| Others |
2 | |||
| Net assets disposed of |
191 | |||
The aggregate cash inflows arising from the disposal of its Secure Element business were:
| Group | ||||
| 2016 | ||||
| (US$ millions) | ||||
| Net assets disposed of (as above) |
191 | |||
| Gain on disposal (Note 10(a)) |
9 | |||
| Cash proceeds from disposal |
200 | |||
| Less: cash and cash equivalents in subsidiaries disposed of |
- | |||
| Net cash inflow on disposal |
200 | |||
A-70
Table of Contents
BROADCOM LIMITED AND ITS SUBSIDIARIES
NOTES TO THE FINANCIAL STATEMENTS
For the financial year ended 29 October 2017
| 13. | Trade receivables and other current assets |
| Group | Company | |||||||||||||||||||
| 2017 | 2016 | 2017 | 2016 | |||||||||||||||||
| (US$ millions) | (US$ millions) | (US$ millions) | (US$ millions) | |||||||||||||||||
| Trade receivables |
||||||||||||||||||||
| - Related parties |
31 | 15 | - | - | ||||||||||||||||
| - Non-related parties |
2,417 | 2,175 | - | - | ||||||||||||||||
| 2,448 | 2,190 | - | - | |||||||||||||||||
| Less: Allowance for impairment of receivables - non-related parties |
- | (10 | ) | - | - | |||||||||||||||
| Trade receivables - net |
2,448 | 2,180 | - | - | ||||||||||||||||
| Deposits |
- | 149 | - | - | ||||||||||||||||
| Prepayments |
440 | 155 | - | - | ||||||||||||||||
| Other receivables |
271 | 119 | 9 | 42 | ||||||||||||||||
| 3,159 | 2,603 | 9 | 42 | |||||||||||||||||
| 14. | Inventories |
| Group | ||||||||
| 2017 | 2016 | |||||||
| (US$ millions) | (US$ millions) | |||||||
| Finished goods |
562 | 431 | ||||||
| Work-in-progress |
696 | 596 | ||||||
| Raw materials |
189 | 373 | ||||||
| 1,447 | 1,400 | |||||||
The cost of inventories recognised as an expense and included in “cost of sales” amounted to US$5,735 million in financial year 2017 and US$5,650 million in financial year 2016.
| 15. | Investments in subsidiaries |
| Company | ||||||||
| 2017 | 2016 | |||||||
| (US$ millions) | (US$ millions) | |||||||
| Equity investments at cost |
22,494 | 21,229 | ||||||
A-71
Table of Contents
BROADCOM LIMITED AND ITS SUBSIDIARIES
NOTES TO THE FINANCIAL STATEMENTS
For the financial year ended 29 October 2017
| 15. | Investments in subsidiaries (continued) |
The Company had the following direct subsidiary as at 29 October 2017 and 30 October 2016:
| Name | Country of business/ incorporation |
Proportion of partnership by parent |
Proportion of partnership units held by non- controlling interests |
|||||||||||||||||
| 2017 | 2016 | 2017 | 2016 | |||||||||||||||||
| % | % | % | % | |||||||||||||||||
| Broadcom Cayman L.P. |
Cayman Island | 95 | 95 | 5 | 5 | |||||||||||||||
A list of the Group’s significant subsidiaries is disclosed in Note 35.
| Carrying value of non-controlling interests |
||||||||
| 2017 | 2016 | |||||||
| (US$ millions) | (US$ millions) | |||||||
| Non-controlling interest |
2,901 | 2,984 | ||||||
The summarised financial information of the Partnership is set out below:
Summarised balance sheet
| 2017 | 2016 | |||||||
| (US$ millions) | (US$ millions) | |||||||
| Current assets |
15,720 | 7,125 | ||||||
| Current liabilities |
(2,529 | ) | (3,078 | ) | ||||
| Non-current assets |
38,595 | 42,841 | ||||||
| Non-current liabilities |
(28,703 | ) | (25,012 | ) | ||||
| Net assets |
23,083 | 21,876 | ||||||
A-72
Table of Contents
BROADCOM LIMITED AND ITS SUBSIDIARIES
NOTES TO THE FINANCIAL STATEMENTS
For the financial year ended 29 October 2017
| 15. | Investments in subsidiaries (continued) |
The summarised financial information of Broadcom Cayman L.P. is set out below:
Summarised income statement
| 2017 | 2016 | |||||||
| (US$ millions) | (US$ millions) | |||||||
| Revenue |
17,636 | 13,240 | ||||||
| Expenses |
||||||||
| Includes: |
||||||||
| - Depreciation and amortisation |
(4,737 | ) | (3,042 | ) | ||||
| - Interest expense |
(454 | ) | (585 | ) | ||||
| Profit/(loss) before income tax |
1,825 | (1,107 | ) | |||||
| Income tax expense |
(35 | ) | (642 | ) | ||||
| Post-tax profit/(loss) from continuing operations |
1,790 | (1,749 | ) | |||||
| Post-tax loss from discontinued operations |
(6 | ) | (112 | ) | ||||
| Total comprehensive profit/(loss) |
1,784 | (1,861 | ) | |||||
Summarised cash flows
| 2017 | 2016 | |||||||
| (US$ millions) | (US$ millions) | |||||||
| Cash flows from operating activities |
||||||||
| Cash generated from operations |
7,210 | 4,101 | ||||||
| Interest paid |
(310 | ) | (448 | ) | ||||
| Income tax paid |
(349 | ) | (242 | ) | ||||
| Net cash provided by operating activities |
6,551 | 3,411 | ||||||
| Net cash used in investing activities |
(674 | ) | (9,840 | ) | ||||
| Net cash provided by financing activities |
2,096 | 7,651 | ||||||
| Net increase in cash and cash equivalents |
7,973 | 1,222 | ||||||
| Cash and cash equivalent at beginning of year |
3,044 | 1,822 | ||||||
| Cash and cash equivalent at end of year |
11,017 | 3,044 | ||||||
| 16. | Other long-term assets |
| Group | ||||||||
| 2017 | 2016 | |||||||
| (US$ millions) | (US$ millions) | |||||||
| Deposits |
3 | 19 | ||||||
| Prepayments |
131 | 139 | ||||||
| Other receivables |
303 | 66 | ||||||
| 437 | 224 | |||||||
A-73
Table of Contents
BROADCOM LIMITED AND ITS SUBSIDIARIES
NOTES TO THE FINANCIAL STATEMENTS
For the financial year ended 29 October 2017
| 17. | Property, plant and equipment |
| Land
(US$ millions) |
Buildings and
(US$ millions) |
Machinery
(US$ millions) |
Construction in Progress
(US$ millions) |
Total
(US$ millions) |
||||||||||||||||
| Group | ||||||||||||||||||||
| 2017 |
||||||||||||||||||||
| Cost |
||||||||||||||||||||
| Beginning of financial year |
268 | 534 | 2,475 | 361 | 3,638 | |||||||||||||||
| Additions |
- | - | 471 | 577 | 1,048 | |||||||||||||||
| Reclassified to assets held for sale |
(8) | - | - | (16) | (24) | |||||||||||||||
| Reclassified from Construction in Progress |
5 | 52 | 100 | (157) | - | |||||||||||||||
| Disposals |
(85) | (7) | (121) | (342) | (555) | |||||||||||||||
| Write-off |
(3) | - | - | (12) | (15) | |||||||||||||||
|
|
|
|||||||||||||||||||
| End of financial year |
177 | 579 | 2,925 | 411 | 4,092 | |||||||||||||||
|
|
|
|||||||||||||||||||
| Accumulated depreciation and impairment losses |
|
|||||||||||||||||||
| Beginning of financial year |
2 | 133 | 994 | - | 1,129 | |||||||||||||||
| Depreciation charge |
- | 45 | 406 | - | 451 | |||||||||||||||
| Disposals |
- | (4) | (83) | - | (87) | |||||||||||||||
|
|
|
|||||||||||||||||||
| End of financial year |
2 | 174 | 1,317 | - | 1,493 | |||||||||||||||
|
|
|
|||||||||||||||||||
| Net book value |
||||||||||||||||||||
| End of financial year |
175 | 405 | 1,608 | 411 | 2,599 | |||||||||||||||
|
|
|
|||||||||||||||||||
| Group |
||||||||||||||||||||
| 2016 |
||||||||||||||||||||
| Cost |
||||||||||||||||||||
| Beginning of financial year |
37 | 419 | 1,627 | 153 | 2,236 | |||||||||||||||
| Additions |
- | 7 | 408 | 359 | 774 | |||||||||||||||
| Acquisition of subsidiaries (Note 31(a)(iii)) |
245 | 64 | 374 | 206 | 889 | |||||||||||||||
| Reclassified to assets held for sale |
- | - | (1) | - | (1) | |||||||||||||||
| Reclassified from Construction in Progress |
15 | 61 | 149 | (225) | - | |||||||||||||||
| Disposals |
- | (15) | (81) | (13) | (109) | |||||||||||||||
| Write-off |
(29) | (2) | (1) | (119) | (151) | |||||||||||||||
|
|
|
|||||||||||||||||||
| End of financial year |
268 | 534 | 2,475 | 361 | 3,638 | |||||||||||||||
|
|
|
|||||||||||||||||||
| Accumulated depreciation and impairment losses |
|
|||||||||||||||||||
| Beginning of financial year |
2 | 95 | 679 | - | 776 | |||||||||||||||
| Depreciation charge |
- | 43 | 361 | - | 404 | |||||||||||||||
| - Discontinued operations |
- | (1) | (1) | - | (2) | |||||||||||||||
| Disposals |
- | (4) | (45) | - | (49) | |||||||||||||||
|
|
|
|||||||||||||||||||
| End of financial year |
2 | 133 | 994 | - | 1,129 | |||||||||||||||
|
|
|
|||||||||||||||||||
| Net book value |
||||||||||||||||||||
| End of financial year |
266 | 401 | 1,481 | 361 | 2,509 | |||||||||||||||
|
|
|
|||||||||||||||||||
A-74
Table of Contents
BROADCOM LIMITED AND ITS SUBSIDIARIES
NOTES TO THE FINANCIAL STATEMENTS
For the financial year ended 29 October 2017
| 17. | Property, plant and equipment (continued) |
Included within additions in the consolidated financial statements are machinery and equipment acquired under finance lease amounting to US$48 million in financial year 2017. There was no property, plant and equipment acquired under finance lease in financial year 2016.
The carrying amount of machinery and equipment held under finance lease is US$40 million at the balance sheet date for financial year 2017.
| 18. | Goodwill and intangible assets |
| Group |
||||||||
| 2017 (US$ millions) |
2016 (US$ millions) |
|||||||
| Composition: |
||||||||
| Goodwill (Note (a)) |
24,706 | 24,732 | ||||||
| Acquired finite-lived intangible asset (Note (b)) |
10,120 | 13,732 | ||||||
| In-process research and development (Note (c)) |
712 | 1,336 | ||||||
| Total intangible assets |
10,832 | 15,068 | ||||||
| 35,538 | 39,800 | |||||||
| (a) | Goodwill |
| Group |
||||||||
| 2017 (US$ millions) |
2016 (US$ millions) |
|||||||
| Cost |
||||||||
| Beginning of financial year |
24,732 | 1,674 | ||||||
| Acquisition of subsidiary (Note 31) |
6 | 23,058 | ||||||
| Measurement period adjustment |
(32) | - | ||||||
| End of financial year |
24,706 | 24,732 | ||||||
| Accumulated impairment |
||||||||
| Beginning of financial year |
- | - | ||||||
| Impairment charge (Note 5) |
- | - | ||||||
| End of financial year |
- | - | ||||||
| Net book value |
24,706 | 24,732 | ||||||
A-75
Table of Contents
BROADCOM LIMITED AND ITS SUBSIDIARIES
NOTES TO THE FINANCIAL STATEMENTS
For the financial year ended 29 October 2017
| 18. | Goodwill and intangible assets (continued) |
| (a) | Goodwill (continued) |
In financial year 2017, the Group recorded a measurement period adjustment related to the estimated tax impact of Employee Stock Purchase Plan deductions in relation to the Broadcom Merger (as described in Note 31) completed in financial year 2016.
Impairment tests for goodwill
Goodwill is allocated to the Group’s CGUs identified according its business segments.
A segment-level summary of the goodwill allocation is as follows:
| Group |
||||||||
| 2017 (US$ millions) |
2016 (US$ millions) |
|||||||
| Wired Infrastructure |
17,622 | 17,641 | ||||||
| Wireless Communication |
5,945 | 5,952 | ||||||
| Enterprise Storage |
995 | 995 | ||||||
| Industrial & Other |
144 | 144 | ||||||
| 24,706 | 24,732 | |||||||
The recoverable amount of a CGU was determined based on fair value less cost to sell. Cash flow projections used in the fair value less cost to sell calculations were based on financial budgets approved by management covering a five-year period. Cash flows beyond the five-year period were extrapolated using the estimated rates stated below. The growth rate did not exceed the long-term average growth rate for the component parts business in which the CGU operates.
Key assumptions used in the income approach to obtain the fair values of the four segments for financial year 2017 includes growth rates and discount rates in the ranges of 3.6%-9.2% (2016: 1.6%-9.9%) and 10.8%-14.8% (2016: 9.8%-14.2%) respectively.
These assumptions were used for the analysis of each CGU within the business segment. The growth rates used were consistent with forecasts included in industry reports. The discount rates used were pre-tax and reflected specific risks relating to the relevant segments.
The results of impairment reviews undertaken indicate that if there is significant change in the discount rates and/or significant change in projected performance of the business, it may be necessary to take impairment charge to profit and loss in the future.
Based on the impairment assessment, no impairment is required for goodwill attributed to the respective CGUs.
There are no reasonably possible changes in any of the key assumptions that would cause the carrying amount of these CGUs to materially exceed the recoverable amount
A-76
Table of Contents
BROADCOM LIMITED AND ITS SUBSIDIARIES
NOTES TO THE FINANCIAL STATEMENTS
For the financial year ended 29 October 2017
| 18. | Goodwill and intangible assets (continued) |
| (b) | Acquired finite-lived intangible asset |
| Group |
||||||||
| 2017 (US$ millions) |
2016 (US$ millions) |
|||||||
| Cost |
||||||||
| Beginning of financial year |
17,048 | 4,918 | ||||||
| Acquisition of subsidiaries |
34 | 12,871 | ||||||
| Additions |
28 | 31 | ||||||
| Reclassified from in-process research and development |
611 | 341 | ||||||
| Reclassified to disposal group |
- | (9) | ||||||
| Disposals |
- | (16) | ||||||
| Write-offs |
(94) | (1,088) | ||||||
| End of financial year |
17,627 | 17,048 | ||||||
| Accumulated amortisation and impairment losses |
||||||||
| Beginning of financial year |
3,316 | 1,766 | ||||||
| Amortisation charge |
||||||||
| - Continuing operations |
4,285 | 2,638 | ||||||
| - Discontinued operations |
- | - | ||||||
| Reclassified to disposal group |
- | (1) | ||||||
| Disposals |
- | (5) | ||||||
| Impairment and write-offs |
(94) | (1,082) | ||||||
| End of financial year |
7,507 | 3,316 | ||||||
| Net book value |
10,120 | 13,732 | ||||||
In financial year 2016, US$12,871 million of finite-lived intangible assets were acquired in business combinations, of which US$12,858 million were acquired in the Broadcom Merger (Note 31(a)(vi)).
| (c) | IPR&D |
| Group |
||||||||
| 2017 (US$ millions) |
2016 (US$ millions) |
|||||||
| Cost |
||||||||
| Beginning of financial year |
1,336 | 125 | ||||||
| Acquisition of subsidiaries |
- | 1,969 | ||||||
| Reclassified to acquired finite-lived intangible assets |
(611) | (341) | ||||||
| Write-offs |
(13) | (417) | ||||||
| End of financial year |
712 | 1,336 | ||||||
| Accumulated impairment losses |
||||||||
| Beginning and end of financial year |
- | - | ||||||
| Net book value |
712 | 1,336 | ||||||
A-77
Table of Contents
BROADCOM LIMITED AND ITS SUBSIDIARIES
NOTES TO THE FINANCIAL STATEMENTS
For the financial year ended 29 October 2017
| 18. | Goodwill and intangible assets (continued) |
| (c) | IPR&D (continued) |
During financial year 2016, US$1,969 million of IPR&D were acquired in business combinations, of which US$1,950 million were acquired in the Broadcom Merger (Note 31(a)(vi)).
| (d) | Amortisation expense included in the statement of comprehensive income is analysed as follows: |
| Group |
||||||||
| 2017 | 2016 | |||||||
| (US$ millions) | (US$ millions) | |||||||
| Cost of sales |
2,511 | 763 | ||||||
| Research and development |
10 | 2 | ||||||
| Administrative |
1,764 | 1,873 | ||||||
| Total (Note 5) |
4,285 | 2,638 | ||||||
| 19. | Trade payables and other liabilities |
| Group |
Company | ||||||||||||||||||||||||
| 2017 (US$ millions) |
2016 (US$ millions) |
2017 (US$ millions) |
2016 (US$ millions) | ||||||||||||||||||||||
| Current |
|||||||||||||||||||||||||
| Trade payables to: |
|||||||||||||||||||||||||
| - non-related parties |
1,093 | 1,254 | 7 | 4 | |||||||||||||||||||||
| - subsidiaries |
- | - | 173 | 151 | |||||||||||||||||||||
| - other related parties |
12 | 7 | - | - | |||||||||||||||||||||
| Total trade payables |
1,105 | 1,261 | 180 | 155 | |||||||||||||||||||||
|
|
|
|
|
||||||||||||||||||||||
| Other payables |
198 | 64 | - | - | |||||||||||||||||||||
| Deferred income |
51 | 101 | - | - | |||||||||||||||||||||
| Accruals for operating expenses |
154 | 122 | - | - | |||||||||||||||||||||
| Provisions (Note 21) |
176 | 463 | - | - | |||||||||||||||||||||
|
|
|
|
|
||||||||||||||||||||||
| Total other current liabilities |
579 | 750 | - | - | |||||||||||||||||||||
|
|
|
|
|
||||||||||||||||||||||
| Non-current |
|||||||||||||||||||||||||
| Deferred Income |
17 | 18 | - | - | |||||||||||||||||||||
| Other Payables |
6 | 9 | - | - | |||||||||||||||||||||
| Provisions (Note 21) |
136 | 121 | - | - | |||||||||||||||||||||
| Accruals for operating expenses |
103 | 67 | - | - | |||||||||||||||||||||
|
|
|
|
|
||||||||||||||||||||||
| Total other non-current liabilities |
262 | 215 | - | - | |||||||||||||||||||||
|
|
|
|
|
||||||||||||||||||||||
| Total trade payables and other liabilities |
1,946 | 2,226 | 180 | 155 | |||||||||||||||||||||
|
|
|
|
|
||||||||||||||||||||||
A-78
Table of Contents
BROADCOM LIMITED AND ITS SUBSIDIARIES
NOTES TO THE FINANCIAL STATEMENTS
For the financial year ended 29 October 2017
| 20. | Borrowings |
| Group | ||||||||||
| 2017 (US$ millions) |
2016 (US$ millions) | |||||||||
| Current |
||||||||||
| Term loans and senior notes |
117 | 454 | ||||||||
| 117 | 454 | |||||||||
| Non-current |
||||||||||
| Term loans and senior notes |
17,431 | 13,188 | ||||||||
| Total borrowings |
17,548 | 13,642 | ||||||||
The following table presents the details of the senior unsecured notes issued and sold in January 2017 (the “January 2017 Senior Notes”) and in October 2017 (the “October 2017 Senior Notes”, and collectively, the “2017 Senior Notes”) and the term loans (the “2016 Term Loans”) under our guaranteed collateralized credit agreement (the “2016 Credit Agreement”):
| Group |
||||||||||||
| Interest rate |
|
Amount (US$ millions) |
||||||||||
| January 2017 Senior Notes |
||||||||||||
| Fixed rate 2.375% notes due January 2020 |
2.615% | 2,750 | ||||||||||
| Fixed rate 3.000% notes due January 2022 |
3.214% | 3,500 | ||||||||||
| Fixed rate 3.625% notes due January 2024 |
3.744% | 2,500 | ||||||||||
| Fixed rate 3.875% notes due January 2027 |
4.018% | 4,800 | ||||||||||
| October 2017 Senior Notes |
||||||||||||
| Fixed rate 2.200% notes due January 2021 |
2.406% | 750 | ||||||||||
| Fixed rate 2.650% notes due January 2023 |
2.781% | 1,000 | ||||||||||
| Fixed rate 3.125% notes due January 2025 |
3.234% | 1,000 | ||||||||||
| Fixed rate 3.500% notes due January 2028 |
3.596% | 1,250 | ||||||||||
| Unaccreted discount and unamortised debt issuance costs |
|
(141 | ) | |||||||||
|
|
|
|
|
|||||||||
| Carrying value of 2017 Senior Notes |
|
17,409 | ||||||||||
|
|
|
|||||||||||
A-79
Table of Contents
BROADCOM LIMITED AND ITS SUBSIDIARIES
NOTES TO THE FINANCIAL STATEMENTS
For the financial year ended 29 October 2017
| 20. | Borrowings (continued) |
| Group |
||||||||||||||
| Interest rate |
Applicable margins† |
Effective |
Amount (US$ millions) |
|||||||||||
| Term A Loan due February 2021 |
2.28 | % | Variable based on applicable credit rating. | 2.52 | % | 7,090 | ||||||||
| Term B-3 Loan due February 2023 |
3.53 | % | Eurocurrency Loans: 3.0%, Base Rate Loans: 2.0%. No LIBOR floor (a) |
3.84 | % | 6,578 | ||||||||
| Unaccreted discount and unamortised debt issuance costs | (165) | |||||||||||||
| Carrying value of 2016 Term Loans |
|
13,503 | ||||||||||||
| † | All capitalised terms are as defined in the 2016 Credit Agreement. |
| (a) | Margins are subjected to a step-down adjustment of 0.25% upon achievement of a total net leverage ratio of less than or equal to 1.50:1.00. |
Senior Notes
The fair value of outstanding Assumed Senior Notes (defined below) as at 29 October 2017 and 30 October 2016 is as follows:
| Interest rate |
Effective |
Amount (US$ millions) |
||||||||||
| Fixed rate notes due November 2018 |
2.70% | 2.70% | 117 | |||||||||
| Fixed rate notes due August 2022 - August 2034 |
2.50% - 4.50% | 2.50% - 4.50% | 22 | |||||||||
| Carrying value of Senior Notes |
139 | |||||||||||
Future Principal Payments of Debt
The future scheduled principal payments for the outstanding 2017 Senior Notes and the senior unsecured notes that the Group assumed in connection with the Broadcom Merger (the “Assumed Senior Notes”) as of 29 October 2017 are as follows:
| Financial Year | Amount (US$ millions) |
|||
| 2018 |
117 | |||
| 2019 |
- | |||
| 2020 |
2,750 | |||
| 2021 |
750 | |||
| 2022 |
3,509 | |||
| Thereafter |
10,563 | |||
| Total |
17,689 | |||
A-80
Table of Contents
BROADCOM LIMITED AND ITS SUBSIDIARIES
NOTES TO THE FINANCIAL STATEMENTS
For the financial year ended 29 October 2017
| 20. | Borrowings (continued) |
| Future Principal Payments of Debt (continued) |
As of 29 October 2017, the estimated fair values of the 2017 Senior Notes and the Assumed Senior Notes was US$17,953 million. The fair value of the 2017 Senior Notes and the Assumed Senior Notes is classified as Level 2 as quoted prices from less active markets have been used.
| 21. | Provisions |
| Group | ||||||
| 2017 (US$ millions) |
2016 (US$ millions) | |||||
| Current |
||||||
| Warranty (Note (a)) |
11 | 14 | ||||
| Accrued rebates (Note (b)) |
124 | 317 | ||||
| Restructuring liabilities (Note (c)) |
41 | 132 | ||||
| Total |
176 | 463 | ||||
| Non-Current |
||||||
| Restructuring liabilities (Note (c)) |
4 | 19 | ||||
| Accrued interest and penalties (Note (d)) |
132 | 102 | ||||
| 136 | 121 | |||||
| (a) | Warranty |
The Group accrues for the estimated costs of product warranties at the time revenue is recognised. Product warranty costs are estimated based upon the historical experience and specific identification of the products requirements, which may fluctuate based on product mix. Additionally, the Group accrues for warranty costs associated with occasional or unanticipated product quality issues if a loss is probable and can be reasonably estimated.
| (b) | Accrued rebates |
The Group accrues for 100% of potential rebates at the time of sale and does not apply a breakage factor. The Group reverses the accrual of unclaimed rebate amounts as specific rebate programs contractually end and when the Group believes unclaimed rebates are no longer subjected to payment and will not be paid. Thus, the reversal of unclaimed rebates may have a positive impact on the net revenue and net income in subsequent periods.
A-81
Table of Contents
BROADCOM LIMITED AND ITS SUBSIDIARIES
NOTES TO THE FINANCIAL STATEMENTS
For the financial year ended 29 October 2017
| 21. | Provisions (continued) |
| (b) | Accrued rebates (continued) |
Movement in provision for accrued rebates is as follows:
| Group |
||||||||
| 2017 (US$ millions) |
2016 (US$ millions) |
|||||||
| Beginning of financial year |
317 | 26 | ||||||
| Liabilities assumed in acquisitions |
- | 359 | ||||||
| Additional rebates given during the year |
244 | 461 | ||||||
| Reversal of unclaimed rebates |
(79) | (6) | ||||||
| Payments |
(358) | (523) | ||||||
| End of financial year |
124 | 317 | ||||||
| (c) | Restructuring liabilities |
During financial years 2017 and 2016, the Group initiated a series of restructuring activities intended to realign its operations to improve overall efficiency and effectiveness. Provisions are made for employee termination costs and leases and other exit costs.
Movement in provision for employee termination costs is as follows:
| Group |
||||||||
| 2017 (US$ millions) |
2016 (US$ millions) |
|||||||
| Beginning of financial year |
116 | 13 | ||||||
| Liabilities assumed in acquisitions |
- | 2 | ||||||
| Restructuring charges |
86 | 445 | ||||||
| Utilisation |
(174) | (344) | ||||||
| End of financial year |
28 | 116 | ||||||
A-82
Table of Contents
BROADCOM LIMITED AND ITS SUBSIDIARIES
NOTES TO THE FINANCIAL STATEMENTS
For the financial year ended 29 October 2017
| 21. | Provisions (continued) |
| (c) | Restructuring liabilities (continued) |
Movement in provision for leases and other exit costs is as follows:
| Group |
||||||||
| 2017 (US$ millions) |
2016 (US$ millions) |
|||||||
| Beginning of financial year |
35 | 13 | ||||||
| Liabilities assumed in acquisitions |
- | 13 | ||||||
| Restructuring charges |
43 | 37 | ||||||
| Utilisation |
(61) | (28) | ||||||
| End of financial year |
17 | 35 | ||||||
| (d) | Accrued interest and penalties |
During financial years 2017 and 2016, the Group accrued interest and penalties for various tax positions. Movement in accrued interest and penalties is as follows:
| Group |
||||||||
| 2017 (US$ millions) |
2016 (US$ millions) |
|||||||
| Beginning of financial year |
102 | 43 | ||||||
| Liabilities assumed in acquisitions |
- | 66 | ||||||
| Charges during the year, net |
36 | 9 | ||||||
| Settlements |
(6) | (16) | ||||||
| End of financial year |
132 | 102 | ||||||
A-83
Table of Contents
BROADCOM LIMITED AND ITS SUBSIDIARIES
NOTES TO THE FINANCIAL STATEMENTS
For the financial year ended 29 October 2017
| 22. | Deferred income taxes |
Deferred income tax assets and liabilities are offset when there is a legally enforceable right to offset current income tax assets against current income tax liabilities and when the deferred income taxes relate to the same financial authority. The amounts, determined after appropriate offsetting, are shown on the balance sheet as follows:
| Group | ||||||||||
| 2017 | 2016 | |||||||||
| (US$ millions) | (US$ millions) | |||||||||
| Deferred income tax assets |
||||||||||
| - To be recovered within one year |
- | - | ||||||||
| - To be recovered after one year |
21 | 308 | ||||||||
| 21 | 308 | |||||||||
| Deferred income tax liabilities |
||||||||||
| - To be settled within one year |
- | - | ||||||||
| - To be settled after one year |
10,019 | 10,287 | ||||||||
| 10,019 | 10,287 | |||||||||
Deferred income taxes reflect the net effects of temporary differences between the carrying amounts of assets and liabilities for financial reporting purposes and their basis for income tax purposes and the tax effects of net operating losses and tax credit carry forwards.
The summary of deferred income tax assets (prior to offsetting of balances within the same tax jurisdiction) is as follows:
| 2017 | 2016 | |||||||||
| (US$ millions) | (US$ millions) | |||||||||
| Depreciation and amortisation |
8 | 15 | ||||||||
| Inventory |
6 | 6 | ||||||||
| Trade accounts |
22 | 6 | ||||||||
| Employee benefits |
145 | 216 | ||||||||
| Employee share awards |
180 | 90 | ||||||||
| Net operating loss carryovers and credit carryovers |
909 | 770 | ||||||||
| Other deferred income tax assets |
42 | 172 | ||||||||
| Deferred income tax assets |
1,312 | 1,275 | ||||||||
A-84
Table of Contents
BROADCOM LIMITED AND ITS SUBSIDIARIES
NOTES TO THE FINANCIAL STATEMENTS
For the financial year ended 29 October 2017
| 22. | Deferred income taxes (continued) |
The summary of deferred income tax liabilities (prior to offsetting of balances within the same tax jurisdiction) is as follows:
| 2017 | 2016 | |||||||
| (US$ millions) | (US$ millions) | |||||||
| Depreciation and amortisation |
96 | 263 | ||||||
| Other deferred income tax liabilities |
12 | 37 | ||||||
| Foreign earnings not indefinitely reinvested |
11,202 | 10,954 | ||||||
| Deferred income tax liabilities |
11,310 | 11,254 | ||||||
As of 29 October 2017, the Group had U.S. federal net operating loss carry forwards of US$575 million, U.S. state net operating loss carry forwards of US$3,067 million and other foreign net operating loss carry forwards of US$1,702 million. U.S. federal and state net operating loss carry forwards begin to expire in financial year 2018. The other foreign net operating losses expire in various financial years beginning 2018. As of 29 October 2017, the Group had US$1,494 million and US$1,212 million of U.S. federal and state research and development tax credits, respectively, which if not utilized, begin to expire in financial year 2018.
| 23. | Share capital |
| Issued share capital |
Share capital |
|||||||
| (millions) | (US$ millions) | |||||||
| Group and Company |
||||||||
| 2017 |
||||||||
| Beginning of financial year |
398 | 18,462 | ||||||
| Issuance of ordinary shares in connection with equity incentive plans |
10 | 257 | ||||||
| Exchange of the Partnership REUs for ordinary shares |
1 | 86 | ||||||
| End of financial year |
409 | 18,805 | ||||||
| Issued share capital |
Share capital |
|||||||
| (millions) | (US$ millions) | |||||||
| Group and Company |
||||||||
| 2016 |
||||||||
| Beginning of financial year |
* | * | ||||||
| Issuance of ordinary shares upon the acquisition of Broadcom Corporation |
112 | 15,438 | ||||||
| Issuance of ordinary shares in connection with equity incentive plans |
10 | 295 | ||||||
| Fair value of partially vested equity awards assumed in connection with the acquisition of Broadcom Corporation |
- | 182 | ||||||
| Effect of capital reorganisation |
276 | 2,547 | ||||||
| End of financial year |
398 | 18,462 | ||||||
| * | Share capital at the beginning of financial year 2016 is less than US$1 million and comprises 2 fully paid up ordinary shares with no par value, amounting to a total of $2 |
A-85
Table of Contents
BROADCOM LIMITED AND ITS SUBSIDIARIES
NOTES TO THE FINANCIAL STATEMENTS
For the financial year ended 29 October 2017
| 23. | Share capital (continued) |
All issued ordinary shares are fully paid. There is no par value for these ordinary shares.
Prior to 1 February 2016, the acquisition date of BRCM (the “Acquisition Date”), the Group’s shareholders’ equity reflected Avago’s outstanding ordinary shares, all of which were publicly traded on the NASDAQ Global Select Market. As a result of the Broadcom Transaction (as described in Note 31), the Group’s ownership interest changed. Pursuant to the Avago Scheme, Broadcom issued 278 million ordinary shares to holders of Avago ordinary shares and issued 112 million ordinary shares to former BRCM shareholders pursuant to the Broadcom Merger. Consequently, the number of Broadcom ordinary shares outstanding increased from 278 million Avago ordinary shares on January 31, 2016 to 390 million Broadcom ordinary shares on February 1, 2016. Both Avago and BRCM became indirect subsidiaries of Broadcom and the Partnership, and Broadcom is the sole General Partner of the Partnership. As a result, the carrying amount of equity attributable to Broadcom was adjusted to reflect the change in the Group’s ownership interest of its subsidiaries. Additionally, Broadcom reflects a non-controlling interest in its shareholders’ equity, which represents the interest of the holders of the limited partners in the Partnership.
In connection with the Broadcom Merger, Broadcom also issued 23 million non-economic voting preference shares (the “Special Voting Shares”), which is equal to the number of issued Partnership REUs. The Special Voting Shares were issued to a voting trustee pursuant to a voting trust agreement dated February 1, 2016, among Broadcom, the Partnership and the voting trustee.
Share-based incentive awards are provided to employees and directors under the terms of various Broadcom equity incentive plans.
In July 2009, Broadcom’s Board of Directors adopted, and the shareholders approved, the Avago Technologies Limited 2009 Equity Incentive Award Plan, or the 2009 Plan, to authorise the grant of options, share appreciation rights, RSU awards, dividend equivalents, performance awards, and other share-based awards. A total of 20 million ordinary shares were initially reserved for issuance under the 2009 Plan, subject to annual increases starting in financial year 2012. The amount of the annual increase is equal to the least of (a) 6 million shares, (b) 3% of the ordinary shares outstanding on the last day of the immediately preceding financial year and (c) such smaller number of ordinary shares as determined by the Board. However, no more than 90 million ordinary shares may be issued upon the exercise of equity awards issued under the 2009 Plan. The 2009 Plan became effective on July 27, 2009.
As of 29 October 2017, 19 million ordinary shares remained available for issuance under the 2009 Plan.
In connection with the LSI acquisition, Broadcom assumed the LSI 2003 Equity Incentive Plan, (the “2003 Plan”), and outstanding unvested stock options and RSUs originally granted by LSI under the 2003 Plan that were held by continuing employees. At the time of the acquisition, these awards were converted to Avago share options and RSUs, with adjustments made to the exercise price of stock options and the number of shares subject to stock options and RSU awards so that the intrinsic value of each award was approximately the same immediately before and immediately after the adjustment.
A-86
Table of Contents
BROADCOM LIMITED AND ITS SUBSIDIARIES
NOTES TO THE FINANCIAL STATEMENTS
For the financial year ended 29 October 2017
| 23. | Share capital (continued) |
These unvested options and RSUs will vest in accordance with their original terms, generally vesting in equal annual instalments over a four-year period from the original grant date and expire seven years after the grant date. Under the 2003 Plan, Broadcom may grant to former employees of LSI and other employees who were not employees of Avago at the time of the acquisition restricted stock awards, RSUs, share options and share appreciation rights with an exercise price that is no less than the fair market value on the date of grant. No participant may be granted share options covering more than four million shares or more than an aggregate of one million shares of restricted stock and RSUs in any financial year. Equity awards granted under the 2003 Plan following the LSI acquisition are expected to be on similar terms and consistent with similar grants made pursuant to the 2009 Plan.
As of 29 October 2017, 4 million ordinary shares remained available for issuance under the 2003 Plan.
In connection with the Broadcom Merger, Broadcom assumed the 2012 Plan and outstanding unvested RSUs originally granted by BRCM under the 2012 Plan that were held by continuing employees. At the time of the acquisition, these awards were converted to Broadcom RSUs, with adjustments made to the number of shares subject to RSU awards so that the intrinsic value of each award was approximately the same immediately before and immediately after the adjustment. These unvested RSUs will vest in accordance with their original terms, generally vesting in equal quarterly instalments over a four-year period from the original grant date. Under the 2012 Plan, Broadcom may grant to former employees of BRCM and other employees who were not employees of Avago at the time of the acquisition restricted stock awards, RSUs, share options and share appreciation rights with an exercise price that is no less than the fair market value on the date of grant. No participant may be granted share options, restricted stock or RSUs, covering more than an aggregate of four million shares in any financial year. Equity awards granted under the 2012 Plan following the Broadcom Merger are expected to be on similar terms and consistent with similar grants made pursuant to the 2009 Plan.
As of 29 October 2017, 82 million ordinary shares remained available for issuance under the 2012 Plan. The number of shares available for issuance under the 2012 Plan is subject to an annual increase of 12 million shares.
The income tax benefits for share-based compensation expense were $273 million, $89 million and $130 million for financial years 2017, 2016 and 2015, respectively.
A-87
Table of Contents
BROADCOM LIMITED AND ITS SUBSIDIARIES
NOTES TO THE FINANCIAL STATEMENTS
For the financial year ended 29 October 2017
| 23. | Share capital (continued) |
The following table summarises the weighted-average assumptions utilised to calculate the fair value of market-based awards granted in the periods presented:
| Market-Based Awards Financial Year |
||||||||||||
| 2017 | 2016 | 2015 | ||||||||||
| Risk-free interest rate |
1.7% | 1.2% | 1.4% | |||||||||
| Dividend yield |
1.8% | 1.3% | 1.2% | |||||||||
| Volatility |
32.3% | 35.0% | 36.3% | |||||||||
| Expected term (in years) |
4.00 | 3.80 | 4.40 | |||||||||
The risk-free interest rate was derived from the average U.S. Treasury Strips rate during the period, which approximated the rate in effect at the time of grant.
The dividend yield was based on the historical and expected dividend pay-outs as of the respective award grant dates.
The expected volatility was based on Broadcom’s own historical share price volatility over the period commensurate with the expected life of the awards and the implied volatility from its own traded ordinary shares with a term of 180 days measured at a specific date.
| (a) | Restricted stock options unit awards |
RSU awards granted to employees under the 2009 Plan are generally time-based and vest over four years. An RSU is an equity award that is granted with an exercise price equal to zero and which represents the right to receive one of the Company’s ordinary shares immediately upon vesting. The Company also grants market-based RSUs with both a service condition and a market condition as part of its equity compensation programs under the 2009 Plan. During financial years 2017, 2016 and 2015, the Company granted market-based RSUs that vest over four years, subject to satisfaction of share price contingency conditions. During financial year 2017, the Company also granted market-based RSUs under which grantees may receive the number of shares ranging from 0% to 450% of the original grant at vesting based upon the total shareholder return (“TSR”), on the Company’s ordinary share as compared to the TSR of an index group of companies. The market-based RSUs generally vest over four years, subject to satisfaction of market conditions.
In connection with the Broadcom Merger, Broadcom assumed RSUs originally granted by BRCM. Share-based compensation expense reported in continuing operations in financial years 2017 and 2016 was $179 million and $222 million, respectively, related to the assumed BRCM RSUs. Broadcom have assumed an annualized forfeiture rate for RSUs of 5% in each of financial years 2017 and 2016 and 3% in financial year 2015. Broadcom will recognise additional expense if actual forfeitures are lower than estimated, and will recognise a benefit if actual forfeitures are higher than estimated.
A-88
Table of Contents
BROADCOM LIMITED AND ITS SUBSIDIARIES
NOTES TO THE FINANCIAL STATEMENTS
For the financial year ended 29 October 2017
| 23. | Share capital (continued) |
| (a) | Restricted stock options unit awards (continued) |
The expected term of market-based RSUs valued using Monte Carlo simulation techniques was commensurate with the awards’ contractual terms.
A summary of time- and market-based RSU activity is as follows:
| Number of Outstanding |
Weighted- Grant Date | ||||||||||
| (millions) | (US$ millions) | ||||||||||
| Balance as of 1 November 2015 |
5 | 95.17 | |||||||||
| Assumed in Broadcom Merger |
6 | 135.58 | |||||||||
| Granted |
12 | 138.45 | |||||||||
| Vested |
(4) | 114.49 | |||||||||
| Forfeited |
(2) | 130.30 | |||||||||
| Balance as of 30 October 2016 |
17 | 130.71 | |||||||||
| Granted |
8 | 199.33 | |||||||||
| Vested |
(5) | 126.81 | |||||||||
| Forfeited |
(2) | 142.78 | |||||||||
| Balance as of 29 October 2017 |
18 | 163.42 | |||||||||
The aggregate fair value of time- and market-based RSUs that vested in financial years 2017, 2016 and 2015 was $1,172 million, $590 million and $179 million, respectively. As of 29 October 2017, the total unrecognised compensation cost related to unvested RSUs was $2,134 million, which is expected to be recognised over the remaining weighted-average service period of 3.0 years.
| (b) | Share Options |
Options issued to employees under the 2009 Plan prior to March 2011 generally expire ten years following the date of grant. Since March 2011, options issued to employees under the 2009 Plan generally expire seven years after the date of grant. Options awarded to non-employees under this plan generally expire after five years. Options issued to both employees and non-employees under the 2009 Plan generally vest over a four-year period from the date of grant and are granted with an exercise price equal to the fair market value on the date of grant. Any share options cancelled or forfeited after 27 July 2009 under the equity incentive plans adopted prior to the 2009 Plan become available for issuance under the 2009 Plan.
A-89
Table of Contents
BROADCOM LIMITED AND ITS SUBSIDIARIES
NOTES TO THE FINANCIAL STATEMENTS
For the financial year ended 29 October 2017
| 23. | Share capital (continued) |
| (b) | Share Options (continued) |
A summary of time- and market-based share option activity is as follows:
| Number of outstanding |
Weighted- average exercise price per |
Weighted- remaining contractual life |
Aggregate intrinsic value | ||||||||||||||||||||
| (in millions) | (US$ millions) | (in years) | |||||||||||||||||||||
| Balance as of 1 November 2015 |
21 | 47.92 | |||||||||||||||||||||
| Exercised |
(5) | 44.35 | 579 | ||||||||||||||||||||
| Cancelled |
(1) | 53.56 | |||||||||||||||||||||
| Balance as of 30 October 2016 |
15 | 48.77 | |||||||||||||||||||||
| Exercised |
(4) | 45.48 | 682 | ||||||||||||||||||||
| Cancelled |
(1) | 66.08 | |||||||||||||||||||||
| Balance as of 29 October 2017 |
10 | 49.54 | 2.85 | 2,112 | |||||||||||||||||||
| Fully vested as of 29 October 2017 |
9 | 46.49 | 2.75 | 1,847 | |||||||||||||||||||
| Fully vested and expected to vest as of 29 October 2017 |
10 | 49.54 | 2.85 | 2,112 | |||||||||||||||||||
As of 29 October 2017, the total unrecognised compensation cost related to unvested time- and market-based share options was $17 million, which is expected to be recognised over the remaining weighted-average service period of 0.7 years.
| (c) | Employee Share Purchase Plan |
The Company maintains an ESPP, which provides eligible employees with the opportunity to acquire an ownership interest in the Company through periodic payroll deductions, based on a six-month look-back period, at a price equal to the lesser of 85% of the fair market value of the ordinary shares at either the beginning or ending of the relevant offering period. The ESPP will terminate on 27 July 2019 unless sooner terminated.
In financial years 2017, 2016 and 2015, under the ESPP, employees purchased 0.5 million, 0.4 million and 0.2 million ordinary shares for $78 million, $51 million and $15 million, respectively. As of 29 October 2017, the total unrecognized compensation cost related to the ESPP purchase rights was $12 million, which is expected to be recognised over the remaining four months of the current offering period under the ESPP.
A-90
Table of Contents
BROADCOM LIMITED AND ITS SUBSIDIARIES
NOTES TO THE FINANCIAL STATEMENTS
For the financial year ended 29 October 2017
| 24. | Retained profits |
Movement in retained profits for the Company is as follows:
| Company |
||||||||
| 2017 | 2016 | |||||||
| (US$ millions) | (US$ millions) | |||||||
| Beginning of financial year |
2,077 | 2,240 | ||||||
| Net profit |
1,736 | 553 | ||||||
| Dividends paid (Note 25) |
(1,653 | ) | (716 | ) | ||||
| End of financial year |
2,160 | 2,077 | ||||||
| 25. | Dividends |
| Group |
||||||||
| 2017 | 2016 | |||||||
| (US$ millions) | (US$ millions) | |||||||
| Ordinary dividends |
||||||||
| Final dividend of US$1.02 (2015: US$0.44) per share (1-tier tax exempt) paid in respect of the previous financial year |
407 | 122 | ||||||
| Interim dividends of US$3.06 (2016: US$1.50) per share (1-tier tax exempt) paid in respect of the current financial year |
1,246 | 594 | ||||||
| 1,653 | 716 | |||||||
At the meeting of the Board held on 4 December 2017, an interim dividend of US$1.75 per Broadcom ordinary share was declared. These financial statements do not reflect this dividend, which will be accounted for in shareholders’ equity as an appropriation of retained profits in the financial year ending 4 November 2018.
| 26. | Contingencies |
Contingent liabilities, excluding those relating to business combinations (Note 31), of which the probability of settlement is not remote at the balance sheet date, are as follows:
Group
As of 29 October 2017 and 30 October 2016, Broadcom had outstanding obligations relating to standby letters of credit of US$12 million. Standby letters of credit are financial guarantees provided to third parties for leases, customs, taxes and certain self-insured risks. If the guarantees are called, Broadcom must reimburse the provider of the guarantees. The fair values of the letters of credit approximate the contract amounts. The standby letters of credit are generally renewed annually.
A-91
Table of Contents
BROADCOM LIMITED AND ITS SUBSIDIARIES
NOTES TO THE FINANCIAL STATEMENTS
For the financial year ended 29 October 2017
| 27. | Commitments |
| (a) | Capital commitments |
Capital expenditures contracted for at the balance sheet date but not recognised in the financial statements are as follows:
| Group |
||||||||
| 2017 | 2016 | |||||||
| (US$ millions) | (US$ millions) | |||||||
| Property, plant and equipment |
123 | 312 | ||||||
| (b) | Operating lease commitments - where the Group is a lessee |
The Group leases land, factories and warehouses from non-related parties under non-cancellable operating lease agreements. The leases have varying terms, escalation clauses and renewal rights.
The future minimum lease payables under non-cancellable operating leases contracted for at the balance sheet date but not recognised as liabilities, are as follows:
| Group |
||||||||
| 2017 | 2016 | |||||||
| (US$ millions) | (US$ millions) | |||||||
| Not later than one year |
119 | 144 | ||||||
| Between one and five years |
205 | 246 | ||||||
| Later than five years |
421 | 56 | ||||||
| 745 | 446 | |||||||
| 28. | Financial risk management |
The Group’s activities expose it to a variety of financial risks, including market risk (including foreign currency risk, cash flow and fair value interest rate risk), credit risk, liquidity risk and capital risk. The Group’s overall risk management program focuses on the unpredictability of financial markets and seeks to minimise the potential adverse effects on the Group’s financial performance.
Financial risk management is carried out by the treasury management department (the “Group Treasury”) under policies approved by the Board. The Group Treasury identifies, evaluates and hedges financial risks through close co-operation with the Group’s operating units.
| (a) | Market risk |
| (i) | Currency risk |
The Group operates worldwide with entities in the Group regularly transacting in foreign currencies.
A-92
Table of Contents
BROADCOM LIMITED AND ITS SUBSIDIARIES
NOTES TO THE FINANCIAL STATEMENTS
For the financial year ended 29 October 2017
| 28. | Financial risk management (continued) |
| (a) | Market risk (continued) |
| (i) | Currency risk (continued) |
Currency risk arises within entities in the Group when transactions are denominated in foreign currencies such as the Singapore Dollar (“SGD”), Israeli Shekel (“ILS”), Euros (“EUR”), Japanese Yen (“JPY”) and Indian Rupee (“INR”).
To manage the currency risk, the Group enters into foreign exchange forward contracts to manage financial exposures resulting from the changes in the exchange rates of these foreign currencies.
The Group’s currency exposure based on the information provided to key management is as follows:
| SGD | ILS | EUR | JPY | INR | ||||||||||||||||
| (US$ millions) | (US$ millions) | (US$ millions) | (US$ millions) | (US$ millions) | ||||||||||||||||
| 2017 |
||||||||||||||||||||
| Financial assets |
||||||||||||||||||||
| Cash and cash equivalents |
3 | 4 | 29 | 21 | 18 | |||||||||||||||
| Trade and other receivables |
3 | 1 | 10 | 2 | - | |||||||||||||||
| 6 | 5 | 39 | 23 | 18 | ||||||||||||||||
| Financial liabilities |
||||||||||||||||||||
| Other financial liabilities |
(66 | ) | (10 | ) | (13 | ) | (3 | ) | (7 | ) | ||||||||||
| Net assets |
(60 | ) | (5 | ) | 26 | 20 | 11 | |||||||||||||
| 2016 |
||||||||||||||||||||
| Financial assets |
||||||||||||||||||||
| Cash and cash equivalents |
11 | 1 | 46 | 18 | 21 | |||||||||||||||
| Trade and other receivables |
- | - | 9 | 3 | - | |||||||||||||||
| 11 | 1 | 55 | 21 | 21 | ||||||||||||||||
| Financial liabilities |
||||||||||||||||||||
| Other financial liabilities |
(7 | ) | (2 | ) | (5 | ) | (1 | ) | (5 | ) | ||||||||||
| Net assets |
4 | (1 | ) | 50 | 20 | 16 | ||||||||||||||
The Company’s business operations are not exposed to significant foreign currency risks as it has no significant transactions denominated in foreign currencies.
A-93
Table of Contents
BROADCOM LIMITED AND ITS SUBSIDIARIES
NOTES TO THE FINANCIAL STATEMENTS
For the financial year ended 29 October 2017
| 28. | Financial risk management (continued) |
| (a) | Market risk (continued) |
| (i) | Currency risk (continued) |
If the SGD, ILS, EUR, JPY, INR change against the U.S. dollar by 5% in either of financial years 2017 or 2016, with all other variables, including tax rate being held constant, the effects arising from the net financial liability/asset that are exposed to currency risk will be as follows:
| Increase/(Decrease) | ||||||||||||||||||||||||||||||||
| 2017 | 2016 | |||||||||||||||||||||||||||||||
| Profit after tax |
Other comprehensive income |
Profit after tax |
Other comprehensive income |
|||||||||||||||||||||||||||||
| (US$ millions) | (US$ millions) | (US$ millions) | (US$ millions) | |||||||||||||||||||||||||||||
| Group |
||||||||||||||||||||||||||||||||
| SGD against USD |
||||||||||||||||||||||||||||||||
| - Strengthened |
3 | 3 | - | - | ||||||||||||||||||||||||||||
| - Weakened |
(3 | ) | (3 | ) | - | - | ||||||||||||||||||||||||||
| ILS against USD |
||||||||||||||||||||||||||||||||
| - Strengthened |
- | - | - | - | ||||||||||||||||||||||||||||
| - Weakened |
- | - | - | - | ||||||||||||||||||||||||||||
| EUR against USD |
||||||||||||||||||||||||||||||||
| - Strengthened |
(1 | ) | (1 | ) | (3 | ) | (3 | ) | ||||||||||||||||||||||||
| - Weakened |
1 | 1 | 3 | 3 | ||||||||||||||||||||||||||||
| JPY against USD |
||||||||||||||||||||||||||||||||
| - Strengthened |
(1 | ) | (1 | ) | (1 | ) | (1 | ) | ||||||||||||||||||||||||
| - Weakened |
1 | 1 | 1 | 1 | ||||||||||||||||||||||||||||
| INR against USD |
||||||||||||||||||||||||||||||||
| - Strengthened |
(1 | ) | (1 | ) | (1 | ) | (1 | ) | ||||||||||||||||||||||||
| - Weakened |
1 | 1 | 1 | 1 | ||||||||||||||||||||||||||||
| (ii) | Price risk |
The Group has insignificant exposure to equity price risk.
| (iii) | Cash flow and fair value interest rate risks |
Cash flow interest rate risk is the risk that the future cash flows of a financial instrument will fluctuate because of changes in market interest rates. Fair value interest rate risk is the risk that the fair value of a financial instrument will fluctuate due to changes in market interest rates.
The Group’s exposure to cash flow interest rate risk arises primarily from interest-bearing term loans and interest-bearing assets held. In connection with the completion of Broadcom Merger, the Group entered into the 2016 Credit Agreement, which provided for the 2016
A-94
Table of Contents
BROADCOM LIMITED AND ITS SUBSIDIARIES
NOTES TO THE FINANCIAL STATEMENTS
For the financial year ended 29 October 2017
| 28. | Financial risk management (continued) |
| (a) | Market risk (continued) |
| (iii) | Cash flow and fair value interest rate risks (continued) |
Term Loans at floating interest rates. The 2016 Term Loans were paid in full with proceeds from the issuance and sale of the fixed rate 2017 Senior Notes. The Group Treasury closely monitors market interest rates in order to reduce the exposures to the interest rate risk described above. Interest-bearing assets held consist of fixed income investments, money market funds and bank acceptances with an original maturity of three months or less.
The Group’s borrowings at variable rates on which effective hedges have not been entered into and interest-bearing assets held are denominated mainly in U.S. dollars. For financial year 2017, if the U.S. dollar interest rates had been higher/lower by 0.5% with all other variables including tax rate being held constant, the profit after tax would have been higher/lower by US$34.5 million as a result of higher/lower interest income on interest-bearing assets. For financial year 2016, if the U.S. dollar interest rates had been higher/lower by 0.5% with all other variables including tax rate being held constant, the profit after tax would have been lower/higher by US$63.7 million as a result of higher/lower interest expense on these borrowings.
| (b) | Credit risk |
Credit risk refers to the risk that a counterparty will default on its contractual obligations resulting in financial loss to the Group. The major classes of financial assets of the Group and of the Company are bank deposits and trade receivables. For trade receivables, the Group adopts the policy of dealing only with customers of appropriate credit standing and history, and obtaining sufficient collateral or buying credit insurance where appropriate to mitigate credit risk. For other financial assets, the Group adopts the policy of dealing only with high credit quality counterparties.
Credit exposure to an individual counterparty is restricted by credit limits that are approved by the Chief Financial Officer based on ongoing credit evaluation. The counterparty’s payment pattern and credit exposure are continuously monitored at the entity level by the respective management and at the Group level by the Chief Financial Officer.
The Group sells its products primarily through its direct sales force, distributors and manufacturers’ representatives. One direct customer individually accounted for 17% and 18% of the Group’s net accounts receivable balance as at 29 October 2017 and 30 October 2016, respectively.
| (i) | Financial assets that are neither past due nor impaired |
Bank deposits that are neither past due nor impaired are mainly deposits with banks with high credit-ratings assigned by international credit-rating agencies. Trade receivables that are neither past due nor impaired are substantially companies with a good collection track record with the Group and Company.
A-95
Table of Contents
BROADCOM LIMITED AND ITS SUBSIDIARIES
NOTES TO THE FINANCIAL STATEMENTS
For the financial year ended 29 October 2017
| 28. | Financial risk management (continued) |
| (b) | Credit risk (continued) |
| (ii) | Financial assets that are past due and/or impaired |
There is no other class of financial assets that is past due and/or impaired except for trade receivables.
The aging analysis of trade receivables past due but not impaired is as follows:
| Group | ||||||||||
| 2017 | 2016 | |||||||||
| (US$ millions) | (US$ millions) | |||||||||
| Past due < 3 months |
237 | 147 | ||||||||
| Past due 3 to 6 months |
- | - | ||||||||
| 237 | 147 | |||||||||
The carrying amount of trade receivables individually determined to be impaired and the movement in the related allowance for impairment are as follows:
| Group | ||||||||||
| 2017 | 2016 | |||||||||
| (US$ millions) | (US$ millions) | |||||||||
| Past due over 3 months |
- | 10 | ||||||||
| Less: Allowance for impairment |
- | (10 | ) | |||||||
| - | - | |||||||||
| Beginning of financial year |
10 | 3 | ||||||||
| Allowance increased |
- | 11 | ||||||||
| Allowance utilised |
- | (4 | ) | |||||||
| Write-back of AR |
(10 | ) | - | |||||||
| End of financial year |
- | 10 | ||||||||
| (c) | Liquidity risk |
The Group’s short-term and long-term liquidity requirements primarily arise from: (i) business acquisitions and investments the Group may make from time to time, (ii) working capital requirements, (iii) research and development and capital expenditure needs, (iv) interim cash dividend payments by Broadcom (if and when declared by the Board), (v) cash distributions by the Partnership (if and when declared by the Partnership’s general partner), (vi) interest and principal payments related to outstanding indebtedness, (vii) payment of income taxes, including taxes paid as a result of the intercompany transfer of intellectual property, and (viii) funding employee benefit plan obligations.
A-96
Table of Contents
BROADCOM LIMITED AND ITS SUBSIDIARIES
NOTES TO THE FINANCIAL STATEMENTS
For the financial year ended 29 October 2017
| 28. | Financial risk management (continued) |
| (c) | Liquidity risk (continued) |
Prudent liquidity risk management includes maintaining sufficient cash and marketable securities, the availability of funding through an adequate amount of committed credit facilities (Note 20) and the ability to close out market positions at a short notice. At the balance sheet date, assets held by the Group and the Company for managing liquidity risk included cash and cash equivalents as disclosed in Note 12.
Management monitors rolling forecasts of the liquidity reserve (comprises cash and cash equivalents (Note 12)) of the Group and the Company on the basis of expected cash flow. This is generally carried out at Group level in accordance with the practice and limit. In addition, the Group’s liquidity management policy involves projecting cash flows in U.S. dollar and considering the level of liquid assets necessary to meet these, monitoring liquidity ratios and maintaining debt financing plans.
The table below analyses non-derivative financial liabilities of the Group and the Company into relevant maturity groupings based on the remaining period from the balance sheet date to the contractual maturity date. The amounts disclosed in the table are the contractual undiscounted cash flows. Balances due within 12 months equal their carrying amounts as the impact of discounting is not significant.
| Less than 1 year |
Between 1 and 5 years |
Over 5 years |
||||||||||
| (US$ millions) | (US$ millions) | (US$ millions) | ||||||||||
| Group |
||||||||||||
| At 2017 |
||||||||||||
| Trade and other payables |
1,105 | - | - | |||||||||
| Borrowings |
117 | 7,009 | 10,563 | |||||||||
| At 2016 |
||||||||||||
| Trade and other payables |
1,261 | - | - | |||||||||
| Borrowings |
454 | 7,083 | 6,270 | |||||||||
| Company |
||||||||||||
| At 2017 |
||||||||||||
| Trade and other payables |
180 | - | - | |||||||||
| Borrowings |
- | - | - | |||||||||
| At 2016 |
||||||||||||
| Trade and other payables |
155 | - | - | |||||||||
| Borrowings |
- | - | - | |||||||||
A-97
Table of Contents
BROADCOM LIMITED AND ITS SUBSIDIARIES
NOTES TO THE FINANCIAL STATEMENTS
For the financial year ended 29 October 2017
| 28. | Financial risk management (continued) |
| (d) | Capital risk |
The Group’s objectives when managing capital are to safeguard the Group’s ability to continue as a going concern and to maintain an optimal capital structure so as to maximise shareholder value. In order to maintain or achieve the desired capital structure, the Group may adjust the amount of dividend payment, return capital to shareholders, issue new shares, buy back issued shares, obtain new borrowings or sell existing assets to reduce borrowings.
In financial year 2016, management monitored capital based on a leverage ratio as the Group was required by the banks to maintain a leverage ratio of not exceeding 3.9 in line with the 2016 Credit Agreement. In financial year 2017, there are no such requirements.
The leverage ratio is calculated as total First Lien borrowings (“Consolidated total debt”) less cash and cash equivalent divided by adjusted earnings before income tax, depreciation and amortisation (“Adjusted EBITDA”).
| Group | ||
| 2016 (US$ millions) | ||
| Consolidated total debt |
13,503 | |
| Less: Cash and cash equivalent |
(3,097) | |
| 10,406 | ||
| Adjusted EBITDA |
6,499 | |
| Leverage ratio |
1.60 | |
The Group was in compliance with all externally imposed capital requirements for financial year 2016. The Group is not subjected to any externally imposed capital requirements for financial year 2017.
The Company is not subjected to any externally imposed capital requirements for financial years 2017 and 2016.
| (e) | Fair value measurements |
The table below presents assets and liabilities measured and carried at fair value and classified by level of the following fair value measurement hierarchy:
Level 1 — Level 1 inputs are quoted prices (unadjusted) in active markets for identical assets or liabilities that the reporting entity has the ability to access at the measurement date.
Level 2 — Level 2 inputs are inputs other than quoted prices included within Level 1 that are observable for the asset or liability, either directly or indirectly. If the asset or liability has a specified contractual term, a Level 2 input must be observable for substantially the full term of the asset or liability.
A-98
Table of Contents
BROADCOM LIMITED AND ITS SUBSIDIARIES
NOTES TO THE FINANCIAL STATEMENTS
For the financial year ended 29 October 2017
| 28. | Financial risk management (continued) |
| (e) | Fair value measurements (continued) |
Level 3 — Level 3 inputs are unobservable inputs for the asset or liability in which there is little, if any, market activity for the asset or liability at the measurement date.
See Note 10 for disclosure of the disposal group classified as held-for-sale that are measured at fair value. See Note 7 for disclosure of the retirement plans and post-retirement Benefits that are measured at fair value.
There were no other transfers between Levels 1, 2 and 3 during the year.
Management has assessed that the fair values of cash and cash equivalents, restricted cash and time deposits, trade and notes receivables, financial assets included in other current assets, entrusted loans, trade and notes payables, financial liabilities included in other payables and accrued liabilities, short-term and current portion of interest-bearing loans and borrowings, interest payable and the current portion of long-term payables approximate their carrying amounts largely due to the short-term maturities of these instruments.
The fair values of financial instruments that are not traded in an active market (for example, over-the-counter derivatives) are determined by using valuation techniques. The Group uses a variety of methods and makes assumptions that are based on market conditions existing at each balance sheet date. The fair values of the financial assets and liabilities are included at the amount at which the instrument could be exchanged in a current transaction between willing parties, other than in a forced or liquidation sale. The following methods and assumptions were used to estimate the fair values:
| (i) | The fair values of the financial assets included in other non-current assets and financial liabilities included in other non-current liabilities have been calculated by discounting the expected future cash flows using rates currently available for instruments on with similar terms, credit risk and remaining maturities. |
| (ii) | The fair values of long-term interest-bearing loans and borrowings have been calculated by discounting the expected future cash flows using rates currently available for instruments with similar terms, credit risk and remaining maturities. |
| (iii) | The Group’s own non-performance risk for financial liabilities included in other non-current liabilities and long-term interest-bearing loans and borrowings as at 29 October 2017 and 30 October 2016 is assessed to be insignificant. |
A-99
Table of Contents
BROADCOM LIMITED AND ITS SUBSIDIARIES
NOTES TO THE FINANCIAL STATEMENTS
For the financial year ended 29 October 2017
| 28. | Financial risk management (continued) |
| (f) | Financial instruments by category |
The carrying amount of the different categories of financial instruments is as disclosed on the face of the balance sheet and in Note 13, Note 16, Note 19 and Note 20 to the financial statements, except for the following:
| Group | Company | |||||||||||||||||||
| 2017 (US$ millions) |
2016 (US$ millions) |
2017 (US$ millions) |
2016 (US$ millions) |
|||||||||||||||||
| Loans and receivables |
14,229 | 5,631 | 196 | 95 | ||||||||||||||||
| Financial liabilities at amortised cost |
18,653 | 14,903 | 180 | 155 | ||||||||||||||||
| 29. | Related party transactions |
In addition to the information disclosed elsewhere in the financial statements, the following transactions took place between the Group and related parties at terms agreed between the parties:
| (a) | Sales and purchases of goods and services |
| Group |
||||||||
| 2017 (US$ millions) |
2016 (US$ millions) |
|||||||
| Sales of goods and/or services to - other related parties |
346 | 335 | ||||||
| Purchase of inventory and other costs and expenses charged by other related parties |
145 | 81 | ||||||
|
|
|
|||||||
During financial years 2017 and 2016, in the ordinary course of business, the Group purchased from, or sold to, several entities, for which one of our directors also serves or served as a director or entities that are otherwise affiliated with one of our directors.
Outstanding balances arising from sale/purchase of goods and services, are unsecured and receivable/payable within 12 months from balance sheet date and are disclosed in Notes 13 and 19, respectively.
A-100
Table of Contents
BROADCOM LIMITED AND ITS SUBSIDIARIES
NOTES TO THE FINANCIAL STATEMENTS
For the financial year ended 29 October 2017
| 29. | Related party transactions (continued) |
| (b) | Key management personnel compensation |
Key management personnel compensation is as follows:
| Group | ||||||||
| 2017 | 2016 | |||||||
| (US$ millions) | (US$ millions) | |||||||
| Wages and salaries |
9 | 6 | ||||||
| Employer’s contribution to defined contribution plans, including Central Provident Fund |
* | * | ||||||
| Termination benefits |
- | * | ||||||
| Share option expense |
129 | 50 | ||||||
|
|
|
|||||||
| 138 | 56 | |||||||
|
|
|
|||||||
| * | Represents figures less than a million |
| 30. | Segment information |
Reportable Segments
The Group has four reportable segments: wired infrastructure, wireless communications, enterprise storage and industrial & others. These segments align with the Group’s principal target markets. The segments represent components for which separate financial information is available that is utilised on a regular basis by the CODM, as defined by authoritative guidance on segment reporting, in determining how to allocate resources and evaluate performance. The segments are determined based on several factors, including client base, homogeneity of products, technology, delivery channels and similar economic characteristics.
The CODM assesses the performance of each segment and allocates resources to those segments based on net revenue and operating results and does not evaluate operating segments using discrete asset information. Operating results by segment include items that are directly attributable to each segment. Operating results by segment also include shared expenses such as global operations, including manufacturing support, logistics and quality control, which are allocated primarily based on revenue, while facilities expenses are primarily allocated based on site-specific headcount.
A-101
Table of Contents
BROADCOM LIMITED AND ITS SUBSIDIARIES
NOTES TO THE FINANCIAL STATEMENTS
For the financial year ended 29 October 2017
| 30. | Segment information (continued) |
Reportable Segments (continued)
The following tables present the Group’s net revenue and operating income/(loss) from operations by reportable segment (US$ millions):
| Group | ||||||||
| 2017 | 2016 | |||||||
| (US$ million) | (US$ million) | |||||||
| Net revenue: |
||||||||
| Wired infrastructure |
8,549 | 6,582 | ||||||
| Wireless communications |
5,404 | 3,724 | ||||||
| Enterprise storage |
2,799 | 2,291 | ||||||
| Industrial and others |
884 | 643 | ||||||
|
|
|
|||||||
| Total net revenue |
17,636 | 13,240 | ||||||
|
|
|
|||||||
| Operating income/(loss): |
||||||||
| Wired infrastructure |
3,853 | 2,664 | ||||||
| Wireless communications |
2,155 | 1,282 | ||||||
| Enterprise storage |
1,527 | 995 | ||||||
| Industrial and others |
447 | 327 | ||||||
| Unallocated expenses |
(5,601 | ) | (5,677 | ) | ||||
| Income/(Loss) from continuing operations |
2,381 | (409 | ) | |||||
Unallocated Expenses
Unallocated expenses include amortisation of acquisition-related intangible assets, share-based compensation expense, restructuring, impairment and disposal charges, acquisition-related costs, including charges related to inventory step-up to fair value, litigation settlement charges and other costs, which are not used in evaluating the results of, or in allocating resources to, the Group’s segments. Acquisition-related costs also include transaction costs and any costs directly related to the acquisition and integration of acquired businesses.
Depreciation expense directly attributable to each reportable segment is included in operating results for each segment. However, the CODM does not evaluate depreciation expense by operating segment and, therefore, it is not separately presented. There was no inter-segment revenue. The accounting policies of the segments are the same as those described in the summary of significant accounting policies.
The following tables present net revenue and long-lived asset information based on geographic region. Net revenue is based on the geographic location of the distributors, original equipment manufacturers
A-102
Table of Contents
BROADCOM LIMITED AND ITS SUBSIDIARIES
NOTES TO THE FINANCIAL STATEMENTS
For the financial year ended 29 October 2017
| 30. | Segment information (continued) |
Reportable Segments (continued)
Unallocated Expenses (continued)
or contract manufacturers who purchased Broadcom’s products, which may differ from the geographic location of the end customers. Long-lived assets include property, plant and equipment and are based on the physical location of the assets.
| Group |
||||||||
| 2017 | 2016 | |||||||
| (US$ million) | (US$ million) | |||||||
| Net revenue: |
||||||||
| China |
9,460 | 7,184 | ||||||
| United States |
1,266 | 1,124 | ||||||
| Singapore |
323 | 250 | ||||||
| Other |
6,587 | 4,682 | ||||||
| Total net revenue |
17,636 | 13,240 | ||||||
| Long-lived assets: |
||||||||
| United States |
1,822 | 1,917 | ||||||
| Taiwan |
268 | 186 | ||||||
| Singapore |
79 | 78 | ||||||
| Other |
430 | 328 | ||||||
| Total long-lived assets |
2,599 | 2,509 | ||||||
Significant Customer Information
The Group sells its products through its direct sales force and a select network distributors globally. One direct customer accounted for 17% and 18% of the Group’s net accounts receivable balance as at 29 October 2017 and 30 October 2016, respectively. During financial years 2017 and 2016, one direct customer represented 14% of the Group’s net revenue in each period. The majority of the revenue from this customer was included in the Group’s wired infrastructure and wireless communications segments. This customer is a contract manufacturer for a number of OEMs.
| 31. | Business combinations |
| (a) | Acquisition of Broadcom Corporation |
On 1 February 2016, pursuant to an Agreement and Plan of Merger dated as of 28 May 2015 (the “Broadcom Agreement”), the Company, Avago, BRCM and certain other parties completed various transactions, under Singapore law between Avago and the Company (the “Avago Scheme”). Pursuant to the Avago Scheme, all issued ordinary shares of Avago were exchanged on a one-for-one basis for newly issued ordinary shares of the Company. Immediately following the consummation of the Avago
A-103
Table of Contents
BROADCOM LIMITED AND ITS SUBSIDIARIES
NOTES TO THE FINANCIAL STATEMENTS
For the financial year ended 29 October 2017
| 31. | Business combinations (continued) |
| (a) | Acquisition of Broadcom Corporation (continued) |
Scheme, two subsidiaries of the Company merged with and into BRCM with BRCM as the surviving corporation of each such merger (the “Broadcom Merger”). Following the Avago Scheme and the Broadcom Merger (the “Broadcom Transaction”), each of Avago and BRCM became indirect subsidiaries of the Company and the Partnership.
The Partnership is an exempted limited partnership formed under the laws of the Cayman Islands. The Company is the Partnership’s sole General Partner and currently owns a majority interest (by vote and value) in the Partnership represented by common partnership units (“Common Units”). The balance of the partnership units represents the Partnership REUs, the holders of which are referred to as the Limited Partners. As General Partner, the Company has the exclusive right, power and authority to manage, control, administer and operate the business and affairs and to make decisions regarding the undertaking and business of the Partnership in accordance with the Partnership’s amended and restated exempted limited partnership agreement, as amended from time to time, and applicable laws.
The Avago Scheme was accounted for in all periods as a capital reorganisation, as the transaction was premised on a non-substantive exchange in order to facilitate the acquisition of BRCM, resulting in the retention of the historical basis of accounting. Under this method of accounting, the Company and Avago were treated as if they had always been combined for accounting and financial reporting purposes. The accounting treatment under a capital reorganisation is described in further detail in Note 2.24.
The Broadcom Merger closed on 1 February 2016, pursuant to the terms of the Broadcom Agreement. The aggregate consideration for the Broadcom Merger, which consisted of both cash and equity consideration, was approximately US$28,758 million, net of cash acquired.
The cash portion of the Broadcom Merger was funded with the net proceeds from the issuance of the term loan facilities provided for under the 2016 Credit Agreement, as defined and discussed in further detail in Note 20 “Borrowings,” as well as cash on hand of the combined companies.
BRCM was a leader in semiconductor solutions for wired and wireless communications and provided a broad portfolio of highly-integrated system-on-a-chip solutions that seamlessly deliver voice, video, data and multimedia connectivity in the home, office and mobile environments. The Group acquired BRCM to position themselves as a global diversified leader in wired and wireless communication semiconductors and to deepen its broad portfolios, and to enable the Group to better address the evolving needs of customers across the wired and wireless end markets.
A-104
Table of Contents
BROADCOM LIMITED AND ITS SUBSIDIARIES
NOTES TO THE FINANCIAL STATEMENTS
For the financial year ended 29 October 2017
| 31. | Business combinations (continued) |
| (a) | Acquisition of Broadcom Corporation (continued) |
| (i) | Purchase consideration |
The aggregate consideration for the Broadcom Merger, net of cash acquired, consisted of the following (US$ millions):
| Group |
||||
| (US$ millions) | ||||
| Cash for outstanding BRCM common stock |
16,798 | |||
| Fair value of Broadcom ordinary shares issued for outstanding BRCM common stock |
15,438 | |||
| Fair value of Partnership REUs issued for outstanding BRCM common stock |
3,140 | |||
| Fair value of partially vested assumed restricted stock unit awards |
182 | |||
| Cash for vested BRCM equity awards |
137 | |||
| Effective settlement of pre-existing relationships |
11 | |||
| Total purchase consideration |
35,706 | |||
| Less: Cash acquired |
(6,948 | ) | ||
| Total purchase consideration, net of cash acquired |
28,758 | |||
The Company issued 112 million ordinary shares and the Partnership issued 23 million Partnership REUs, all of which are valued and presented in the above table, to former BRCM shareholders in the Broadcom Merger. Broadcom also assumed unvested RSUs originally granted by BRCM and converted them into 6 million of Broadcom RSUs. The portion of the fair value of partially vested assumed RSUs associated with prior service of BRCM employees represented a component of the total consideration, as presented above, and was valued based on the Company’s ordinary share price as of the Acquisition Date.
The purchase price has been allocated to tangible and intangible assets acquired and liabilities assumed based on their estimated fair values. The fair value of identifiable intangible assets acquired was based on estimates and assumptions made by management at the time of acquisition.
| (ii) | Effect of cash flows of the Group |
| Group |
||||
| (US$ millions) | ||||
| Cash paid |
16,980 | |||
| Less: cash and cash equivalents in BRCM |
(6,948 | ) | ||
| Cash outflow on acquisition |
10,032 | |||
A-105
Table of Contents
BROADCOM LIMITED AND ITS SUBSIDIARIES
NOTES TO THE FINANCIAL STATEMENTS
For the financial year ended 29 October 2017
| 31. | Business combinations (continued) |
| (a) | Acquisition of Broadcom Corporation (continued) |
| (iii) | Identifiable assets acquired, liabilities assumed and goodwill |
The allocation of the total purchase price, net of cash acquired, is as follows (US$ millions):
| Fair value |
||||
| (US$ millions) | ||||
| Trade accounts receivable |
669 | |||
| Inventory |
1,853 | |||
| Assets held-for-sale |
833 | |||
| Other current assets |
194 | |||
| Property, plant and equipment |
889 | |||
| Goodwill |
22,992 | |||
| Intangible assets |
14,808 | |||
| Other long-term assets |
121 | |||
| Total assets acquired |
42,359 | |||
| Accounts payable |
(559 | ) | ||
| Employee compensation and benefits |
(104 | ) | ||
| Current portion of long-term debt |
(1,475 | ) | ||
| Other current liabilities |
(780 | ) | ||
| Long-term debt |
(139 | ) | ||
| Other long-term liabilities |
(10,544 | ) | ||
| Total liabilities assumed |
(13,601 | ) | ||
| Fair value of net assets acquired |
28,758 | |||
Goodwill was primarily attributable to the assembled workforce, anticipated synergies and economies of scale expected from the operations of the combined company. The synergies include certain cost savings, operating efficiencies, and other strategic benefits projected to be achieved as a result of the Broadcom Merger. Goodwill is not deductible for tax purposes.
The assets held-for-sale represented those BRCM businesses that were not aligned with the Group’s strategic objectives. The sales of these businesses are discussed in Note 10 “Discontinued operations and disposal group classified as held-for-sale”.
| (iv) | Revenue and profit contribution |
The Group’s results of continuing operations for financial year 2016 include US$6,993 million of net revenue attributable to BRCM. It is impracticable to determine the effect on net loss
A-106
Table of Contents
BROADCOM LIMITED AND ITS SUBSIDIARIES
NOTES TO THE FINANCIAL STATEMENTS
For the financial year ended 29 October 2017
| 31. | Business combinations (continued) |
| (a) | Acquisition of Broadcom Corporation (continued) |
| (iv) | Revenue and profit contribution (continued) |
attributable to BRCM for financial year 2016 as the operations of BRCM were immediately integrated into Broadcom’s ongoing operations.
| (v) | Acquisition-related costs |
Transaction costs of US$42 million incurred related to the Broadcom Merger were included in selling, general and administrative expense in the consolidated statements of operations for financial year 2016.
| (vi) | Acquired intangible assets |
Identified intangible assets and their respective useful lives are as follows:
| Fair value | Weighted- average amortisation periods |
|||||||
| (US$ millions) | (in years) | |||||||
| Developed technology |
9,010 | 6 | ||||||
| Customer contracts and related relationships |
2,703 | 2 | ||||||
| Order backlog |
750 | <1 | ||||||
| Trade name |
350 | 17 | ||||||
| Other |
45 | 16 | ||||||
|
|
|
|||||||
| Total identified finite-lived intangible assets |
12,858 | |||||||
| In-process research and development |
1,950 | N/A | ||||||
|
|
|
|||||||
| Total identified intangible assets, net of assets |
14,808 | |||||||
| Intangible assets included in assets held-for-sale |
320 | |||||||
|
|
|
|||||||
| Identified intangible assets |
15,128 | |||||||
|
|
|
|||||||
Developed technology relates to products for wired and wireless communication applications. The developed technology was valued using the multi-period excess earnings method under the income approach.
This method reflects the present value of the projected cash flows that are expected to be generated by the developed technology less charges representing the contribution of other assets to those cash flows. The economic useful life was determined based on the technology cycle related to each developed technology, as well as the cash flows over the forecast period.
A-107
Table of Contents
BROADCOM LIMITED AND ITS SUBSIDIARIES
NOTES TO THE FINANCIAL STATEMENTS
For the financial year ended 29 October 2017
| 31. | Business combinations (continued) |
| (a) | Acquisition of Broadcom Corporation (continued) |
| (vi) | Acquired intangible assets (continued) |
Customer contracts and related relationships represent the fair value of future projected revenue that will be derived from sales of products to existing customers of BRCM. Customer contracts and related relationships were valued using the with-and-without-method under the income approach. In this method, the fair value is measured by the difference between the present value of the cash flows with and without the existing customers in place over the period of time necessary to reacquire the customers. The economic useful life was determined based on historical customer turnover rates.
Order backlog represents business under existing contractual obligations as of the Acquisition Date. The fair value of backlog was determined using the multi-period excess earnings method under the income approach based on expected operating cash flows from future contractual revenue. The economic useful life was determined based on the expected life of the backlog and the cash flows over the forecast period.
Trade name relates to the “Broadcom” trade name. The fair value was determined by applying the relief-from-royalty method under the income approach. This valuation method is based on the application of a royalty rate to forecasted revenue under the trade name. The economic useful life was determined based on the expected life of the trade name and the cash flows anticipated over the forecasted periods.
The fair value of IPR&D was determined using the multi-period excess earnings method under the income approach. This method reflects the present value of the projected cash flows that are expected to be generated by the IPR&D, less charges representing the contribution of other assets to those cash flows.
The amounts of purchased intangible assets recorded above represent the fair values of, and approximate the amounts a market participant would pay for, these intangible assets as of the Acquisition Date.
A-108
Table of Contents
BROADCOM LIMITED AND ITS SUBSIDIARIES
NOTES TO THE FINANCIAL STATEMENTS
For the financial year ended 29 October 2017
| 31. | Business combinations (continued) |
| (a) | Acquisition of Broadcom Corporation (continued) |
| (vi) | Acquired intangible assets (continued) |
The following table summarises the details of IPR&D by category as of the Acquisition Date:
| Description |
IPR&D |
Percentage of completion at acquisition |
Estimated cost to complete |
Estimated release date |
||||||||||||
| (US$ millions) | (US$ millions) | (financial year) | ||||||||||||||
| Set-top box solutions |
90 | 56 | % | 90 | 2016 - 2017 | |||||||||||
| Broadband carrier access solutions |
390 | 34 | % | 376 | 2016 - 2018 | |||||||||||
| Carrier switch solutions |
270 | 51 | % | 255 | 2016 - 2019 | |||||||||||
| Compute and connectivity solutions |
170 | 61 | % | 136 | 2016 - 2018 | |||||||||||
| Physical layer product solutions |
190 | 51 | % | 71 | 2016 - 2019 | |||||||||||
| Wireless connectivity combo solutions |
770 | 57 | % | 364 | 2016 - 2018 | |||||||||||
| Touch controllers |
70 | 39 | % | 21 | 2016 - 2017 | |||||||||||
| Total |
1,950 | |||||||||||||||
Discount rates of 14% and 16% were applied to the projected cash flows to reflect the risk related to these wired and wireless IPR&D projects, respectively. These discount rates represent a premium of 2% over the respective wired and wireless weighted-average cost of capital to reflect the higher risk and uncertainty of the cash flows for IPR&D relative to the overall businesses.
During financial year 2016, US$411 million of acquired IPR&D was written-off to restructuring, impairment and disposal charges, as those projects were not developed further. The majority of these abandoned IPR&D projects relates to wireless connectivity combo and broadband carrier access solutions.
| (vii) | Acquired receivables |
The fair value of trade accounts receivables is US$669 million. The gross contractual amount for trade accounts receivables due is $696 million, of which $10 million is expected to be uncollectible.
A-109
Table of Contents
BROADCOM LIMITED AND ITS SUBSIDIARIES
NOTES TO THE FINANCIAL STATEMENTS
For the financial year ended 29 October 2017
| 32. | Other reserves |
| Group |
|
Company |
||||||||||||||||||
| 2017 | 2016 | 2017 | 2016 | |||||||||||||||||
| (US$ millions) | (US$ millions) | (US$ millions) | (US$ millions) | |||||||||||||||||
| Composition: |
||||||||||||||||||||
| Capital reserves |
- | - | - | - | ||||||||||||||||
| Share-based payment reserves |
1,700 | 779 | 1,618 | 697 | ||||||||||||||||
| Accumulated other comprehensive loss |
(106 | ) | (149 | ) | (73 | ) | (73 | ) | ||||||||||||
| End of financial year |
1,594 | 630 | 1,545 | 624 | ||||||||||||||||
| Movements |
||||||||||||||||||||
| (i) Capital reserves (Note 2.24) |
||||||||||||||||||||
| Beginning of financial year |
- | 2,547 | - | 2,547 | ||||||||||||||||
| Effects of capital reorganisation |
- | (2,547 | ) | - | (2,547 | ) | ||||||||||||||
| End of financial year |
- | - | - | - | ||||||||||||||||
| (ii) Share-based payment reserves |
||||||||||||||||||||
| Beginning of financial year |
779 | - | 697 | - | ||||||||||||||||
| Share-based compensation |
921 | 690 | 921 | 697 | ||||||||||||||||
| Excess tax-benefits from share- based compensation |
- | 89 | - | - | ||||||||||||||||
| End of financial year |
1,700 | 779 | 1,618 | 697 | ||||||||||||||||
| (iii) Accumulated other comprehensive loss |
||||||||||||||||||||
| Beginning of financial year |
(149 | ) | (73 | ) | (73 | ) | (73 | ) | ||||||||||||
| Unrealised loss on defined benefit pension plans or post-retirement benefit plans |
42 | (80 | ) | - | - | |||||||||||||||
| Reclassification of net loss |
1 | 4 | - | - | ||||||||||||||||
| End of financial year |
(106 | ) | (149 | ) | (73 | ) | (73 | ) | ||||||||||||
| 33. | Events occurring after balance sheet date |
| (a) | Acquisition of Brocade |
On 17 November 2017, (“Brocade Acquisition Date”), pursuant to the Agreement and Plan of Merger, by and among Broadcom, BRCM, Brocade Communications Systems, Inc. (“Brocade”), and Bobcat Merger Sub, Inc., (“Merger Sub”), which BRCM subsequently assigned to LSI on 18 December 2016, Merger Sub merged with and into Brocade with Brocade as the surviving corporation (“Brocade Merger”). As a result of the Brocade Merger, and Brocade stockholders who did not perfect their appraisal rights with respect to the Brocade Merger received, in aggregate, approximately $5.3 billion in cash in exchange for all shares of Brocade common stock issued and outstanding immediately prior to the effective time of the Brocade Merger. The Group also paid $701 million to retire Brocade’s term loan. In addition, the Group assumed certain vested (to the extent not in-the-money) and all unvested Brocade stock options, RSUs, and performance stock units (“PSUs”), held by continuing employees and service providers. All vested in-the-money Brocade stock options, after giving effect to any acceleration, and all other RSUs and PSUs were cashed out upon the Brocade Merger. As a result of the Brocade Merger, Brocade became an indirect subsidiary of the Partnership.
A-110
Table of Contents
BROADCOM LIMITED AND ITS SUBSIDIARIES
NOTES TO THE FINANCIAL STATEMENTS
For the financial year ended 29 October 2017
| 33. | Events occurring after balance sheet date (continued) |
| (a) | Acquisition of Brocade (continued) |
Brocade was a leading supplier of networking hardware, software and services, including FC SAN solutions and Internet Protocol Networking (“IP Networking”) solutions. The Group acquired Brocade to enhance its position as a leading provider of enterprise storage connectivity solutions and, with a broader portfolio for enterprise storage, to increase its ability to address the evolving needs of its OEM customers.
The aggregate consideration for the Brocade Merger consisted of the following:
| (US$ millions) | ||||
| Cash for outstanding Brocade common stock |
5,298 | |||
| Cash paid by Broadcom to retire Brocade’s term loan |
701 | |||
| Cash for vested Brocade equity awards |
28 | |||
| Fair value of partially vested assumed equity awards |
23 | |||
| Total purchase consideration |
6,050 | |||
The Group financed the Brocade Merger with the net proceeds from the issuance of the October 2017 Senior Notes (Note 20), as well as cash on hand of the combined companies.
The Group is currently evaluating the purchase price allocation following the consummation of the Brocade Merger. It is not practicable to disclose the preliminary purchase price allocation or unaudited pro forma combined financial information for this transaction, given the short period of time between the acquisition date and the issuance of these consolidated financial statements.
| (b) | Divestiture of Brocade’s IP Networking Business |
Following the Brocade Merger, on 1 December 2017, the Group sold Brocade’s IP Networking business, including the Ruckus Wireless and ICX Switch businesses, to ARRIS International plc for cash consideration of $800 million, plus unvested assumed employee stock awards.
| (c) | Sale of Brocade’s San Jose Headquarters |
On 30 November 2017, the Group completed the sale of Brocade’s San Jose, California headquarters for $225 million.
| (d) | Proposed Acquisition of Qualcomm |
On 6 November 2017, Broadcom announced a proposal to acquire Qualcomm Incorporated (“Qualcomm”) for $70 per share, consisting of $60 in cash and $10 in Broadcom ordinary shares. The Group stated that the proposal stands whether Qualcomm’s pending acquisition of NXP Semiconductors N.V. (“NXP”), is consummated on the then-disclosed terms of $110 per NXP share or is terminated. Including the assumption of net debt and giving effect to the pending NXP acquisition, the enterprise value of the proposed transaction is approximately $130 billion.
A-111
Table of Contents
BROADCOM LIMITED AND ITS SUBSIDIARIES
NOTES TO THE FINANCIAL STATEMENTS
For the financial year ended 29 October 2017
| 33. | Events occurring after balance sheet date (continued) |
| (d) | Proposed Acquisition of Qualcomm (continued) |
On 13 November 2017, Qualcomm’s board of directors rejected the Group’s proposal. In response, the Group announced that Broadcom remained fully committed to pursuing the acquisition of Qualcomm and reiterated its proposal.
On 4 December 2017, the Group announced that Broadcom had provided notice to Qualcomm of its intent to nominate 11 candidates for election to the Qualcomm board of directors at Qualcomm’s 2018 annual meeting of stockholders.
On 11 December 2017, the Group filed preliminary proxy materials with the SEC in connection with its planned solicitation of proxies to elect 11 independent, highly qualified nominees to the Qualcomm board of directors at Qualcomm’s 2018 annual meeting of stockholders, which Qualcomm has announced will be held on March 6, 2018.
On 5 January 2018, the Group filed definitive proxy materials, which were subsequently amended on 8 January 2018, and commenced sending of proxy statements and accompanying blue proxy card or blue voting instructions form to stockholders of Qualcomm for the purpose of soliciting proxies to elect the 11 independent nominees to the Qualcomm board of Directors at Qualcomm’s 2018 annual meeting of stockholders, scheduled for 6 March 2018.
The Group has also filed a premerger notification under the Hart-Scott-Rodino Antitrust Improvements Act of 1976 with the U.S. Department of Justice and the Federal Trade Commission regarding its proposed acquisition of Qualcomm. No agreement has been reached with Qualcomm and there can be no assurance that any transaction will result from the proposal.
On 5 February 2018, Broadcom announced a best and final offer to acquire all of the outstanding shares of common stock of Qualcomm. The following terms of the offer were communicated by Broadcom:
| • | Broadcom is prepared to acquire Qualcomm for an aggregate of $82.00 per Qualcomm share, consisting $60.00 and the remainder in Broadcom shares. |
| • | Broadcom is prepared to pay a ticking fee for an increase in cash consideration payable to Qualcomm stockholders if the transaction is not consummated by the one-year anniversary of entering into a definitive agreement. |
| • | Broadcom is prepared to pay to Qualcomm a significant reverse termination fee in an amount appropriate for a transaction of this size in the unlikely event Broadcom is unable to obtain required regulatory approvals. |
| • | Broadcom is willing to agree to regulatory efforts provision that is at least as favourable as the one Qualcomm provided to NXP. |
| • | Broadcom has fully negotiated commitment papers with its financing sources in an amount sufficient to fully fund the transaction. |
A-112
Table of Contents
BROADCOM LIMITED AND ITS SUBSIDIARIES
NOTES TO THE FINANCIAL STATEMENTS
For the financial year ended 29 October 2017
| 33. | Events occurring after balance sheet date (continued) |
| (d) | Proposed Acquisition of Qualcomm (continued) |
| • | The Broadcom Board is prepared to invite Paul Jacobs and one other current Qualcomm director to join the combined company’s board upon completion of the transaction. |
The offer is premised on the following conditions:
| • | Either Qualcomm acquiring NXP on the currently disclosed terms of $110 per NXP shares or the transaction being terminated. |
| • | Qualcomm not delaying or adjourning its annual meeting past 6 March 2018. |
| (e) | Re-domiciliation to the United States from Singapore |
On 2 November 2017, the Group announced its intention to initiate a process to change the ultimate parent company of the Broadcom corporate group from a Singapore company to a U.S. corporation. On 22 January 2018, the Board approved the entry by the Company into an Implementation Agreement (the “Implementation Agreement”), with a newly established Delaware corporation (also named Broadcom Limited and referred to herein as “Broadcom-Delaware”) relating to the restructuring of the Group.
The Implementation Agreement provides for a statutory procedure known as a Scheme of Arrangement (the “Scheme of Arrangement”) to be implemented by the Company and Broadcom-Delaware under Singapore law, subject to approval of the High Court of the Republic of Singapore (the “Singapore High Court”). Pursuant to the Scheme of Arrangement, all issued ordinary shares in the capital of the Company as of immediately prior to the effective time of the Scheme of Arrangement will be exchanged on a one-for-one basis for newly issued shares of common stock of Broadcom-Delaware, and the Company will become a subsidiary of Broadcom-Delaware.
In addition, the re-domiciliation is subject to the approval of the Company’s shareholders. If the Group does not complete the re-domiciliation within one year from the Brocade Acquisition Date, the Group agreed to initiate a process to separate and divest the Brocade FC SAN business. The Group expects to receive approvals by the Company’s shareholders and the Singapore High Court by the end of its financial second quarter ending 6 May 2018.
On 22 January 2018, the Group filed preliminary proxy materials with the SEC in connection with a Broadcom special shareholder meeting to approve the previously announced re-domiciliation of the ultimate parent company of the Broadcom corporate group from a Singapore company to a Delaware corporation. The re-domiciliation is expected to be tax-free to Broadcom’s shareholders.
The re-domiciliation is subject to the approval of the Company’s shareholders. If the Company does not complete the re-domiciliation within one year from the Brocade Acquisition Date, the Group agreed to initiate a process to separate and divest the Brocade FC SAN business. The Group expects to receive approvals by the Company’s shareholders and the Singapore High Court by the end of its financial second quarter ending 6 May 2018.
A-113
Table of Contents
BROADCOM LIMITED AND ITS SUBSIDIARIES
NOTES TO THE FINANCIAL STATEMENTS
For the financial year ended 29 October 2017
| 33. | Events occurring after balance sheet date (continued) |
| (f) | Exchange offer for Senior Notes |
On 9 January 2018, the Group announced that two of the Company’s subsidiaries, BRCM and Broadcom Cayman Finance Limited, have commenced an exchange offer for any and all outstanding unregistered 2017 Senior Notes. The January 2017 Notes and the October 2017 Notes were originally issued on 19 January 2017 and 17 October 2017, respectively, in private placements exempt from the registration requirements of the Securities Act of 1933, as amended, in aggregate principal amounts of $13.55 billion and $4.0 billion, respectively. Holders of these notes may exchange them for an equal principal amount of new issues of 2.375% Senior Notes due 2020, 3.000% Senior Notes due 2022, 3.625% Senior Notes due 2024, 3.875% Senior Notes due 2027, 2.200% senior Notes due 2021, 2.650% Senior Notes due 2023, 3.125% Senior Notes due 2025 and 3.500% Senior Notes due 2028, respectively, pursuant to an effective registration statement on Form S-4 filed with the SEC. Terms of the new notes are substantially identical to those of the original notes, except that the transfer restrictions and registration rights relating to the original notes do not apply to the new notes.
| (g) | U.S. 2017 Tax Reform Act and its potential tax consequences to the Broadcom Group |
On 22 December 2017, the Tax Cuts and Jobs Act (“2017 Tax Reform Act”) was enacted. The United States corporate income tax regime (including applicable statutory tax rates) changed significantly due to the enactment of the 2017 Tax Reform Act. There is significant uncertainty as to how the 2017 Tax Reform Act will be implemented from an accounting standpoint. However, following the Scheme of Arrangement, the Group expects the cash tax costs and overall effective cash tax rate of the Group (which the Group defines as cash tax costs as a percentage of non-US GAAP income before tax) to increase due to Broadcom-Delaware becoming the parent company of the Group. The Group presently expects that its overall effective cash tax rate following the Scheme of Arrangement will be in the range of 9-11%. Due to the uncertainty described above, the Group does not believe it is practicable to reconcile the foregoing amount to the Group’s effective tax rate under US GAAP. There are also no further adjustments made to this set of FRS financial statements based on the foregoing.
The Group also expects to incur additional cash tax costs as a result of the 2017 Tax Reform Act that would apply irrespective of the Scheme of Arrangement. Based on initial analysis, the Group believes the 2017 Tax Reform Act will result in a mandatory deemed repatriation tax of between $1.6 billion and $2.6 billion on certain of the Group’s non-US earnings, without taking into account available deductions and credits. The amount and timing of instalment payments of this deemed repatriation tax depend, in part, on when the Scheme of Arrangement becomes effective. However, this tax liability will be payable over eight years, with the amount of payments more heavily weighted to the latter years of this period. The Group presently expects these instalment payments to start in its financial year 2019.
The Group’s preliminary estimates of the overall cash tax impact of the Scheme of Arrangement, as well as the amount and timing of instalment payments of the mandatory deemed repatriation tax under the 2017 Tax Reform Act, are expected to change as the Group continues to refine its analysis and as additional guidance becomes available, particularly with respect to the 2017 Tax Reform Act.
A-114
Table of Contents
BROADCOM LIMITED AND ITS SUBSIDIARIES
NOTES TO THE FINANCIAL STATEMENTS
For the financial year ended 29 October 2017
| 33. | Events occurring after balance sheet date (continued) |
| (g) | U.S. 2017 Tax Reform Act and its potential tax consequences to the Broadcom Group (continued) |
There is no assurance that the final determination of the Group’s income tax liability will not be materially different than what is reflected in the Group’s income tax provisions and accruals and in the estimated ranges provide above. Significant judgment is required to determine the recognition and measurement of tax liabilities prescribed in the relevant accounting guidance for uncertainty in income taxes.
| 34. | New or revised accounting standards and interpretations |
Below are the mandatory standards, amendments and interpretations to existing standards that have been published, and are relevant for the Group’s accounting periods beginning on or after 1 January 2017 and which the Group has not early adopted:
| • | FRS 115 Revenue from contracts with customers (effective for annual periods beginning on or after 1 January 2018) |
This is the converged standard on revenue recognition. It replaces FRS 11 Construction contracts, FRS 18 Revenue, and related interpretations. Revenue is recognised when a customer obtains control of a good or service. A customer obtains control when it has the ability to direct the use of and obtain the benefits from the good or service. The core principle of FRS 115 is that an entity recognises revenue to depict the transfer of promised goods or services to customers in an amount that reflects the consideration to which the entity expects to be entitled in exchange for those goods or services. An entity recognises revenue in accordance with that core principle by applying the following steps:
| • | Step 1: Identify the contract(s) with a customer |
| • | Step 2: Identify the performance obligations in the contract |
| • | Step 3: Determine the transaction price |
| • | Step 4: Allocate the transaction price to the performance obligations in the contract |
| • | Step 5: Recognise revenue when (or as) the entity satisfies a performance obligation |
FRS 115 also includes a cohesive set of disclosure requirements that will result in an entity providing users of financial statements with comprehensive information about the nature, amount, timing and uncertainty of revenue and cash flows arising from the entity’s contracts with customers.
A-115
Table of Contents
BROADCOM LIMITED AND ITS SUBSIDIARIES
NOTES TO THE FINANCIAL STATEMENTS
For the financial year ended 29 October 2017
| 34. | New or revised accounting standards and interpretations (continued) |
| • | FRS 115 Revenue from contracts with customers (effective for annual periods beginning on or after 1 January 2018) (continued) |
Management is currently assessing the effects of applying the new standard on the Group’s financial statements and has identified the following areas that are likely to be affected:
| (i) | Rights of return – FRS 115 requires separate presentation on the balance sheet of the right to recover the goods from the customer and the refund obligation; and |
| (ii) | Accounting for certain costs incurred in fulfilling a contract – certain costs which are currently expensed may need to be recognised as an asset under FRS 115. |
At this stage, the Group is not able to estimate the impact of the new rules on the Group’s financial statements. The Group will make more detailed assessment of the impact over the next twelve months.
| • | FRS 109 Financial instruments (effective for annual periods beginning on or after 1 January 2018) |
The complete version of FRS 109 replaces most of the guidance in FRS 39. FRS 109 retains the mixed measurement model and establishes three primary measurement categories for financial assets: amortised cost, fair value through Other Comprehensive Income (OCI) and fair value through Profit or Loss. The basis of classification depends on the entity’s business model and the contractual cash flow characteristics of the financial asset. Investments in equity instruments are required to be measured at fair value through profit or loss with the irrevocable option at inception to present changes in fair value in OCI.
While the Group has yet to undertake a detailed assessment of the classification and measurement of financial assets, debt instruments currently classified as available-for-sale (AFS) financial assets would appear to satisfy the conditions for classification as at fair value through OCI and hence there will be no change to the accounting for these assets.
The other financial assets held by the Group include:
| • | equity instruments currently classified as AFS for which fair value through OCI election is available; |
| • | equity investments currently measured at fair value through profit or loss which would likely to continue to be measured on the same basis under FRS 109; and |
| • | debt instruments classified as held-to-maturity or loans and receivables and measured at amortised cost appear to meet the conditions for classification at amortised cost under FRS 109. |
Accordingly, the Group does not expect the new guidance to have a significant impact on the classification of its financial assets.
A-116
Table of Contents
BROADCOM LIMITED AND ITS SUBSIDIARIES
NOTES TO THE FINANCIAL STATEMENTS
For the financial year ended 29 October 2017
| 34. | New or revised accounting standards and interpretations (continued) |
| • | FRS 109 Financial instruments (effective for annual periods beginning on or after 1 January 2018) (continued) |
For financial liabilities there were no changes to classification and measurement except for the recognition of changes in own credit risk in OCI, for liabilities designed at fair value through profit or loss. There will be no impact on the Group’s accounting for financial liabilities as the Group does not have any such liabilities.
FRS 109 relaxes the requirements for hedge effectiveness by replacing the bright line hedge effectiveness tests. It requires an economic relationship between the hedged item and hedging instrument and for the ‘hedged ratio’ to be the same as the one management actually use for risk management purposes. While the Group is yet to undertake a detailed assessment, it would appear that the Group’s current hedge relationships would qualify as continuing hedges upon the adoption of FRS 109. Accordingly, the Group does not expect a significant impact on the accounting for its hedging relationships.
There is now a new expected credit losses model that replaces the incurred loss impairment model used in FRS 39. It applies to financial assets classified at amortised cost, debt instruments measured at fair value through OCI, contract assets under FRS 115 Revenue from contracts with customers, lease receivables, loan commitments and certain financial guarantee contracts. While the Group has not yet undertaken a detailed assessment of how its impairment provisions would be affected by the new model, it may result in an earlier recognition of credit losses.
The new standard also introduces expanded disclosure requirements and changes in presentation. These are expected to change the nature and extent of the Group’s disclosures about its financial instruments particularly in the year of the adoption of the new standard.
| • | FRS 116 Leases (effective for annual periods beginning on or after 1 January 2019) |
FRS 116 will result in almost all leases being recognised on the balance sheet, as the distinction between operating and finance leases is removed. Under the new standard, an asset (the right to use the leased item) and a financial liability to pay rentals are recognised. The only exceptions are short-term and low-value leases. The accounting for lessors will not change significantly.
The standard will affect primarily the accounting for the Group’s operating leases. As at the reporting date, the Group has non-cancellable operating lease commitments of US$745 million (Note 27(b)). However, the Group has yet to determine to what extent these commitments will result in the recognition of an asset and a liability for future payments and how this will affect the Group’s profit and classification of cash flows.
Some of the commitments may be covered by the exception for short-term and low-value leases and some commitments may relate to arrangements that will not qualify as leases under FRS 116.
A-117
Table of Contents
BROADCOM LIMITED AND ITS SUBSIDIARIES
NOTES TO THE FINANCIAL STATEMENTS
For the financial year ended 29 October 2017
| 35. | Listing of significant subsidiaries in the Group |
The Group had the following significant subsidiaries as at 29 October 2017 and 30 October 2016:
| Equity holding | ||||||||||
| 2017 | 2016 | |||||||||
| Name of companies |
Country of incorporation | % | % | |||||||
| Agere Systems LLC^ |
Delaware (U.S.A.) | 95 | 95 | |||||||
| AT Luxembourg S.a r.l.^ |
Luxembourg | 95 | 95 | |||||||
| Avago Technologies Cayman Holdings Ltd^ |
Cayman Islands | 95 | 95 | |||||||
| Avago Technologies Cayman Ltd.^ |
Cayman Islands | 95 | 95 | |||||||
| Avago Technologies Finance Pte. Ltd.^ |
Singapore | 95 | 95 | |||||||
| Avago Technologies General IP (Singapore) Pte. Ltd.^ |
Singapore | 95 | 95 | |||||||
| Avago Technologies Holdings B.V.^ |
Netherlands | 95 | 95 | |||||||
| Avago Technologies International Sales Pte. Limited^ |
Singapore | 95 | 95 | |||||||
| Avago Technologies Manufacturing (Singapore) Pte. Ltd.^ |
Singapore | 95 | 95 | |||||||
| Avago Technologies U.S. Inc.^ |
Delaware (U.S.A.) | 95 | 95 | |||||||
| Avago Technologies Wireless (U.S.A.) Manufacturing LLC^ |
Delaware (U.S.A.) | 95 | 95 | |||||||
| BC Luxembourg S.a r.l.^ |
Luxembourg | 95 | 95 | |||||||
| Broadcom Asia Distribution Pte. Ltd.^ |
Singapore | 95 | 95 | |||||||
| Broadcom Bermuda LP^ |
Bermuda | 95 | 95 | |||||||
| Broadcom Cayman Finance Limited^ |
Cayman Islands | 95 | 95 | |||||||
| Broadcom Cayman L.P.† |
Cayman Islands | 95 | 95 | |||||||
| Broadcom Cayman Limited^ |
Cayman Islands | 95 | 95 | |||||||
| Broadcom Communications Bermuda Limited^ |
Bermuda | 95 | 95 | |||||||
| Broadcom Communications Netherlands B.V.^ |
Netherlands | 95 | 95 | |||||||
| Broadcom Corporation^ |
California (U.S.A.) | 95 | 95 | |||||||
| Broadcom Distribution Unlimited Company^ |
Ireland | 95 | 95 | |||||||
| Broadcom International Limited^ |
Cayman Islands | 95 | 95 | |||||||
| Broadcom International LLC^ |
Delaware (U.S.A.) | 95 | 95 | |||||||
| Broadcom International Pte. Ltd.^ |
Singapore | 95 | 95 | |||||||
| Broadcom Europe Limited^ |
England | 95 | 95 | |||||||
| Broadcom Netherlands B.V.^ |
Netherlands | 95 | 95 | |||||||
| Broadcom Products Unlimited Company^ |
Ireland | 95 | 95 | |||||||
| Broadcom Singapore Pte Ltd.^ |
Singapore | 95 | 95 | |||||||
| Broadcom Technologies Bermuda Unlimited^ |
Bermuda | 95 | 95 | |||||||
| Broadcom UK Ltd.^ |
Delaware (U.S.A.) | 95 | 95 | |||||||
| CMK LLC^ |
Delaware (U.S.A.) | 95 | 95 | |||||||
A-118
Table of Contents
BROADCOM LIMITED AND ITS SUBSIDIARIES
NOTES TO THE FINANCIAL STATEMENTS
For the financial year ended 29 October 2017
| 35. | Listing of significant subsidiaries in the Group (continued) |
| Equity holding | ||||||||||
| 2017 | 2016 | |||||||||
| Name of companies |
Country of incorporation | % | % | |||||||
| Cyoptics, Inc.^ |
Delaware (U.S.A.) | 95 | 95 | |||||||
| Emulex Corporation^ |
California (U.S.A.) | 95 | 95 | |||||||
| Global Locate, Inc.^ |
Delaware (U.S.A.) | 95 | 95 | |||||||
| LSI Corporation^ |
Delaware (U.S.A.) | 95 | 95 | |||||||
| LSI Logic HK Holdings^ |
Cayman Islands | 95 | 95 | |||||||
| LSI Storage Ireland Limited^ |
Ireland | 95 | 95 | |||||||
| LSI Technology (Singapore) Pte. Ltd.^ |
Singapore | 95 | 95 | |||||||
| Netlogic I LLC^ |
Delaware (U.S.A.) | 95 | 95 | |||||||
| O.C. Property Company, LLC^ |
Delaware (U.S.A.) | 95 | 95 | |||||||
| Serverworks Corporation^ |
Delaware (U.S.A.) | 95 | 95 | |||||||
| ServerWorks International Ltd.^ |
Cayman Islands | 95 | 95 | |||||||
| Teknovus, Inc.^ |
California (U.S.A.) | 95 | 95 | |||||||
| Silicon Manufacturing Partners Pte Ltd.* |
Singapore | 49 | 49 | |||||||
| † | This subsidiary is the only subsidiary of Broadcom Limited that is not a subsidiary of Broadcom Cayman L.P. |
| * | 51% LSI Technology (Singapore) Pte. Ltd.; 49% GlobalFoundries |
| ^ | These subsidiaries are 100% owned subsidiaries of Broadcom Cayman L.P. Effective equity holding in these subsidiaries held by the Group is 95% due to 5% equity holding in Broadcom Cayman L.P. held by other non-controlling interests. |
| 36. | Reconciliation to FRS |
As part of the Company’s listing requirement on the NASDAQ Global Select Market, the consolidated financial statements of Broadcom Limited for financial year 2017 were prepared in conformity with previous GAAP for the purpose of filing with the SEC. An Annual Report on Form 10-K containing the consolidated financial statements of Broadcom Limited for financial year 2017 was filed with the SEC on 21 December 2017. There are differences in certain aspects between the consolidated financial statements filed with the SEC and those consolidated financial statements prepared in accordance with FRS. The following disclosures shows the reconciliation to FRS for the Group’s consolidated balance sheet and total comprehensive income that were prepared under previous GAAP.
A-119
Table of Contents
BROADCOM LIMITED AND ITS SUBSIDIARIES
NOTES TO THE FINANCIAL STATEMENTS
For the financial year ended 29 October 2017
| 36. | Reconciliation to FRS (continued) |
| (a) | Reconciliation of the Group’s consolidated balance sheet reported in accordance with the previous GAAP to FRS |
| Explanatory Note |
29 October 2017 reported under previous GAAP |
Reconciliation to FRS |
29 October 2017 reported under FRS |
|||||||||||||
| (US$ millions) | (US$ millions) | (US$ millions) | ||||||||||||||
| ASSETS |
||||||||||||||||
| Current assets |
||||||||||||||||
| Cash and cash equivalents |
11,204 | - | 11,204 | |||||||||||||
| Trade receivables, net |
2,448 | - | 2,448 | |||||||||||||
| Inventories |
1,447 | - | 1,447 | |||||||||||||
| Other current assets |
A1 | 724 | (13) | 711 | ||||||||||||
| 15,823 | (13) | 15,810 | ||||||||||||||
| Assets of disposal group |
A1 | - | 13 | 13 | ||||||||||||
| 15,823 | - | 15,823 | ||||||||||||||
| Non-current assets |
||||||||||||||||
| Property, plant and |
2,599 | - | 2,599 | |||||||||||||
| Goodwill |
24,706 | - | 24,706 | |||||||||||||
| Intangible assets, net |
10,832 | - | 10,832 | |||||||||||||
| Other long-term assets |
A2 | 458 | (21) | 437 | ||||||||||||
| Deferred income tax assets |
A2 | - | 21 | 21 | ||||||||||||
| 38,595 | - | 38,595 | ||||||||||||||
| Total assets |
54,418 | - | 54,418 | |||||||||||||
| LIABILITIES |
||||||||||||||||
| Current liabilities |
||||||||||||||||
| Trade payables |
1,105 | - | 1,105 | |||||||||||||
| Current income tax liabilities |
A2 | - | 981 | 981 | ||||||||||||
| Borrowings – Current portion |
117 | - | 117 | |||||||||||||
| Employee compensation and |
626 | - | 626 | |||||||||||||
| Other current liabilities and |
A2 | 681 | (102) | 579 | ||||||||||||
| 2,529 | 879 | 3,408 | ||||||||||||||
A-120
Table of Contents
BROADCOM LIMITED AND ITS SUBSIDIARIES
NOTES TO THE FINANCIAL STATEMENTS
For the financial year ended 29 October 2017
| 36. | Reconciliation to FRS (continued) |
| (a) | Reconciliation of the Group’s consolidated balance sheet reported in accordance with the previous GAAP to FRS (continued) |
| Explanatory Note |
29 October 2017 reported under previous GAAP |
Reconciliation to FRS |
29 October 2017 reported under FRS |
|||||||||||||
| (US$ millions) | (US$ millions) | (US$ millions) | ||||||||||||||
| Non-current liabilities |
||||||||||||||||
| Borrowings – Long-term debt |
17,431 | - | 17,431 | |||||||||||||
| Deferred income tax liabilities |
A2 | - | 10,019 | 10,019 | ||||||||||||
| Pension and post-retirement |
A4 | 112 | 17 | 129 | ||||||||||||
| Other long-term liabilities |
A2 | 11,160 | (10,898) | 262 | ||||||||||||
| 28,703 | (862) | 27,841 | ||||||||||||||
| Total liabilities |
31,232 | 17 | 31,249 | |||||||||||||
| NET ASSETS |
23,186 | (17) | 23,169 | |||||||||||||
| EQUITY |
||||||||||||||||
| Capital and reserves |
||||||||||||||||
| Share capital |
A3 | 20,505 | (1,700) | 18,805 | ||||||||||||
| Other reserves |
A3, A4 | - | 1,594 | 1,594 | ||||||||||||
| Accumulated deficit |
A4 | (129) | (2) | (131) | ||||||||||||
| Accumulated other |
A3 | (91) | 91 | - | ||||||||||||
| 20,285 | (17) | 20,268 | ||||||||||||||
| Non-controlling interests |
2,901 | - | 2,901 | |||||||||||||
| Total equity |
23,186 | (17) | 23,169 | |||||||||||||
| A1 | Presentation of assets of disposal group classified as held for sale |
| The Group has changed the presentation of certain amounts under “Other current assets” in the balance sheet to meet the presentation requirements under FRS 1 and FRS 105. Under FRS 1, the balance sheet shall present “Assets of disposal group classified as held-for-sale”, which was not presented on the balance sheet under the previous GAAP. |
| US$13 million of “Other current assets” under the previous GAAP are reclassified to be presented as “Assets of disposal group classified as held-for-sale” in the balance sheet presented as at 29 October 2017. |
A-121
Table of Contents
BROADCOM LIMITED AND ITS SUBSIDIARIES
NOTES TO THE FINANCIAL STATEMENTS
For the financial year ended 29 October 2017
| 36. | Reconciliation to FRS (continued) |
| (a) | Reconciliation of the Group’s consolidated balance sheet reported in accordance with the previous GAAP to FRS (continued) |
| A2 | Presentation of deferred income tax assets, current income tax liabilities and deferred income tax liabilities |
| The Group has changed the presentation of certain amounts under “Other current liabilities”, “Other long-term assets” and “Other long-term liabilities” in the balance sheet to meet the presentation requirements under FRS 1 and FRS 12. Under FRS 1, the balance sheet shall present “Deferred income tax assets”, “Current income tax liabilities” and “Deferred income tax liabilities”, which were not required to be presented on the balance sheet under the previous GAAP. |
| (i) | US$21 million of “Other long-term assets” under the previous GAAP are reclassified to be presented as “Deferred income tax assets” in the balance sheet presented as at 29 October 2017. |
| (ii) | US$102 million of “Other current liabilities” and US$879 million of “Other long-term liabilities” under the previous GAAP are reclassified to be presented as “Current income tax liabilities” in the balance sheet presented as at 29 October 2017. |
| The reclassification of “Other long-term liabilities” to “Current income tax liabilities” as described above pertains to uncertain tax positions that are not expected to be settled within 12 months of the reporting date. Under the previous GAAP, such balances are classified as non-current while under FRS, these balances are presented as current as they pertains to the Group’s probable current tax exposure. |
| (iii) | US$10,019 million of “Other long-term liabilities” under the previous GAAP are reclassified to be presented as “Deferred income tax liabilities” in the balance sheet presented as at 29 October 2017. |
| A3 | Classification of other reserves |
The Group has changed the presentation of certain amounts under “Share Capital” to reflect FRS 1 requirement to disclose the ordinary class of share capital and other reserves in equity which is described in detail in Note 32.
US$1,700 million of “Share Capital” under the previous GAAP are reclassified to be presented as “Other reserves” in the balance sheet presented as at 29 October 2017.
US$91 million of “Accumulated other comprehensive loss” under the previous GAAP are reclassified to be presented as “Other reserves” in the balance sheet presented as at 29 October 2017.
A-122
Table of Contents
BROADCOM LIMITED AND ITS SUBSIDIARIES
NOTES TO THE FINANCIAL STATEMENTS
For the financial year ended 29 October 2017
| 36. | Reconciliation to FRS (continued) |
| (a) | Reconciliation of the Group’s consolidated balance sheet reported in accordance with the previous GAAP to FRS (continued) |
| A4 | Presentation of and recognition of net pension liabilities |
The Post-Employment Benefit plan consists of the US Group Life plan and the Avago Retiree Medical plan. The US Group Life plan is funded by the Agere Systems Inc. Post-retirement Life Insurance Benefit Trust. As the United States’ Internal Revenue Service’s rules effectively prohibit a reversion of any excess assets in the Trust back to the Company, adjustments are made to the respective balances relating to the Group Life plan to recognise an irrevocable surplus under FRS 19. FRS 19 limits the amount of net pension liabilities that can be recognised on the balance sheet whereas the previous GAAP does not have such limitations. The effect of this adjustment on the pension and post-retirement benefit obligations is US$2 million in the consolidated balance sheet presented as at 29 October 2017 and US$2 million on selling, general and administrative expenses in the statement of comprehensive income for the financial year ended 29 October 2017. The cumulative effect of this adjustment on the equity of the Group amounted to US$17 million as at 29 October 2017.
| (b) | Reconciliation of the Group’s consolidated statement of comprehensive income reported in accordance with the previous GAAP to FRS |
| Explanatory |
2017 reported under previous GAAP |
Reconciliation to FRS |
2017 reported under FRS |
|||||||||||
| (US$ millions) | (US$ millions) | (US$ millions) | ||||||||||||
| Sales |
17,636 | - | 17,636 | |||||||||||
| Cost of sales |
B, B1 | (6,593) | (2,534) | (9,127) | ||||||||||
| Purchase accounting effect on inventory |
B, B1 | (4) | 4 | - | ||||||||||
| Amortisation of acquisition-related intangible assets |
B, B1 | (2,511) | 2,511 | - | ||||||||||
| Restructuring charges |
B, B1 | (19) | 19 | - | ||||||||||
|
|
|
|||||||||||||
| Gross margin |
8,509 | - | 8,509 | |||||||||||
A-123
Table of Contents
BROADCOM LIMITED AND ITS SUBSIDIARIES
NOTES TO THE FINANCIAL STATEMENTS
For the financial year ended 29 October 2017
| 36. | Reconciliation to FRS (continued) |
| (b) | Reconciliation of the Group’s consolidated statement of comprehensive income reported in accordance with the previous GAAP to FRS (continued) |
| Explanatory |
2017 reported under previous GAAP |
Reconciliation to FRS |
2017 reported under FRS |
|||||||||||
| (US$ millions) | (US$ millions) | (US$ millions) | ||||||||||||
| Other income, net |
62 | - | 62 | |||||||||||
| - Research and development |
(3,292) | - | (3,292) | |||||||||||
| - Selling, general and administrative |
A4 | (787) | (2) | (789) | ||||||||||
| - Amortisation of acquisition-related intangible assets |
B, B2 | (1,764) | 1,764 | - | ||||||||||
| - Restructuring, impairment and disposal charges |
B, B2 | (161) | 161 | - | ||||||||||
| - Litigation settlements |
B, B2 | (122) | 122 | |||||||||||
| - Other expenses |
B, B2 | - | (2,047) | (2,047) | ||||||||||
|
|
|
|||||||||||||
| Operating profit |
2,445 | (2) | 2,443 | |||||||||||
| Interest expense |
B, B3 | (454) | 454 | - | ||||||||||
| Loss on extinguishment of debt |
B, B3 | (166) | 166 | - | ||||||||||
| Finance costs |
B, B3 | - | (620) | (620) | ||||||||||
|
|
|
|||||||||||||
| Profit before income taxes |
1,825 | (2) | 1,823 | |||||||||||
| Income tax expense |
(35) | - | (35) | |||||||||||
|
|
|
|||||||||||||
| Profit from continuing operations |
1,790 | (2) | 1,788 | |||||||||||
| Loss from discontinued operations |
(6) | - | (6) | |||||||||||
|
|
|
|||||||||||||
| Total profit |
1,784 | (2) | 1,782 | |||||||||||
|
|
|
|||||||||||||
A-124
Table of Contents
BROADCOM LIMITED AND ITS SUBSIDIARIES
NOTES TO THE FINANCIAL STATEMENTS
For the financial year ended 29 October 2017
| 36. | Reconciliation to FRS (continued) |
| (b) | Reconciliation of the Group’s consolidated statement of comprehensive income reported in accordance with the previous GAAP to FRS (continued) |
| Explanatory Note |
2017 reported under previous GAAP |
Reconciliation to FRS |
2017 reported under FRS |
|||||||||||||
| (US$ millions) | (US$ millions) | (US$ millions) | ||||||||||||||
| Other comprehensive income: |
||||||||||||||||
| Items that may be reclassified subsequently to profit or loss: |
||||||||||||||||
| Unrealised profit on defined benefit pension plans and post-retirement benefit plans |
42 | - | 42 | |||||||||||||
| Reclassification of net income |
1 | - | 1 | |||||||||||||
| Other comprehensive profit, net of tax |
43 | - | 43 | |||||||||||||
| Total comprehensive profit |
1,827 | (2) | 1,825 | |||||||||||||
| Profit attributable to: |
||||||||||||||||
| Equity holders of the Company |
1,692 | (2) | 1,690 | |||||||||||||
| Non-controlling interests |
92 | - | 92 | |||||||||||||
| 1,784 | (2) | 1,782 | ||||||||||||||
| Total comprehensive profit attributable to: |
||||||||||||||||
| Equity holders of the Company |
1,735 | (2) | 1,733 | |||||||||||||
| Non-controlling interests |
92 | - | 92 | |||||||||||||
| 1,827 | (2) | 1,825 | ||||||||||||||
A-125
Table of Contents
BROADCOM LIMITED AND ITS SUBSIDIARIES
NOTES TO THE FINANCIAL STATEMENTS
For the financial year ended 29 October 2017
| 36. | Reconciliation to FRS (continued) |
| (b) | Reconciliation of the Group’s consolidated statement of comprehensive income reported in accordance with the previous GAAP to FRS (continued) |
| B | Presentation of Expenses |
Under the previous GAAP, expenses are presented in a multiple-step format. Under FRS, the Group has reclassified expenses into their functional groups. Expenses based on nature are disclosed in Note 5 of this FRS financial statements. The following explanatory notes reconcile the difference between expenses reported under FRS to those reported under the previous GAAP.
| B1 | Classification of Cost of sales |
Cost of sales amounting to US$9,127 million for the financial year ended 29 October 2017 under FRS represents the aggregated line items under the previous GAAP of “Cost of products sold”, ‘Purchase accounting effect on inventory”, “Amortisation of acquisition-related intangible assets” and “Restructuring charges” in their respective financial years.
| B2 | Classification of Other expenses |
Other expenses amounting to US$2,047 million for the financial year ended 29 October 2017 under FRS represent the aggregated line items under the previous GAAP of “Amortisation of acquisition-related intangible assets”, “Restructuring, impairment and disposal charges” and “Litigation settlements” in their respective financial years.
| B3 | Classification of Finance costs |
Finance costs amounting to US$620 million for the financial year ended 29 October 2017 under FRS represent the aggregated line items under the previous GAAP of “Interest expense” and “Loss on extinguishment of debt” in their respective financial years.
| 37. | Authorisation of financial statements |
These financial statements were authorised for issue in accordance with a resolution of the Board of Directors of Broadcom Limited on 9 February 2018.
A-126
Table of Contents
DIRECTIONS TO BROADCOM LIMITED
2018 ANNUAL GENERAL MEETING
Our offices located at
1320 Ridder Park Drive, San Jose, California
Coming North on US-880:
| 1. | Take Brokaw Road exit and turn right onto Brokaw Road and move into the left lane. |
| 2. | Turn left onto Ridder Park Drive. |
| 3. | Turn into the Broadcom campus, which is the second building on the right, at the main entrance sign. |
Coming South on US-101:
| 1. | Exit onto US-880 North. |
| 2. | Take Brokaw Road exit and turn right onto Brokaw Road and move into the left lane. |
| 3. | Turn left onto Ridder Park Drive. |
| 4. | Turn into the Broadcom campus, which is the second building on the right, at the main entrance sign. |
Coming South on I-880:
| 1. | Take Brokaw Road exit and turn right onto Brokaw Road and move into the left lane. |
| 2. | Turn left onto Ridder Park Drive. |
| 3. | Turn into the Broadcom campus, which is the second building on the right, at the main entrance sign. |

B-1
Table of Contents
| Using a black ink pen, mark your votes with an X as shown in this example. Please do not write outside the designated areas. |
☒ |
Annual Meeting Proxy Card
PLEASE FOLD ALONG THE PERFORATION, DETACH AND RETURN THE BOTTOM PORTION IN THE ENCLOSED ENVELOPE.
[REVERSE SIDE]
The board of directors of Broadcom Limited unanimously recommends a vote “FOR” each of the director nominees (Proposal Nos. 1(a) through 1(j)) and “FOR” Proposals No. 2, 3 and 4.
| 1. | Election of Directors: | For | Against | Abstain | For | Against | Abstain | |||||||||||||
| (a) | Mr. Hock E. Tan | ☐ | ☐ | ☐ | 4. | NON-BINDING, ADVISORY VOTE To approve the compensation of Broadcom’s named executive officers, as disclosed in “Compensation Discussion and Analysis” and in the compensation tables and accompanying narrative disclosure under “Executive Compensation” in Broadcom’s proxy statement relating to its 2018 Annual General Meeting. |
☐ | ☐ | ☐ | |||||||||||
| (b) | Mr. James V. Diller | ☐ | ☐ | ☐ | ||||||||||||||||
| (c) | Ms. Gayla J. Delly | ☐ | ☐ | ☐ | ||||||||||||||||
| (d) | Mr. Lewis C. Eggebrecht | ☐ | ☐ | ☐ | ||||||||||||||||
| (e) | Mr. Kenneth Y. Hao | ☐ | ☐ | ☐ | ||||||||||||||||
| (f) | Mr. Eddy W. Hartenstein | ☐ | ☐ | ☐ | ||||||||||||||||
| (g) | Mr. Check Kian Low | ☐ | ☐ | ☐ | ||||||||||||||||
| (h) | Mr. Donald Macleod | ☐ | ☐ | ☐ | ||||||||||||||||
| (i) | Mr. Peter J. Marks | ☐ | ☐ | ☐ | ||||||||||||||||
| (j) | Dr. Henry Samueli | ☐ | ☐ | ☐ | ||||||||||||||||
| For | Against | Abstain | ||||||||||||||||||
| 2. | To approve the re-appointment of PricewaterhouseCoopers LLP as Broadcom’s independent registered public accounting firm and independent Singapore auditor for the fiscal year ending November 4, 2018 and to authorize the Audit Committee to fix its remuneration, as set forth in Broadcom’s notice of, and proxy statement relating to, its 2018 Annual General Meeting. | ☐ | ☐ | ☐ | In their discretion, the Proxies, and each of them acting alone, are authorized to vote on such other business as may properly come before the meeting and any adjournment or postponement of the meeting. | |||||||||||||||
| For | Against | Abstain | Meeting Attendance | Yes | No | |||||||||||||||
| 3. | To approve the general authorization for the directors of Broadcom to allot and issue shares in its capital, as set forth in Broadcom’s notice of, and proxy statement relating to, its 2018 Annual General Meeting. | ☐ | ☐ | ☐ |
Please indicate if you plan to attend the meeting |
☐ | ☐ | |||||||||||||
Important Notice Regarding the Internet Availability of Proxy Materials for the 2018 Annual General Meeting of Shareholders:
The notice, proxy statement and annual report to shareholders are available at http://investors.broadcom.com/phoenix.zhtml?c=203541&p=proxy.
If you would like to reduce the costs incurred by Broadcom in mailing proxy materials, you can consent to receiving all future proxy statements, proxy cards and annual reports electronically via email or the Internet. To sign up for electronic delivery, please contact Broadcom’s transfer agent, Computershare Investor Services at 1-877-373-6374 within the U.S., U.S. Territories and Canada, or at +1-781-575-3100 outside the U.S., U.S. Territories and Canada.
PLEASE FOLD ALONG THE PERFORATION, DETACH AND RETURN THE BOTTOM PORTION IN THE
ENCLOSED ENVELOPE.
Table of Contents
BROADCOM LIMITED
(Incorporated in the Republic of Singapore)
(Company Registration Number 201505572G)
THIS PROXY IS SOLICITED ON BEHALF OF THE BOARD OF DIRECTORS
The undersigned, being a member of Broadcom Limited (“Broadcom”), hereby appoints Hock E. Tan, Thomas H. Krause, Jr. and Mark D. Brazeal, or each of them acting alone, with full powers of substitution, as proxies (the “Proxies”) of the undersigned and hereby authorizes the Proxies to represent and to vote, as designated on the reverse side, all of the ordinary shares or Special Voting Shares of Broadcom owned by the undersigned entitled to vote at the 2018 Annual General Meeting of Shareholders of Broadcom to be held at 11:00 a.m. Pacific Time on April 4, 2018, at 1320 Ridder Park Drive, San Jose, California 95131, U.S.A., and at any adjournment or postponement thereof.
This Proxy Card, when properly executed and returned in a timely manner, will be voted at the 2018 Annual General Meeting of Shareholders and any adjournment or postponement thereof in the manner described herein. If no contrary indication is made, this Proxy Card will be voted “FOR” each of the Board nominees (Proposal Nos. 1(a) through 1(j)) and “FOR” Proposals No. 2, 3 and 4, and in accordance with the judgment of the persons named as Proxies herein on any other matters that may properly be put before the 2018 Annual General Meeting of Shareholders.
The undersigned hereby acknowledges receipt of the Notice of the 2018 Annual General Meeting of Shareholders and the accompanying proxy statement.
WHETHER OR NOT YOU EXPECT TO ATTEND THE MEETING, PLEASE COMPLETE, DATE AND SIGN THIS PROXY CARD AND RETURN IT IN THE ENCLOSED ENVELOPE, TO ARRIVE NO LATER THAN 9:00AM PACIFIC TIME ON APRIL 2, 2018.
This Proxy Card must be signed exactly as your name appears hereon. If more than one name appears, all persons so designated should sign. Attorneys, executors, administrators, trustees and guardians should indicate their capacities. If the signatory is a corporation, please print full corporate name and indicate capacity of duly authorized officer executing on behalf of the corporation. If the signatory is a partnership, please print full partnership name and indicate capacity of duly authorized person executing on behalf of the partnership.
| Date (mm/dd/yyyy) — Please print date below. | Signature 1 — Please keep signature within the box. | Signature 2 — Please keep signature within the box. | ||
| / / |
THIS PROXY CARD IS VALID ONLY WHEN SIGNED