Form 8-K PENNYMAC FINANCIAL SERVI For: Feb 08
UNITED STATES
SECURITIES AND EXCHANGE COMMISSION
Washington, D.C. 20549
FORM 8‑K
CURRENT REPORT
Pursuant to Section 13 or 15(d) of the Securities Exchange Act of 1934
Date of Report (Date of earliest event reported): February 8, 2018
PennyMac Financial Services, Inc.
(Exact name of registrant as specified in its charter)
|
Delaware |
001‑35916 |
80‑0882793 |
|
(State or other jurisdiction |
(Commission |
(IRS Employer |
|
of incorporation) |
File Number) |
Identification No.) |
|
3043 Townsgate Road, Westlake Village, California |
91361 |
|
(Address of principal executive offices) |
(Zip Code) |
(818) 224‑7442
(Registrant’s telephone number, including area code)
Not Applicable
(Former name or former address, if changed since last report)
Check the appropriate box below if the Form 8‑K filing is intended to simultaneously satisfy the filing obligation of the registrant under any of the following provisions:
☐ Written communications pursuant to Rule 425 under the Securities Act (17 CFR 230.425)
☐ Soliciting material pursuant to Rule 14a‑12 under the Exchange Act (17 CFR 240.14a‑12)
☐ Pre-commencement communications pursuant to Rule 14d‑2(b) under the Exchange Act (17 CFR 240.14d‑2(b))
☐ Pre-commencement communications pursuant to Rule 13e‑4(c) under the Exchange Act (17 CFR 240.13e‑4(c))
Indicate by check mark whether the registrant is an emerging growth company as defined in Rule 405 of the Securities Act of 1933 (§230.405 of this chapter) or Rule 12b‑2 of the Securities Exchange Act of 1934 (§240.12b‑2 of this chapter).
Emerging growth company ☐
If an emerging growth company, indicate by check mark if the registrant has elected not to use the extended transition period for complying with any new or revised financial accounting standards provided pursuant to Section 13(a) of the Exchange Act. ☐
Item 2.02 Results of Operations and Financial Condition.
On February 8, 2018, PennyMac Financial Services, Inc. (the “Company”) issued a press release announcing its financial results for the fiscal quarter and year ended December 31, 2017. A copy of the press release and the slide presentation used in connection with the Company’s recorded presentation of financial results were made available on February 8, 2018 and are furnished as Exhibit 99.1 and Exhibit 99.2, respectively.
The information in Item 2.02 of this report, including the exhibits hereto, shall not be deemed “filed” for purposes of Section 18 of the Securities Exchange Act of 1934, or otherwise subject to the liabilities of Section 18, nor shall it be deemed incorporated by reference into any disclosure document relating to the Company, except to the extent, if any, expressly set forth by specific reference in such filing.
Item 9.01 Financial Statements and Exhibits.
(d) Exhibits.
|
Exhibit No. |
|
Description |
|
|
|
|
|
99.1 |
|
Press Release, dated February 8, 2018, issued by PennyMac Financial Services, Inc. pertaining to its financial results for the fiscal quarter and year ended December 31, 2017. |
|
|
|
|
|
99.2 |
|
Slide Presentation for use beginning on February 8, 2018 in connection with a recorded presentation of financial results for the fiscal quarter and year ended December 31, 2017. |
EXHIBIT INDEX
|
Exhibit No. |
|
Description |
|
|
|
|
|
99.1 |
|
|
|
|
|
|
|
99.2 |
|
SIGNATURE
Pursuant to the requirements of the Securities Exchange Act of 1934, the registrant has duly caused this report to be signed on its behalf by the undersigned hereunto duly authorized.
|
|
|
PENNYMAC FINANCIAL SERVICES, INC. |
|
|
|
|
|
|
|
|
|
|
|
|
|
Dated: February 9, 2018 |
|
/s/ Andrew S. Chang |
|
|
|
Andrew S. Chang |
|
|
|
Senior Managing Director and Chief Financial Officer |
Exhibit 99.1

|
|
Media |
Investors |
|
|
Stephen Hagey |
Christopher Oltmann |
|
|
(805) 530‑5817 |
(818) 264‑4907 |
PennyMac Financial Services, Inc. Reports
Fourth Quarter and Full-Year 2017 Results
Westlake Village, CA, February 8, 2018 – PennyMac Financial Services, Inc. (NYSE: PFSI) today reported net income of $123.9 million for the fourth quarter of 2017, on revenue of $298.6 million. Net income attributable to PFSI common stockholders was $62.3 million, or $2.44 per diluted share. Book value per share increased to $19.95, from $17.20 at September 30, 2017.
Fourth Quarter 2017 Highlights
|
· |
Pretax income was $121.8 million; includes $32.0 million benefit related to remeasurement of tax-related items as a result of the newly enacted federal tax law |
|
o |
Diluted earnings per share of $2.44 includes a benefit of $1.79 from the remeasurement of tax-related items |
|
o |
Fourth quarter results reflect strong earnings contributions from both the production and servicing segments |
|
· |
Production segment pretax income was $55.3 million, down 20 percent from the prior quarter and down 41 percent from the fourth quarter of 2016 |
|
o |
Total loan production activity of $17.0 billion in unpaid principal balance (UPB), down 10 percent from the prior quarter and 23 percent from the fourth quarter of 2016 |
|
o |
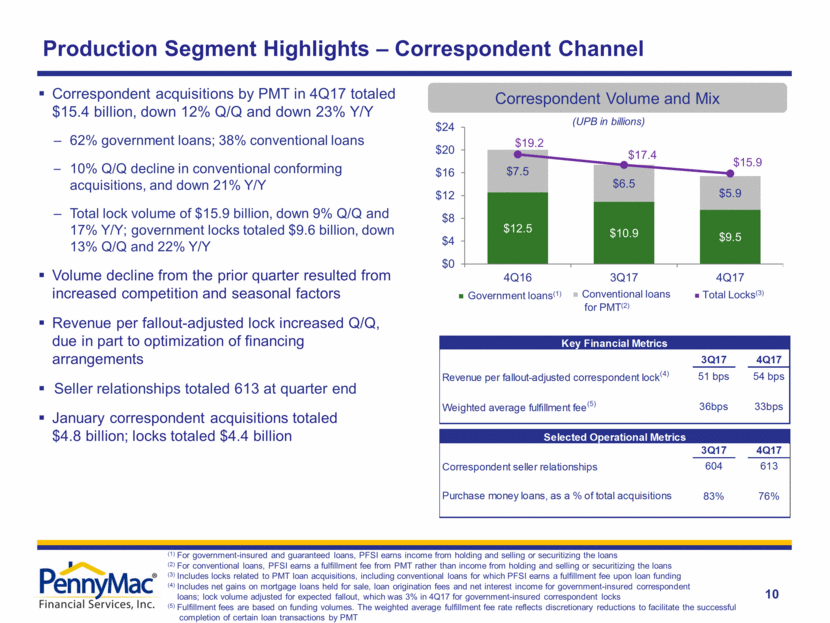
$15.4 billion in UPB of correspondent production, down 12 percent from the prior quarter and 23 percent from the fourth quarter of 2016 |
|
o |
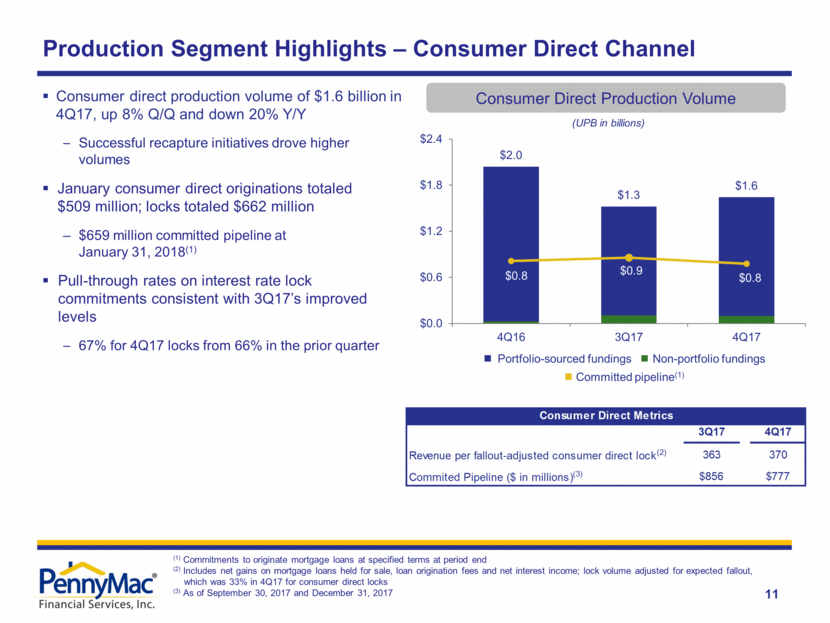
$1.6 billion in UPB of consumer direct originations, up 8 percent from the prior quarter and down 20 percent from the fourth quarter of 2016 |
|
o |
Interest rate lock commitments (IRLCs) on correspondent government and consumer direct loans totaled $11.8 billion, down 11 percent from the prior quarter and 20 percent from the fourth quarter of 2016 |
|
· |
Servicing segment pretax income was $32.0 million, up 31 percent from the prior quarter and down 9 percent from the fourth quarter of 2016 |
|
o |
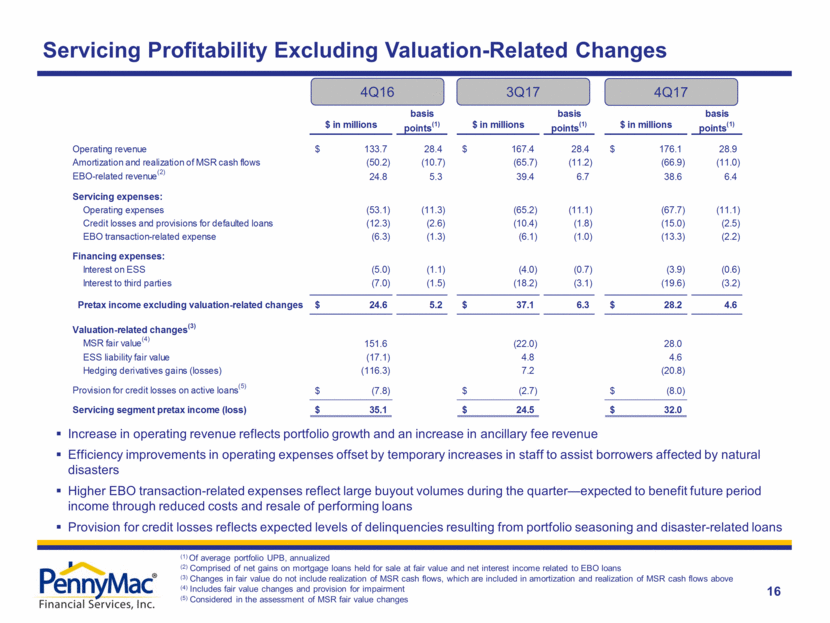
Servicing segment pretax income excluding valuation-related changes was $28.2 million, down 24 percent from the prior quarter and up 15 percent from the fourth quarter of 20161 |
|
o |
Servicing portfolio grew to $245.8 billion in UPB, up 3 percent from September 30, 2017, and 27 percent from December 31, 2016 |
|
o |
Entered into an agreement to acquire a bulk portfolio of Ginnie Mae and conventional conforming mortgage servicing rights (MSRs) with a UPB of approximately $3.6 billion2 |
|
· |
Investment Management segment pretax income was $1.5 million, up from $0.7 million in the prior quarter and $0.4 million in the fourth quarter of 2016 |
|
o |
Net assets under management were $1.6 billion, down 4 percent from September 30, 2017 and up 2 percent from December 31, 2016 |
Full-Year 2017 Highlights
|
· |
Pretax income was $335.9 million; includes $32.0 million benefit related to remeasurement of tax-related items |
|
o |
Diluted earnings per share of $4.03 includes a benefit of $1.83 resulting from the remeasurement of tax-related items |
|
· |
Total net revenue of $955.5 million, up 3 percent from the prior year |
|
· |
Loan production totaled $68.5 billion in UPB, a decrease of 2 percent from record levels in the prior year |
|
· |
Servicing portfolio reached $245.8 billion in UPB, up 27 percent from December 31, 2016 |
“PennyMac Financial closed out the year with a very strong fourth quarter, with growth in book value per share to nearly $20. Earnings were excellent and further benefited from the remeasurement of tax-related items,” said President and CEO David Spector. “Our production and servicing segments delivered solid earnings. Servicing is contributing an increasingly meaningful portion of earnings, and we expect this segment to continue performing well as our portfolio grows and interest rates rise. In correspondent production, we continued to generate strong results through our market-leading franchise.”
1 Excludes changes in the fair value of MSRs, the ESS liability, and gains/(losses) on hedging derivatives which were $28.0 million, $4.6 million, and $(20.8) million, respectively, and a provision for credit losses on active loans of $(8.8) million in the fourth quarter of 2017.
2 This transaction is subject to continuing due diligence and customary closing conditions. There can be no assurance regarding the size of the transaction or that the transaction will be completed at all.
2
The following table presents the contribution of PennyMac Financial’s Production, Servicing and Investment Management segments to pretax income:
|
|
|
Mortgage Banking |
|
Investment |
|
|
|||||||||
|
|
|
Production |
|
Servicing |
|
Total |
|
Management |
|
Total |
|||||
|
|
|
(in thousands) |
|||||||||||||
|
Revenue |
|
|
|
|
|
|
|
|
|
|
|||||
|
Net gains on mortgage loans held for sale at fair value |
|
$ |
68,716 |
|
$ |
29,905 |
|
$ |
98,621 |
|
$ |
— |
|
$ |
98,621 |
|
Loan origination fees |
|
|
30,267 |
|
|
— |
|
|
30,267 |
|
|
— |
|
|
30,267 |
|
Fulfillment fees from PMT |
|
|
19,175 |
|
|
— |
|
|
19,175 |
|
|
— |
|
|
19,175 |
|
Net servicing fees |
|
|
— |
|
|
106,902 |
|
|
106,902 |
|
|
— |
|
|
106,902 |
|
Management fees |
|
|
— |
|
|
— |
|
|
— |
|
|
5,988 |
|
|
5,988 |
|
Carried Interest from Investment Funds |
|
|
— |
|
|
— |
|
|
— |
|
|
5 |
|
|
5 |
|
Net interest income (expense): |
|
|
— |
|
|
— |
|
|
|
|
|
|
|
|
|
|
Interest income |
|
|
15,329 |
|
|
24,576 |
|
|
39,905 |
|
|
— |
|
|
39,905 |
|
Interest expense |
|
|
2,852 |
|
|
32,813 |
|
|
35,665 |
|
|
12 |
|
|
35,677 |
|
|
|
|
12,477 |
|
|
(8,237) |
|
|
4,240 |
|
|
(12) |
|
|
4,228 |
|
Other |
|
|
291 |
|
|
268 |
|
|
559 |
|
|
(51) |
|
|
508 |
|
Total net revenue |
|
|
130,926 |
|
|
128,838 |
|
|
259,764 |
|
|
5,930 |
|
|
265,694 |
|
Expenses |
|
|
75,586 |
|
|
96,840 |
|
|
172,426 |
|
|
4,435 |
|
|
176,861 |
|
Income before provision for income taxes and non-segment activities |
|
|
55,340 |
|
|
31,998 |
|
|
87,338 |
|
|
1,495 |
|
|
88,833 |
|
Non-segment activities(1) |
|
|
|
|
|
|
|
|
|
|
|
|
|
|
32,940 |
|
Pretax income |
|
$ |
55,340 |
|
$ |
31,998 |
|
$ |
87,338 |
|
$ |
1,495 |
|
$ |
121,773 |
|
(1) |
Includes repricing of Payable to exchanged Private National Mortgage Acceptance Company, LLC unitholders under a tax receivable agreement |
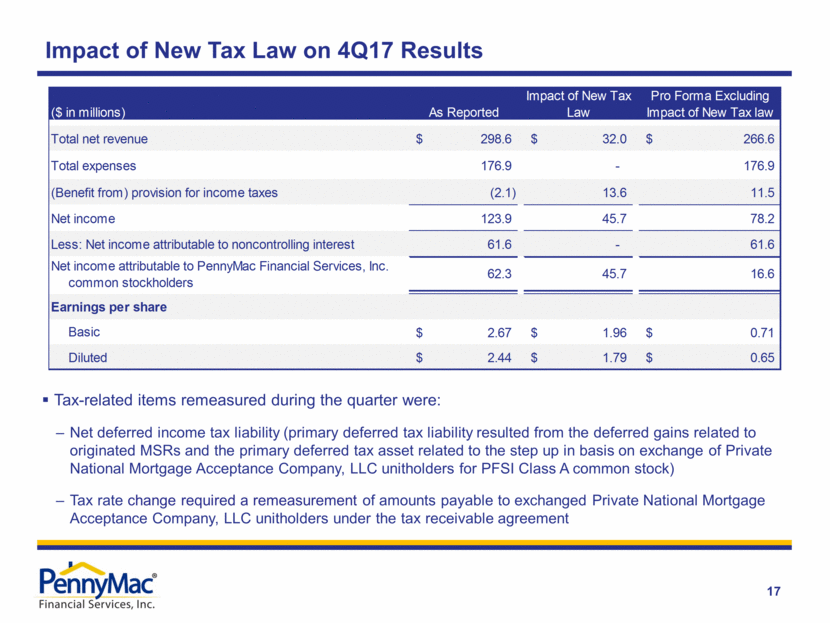
The new federal tax law resulted in the remeasurement of tax-related items during the fourth quarter, primarily a deferred tax liability that results from deferred gains related to originated MSRs and a deferred tax asset that relates to the step up in basis on exchange of Private National Mortgage Acceptance Company, LLC unitholders for PFSI Class A common stock. In addition, the tax rate change required a remeasurement of amounts payable to exchanged Private National Mortgage Acceptance Company, LLC unitholders under the tax receivable agreement. The remeasurement of these items resulted in an increase in total net revenue of $32.0 million from repricing the tax receivable agreement liability and an income tax benefit of $13.6 million from repricing the net deferred tax liability, and contributed $1.79 to diluted earnings per share for the quarter.
PFSI’s tax provision rate for 2018 was decreased to 27.4 percent from 40.5 percent.
Production Segment
Production includes the correspondent acquisition of newly originated government-insured mortgage loans for PennyMac Financial’s own account, fulfillment services on behalf of PennyMac Mortgage Investment Trust (NYSE: PMT) and consumer direct lending.
PennyMac Financial’s loan production activity for the quarter totaled $17.0 billion in UPB, of which $11.1 billion in UPB was for its own account, and $5.9 billion in UPB was fee-based fulfillment activity for PMT. IRLCs on correspondent government and consumer direct loans totaled $11.8 billion in UPB.
3
Production segment pretax income was $55.3 million, a decrease of 20 percent from the prior quarter and a decrease of 41 percent from the fourth quarter of 2016. Production revenue totaled $130.9 million, a decrease of 8 percent from the prior quarter and a decrease of 25 percent from the fourth quarter of 2016. The quarter-over-quarter decrease primarily resulted from an $11.3 million decrease in net gains on mortgage loans held for sale driven by a decline in production volume resulting from increased competition and seasonal factors, partially offset by a $7.2 million increase in net interest income driven by the optimization of financing arrangements.
The components of net gains on mortgage loans held for sale are detailed in the following table:
|
|
|
Quarter ended |
|||||||
|
|
|
December 31, |
|
September 30, |
|
December 31, |
|||
|
|
|
(in thousands) |
|||||||
|
|
$ |
143,904 |
|
$ |
154,763 |
|
$ |
190,735 |
|
|
Mortgage servicing rights recapture payable to PennyMac Mortgage Investment Trust |
|
|
(1,553) |
|
|
(1,495) |
|
|
(2,535) |
|
Provision for representations and warranties, net |
|
|
(381) |
|
|
(402) |
|
|
(845) |
|
Cash investment (1) |
|
|
(69,001) |
|
|
(43,943) |
|
|
29,038 |
|
Fair value changes of pipeline, inventory and hedges |
|
|
25,652 |
|
|
(787) |
|
|
(88,461) |
|
Net gains on mortgage loans held for sale |
|
$ |
98,621 |
|
$ |
108,136 |
|
$ |
127,932 |
|
|
|
|
|
|
|
|
|
|
|
|
Net gains on mortgage loans held for sale by segment: |
|
|
|
|
|
|
|
|
|
|
Production |
|
$ |
68,716 |
|
$ |
79,983 |
|
$ |
103,413 |
|
Servicing |
|
$ |
29,905 |
|
$ |
28,153 |
|
$ |
24,519 |
|
(1) |
Net of cash hedge expense |
PennyMac Financial performs fulfillment services for conventional conforming loans acquired by PMT in its correspondent production business. These services include, but are not limited to: marketing; relationship management; the approval of correspondent sellers and the ongoing monitoring of their performance; reviewing loan data, documentation and appraisals to assess loan quality and risk; pricing; hedging and activities related to the subsequent sale and securitization of loans in the secondary mortgage markets for PMT. Fees earned from fulfillment of correspondent loans on behalf of PMT totaled $19.2 million in the fourth quarter, down 18 percent from the prior quarter and down 29 percent from the fourth quarter of 2016. The decrease in fulfillment fee revenue was driven by lower acquisition volumes by PMT and a reduction in the weighted average fulfillment fee. The weighted average fulfillment fee rate reflects discretionary reductions to facilitate the successful completion of certain loan transactions by PMT. For the fourth quarter, the weighted average fulfillment fee rate was 33 basis points, down from 36 basis points in the prior quarter.
Production segment expenses were $75.6 million, a 3 percent increase from the prior quarter and a 7 percent decrease from the fourth quarter of 2016. The quarter-over-quarter increase was driven by an increase in allocated incentive-based compensation.
4
Servicing Segment
Servicing includes income from owned MSRs, subservicing and special servicing activities. Servicing segment pretax income was $32.0 million compared with $24.5 million in the prior quarter and $35.1 million in the fourth quarter of 2016. Servicing segment revenues totaled $128.8 million, a 25 percent increase from the prior quarter and a 19 percent increase from the fourth quarter of 2016. The quarter-over-quarter increase was primarily due to an increase in net loan servicing fees, driven by portfolio growth and MSR fair value changes net of hedge results.
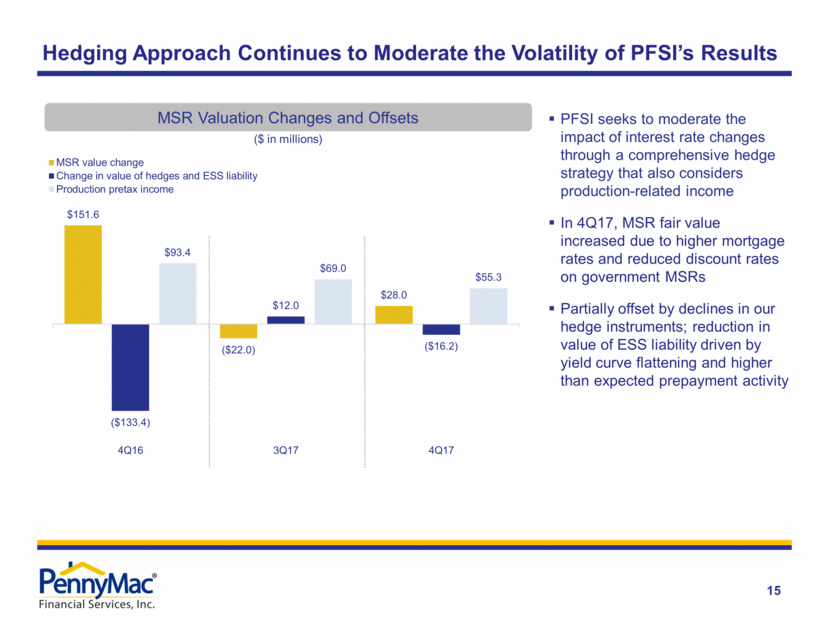
Net loan servicing fees totaled $106.9 million and included $162.0 million in servicing fees reduced by $66.9 million of amortization and realization of MSR cash flows. Valuation-related gains totaled $11.8 million, which includes MSR fair value gains and reversal of impairment for MSRs carried at the lower of amortized cost or fair value of $28.0 million, changes in fair value of the excess servicing spread (ESS) liability resulting in a $4.6 million gain and related hedging losses of $20.8 million. The MSR fair value gains and the reversal of impairment resulted from higher mortgage rates and reduced discount rates on government MSRs, reflecting improved market liquidity for Ginnie Mae MSRs and a reduced risk profile of our MSR portfolio resulting from the early buyout (EBO) of severely delinquent loans.
The following table presents a breakdown of net loan servicing fees:
|
|
|
Quarter ended |
|||||||
|
|
|
December 31, |
|
September 30, |
|
December 31, |
|||
|
|
|
(in thousands) |
|||||||
|
|
$ |
162,008 |
|
$ |
153,782 |
|
$ |
127,483 |
|
|
Effect of MSRs: |
|
|
|
|
|
|
|
|
|
|
Amortization and realization of cash flows |
|
|
(66,891) |
|
|
(65,751) |
|
|
(50,204) |
|
Change in fair value and provision for/reversal of impairment of MSRs carried at lower of amortized cost or fair value |
|
|
28,029 |
|
|
(21,952) |
|
|
151,599 |
|
Change in fair value of excess servicing spread financing |
|
|
4,593 |
|
|
4,828 |
|
|
(17,061) |
|
Hedging gains (losses) |
|
|
(20,837) |
|
|
7,174 |
|
|
(116,289) |
|
Total amortization, impairment and change in fair value of MSRs |
|
|
(55,106) |
|
|
(75,701) |
|
|
(31,955) |
|
Net loan servicing fees |
|
$ |
106,902 |
|
$ |
78,081 |
|
$ |
95,528 |
|
(1) |
Includes contractually-specified servicing fees |
Servicing segment revenue also included $29.9 million in net gains on mortgage loans held for sale from the securitization of reperforming government-insured and guaranteed loans, compared with $28.2 million in the prior quarter and $24.5 million in the fourth quarter of 2016. These loans were previously purchased out of Ginnie Mae securitizations as EBOs and brought back to performing status through PennyMac Financial’s successful servicing efforts, primarily with the use of loan modifications. Net interest expense totaled $8.2 million, a 147 percent increase from the prior quarter and a 33 percent decrease from the fourth quarter of 2016. Interest income decreased by $2.2 million from the prior quarter, driven by a reduction in modification activity on EBO loans. Interest
5
expense increased by $2.7 million from the prior quarter, driven by the second Ginnie Mae MSR term note issued during the third quarter and higher short-term interest rates.
Servicing segment expenses totaled $96.8 million, a 23 percent increase from the prior quarter and a 33 percent increase from the fourth quarter of 2016. The increase was driven by temporary increases in staffing costs to assist borrowers affected by natural disasters and higher EBO transaction-related expenses from a significant increase in buyout volumes during the quarter. The buyout transactions are expected to benefit future period income through reduced costs and gains on redelivery of performing loans.
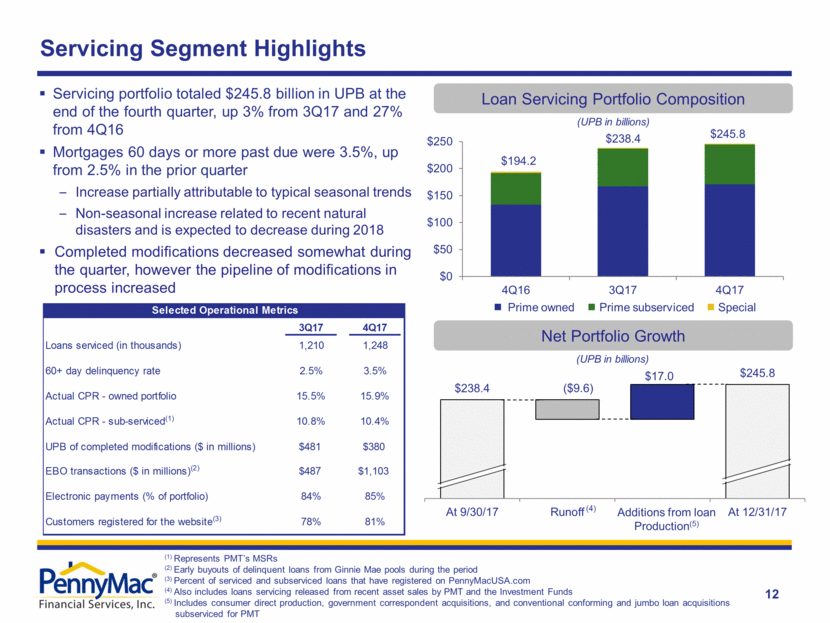
The total servicing portfolio reached $245.8 billion in UPB at December 31, 2017, an increase of 3 percent from the prior quarter end and 27 percent from a year earlier. Servicing portfolio growth during the quarter was driven by the company’s loan production activities. Of the total servicing portfolio, prime servicing was $244.5 billion in UPB and special servicing was $1.3 billion in UPB. PennyMac Financial subservices and conducts special servicing for $75.0 billion in UPB, an increase of 5 percent from September 30, 2017. PennyMac Financial’s owned MSR portfolio grew to $166.2 billion in UPB, an increase of 2 percent from the prior quarter end.
The table below details PennyMac Financial’s servicing portfolio UPB:
|
|
|
December 31, |
|
September 30, |
|
December 31, |
|||
|
|
|
(in thousands) |
|||||||
|
Loans serviced at period end: |
|
|
|
|
|
|
|
|
|
|
Prime servicing: |
|
|
|
|
|
|
|
|
|
|
Owned |
|
|
|
|
|
|
|
|
|
|
Mortgage servicing rights |
|
|
|
|
|
|
|
|
|
|
Originated |
|
$ |
119,673,403 |
|
$ |
113,590,527 |
|
$ |
89,493,817 |
|
Acquisitions |
|
|
46,575,834 |
|
|
49,209,050 |
|
|
39,660,951 |
|
|
|
|
166,249,237 |
|
|
162,799,577 |
|
|
129,154,768 |
|
Mortgage servicing liabilities |
|
|
1,620,609 |
|
|
1,512,632 |
|
|
2,097,234 |
|
Mortgage loans held for sale |
|
|
2,998,377 |
|
|
2,858,642 |
|
|
2,101,283 |
|
|
|
|
170,868,223 |
|
|
167,170,851 |
|
|
133,353,285 |
|
Subserviced for Advised Entities |
|
|
73,651,608 |
|
|
69,498,140 |
|
|
58,327,748 |
|
Total prime servicing |
|
|
244,519,831 |
|
|
236,668,991 |
|
|
191,681,033 |
|
Special servicing: |
|
|
|
|
|
|
|
|
|
|
Subserviced for Advised Entities |
|
|
1,328,660 |
|
|
1,703,817 |
|
|
2,558,969 |
|
Total loans serviced |
|
$ |
245,848,491 |
|
$ |
238,372,808 |
|
$ |
194,240,002 |
|
|
|
|
|
|
|
|
|
|
|
|
Mortgage loans serviced: |
|
|
|
|
|
|
|
|
|
|
Owned |
|
|
|
|
|
|
|
|
|
|
Mortgage servicing rights |
|
$ |
166,249,237 |
|
$ |
162,799,577 |
|
$ |
129,154,768 |
|
Mortgage servicing liabilities |
|
|
1,620,609 |
|
|
1,512,632 |
|
|
2,074,896 |
|
Mortgage loans held for sale |
|
|
2,998,377 |
|
|
2,858,642 |
|
|
2,101,283 |
|
|
|
|
170,868,223 |
|
|
167,170,851 |
|
|
133,330,947 |
|
Subserviced |
|
|
74,980,268 |
|
|
71,201,957 |
|
|
60,886,717 |
|
Total mortgage loans serviced |
|
$ |
245,848,491 |
|
$ |
238,372,808 |
|
$ |
194,217,664 |
6
Investment Management Segment
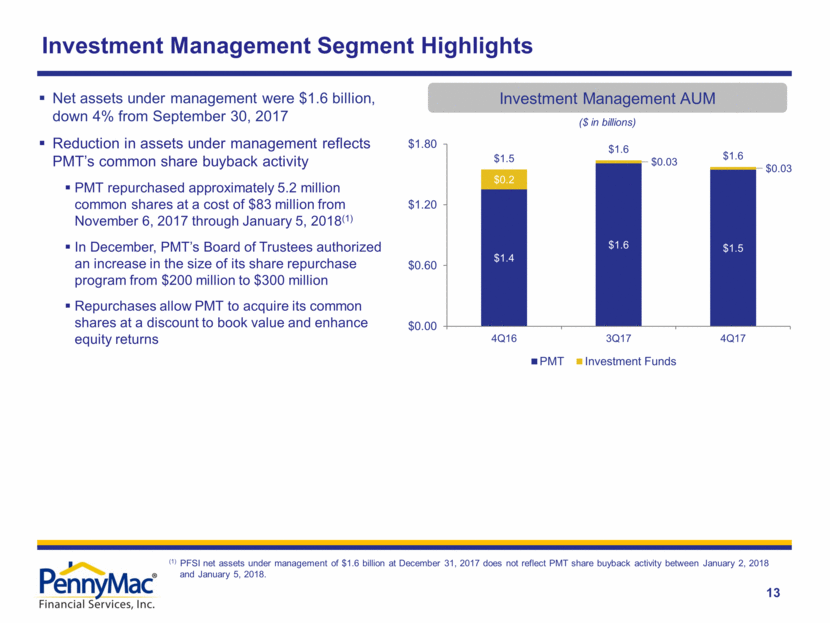
PennyMac Financial manages PMT and two private Investment Funds for which it earns base management fees and may earn incentive compensation. Net assets under management were $1.6 billion as of December 31, 2017, down 4 percent from September 30, 2017 and up 2 percent from December 31, 2016. During and after the quarter, PMT repurchased approximately 5.2 million common shares at a cost of $83 million3. The repurchase program allows PMT to acquire its common shares at a discount to book value and enhance equity returns, which we believe aids PMT’s long-run success.
Pretax income for the Investment Management segment was $1.5 million, compared with $0.7 million in the prior quarter and $0.4 million in the fourth quarter of 2016. Management fees, which include base management fees from PMT and the private Investment Funds, decreased 4 percent from the prior quarter and increased 7 percent from the fourth quarter of 2016. No incentive fee was paid by PMT during the quarter, consistent with the prior quarter and the fourth quarter of 2016.
The following table presents a breakdown of management fees and carried interest:
|
|
|
Quarter ended |
|||||||
|
|
|
December 31, |
|
September 30, |
|
December 31, |
|||
|
|
|
(in thousands) |
|||||||
|
Management fees: |
|
|
|
|
|
|
|
|
|
|
PennyMac Mortgage Investment Trust |
|
|
|
|
|
|
|
|
|
|
Base |
|
$ |
5,900 |
|
$ |
6,038 |
|
$ |
5,081 |
|
Performance incentive |
|
|
— |
|
|
— |
|
|
— |
|
|
|
|
5,900 |
|
|
6,038 |
|
|
5,081 |
|
Investment Funds |
|
|
88 |
|
|
178 |
|
|
502 |
|
Total management fees |
|
|
5,988 |
|
|
6,216 |
|
|
5,583 |
|
Carried Interest |
|
|
5 |
|
|
(1,158) |
|
|
36 |
|
Total management fees and Carried Interest |
|
$ |
5,993 |
|
$ |
5,058 |
|
$ |
5,619 |
|
|
|
|
|
|
|
|
|
|
|
|
Net assets of Advised Entities: |
|
|
|
|
|
|
|
|
|
|
PennyMac Mortgage Investment Trust |
|
$ |
1,544,585 |
|
$ |
1,610,565 |
|
$ |
1,351,114 |
|
Investment Funds |
|
|
29,329 |
|
|
29,955 |
|
|
197,550 |
|
|
|
$ |
1,573,914 |
|
$ |
1,640,520 |
|
$ |
1,548,664 |
Investment Management segment expenses totaled $4.4 million, a 3 percent increase from the prior quarter and a 16 percent decrease from the fourth quarter of 2016.
Consolidated Expenses
Total expenses for the fourth quarter were $176.9 million, a 13 percent increase from the prior quarter and an 11 percent increase from the fourth quarter of 2016. The quarter-over-quarter increase was driven by higher servicing costs, in addition to higher compensation expense resulting from an increase in incentive-based compensation.
3 November 6, 2017 through January 5, 2018. PFSI net assets under management of $1.6 billion at December 31, 2017 does not reflect PMT’s common share buyback activity between January 2, 2018 and January 5, 2018.
7
Executive Chairman Stanford L. Kurland concluded, “We remain focused on long-term initiatives to help ensure PennyMac Financial’s growth and success. We continue to make progress on process redesigns in our production businesses that will benefit our consumer direct and broker direct channels, while in our servicing business we have made technology investments and are rolling out new modules to drive workflows and increased efficiency. We also launched our Broker Direct channel which gives us access to an additional 10 percent of the U.S. mortgage market. While the effects of different aspects of the new tax law are uncertain, we believe a strong economy and the stimulus provided by the tax bill bode well for housing and PennyMac Financial’s businesses.”
Management’s slide presentation will be available in the Investor Relations section of the Company’s website at www.ir.pennymacfinancial.com beginning at 1:30 p.m. (Pacific Daylight Time) on Thursday, February 8, 2018.
About PennyMac Financial Services, Inc.
PennyMac Financial Services, Inc. is a specialty financial services firm with a comprehensive mortgage platform and integrated business focused on the production and servicing of U.S. mortgage loans and the management of investments related to the U.S. mortgage market. PennyMac Financial Services, Inc. trades on the New York Stock Exchange under the symbol “PFSI.” Additional information about PennyMac Financial Services, Inc. is available at www.ir.pennymacfinancial.com.
This press release contains forward-looking statements within the meaning of Section 21E of the Securities Exchange Act of 1934, as amended, regarding management’s beliefs, estimates, projections and assumptions with respect to, among other things, the Company’s financial results, future operations, business plans and investment strategies, as well as industry and market conditions, all of which are subject to change. Words like “believe,” “expect,” “anticipate,” “promise,” “plan,” and other expressions or words of similar meanings, as well as future or conditional verbs such as “will,” “would,” “should,” “could,” or “may” are generally intended to identify forward-looking statements. Actual results and operations for any future period may vary materially from those projected herein and from past results discussed herein. Factors which could cause actual results to differ materially from historical results or those anticipated include, but are not limited to: the continually changing federal, state and local laws and regulations applicable to the highly regulated industry in which we operate; lawsuits or governmental actions that may result from any noncompliance with the laws and regulations applicable to our businesses; the mortgage lending and servicing-related regulations promulgated by the Consumer Financial Protection Bureau and its enforcement of these regulations; our dependence on U.S. government‑sponsored entities and changes in their current roles or their guarantees or guidelines; changes to government mortgage modification programs; the licensing and operational requirements of states and other jurisdictions applicable to the Company’s businesses, to which our bank competitors are not subject; foreclosure delays and changes in foreclosure practices; certain banking regulations that may limit our business activities; our dependence on the multifamily and commercial real estate sectors for future originations of commercial mortgage loans and other commercial real estate related loans; changes in macroeconomic and U.S. real estate market conditions; difficulties inherent in growing loan production volume; difficulties inherent in adjusting the size of our operations to reflect changes in business levels; purchase opportunities for mortgage servicing rights and our success in winning
8
bids; changes in prevailing interest rates; increases in loan delinquencies and defaults; our reliance on PennyMac Mortgage Investment Trust (NYSE: PMT) as a significant source of financing for, and revenue related to, our mortgage banking business; any required additional capital and liquidity to support business growth that may not be available on acceptable terms, if at all; our obligation to indemnify third‑party purchasers or repurchase loans if loans that we originate, acquire, service or assist in the fulfillment of, fail to meet certain criteria or characteristics or under other circumstances; our obligation to indemnify PMT and the Investment Funds if its services fail to meet certain criteria or characteristics or under other circumstances; decreases in the returns on the assets that we select and manage for our clients, and our resulting management and incentive fees; the extensive amount of regulation applicable to our investment management segment; conflicts of interest in allocating our services and investment opportunities among us and our advised entities; the effect of public opinion on our reputation; our recent growth; our ability to effectively identify, manage, monitor and mitigate financial risks; our initiation of new business activities or investment strategies or expansion of existing business activities or investment strategies; our ability to detect misconduct and fraud; our ability to mitigate cybersecurity risks and cyber incidents; our exposure to risks of loss with real estate investments resulting from adverse weather conditions and man-made or natural disasters; and our organizational structure and certain requirements in our charter documents. You should not place undue reliance on any forward- looking statement and should consider all of the uncertainties and risks described above, as well as those more fully discussed in reports and other documents filed by the Company with the Securities and Exchange Commission from time to time. The Company undertakes no obligation to publicly update or revise any forward-looking statements or any other information contained herein, and the statements made in this press release are current as of the date of this release only.
9
PENNYMAC FINANCIAL SERVICES, INC.
CONSOLIDATED BALANCE SHEETS (UNAUDITED)
|
|
|
December 31, |
|
September 30, |
|
December 31, |
|||
|
|
|
(in thousands, except share amounts) |
|||||||
|
ASSETS |
|
|
|
|
|
|
|||
|
Cash |
|
$ |
37,725 |
|
$ |
67,708 |
|
$ |
99,367 |
|
Short—term investments at fair value |
|
|
170,080 |
|
|
136,217 |
|
|
85,964 |
|
Mortgage loans held for sale at fair value |
|
|
3,099,103 |
|
|
2,935,593 |
|
|
2,172,815 |
|
Derivative assets |
|
|
78,179 |
|
|
76,709 |
|
|
82,905 |
|
Servicing advances, net |
|
|
318,066 |
|
|
262,650 |
|
|
348,306 |
|
Carried Interest due from Investment Funds |
|
|
8,552 |
|
|
8,547 |
|
|
70,906 |
|
Investment in PennyMac Mortgage Investment Trust at fair value |
|
|
1,205 |
|
|
1,304 |
|
|
1,228 |
|
Mortgage servicing rights |
|
|
2,119,588 |
|
|
2,016,485 |
|
|
1,627,672 |
|
Real estate acquired in settlement of loans |
|
|
2,447 |
|
|
986 |
|
|
1,418 |
|
Furniture, fixtures, equipment and building improvements, net |
|
|
29,453 |
|
|
30,037 |
|
|
31,321 |
|
Capitalized software, net |
|
|
25,729 |
|
|
21,625 |
|
|
11,205 |
|
Financing receivable from PennyMac Mortgage Investment Trust |
|
|
144,128 |
|
|
148,072 |
|
|
150,000 |
|
Receivable from Investment Funds |
|
|
417 |
|
|
654 |
|
|
1,219 |
|
Receivable from PennyMac Mortgage Investment Trust |
|
|
27,119 |
|
|
16,008 |
|
|
16,416 |
|
Loans eligible for repurchase |
|
|
1,208,195 |
|
|
584,394 |
|
|
382,268 |
|
Other |
|
|
98,107 |
|
|
81,380 |
|
|
50,892 |
|
Total assets |
|
$ |
7,368,093 |
|
$ |
6,388,369 |
|
$ |
5,133,902 |
|
|
|
|
|
|
|
|
|
|
|
|
LIABILITIES |
|
|
|
|
|
|
|
|
|
|
Assets sold under agreements to repurchase |
|
$ |
2,381,538 |
|
$ |
2,096,492 |
|
$ |
1,735,114 |
|
Mortgage loan participation and sale agreements |
|
|
527,395 |
|
|
531,776 |
|
|
671,426 |
|
Notes payable |
|
|
891,505 |
|
|
890,884 |
|
|
150,942 |
|
Obligations under capital lease |
|
|
20,971 |
|
|
24,373 |
|
|
23,424 |
|
Excess servicing spread financing payable to PennyMac Mortgage Investment Trust at fair value |
|
|
236,534 |
|
|
248,763 |
|
|
288,669 |
|
Derivative liabilities |
|
|
5,796 |
|
|
11,474 |
|
|
22,362 |
|
Mortgage servicing liabilities at fair value |
|
|
14,120 |
|
|
16,076 |
|
|
15,192 |
|
Accounts payable and accrued expenses |
|
|
106,716 |
|
|
122,698 |
|
|
134,611 |
|
Payable to Investment Funds |
|
|
2,427 |
|
|
2,190 |
|
|
20,393 |
|
Payable to PennyMac Mortgage Investment Trust |
|
|
136,998 |
|
|
124,589 |
|
|
170,036 |
|
Payable to exchanged Private National Mortgage Acceptance Company, LLC unitholders under tax receivable agreement |
|
|
44,011 |
|
|
75,076 |
|
|
75,954 |
|
Income taxes payable |
|
|
52,160 |
|
|
49,620 |
|
|
25,088 |
|
Liability for loans eligible for repurchase |
|
|
1,208,195 |
|
|
584,394 |
|
|
382,268 |
|
Liability for losses under representations and warranties |
|
|
20,053 |
|
|
19,673 |
|
|
19,067 |
|
Total liabilities |
|
|
5,648,419 |
|
|
4,798,078 |
|
|
3,734,546 |
|
|
|
|
|
|
|
|
|
|
|
|
STOCKHOLDERS' EQUITY |
|
|
|
|
|
|
|
|
|
|
Class A common stockauthorized 200,000,000 shares of $0.0001 par value; issued and outstanding, 23,529,970, 23,219,088 and 22,426,779 shares, respectively |
|
|
2 |
|
|
2 |
|
|
2 |
|
Class B common stockauthorized 1,000 shares of $0.0001 par value; issued and outstanding, 46, 49 and 49 shares, respectively |
|
|
— |
|
|
— |
|
|
— |
|
Additional paid—in capital |
|
|
204,103 |
|
|
196,346 |
|
|
182,772 |
|
Retained earnings |
|
|
265,306 |
|
|
202,988 |
|
|
164,549 |
|
Total stockholders' equity attributable to PennyMac Financial Services, Inc. common stockholders |
|
|
469,411 |
|
|
399,336 |
|
|
347,323 |
|
Noncontrolling interests in Private National Mortgage Acceptance Company, LLC |
|
|
1,250,263 |
|
|
1,190,955 |
|
|
1,052,033 |
|
Total stockholders' equity |
|
|
1,719,674 |
|
|
1,590,291 |
|
|
1,399,356 |
|
Total liabilities and stockholders’ equity |
|
$ |
7,368,093 |
|
$ |
6,388,369 |
|
$ |
5,133,902 |
10
PENNYMAC FINANCIAL SERVICES, INC.
CONSOLIDATED STATEMENTS OF INCOME (UNAUDITED)
|
|
|
Quarter ended |
|||||||
|
|
|
December 31, |
|
September 30, |
|
December 31, |
|||
|
|
|
(in thousands, except earnings per share) |
|||||||
|
Revenue |
|
|
|
|
|
|
|
|
|
|
Net gains on mortgage loans held for sale at fair value |
|
$ |
98,621 |
|
$ |
108,136 |
|
$ |
127,932 |
|
Mortgage loan origination fees |
|
|
30,267 |
|
|
33,168 |
|
|
39,572 |
|
Fulfillment fees from PennyMac Mortgage Investment Trust |
|
|
19,175 |
|
|
23,507 |
|
|
27,164 |
|
Net mortgage loan servicing fees: |
|
|
|
|
|
|
|
|
|
|
Mortgage loan servicing fees |
|
|
|
|
|
|
|
|
|
|
From non-affiliates |
|
|
130,617 |
|
|
126,416 |
|
|
102,671 |
|
From PennyMac Mortgage Investment Trust |
|
|
11,077 |
|
|
11,402 |
|
|
11,696 |
|
From Investment Funds |
|
|
6 |
|
|
416 |
|
|
389 |
|
Ancillary and other fees |
|
|
20,308 |
|
|
15,548 |
|
|
12,727 |
|
|
|
|
162,008 |
|
|
153,782 |
|
|
127,483 |
|
Amortization, impairment and change in estimated fair value of mortgage servicing rights and excess servicing spread |
|
|
(55,106) |
|
|
(75,701) |
|
|
(31,955) |
|
Net mortgage loan servicing fees |
|
|
106,902 |
|
|
78,081 |
|
|
95,528 |
|
Management fees: |
|
|
|
|
|
|
|
|
|
|
From PennyMac Mortgage Investment Trust |
|
|
5,900 |
|
|
6,038 |
|
|
5,081 |
|
From Investment Funds |
|
|
88 |
|
|
178 |
|
|
502 |
|
|
|
|
5,988 |
|
|
6,216 |
|
|
5,583 |
|
Carried Interest from Investment Funds |
|
|
5 |
|
|
(1,158) |
|
|
36 |
|
Net interest income (expense): |
|
|
|
|
|
|
|
|
|
|
Interest income |
|
|
39,905 |
|
|
44,442 |
|
|
24,335 |
|
Interest expense |
|
|
35,677 |
|
|
42,492 |
|
|
32,237 |
|
|
|
|
4,228 |
|
|
1,950 |
|
|
(7,902) |
|
Change in fair value of investment in and dividends received from PennyMac Mortgage Investment Trust |
|
|
(63) |
|
|
(33) |
|
|
94 |
|
Results of real estate acquired in settlement of loans |
|
|
(43) |
|
|
281 |
|
|
(82) |
|
Revaluation of payable to exchanged Private National Mortgage Acceptance Company, LLC unitholders under tax receivable agreement |
|
|
32,940 |
|
|
— |
|
|
551 |
|
Other |
|
|
614 |
|
|
487 |
|
|
809 |
|
Total net revenue |
|
|
298,634 |
|
|
250,635 |
|
|
289,285 |
|
Expenses |
|
|
|
|
|
|
|
|
|
|
Compensation |
|
|
97,097 |
|
|
93,417 |
|
|
94,576 |
|
Servicing |
|
|
41,183 |
|
|
24,968 |
|
|
29,363 |
|
Technology |
|
|
13,993 |
|
|
13,926 |
|
|
11,009 |
|
Occupancy and equipment |
|
|
5,675 |
|
|
5,933 |
|
|
5,138 |
|
Loan origination |
|
|
5,599 |
|
|
5,581 |
|
|
6,961 |
|
Professional services |
|
|
4,868 |
|
|
4,636 |
|
|
5,155 |
|
Marketing |
|
|
2,524 |
|
|
2,375 |
|
|
1,321 |
|
Other |
|
|
5,922 |
|
|
5,655 |
|
|
6,354 |
|
Total expenses |
|
|
176,861 |
|
|
156,491 |
|
|
159,877 |
|
Income before provision for income taxes |
|
|
121,773 |
|
|
94,144 |
|
|
129,408 |
|
(Benefit from) provision for income taxes |
|
|
(2,125) |
|
|
11,652 |
|
|
15,568 |
|
Net income |
|
|
123,898 |
|
|
82,492 |
|
|
113,840 |
|
Less: Net income attributable to noncontrolling interest |
|
|
61,580 |
|
|
65,411 |
|
|
91,096 |
|
Net income attributable to PennyMac Financial Services, Inc. common stockholders |
|
$ |
62,318 |
|
$ |
17,081 |
|
$ |
22,744 |
|
|
|
|
|
|
|
|
|
|
|
|
Earnings per share |
|
|
|
|
|
|
|
|
|
|
Basic |
|
$ |
2.67 |
|
$ |
0.73 |
|
$ |
1.02 |
|
Diluted |
|
$ |
2.44 |
|
$ |
0.71 |
|
$ |
1.00 |
|
Weighted-average common shares outstanding |
|
|
|
|
|
|
|
|
|
|
Basic |
|
|
23,354 |
|
|
23,426 |
|
|
22,339 |
|
Diluted |
|
|
25,565 |
|
|
78,416 |
|
|
76,970 |
11
PENNYMAC FINANCIAL SERVICES, INC.
CONSOLIDATED STATEMENTS OF INCOME (UNAUDITED)
|
|
|
Year ended December 31, |
|||||||
|
|
|
2017 |
|
2016 |
|
2015 |
|||
|
|
|
(in thousands, except earnings per share) |
|||||||
|
Revenue |
|
|
|
|
|
|
|
|
|
|
Net gains on mortgage loans held for sale at fair value |
|
$ |
391,804 |
|
$ |
531,780 |
|
$ |
320,715 |
|
Mortgage loan origination fees |
|
|
119,202 |
|
|
125,534 |
|
|
91,520 |
|
Fulfillment fees from PennyMac Mortgage Investment Trust |
|
|
80,359 |
|
|
86,465 |
|
|
58,607 |
|
Net mortgage loan servicing fees: |
|
|
|
|
|
|
|
|
|
|
Mortgage loan servicing fees |
|
|
|
|
|
|
|
|
|
|
From non-affiliates |
|
|
475,848 |
|
|
385,633 |
|
|
290,474 |
|
From PennyMac Mortgage Investment Trust |
|
|
43,064 |
|
|
50,615 |
|
|
46,423 |
|
From Investment Funds |
|
|
1,461 |
|
|
2,583 |
|
|
2,636 |
|
Ancillary and other fees |
|
|
58,924 |
|
|
46,910 |
|
|
43,139 |
|
|
|
|
579,297 |
|
|
485,741 |
|
|
382,672 |
|
Amortization, impairment and change in estimated fair value of mortgage servicing rights and excess servicing spread |
|
|
(273,238) |
|
|
(300,275) |
|
|
(153,129) |
|
Net mortgage loan servicing fees |
|
|
306,059 |
|
|
185,466 |
|
|
229,543 |
|
Management fees: |
|
|
|
|
|
|
|
|
|
|
From PennyMac Mortgage Investment Trust |
|
|
22,584 |
|
|
20,657 |
|
|
24,194 |
|
From Investment Funds |
|
|
1,001 |
|
|
2,089 |
|
|
4,043 |
|
|
|
|
23,585 |
|
|
22,746 |
|
|
28,237 |
|
Carried Interest from Investment Funds |
|
|
(1,040) |
|
|
980 |
|
|
2,628 |
|
Net interest income (expense): |
|
|
|
|
|
|
|
|
|
|
Interest income |
|
|
143,179 |
|
|
81,127 |
|
|
49,155 |
|
Interest expense |
|
|
144,520 |
|
|
106,206 |
|
|
68,537 |
|
|
|
|
(1,341) |
|
|
(25,079) |
|
|
(19,382) |
|
Change in fair value of investment in and dividends received from PennyMac Mortgage Investment Trust |
|
|
118 |
|
|
224 |
|
|
(230) |
|
Results of real estate acquired in settlement of loans |
|
|
94 |
|
|
(82) |
|
|
— |
|
Revaluation of payable to exchanged Private National Mortgage Acceptance Company, LLC unitholders under tax receivable agreement |
|
|
32,940 |
|
|
551 |
|
|
(1,695) |
|
Other |
|
|
3,683 |
|
|
3,302 |
|
|
3,167 |
|
Total net revenue |
|
|
955,463 |
|
|
931,887 |
|
|
713,110 |
|
Expenses |
|
|
|
|
|
|
|
|
|
|
Compensation |
|
|
358,721 |
|
|
342,153 |
|
|
274,262 |
|
Servicing |
|
|
117,696 |
|
|
85,857 |
|
|
68,085 |
|
Technology |
|
|
52,013 |
|
|
35,322 |
|
|
25,164 |
|
Occupancy and equipment |
|
|
22,615 |
|
|
17,140 |
|
|
8,056 |
|
Loan origination |
|
|
20,429 |
|
|
22,528 |
|
|
17,396 |
|
Professional services |
|
|
17,845 |
|
|
18,078 |
|
|
15,473 |
|
Marketing |
|
|
9,118 |
|
|
5,264 |
|
|
5,664 |
|
Other |
|
|
21,117 |
|
|
22,462 |
|
|
19,817 |
|
Total expenses |
|
|
619,554 |
|
|
548,804 |
|
|
433,917 |
|
Income before provision for income taxes |
|
|
335,909 |
|
|
383,083 |
|
|
279,193 |
|
Provision for income taxes |
|
|
24,387 |
|
|
46,103 |
|
|
31,635 |
|
Net income |
|
|
311,522 |
|
|
336,980 |
|
|
247,558 |
|
Less: Net income attributable to noncontrolling interest |
|
|
210,765 |
|
|
270,901 |
|
|
200,330 |
|
Net income attributable to PennyMac Financial Services, Inc. common stockholders |
|
$ |
100,757 |
|
$ |
66,079 |
|
$ |
47,228 |
|
|
|
|
|
|
|
|
|
|
|
|
Earnings per share |
|
|
|
|
|
|
|
|
|
|
Basic |
|
$ |
4.34 |
|
$ |
2.98 |
|
$ |
2.17 |
|
Diluted |
|
$ |
4.03 |
|
$ |
2.94 |
|
$ |
2.17 |
|
Weighted—average common shares outstanding |
|
|
|
|
|
|
|
|
|
|
Basic |
|
|
23,199 |
|
|
22,161 |
|
|
21,755 |
|
Diluted |
|
|
24,999 |
|
|
76,629 |
|
|
76,104 |
12
Exhibit 99.2
|
|
Fourth Quarter 2017 Earnings Report
|
|
|
Forward-Looking Statements 2 This presentation forward-looking statements within the meaning of Section 21E of the Securities Exchange Act of 1934, as amended, regarding management’s beliefs, estimates, projections and assumptions with respect to, among other things, the Company’s financial results, future operations, business plans and investment strategies, as well as industry and market conditions, all of which are subject to change. Words like “believe,” “expect,” “anticipate,” “promise,” “plan,” and other expressions or words of similar meanings, as well as future or conditional verbs such as “will,” “would,” “should,” “could,” or “may” are generally intended to identify forward-looking statements. Actual results and operations for any future period may vary materially from those projected herein and from past results discussed herein. Factors which could cause actual results to differ materially from historical results or those anticipated include, but are not limited to: the continually changing federal, state and local laws and regulations applicable to the highly regulated industry in which we operate; lawsuits or governmental actions that may result from any noncompliance with the laws and regulations applicable to our businesses; the mortgage lending and servicing-related regulations promulgated by the Consumer Financial Protection Bureau and its enforcement of these regulations; our dependence on U.S. government‑sponsored entities and changes in their current roles or their guarantees or guidelines; changes to government mortgage modification programs; the licensing and operational requirements of states and other jurisdictions applicable to the Company’s businesses, to which our bank competitors are not subject; foreclosure delays and changes in foreclosure practices; certain banking regulations that may limit our business activities; our dependence on the multifamily and commercial real estate sectors for future originations of commercial mortgage loans and other commercial real estate related loans; changes in macroeconomic and U.S. real estate market conditions; difficulties inherent in growing loan production volume; difficulties inherent in adjusting the size of our operations to reflect changes in business levels; purchase opportunities for mortgage servicing rights and our success in winning bids; changes in prevailing interest rates; increases in loan delinquencies and defaults; our reliance on PennyMac Mortgage Investment Trust (NYSE: PMT) as a significant source of financing for, and revenue related to, our mortgage banking business; any required additional capital and liquidity to support business growth that may not be available on acceptable terms, if at all; our obligation to indemnify third‑party purchasers or repurchase loans if loans that we originate, acquire, service or assist in the fulfillment of, fail to meet certain criteria or characteristics or under other circumstances; our obligation to indemnify PMT and the Investment Funds if its services fail to meet certain criteria or characteristics or under other circumstances; decreases in the returns on the assets that we select and manage for our clients, and our resulting management and incentive fees; the extensive amount of regulation applicable to our investment management segment; conflicts of interest in allocating our services and investment opportunities among us and our advised entities; the effect of public opinion on our reputation; our recent growth; our ability to effectively identify, manage, monitor and mitigate financial risks; our initiation of new business activities or expansion of existing business activities; our ability to detect misconduct and fraud; and our ability to mitigate cybersecurity risks and cyber incidents. You should not place undue reliance on any forward-looking statement and should consider all of the uncertainties and risks described above, as well as those more fully discussed in reports and other documents filed by the Company with the Securities and Exchange Commission from time to time. The Company undertakes no obligation to publicly update or revise any forward-looking statements or any other information contained herein, and the statements made in this presentation are current as of the date of this presentation only. |
|
|
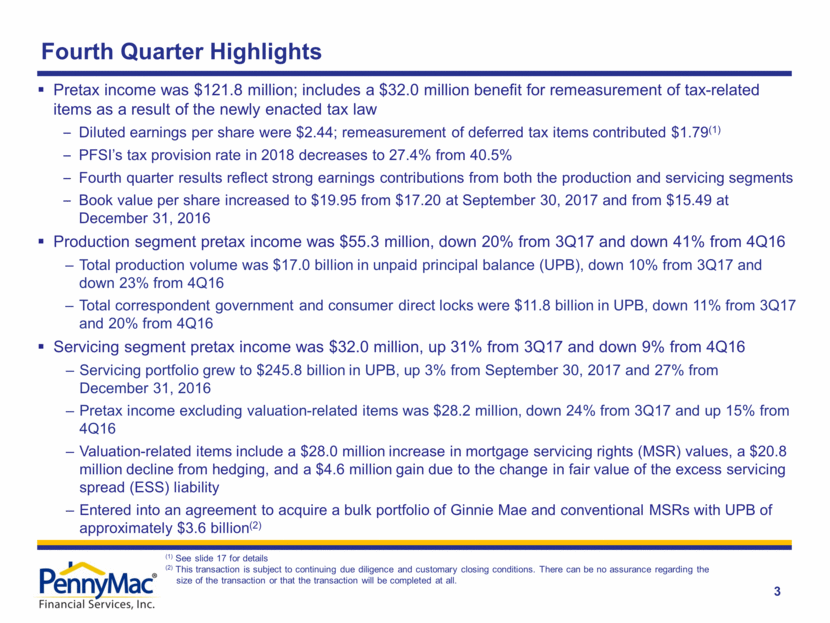
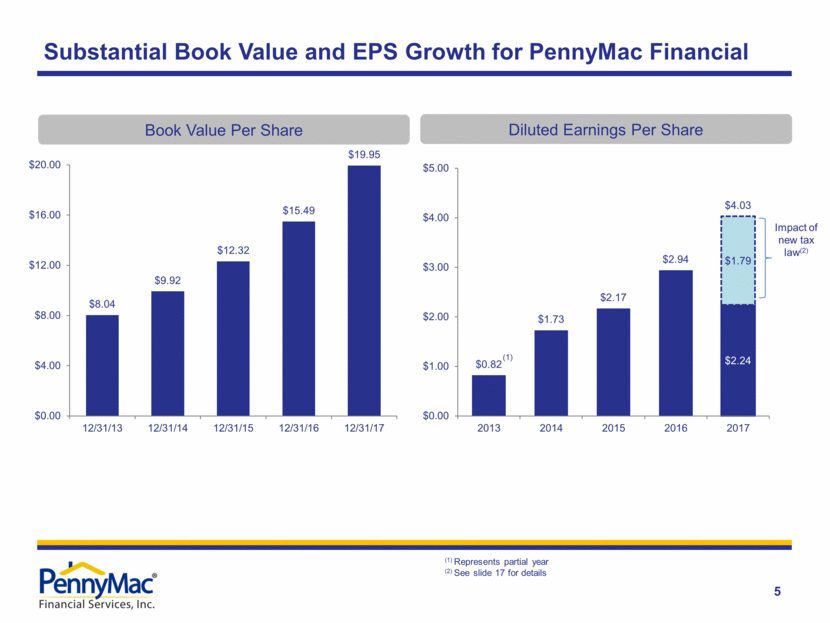
Fourth Quarter Highlights 3 Pretax income was $121.8 million; includes a $32.0 million benefit for remeasurement of tax-related items as a result of the newly enacted tax law Diluted earnings per share were $2.44; remeasurement of deferred tax items contributed $1.79(1) PFSI’s tax provision rate in 2018 decreases to 27.4% from 40.5% Fourth quarter results reflect strong earnings contributions from both the production and servicing segments Book value per share increased to $19.95 from $17.20 at September 30, 2017 and from $15.49 at December 31, 2016 Production segment pretax income was $55.3 million, down 20% from 3Q17 and down 41% from 4Q16 Total production volume was $17.0 billion in unpaid principal balance (UPB), down 10% from 3Q17 and down 23% from 4Q16 Total correspondent government and consumer direct locks were $11.8 billion in UPB, down 11% from 3Q17 and 20% from 4Q16 Servicing segment pretax income was $32.0 million, up 31% from 3Q17 and down 9% from 4Q16 Servicing portfolio grew to $245.8 billion in UPB, up 3% from September 30, 2017 and 27% from December 31, 2016 Pretax income excluding valuation-related items was $28.2 million, down 24% from 3Q17 and up 15% from 4Q16 Valuation-related items include a $28.0 million increase in mortgage servicing rights (MSR) values, a $20.8 million decline from hedging, and a $4.6 million gain due to the change in fair value of the excess servicing spread (ESS) liability Entered into an agreement to acquire a bulk portfolio of Ginnie Mae and conventional MSRs with UPB of approximately $3.6 billion(2) (1) See slide 17 for details (2) This transaction is subject to continuing due diligence and customary closing conditions. There can be no assurance regarding the size of the transaction or that the transaction will be completed at all. |
|
|
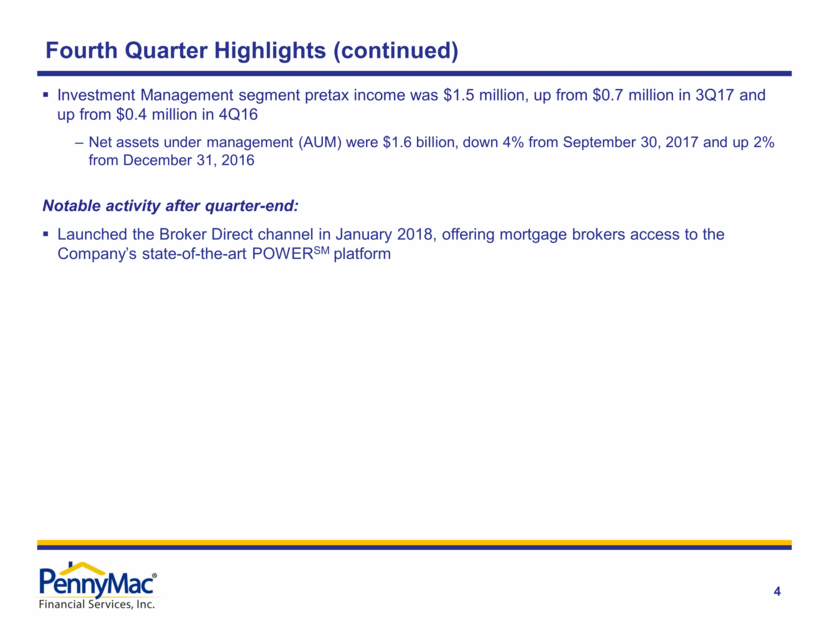
Fourth Quarter Highlights (continued) 4 Investment Management segment pretax income was $1.5 million, up from $0.7 million in 3Q17 and up from $0.4 million in 4Q16 Net assets under management (AUM) were $1.6 billion, down 4% from September 30, 2017 and up 2% from December 31, 2016 Notable activity after quarter-end: Launched the Broker Direct channel in January 2018, offering mortgage brokers access to the Company’s state-of-the-art POWERSM platform |
|
|
Substantial Book Value and EPS Growth for PennyMac Financial 5 Diluted Earnings Per Share (1) Represents partial year (2) See slide 17 for details Book Value Per Share (1) Impact of new tax law(2) $2.24 $1.79 $0.82 $1.73 $2.17 $2.94 $4.03 $0.00 $1.00 $2.00 $3.00 $4.00 $5.00 2013 2014 2015 2016 2017 $8.04 $9.92 $12.32 $15.49 $19.95 $0.00 $4.00 $8.00 $12.00 $16.00 $20.00 12/31/13 12/31/14 12/31/15 12/31/16 12/31/17 |
|
|
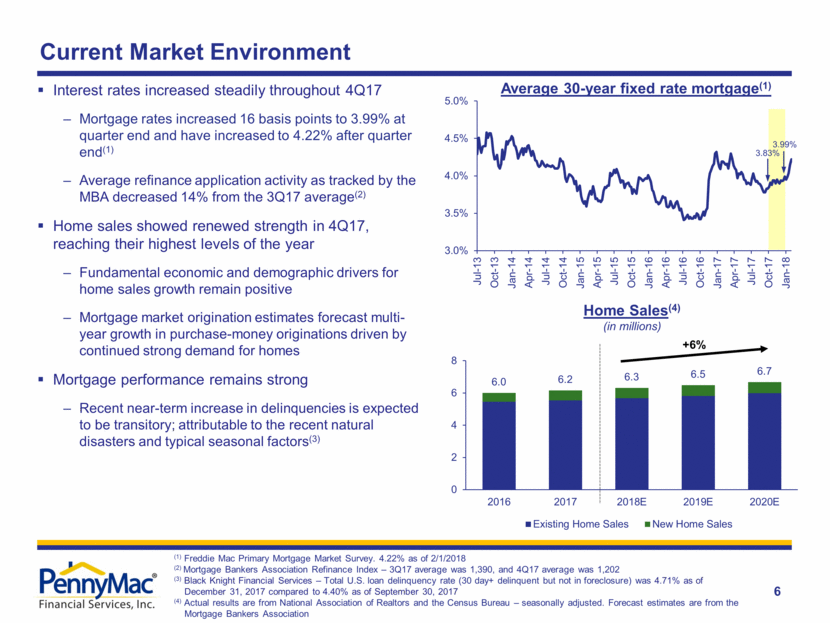
Current Market Environment 6 Average 30-year fixed rate mortgage(1) (1) Freddie Mac Primary Mortgage Market Survey. 4.22% as of 2/1/2018 (2) Mortgage Bankers Association Refinance Index – 3Q17 average was 1,390, and 4Q17 average was 1,202 (3) Black Knight Financial Services – Total U.S. loan delinquency rate (30 day+ delinquent but not in foreclosure) was 4.71% as of December 31, 2017 compared to 4.40% as of September 30, 2017 (4) Actual results are from National Association of Realtors and the Census Bureau – seasonally adjusted. Forecast estimates are from the Mortgage Bankers Association 3.99% Interest rates increased steadily throughout 4Q17 Mortgage rates increased 16 basis points to 3.99% at quarter end and have increased to 4.22% after quarter end(1) Average refinance application activity as tracked by the MBA decreased 14% from the 3Q17 average(2) Home sales showed renewed strength in 4Q17, reaching their highest levels of the year Fundamental economic and demographic drivers for home sales growth remain positive Mortgage market origination estimates forecast multi-year growth in purchase-money originations driven by continued strong demand for homes Mortgage performance remains strong Recent near-term increase in delinquencies is expected to be transitory; attributable to the recent natural disasters and typical seasonal factors(3) 3.83% Home Sales(4) (in millions) +6% 3.0% 3.5% 4.0% 4.5% 5.0% Jul-13 Oct-13 Jan-14 Apr-14 Jul-14 Oct-14 Jan-15 Apr-15 Jul-15 Oct-15 Jan-16 Apr-16 Jul-16 Oct-16 Jan-17 Apr-17 Jul-17 Oct-17 Jan-18 6.0 6.2 6.3 6.5 6.7 0 2 4 6 8 2016 2017 2018E 2019E 2020E Existing Home Sales New Home Sales |
|
|
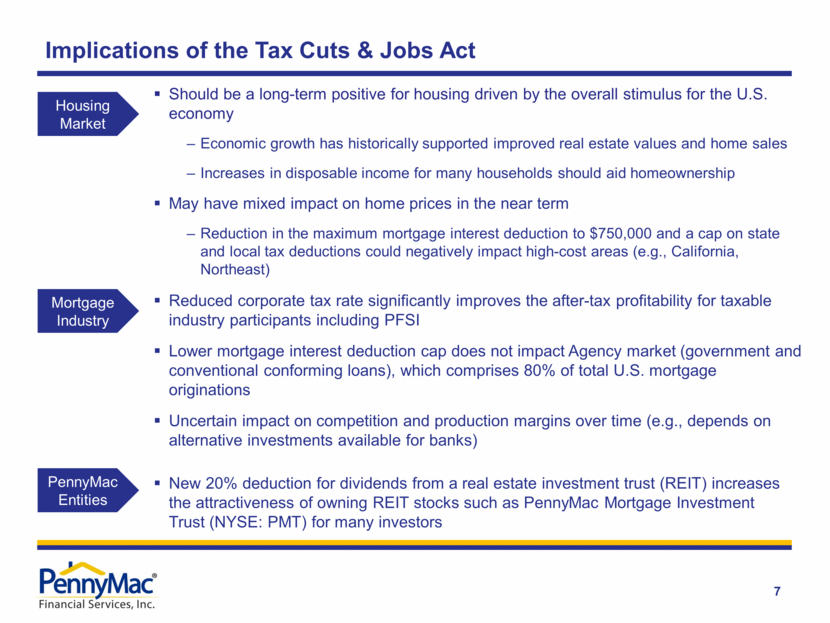
Implications of the Tax Cuts & Jobs Act 7 Housing Market Mortgage Industry PennyMac Entities Should be a long-term positive for housing driven by the overall stimulus for the U.S. economy Economic growth has historically supported improved real estate values and home sales Increases in disposable income for many households should aid homeownership May have mixed impact on home prices in the near term Reduction in the maximum mortgage interest deduction to $750,000 and a cap on state and local tax deductions could negatively impact high-cost areas (e.g., California, Northeast) Reduced corporate tax rate significantly improves the after-tax profitability for taxable industry participants including PFSI Lower mortgage interest deduction cap does not impact Agency market (government and conventional conforming loans), which comprises 80% of total U.S. mortgage originations Uncertain impact on competition and production margins over time (e.g., depends on alternative investments available for banks) New 20% deduction for dividends from a real estate investment trust (REIT) increases the attractiveness of owning REIT stocks such as PennyMac Mortgage Investment Trust (NYSE: PMT) for many investors |
|
|
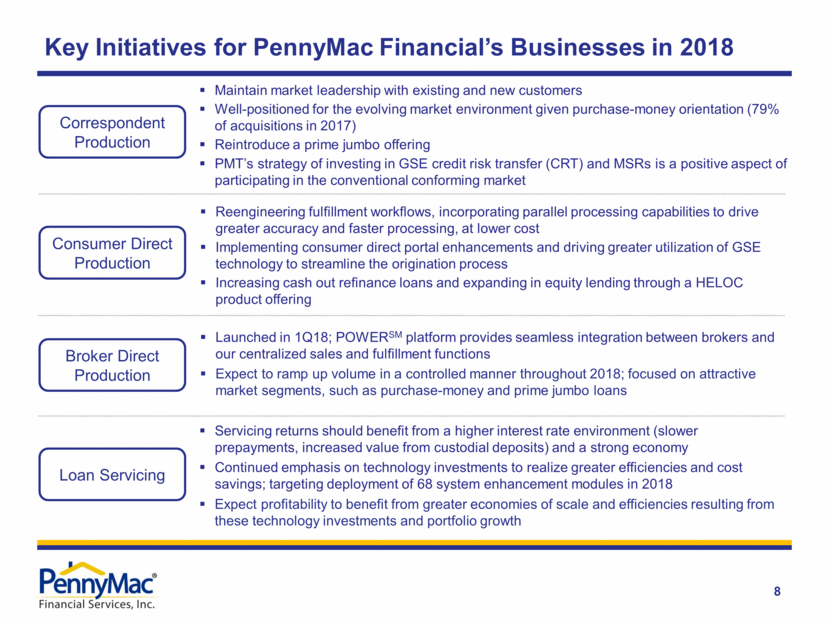
Key Initiatives for PennyMac Financial’s Businesses in 2018 Reengineering fulfillment workflows, incorporating parallel processing capabilities to drive greater accuracy and faster processing, at lower cost Implementing consumer direct portal enhancements and driving greater utilization of GSE technology to streamline the origination process Increasing cash out refinance loans and expanding in equity lending through a HELOC product offering 8 Correspondent Production Consumer Direct Production Broker Direct Production Maintain market leadership with existing and new customers Well-positioned for the evolving market environment given purchase-money orientation (79% of acquisitions in 2017) Reintroduce a prime jumbo offering PMT’s strategy of investing in GSE credit risk transfer (CRT) and MSRs is a positive aspect of participating in the conventional conforming market Launched in 1Q18; POWERSM platform provides seamless integration between brokers and our centralized sales and fulfillment functions Expect to ramp up volume in a controlled manner throughout 2018; focused on attractive market segments, such as purchase-money and prime jumbo loans Loan Servicing Servicing returns should benefit from a higher interest rate environment (slower prepayments, increased value from custodial deposits) and a strong economy Continued emphasis on technology investments to realize greater efficiencies and cost savings; targeting deployment of 68 system enhancement modules in 2018 Expect profitability to benefit from greater economies of scale and efficiencies resulting from these technology investments and portfolio growth |
|
|
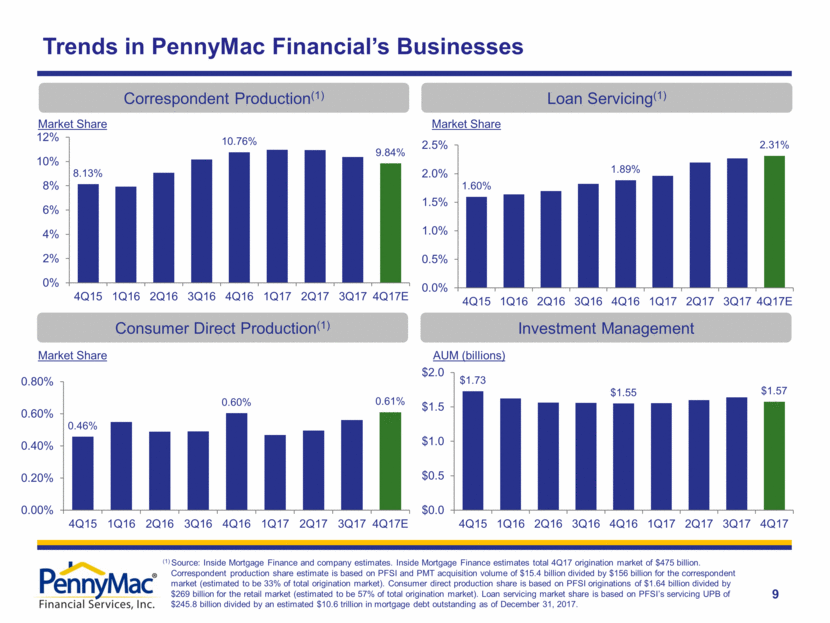
Trends in PennyMac Financial’s Businesses Correspondent Production(1) Market Share Market Share Consumer Direct Production(1) Loan Servicing(1) Market Share Investment Management AUM (billions) 9 (1) Source: Inside Mortgage Finance and company estimates. Inside Mortgage Finance estimates total 4Q17 origination market of $475 billion. Correspondent production share estimate is based on PFSI and PMT acquisition volume of $15.4 billion divided by $156 billion for the correspondent market (estimated to be 33% of total origination market). Consumer direct production share is based on PFSI originations of $1.64 billion divided by $269 billion for the retail market (estimated to be 57% of total origination market). Loan servicing market share is based on PFSI’s servicing UPB of $245.8 billion divided by an estimated $10.6 trillion in mortgage debt outstanding as of December 31, 2017. 8.13% 10.76% 9.84% 0% 2% 4% 6% 8% 10% 12% 4Q15 1Q16 2Q16 3Q16 4Q16 1Q17 2Q17 3Q17 4Q17E 0.46% 0.60% 0.61% 0.00% 0.20% 0.40% 0.60% 0.80% 4Q15 1Q16 2Q16 3Q16 4Q16 1Q17 2Q17 3Q17 4Q17E 1.60% 1.89% 2.31% 0.0% 0.5% 1.0% 1.5% 2.0% 2.5% 4Q15 1Q16 2Q16 3Q16 4Q16 1Q17 2Q17 3Q17 4Q17E $1.73 $1.55 $1.57 $0.0 $0.5 $1.0 $1.5 $2.0 4Q15 1Q16 2Q16 3Q16 4Q16 1Q17 2Q17 3Q17 4Q17 |
|
|
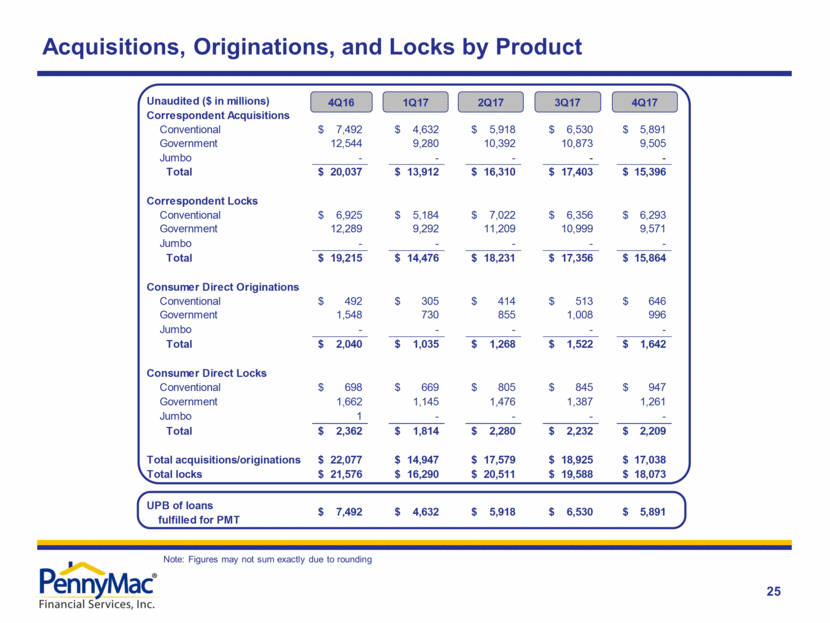
10 (UPB in billions) Production Segment Highlights – Correspondent Channel (1) For government-insured and guaranteed loans, PFSI earns income from holding and selling or securitizing the loans (2) For conventional loans, PFSI earns a fulfillment fee from PMT rather than income from holding and selling or securitizing the loans (3) Includes locks related to PMT loan acquisitions, including conventional loans for which PFSI earns a fulfillment fee upon loan funding (4) Includes net gains on mortgage loans held for sale, loan origination fees and net interest income for government-insured correspondent loans; lock volume adjusted for expected fallout, which was 3% in 4Q17 for government-insured correspondent locks (5) Fulfillment fees are based on funding volumes. The weighted average fulfillment fee rate reflects discretionary reductions to facilitate the successful completion of certain loan transactions by PMT Correspondent Volume and Mix Correspondent acquisitions by PMT in 4Q17 totaled $15.4 billion, down 12% Q/Q and down 23% Y/Y 62% government loans; 38% conventional loans 10% Q/Q decline in conventional conforming acquisitions, and down 21% Y/Y Total lock volume of $15.9 billion, down 9% Q/Q and 17% Y/Y; government locks totaled $9.6 billion, down 13% Q/Q and 22% Y/Y Volume decline from the prior quarter resulted from increased competition and seasonal factors Revenue per fallout-adjusted lock increased Q/Q, due in part to optimization of financing arrangements Seller relationships totaled 613 at quarter end January correspondent acquisitions totaled $4.8 billion; locks totaled $4.4 billion ■ Government loans(1) ■ Total Locks(3) ■ Conventional loans for PMT(2) Selected Operational Metrics $4.40 Gov't 60% 3Q17 4Q17 $2.90 Fulfillment 40% PCG Correspondent seller relationships 604 613 $7.30 Purchase money loans, as a % of total acquisitions 83% 76% 82 73 77.5 WA FICO 3Q17 4Q17 PCG Government-insured 693 693 1245 3.41% 1204 7.12% Conventional 749 745 1124 CDL WA FICO Consumer Direct Metrics 3Q17 4Q17 3Q17 4Q17 Government-insured 692 695 Production Margin (bps) 363 370 Conventional 741 738 Commited Pipeline ($ in millions)(2) $856 $777 Selected Operational Metrics 3Q17 4Q17 Correspondent seller relationships 604 613 Purchase money loans, as a % of total acquisitions 83% 76% Key Financial Metrics 3Q17 4Q17 Revenue per fallout-adjusted correspondent lock(4) 51 bps 54 bps Weighted average fulfillment fee(5) 36bps 33bps Selected Operational Metrics 3Q17 4Q17 Correspondent seller relationships 604 613 Purchase money loans, as a % of total acquisitions 83% 76% Consumer Direct Margin 3Q17 4Q17 Production Margin 363 370 Commited Pipeline(2) 370 $12.5 $10.9 $9.5 $7.5 $6.5 $5.9 $19.2 $17.4 $15.9 $0 $4 $8 $12 $16 $20 $24 4Q16 3Q17 4Q17 |
|
|
■ Portfolio-sourced fundings ■ Non-portfolio fundings ■ Committed pipeline(1) (UPB in billions) Consumer direct production volume of $1.6 billion in 4Q17, up 8% Q/Q and down 20% Y/Y Successful recapture initiatives drove higher volumes January consumer direct originations totaled $509 million; locks totaled $662 million $659 million committed pipeline at January 31, 2018(1) Pull-through rates on interest rate lock commitments consistent with 3Q17’s improved levels 67% for 4Q17 locks from 66% in the prior quarter Production Segment Highlights – Consumer Direct Channel Consumer Direct Production Volume (1) Commitments to originate mortgage loans at specified terms at period end (2) Includes net gains on mortgage loans held for sale, loan origination fees and net interest income; lock volume adjusted for expected fallout, which was 33% in 4Q17 for consumer direct locks (3) As of September 30, 2017 and December 31, 2017 11 Consumer Direct Metrics 3Q17 4Q17 Revenue per fallout-adjusted consumer direct lock(2) 363 370 Commited Pipeline ($ in millions)(3) $856 $777 $2.0 $1.3 $1.6 $0.8 $0.9 $0.8 $0.0 $0.6 $1.2 $1.8 $2.4 4Q16 3Q17 4Q17 |
|
|
(UPB in billions) Servicing portfolio totaled $245.8 billion in UPB at the end of the fourth quarter, up 3% from 3Q17 and 27% from 4Q16 Mortgages 60 days or more past due were 3.5%, up from 2.5% in the prior quarter Increase partially attributable to typical seasonal trends Non-seasonal increase related to recent natural disasters and is expected to decrease during 2018 Completed modifications decreased somewhat during the quarter, however the pipeline of modifications in process increased Servicing Segment Highlights Loan Servicing Portfolio Composition Net Portfolio Growth (UPB in billions) (1) 12 (1) Represents PMT’s MSRs (2) Early buyouts of delinquent loans from Ginnie Mae pools during the period (3) Percent of serviced and subserviced loans that have registered on PennyMacUSA.com (4) Also includes loans servicing released from recent asset sales by PMT and the Investment Funds (5) Includes consumer direct production, government correspondent acquisitions, and conventional conforming and jumbo loan acquisitions subserviced for PMT ■ Prime owned ■ Prime subserviced ■ Special Additions from loan Production(5) $17.0 (4) Selected Operational Metrics 3Q17 4Q17 Loans serviced (in thousands) 1,210 1,248 active 60+ delinquent loan count at 9/30 27,361 30,799 Total Active loan count 1,101,540 1,210,136 60+ day delinquency rate 2.5% 3.5% 60+ day delinq rate 2.5% 2.5% Actual CPR - owned portfolio 15.5% 15.9% Actual CPR - sub-serviced(1) 10.8% 10.4% UPB of completed modifications ($ in millions) $481 $380 -0.2107 EBO transactions ($ in millions)(2) $487 $1,103 Electronic payments (% of portfolio) 84% 85% Mods april $156,499,812 Customers registered for the website(3) 78% 81% may $232,017,737 june $190,688,715 $579,206,264 july $168,300,513 august $166,142,010 september $147,022,051 total $481,464,574 October $107,375,225 November $120,350,445 December $152,331,212 Total $380,056,882 82.9 82.81 84.15 82.25 83.64 84.24 $238.4 $245.8 ($9.6) At 9/30/17 Runoff At 12/31/17 $194.2 $238.4 $245.8 $0 $50 $100 $150 $200 $250 4Q16 3Q17 4Q17 |
|
|
13 ($ in billions) Net assets under management were $1.6 billion, down 4% from September 30, 2017 Reduction in assets under management reflects PMT’s common share buyback activity PMT repurchased approximately 5.2 million common shares at a cost of $83 million from November 6, 2017 through January 5, 2018(1) In December, PMT’s Board of Trustees authorized an increase in the size of its share repurchase program from $200 million to $300 million Repurchases allow PMT to acquire its common shares at a discount to book value and enhance equity returns Investment Management Segment Highlights Investment Management AUM (1) PFSI net assets under management of $1.6 billion at December 31, 2017 does not reflect PMT share buyback activity between January 2, 2018 and January 5, 2018. $1.4 $1.6 $1.5 $0.2 $0.03 $0.03 $1.5 $1.6 $1.6 $0.00 $0.60 $1.20 $1.80 4Q16 3Q17 4Q17 PMT Investment Funds |
|
|
($ in millions) Production Segment Pretax Income 14 ($ in millions) Production and Servicing Segment Profitability Servicing Segment Pretax Income (1) Net gains on mortgage loans held for sale at fair value, loan origination fees and net interest income and other. $272 $416 $239 $0 $100 $200 $300 $400 $500 2015 2016 2017 $15 $72 $103 $1 ($36) $59 -$50 -$25 $0 $25 $50 $75 $100 $125 2015 2016 2017 Servicing Segment Pretax Income Excluding Valuation-Related Changes Servicing Segment Pretax Income |
|
|
Hedging Approach Continues to Moderate the Volatility of PFSI’s Results 15 PFSI seeks to moderate the impact of interest rate changes through a comprehensive hedge strategy that also considers production-related income In 4Q17, MSR fair value increased due to higher mortgage rates and reduced discount rates on government MSRs Partially offset by declines in our hedge instruments; reduction in value of ESS liability driven by yield curve flattening and higher than expected prepayment activity MSR Valuation Changes and Offsets ($ in millions) $151.6 ($22.0) $28.0 ($133.4) $12.0 ($16.2) $93.4 $69.0 $55.3 4Q16 3Q17 4Q17 MSR value change Change in value of hedges and ESS liability Production pretax income |
|
|
Servicing Profitability Excluding Valuation-Related Changes 16 (1) Of average portfolio UPB, annualized (2) Comprised of net gains on mortgage loans held for sale at fair value and net interest income related to EBO loans (3) Changes in fair value do not include realization of MSR cash flows, which are included in amortization and realization of MSR cash flows above (4) Includes fair value changes and provision for impairment (5) Considered in the assessment of MSR fair value changes 4Q16 3Q17 4Q17 Increase in operating revenue reflects portfolio growth and an increase in ancillary fee revenue Efficiency improvements in operating expenses offset by temporary increases in staff to assist borrowers affected by natural disasters Higher EBO transaction-related expenses reflect large buyout volumes during the quarter—expected to benefit future period income through reduced costs and resale of performing loans Provision for credit losses reflects expected levels of delinquencies resulting from portfolio seasoning and disaster-related loans $ in millions basis points(1) $ in millions basis points(1) $ in millions basis points(1) Operating revenue $ 133.7 28.4 $ 167.4 28.4 $ 176.1 28.9 Amortization and realization of MSR cash flows (50.2) (10.7) (65.7) (11.2) (66.9) (11.0) EBO-related revenue(2) 24.8 5.3 39.4 6.7 38.6 6.4 Servicing expenses: Operating expenses (53.1) (11.3) (65.2) (11.1) (67.7) (11.1) Credit losses and provisions for defaulted loans (12.3) (2.6) (10.4) (1.8) (15.0) (2.5) EBO transaction-related expense (6.3) (1.3) (6.1) (1.0) (13.3) (2.2) Financing expenses: Interest on ESS (5.0) (1.1) (4.0) (0.7) (3.9) (0.6) Interest to third parties (7.0) (1.5) (18.2) (3.1) (19.6) (3.2) Pretax income excluding valuation-related changes $ 24.6 5.2 $ 37.1 6.3 $ 28.2 4.6 Valuation-related changes(3) MSR fair value(4) 151.6 (22.0) 28.0 ESS liability fair value (17.1) 4.8 4.6 Hedging derivatives gains (losses) (116.3) 7.2 (20.8) Provision for credit losses on active loans(5) $ (7.8) $ (2.7) $ (8.0) Servicing segment pretax income (loss) $ 35.1 $ 24.5 $ 32.0 |
|
|
Impact of New Tax Law on 4Q17 Results 17 Tax-related items remeasured during the quarter were: Net deferred income tax liability (primary deferred tax liability resulted from the deferred gains related to originated MSRs and the primary deferred tax asset related to the step up in basis on exchange of Private National Mortgage Acceptance Company, LLC unitholders for PFSI Class A common stock) Tax rate change required a remeasurement of amounts payable to exchanged Private National Mortgage Acceptance Company, LLC unitholders under the tax receivable agreement ($ in millions) As Reported Impact of New Tax Law Pro Forma Excluding Impact of New Tax law Total net revenue $ 298.6 $ 32.0 $ 266.6 Total expenses 176.9 - 176.9 (Benefit from) provision for income taxes (2.1) 13.6 11.5 Net income 123.9 45.7 78.2 Less: Net income attributable to noncontrolling interest 61.6 - 61.6 Net income attributable to PennyMac Financial Services, Inc. common stockholders 62.3 45.7 16.6 Earnings per share Basic $ 2.67 $ 1.96 $ 0.71 Diluted $ 2.44 $ 1.79 $ 0.65 |
|
|
Changes to Accounting for MSRs in 2018 18 Through December 31, 2017, PFSI carried most of its originated MSRs at the lower of amortized cost or fair value Beginning January 1, 2018, all MSRs will be carried at fair value Allows for single accounting treatment across all MSRs, and carrying value consistent with valuation under financing arrangements, and simplifies hedging activities The fair value of MSRs carried at amortized cost or fair value was $0.8 million in excess of the carrying value at December 31, 2017 Change will result in a $0.8 million increase in assets, a $0.2 million increase in deferred tax liability, and a $0.6 million increase in stockholders’ equity Change will not be reported in the income statement Note: Figures may not sum exactly due to rounding Mortgage Servicing Rights (MSRs) As of December 31, 2017 Unaudited ($ in millions) UPB $114,366 $51,884 $166,250 Fair value $1,482.4 $638.0 $2,120.4 Carrying value $1,481.6 $638.0 $2,119.6 Fair value in excess of carrying value $0.8 Lower of amortized cost or fair value Total Fair value |
|
|
Appendix |
|
|
Overview of PennyMac Financial’s Businesses Complex and highly regulated mortgage industry requires effective governance, compliance and operating systems PFSI’s platform has been developed organically and is highly scalable Commitment to strong corporate governance, compliance and risk management since inception PFSI is well positioned for continued growth in this market and regulatory environment Loan Production Loan Servicing Investment Management Servicing for owned MSRs and subservicing for Advised Entities Major loan servicer for Fannie Mae, Freddie Mac and Ginnie Mae Industry-leading capabilities in special servicing Organic growth results from loan production, supplemented by MSR acquisitions and PMT investment activity Serve as external manager for investment vehicles focused on investing in mortgage-related assets: Distressed whole loans MSRs and ESS GSE credit risk transfers Investments in prime non-Agency MBS and ABS Multifamily loans and securitization interests Synergistic partnership with PMT Correspondent aggregation of newly originated loans from third-party sellers PFSI earns gains on government-insured loans Fulfillment fees for PMT’s conventional loans Consumer direct origination of conventional and government-insured loans Small balance multifamily origination business 20 |
|
|
Issued MSR- backed term notes 2017 2008 2009 2010 2011 2012 2013 2014 2015 Added servicing leadership for prime portfolio and to drive scalable growth Correspondent system launches Expanded infrastructure with flagship operations facility in Moorpark, CA Correspondent leadership team expands Expanded infrastructure in Tampa, FL Became largest non-bank correspondent aggregator PFSI completed initial public offering Expanded infrastructure in Fort Worth, TX Continued organic growth Servicing UPB reaches $100 bn Stockholders’ equity surpasses $1 bn 2016 Substantial growth in consumer direct capacity PFSI Has Developed in a Sustainable Manner for Long-Term Growth 72 128 230 435 1,008 1,373 1,816 2,523 3,099 3,248 Employees at year end 21 Disciplined growth to address the demands of the GSEs, Agencies, regulators and our financing partners - Since inception, PennyMac has focused on building and testing processes and systems before adding significant transaction volumes Highly experienced management team has created a robust corporate governance system centered on compliance, risk management and quality control Operations launched De novo build of legacy-free mortgage servicer Raised $600 million of capital in private opportunity funds PMT formed in an initial public offering raising $320 million Correspondent group established with a focus on operations development and process design |
|
|
22 PennyMac Financial Is in a Unique Position Among Mortgage Specialists Industry-leading platform built organically – not through acquisitions Not distracted by legacy/regulatory issues Disciplined, sustainable growth for more than 9 years Focused on building and testing processes and systems before large transaction volumes Distinctive expertise and full range of capabilities across mortgage banking and investment management Loan production, e.g., loan fulfillment systems and operations, correspondent counterparty review and management Credit, e.g., loan program development, underwriting and quality control Capital markets, e.g., pooling and securitization, hedging/interest rate risk management Servicing, e.g., customer service, default management, investor accounting Corporate functions, e.g., enterprise risk management, internal audit, treasury, finance and accounting, legal, IT infrastructure and development Over 3,000 employees Highly experienced management team – 50 senior-most executives have, on average, 26 years of relevant industry experience Strong governance and compliance culture Led by distinguished board which includes seven independent Directors Robust management governance structure with 10 committees that oversee key risks and controls External oversight by regulators, business partners and other third parties Desired structure in place to compete effectively as a non-bank Synergistic partnership with PMT, a leading residential mortgage REIT and long-term investment vehicle Provides access to efficient capital and reduces balance sheet constraints on growth |
|
|
Opportunity in MSR Acquisitions 23 Why Are MSR Sales Occurring? How Do MSRs Come to Market? Large servicers may sell MSRs due to continuing operational pressures, higher regulatory capital requirements for banks (treatment under Basel III) and a re-focus on core customers/businesses Independent mortgage banks sell MSRs from time to time due to a need for capital Intermittent large bulk portfolio sales ($10+ billion in UPB) Require considerable coordination with selling institutions and Agencies Mini-bulk sales (typically $500 million to $5 billion in UPB) Flow/co-issue MSR transactions (monthly commitments, typically $20-$100 million in UPB) Alternative delivery method typically from larger independent originators Which MSR Transactions Are Attractive? GSE and Ginnie Mae servicing in which PFSI has distinctive expertise MSRs sold and operational servicing transferred to PFSI (not subserviced by a third party) Measurable rep and warranty liability for PFSI PFSI is uniquely positioned to be a successful acquirer of MSRs Proven track record of complex MSR and distressed loan transfers Operational platform that addresses the demands of the Agencies, regulators and financing partners Physical capacity in place to sustain servicing portfolio growth plans Potential co-investment opportunity for PMT in the ESS |
|
|
24 PFSI’s Mortgage Servicing Rights Investments in Partnership with PMT Excess Servicing Spread (e.g., 12.5bp) MSR Asset (e.g., 25bp servicing fee) Acquired by PFSI from Third-Party Seller(1) PMT has co-invested in Agency MSRs acquired from third-party sellers by PFSI; presently only related to certain Ginnie Mae MSRs PMT acquires the right to receive the ESS cash flows over the life of the underlying loans PFSI owns the MSRs and services the loans (1) The contractual servicer and MSR owner is PennyMac Loan Services, LLC, an indirect controlled subsidiary of PennyMac Financial Services, Inc. (2) Subject and subordinate to Agency rights (under the related servicer or issuer guide) and, as applicable, to PFSI’s pledge of MSRs under a note payable; does not change the contractual servicing fee paid by the Agency to the servicer. Excess Servicing Spread(2) Interest income from a portion of the contractual servicing fee Realized yield dependent on prepayment speeds and recapture Base MSR Income from a portion of the contractual servicing fee Also entitled to ancillary income Bears expenses of performing loan servicing activities Required to advance certain payments largely for delinquent loans Base MSR (e.g., 12.5bp) Acquired by PMT from PFSI(1) Example transaction: actual transaction details may vary materially |
|
|
Acquisitions, Originations, and Locks by Product 25 Note: Figures may not sum exactly due to rounding Unaudited ($ in millions) Correspondent Acquisitions Conventional $ 7,492 $ 4,632 $ 5,918 $ 6,530 $ 5,891 Government 12,544 9,280 10,392 10,873 9,505 Jumbo - - - - - Total $ 20,037 $ 13,912 $ 16,310 $ 17,403 $ 15,396 Correspondent Locks Conventional $ 6,925 $ 5,184 $ 7,022 $ 6,356 $ 6,293 Government 12,289 9,292 11,209 10,999 9,571 Jumbo - - - - - Total $ 19,215 $ 14,476 $ 18,231 $ 17,356 $ 15,864 Consumer Direct Originations Conventional $ 492 $ 305 $ 414 $ 513 $ 646 Government 1,548 730 855 1,008 996 Jumbo - - - - - Total $ 2,040 $ 1,035 $ 1,268 $ 1,522 $ 1,642 Consumer Direct Locks Conventional $ 698 $ 669 $ 805 $ 845 $ 947 Government 1,662 1,145 1,476 1,387 1,261 Jumbo 1 - - - - Total $ 2,362 $ 1,814 $ 2,280 $ 2,232 $ 2,209 Total acquisitions/originations $ 22,077 $ 14,947 $ 17,579 $ 18,925 $ 17,038 Total locks $ 21,576 $ 16,290 $ 20,511 $ 19,588 $ 18,073 UPB of loans $ 7,492 $ 4,632 $ 5,918 $ 6,530 $ 5,891 fulfilled for PMT 3Q17 4Q16 1Q17 2Q17 4Q17 |

