
Form 8-K REGENCY CENTERS CORP For: Jan 11
SECURITIES AND EXCHANGE COMMISSION
UNITED STATES
Washington, DC 20549
FORM 8-K
CURRENT REPORT
Pursuant to Section 13 or 15(d) of the Securities Exchange Act of 1934
Date of Report (Date of earliest event reported) January 11, 2018
REGENCY CENTERS CORPORATION
(Exact name of registrant as specified in its charter)
| Florida (Regency Centers Corporation) | 1-12298 (Regency Centers Corporation) | 59-3191743 (Regency Centers Corporation) | ||
| (State or other jurisdiction of incorporation) |
(Commission File Number) |
(IRS Employer Identification No.) | ||
| One Independent Drive, Suite 114 Jacksonville, Florida |
32202 | |||
| (Address of principal executive offices) | (Zip Code) | |||
Registrant’s telephone number including area code: (904)-598-7000
Not Applicable
(Former name or former address, if changed since last report)
Check the appropriate box below if the Form 8-K filing is intended to simultaneously satisfy the filing obligation of the registrant under any of the following provisions:
| ☐ | Written communications pursuant to Rule 425 under the Securities Act (17 CFR 230 .425) |
| ☐ | Soliciting material pursuant to Rule 14a-12 under the Exchange Act (17 CFR 240.14a-12) |
| ☐ | Pre-commencement communications pursuant to Rule 14d-2(b) under the Exchange Act (17 CFR 240.14d-2(b)) |
| ☐ | Pre-commencement communications pursuant to Rule 13e-4(c) under the Exchange Act (17 CFR 240.13e-4(c)) |
Indicate by check mark whether the registrant is an emerging growth company as defined in Rule 405 of the Securities Act of 1933 (§ 230.405 of this chapter) or Rule 12b-2 of the Securities Exchange Act of 1934 (§ 240.12b-2 of this chapter).
Emerging growth company ☐
If an emerging growth company, indicate by check mark if the registrant has elected not to use the extended transition period for complying with any new or revised financial accounting standards provided pursuant to Section 13(A) of the Exchange Act. ☐
| Item 2.02 | Regulation FD Disclosure. |
On January 11, 2018, Regency Centers Corporation (the “Company”) issued a press release announcing certain components of its initial 2018 earnings guidance and updating its previously announced 2017 earnings guidance. The press release also references a complete listing of guidance components posted on the Company’s investor relations website. A copy of the press release is furnished as Exhibit 99.1 to this report.
On January 11, 2018, the Company posted on its website, at www.regencycenters.com, the supplemental information for certain components of its initial 2018 earnings guidance and updating its previously announced 2017 earnings guidance, which is attached as Exhibit 99.2.
The information in this report, including the referenced presentation materials, shall not be deemed “filed” for the purposes of Section 18 of the Securities Exchange Act of 1934, nor shall it be deemed incorporated by reference into any disclosure document relating to the Company, except to the extent, if any, expressly set forth by specific reference in such filing.
Forward-Looking Statements
The furnished exhibits contain forward-looking statements that involve risks and uncertainties. Actual future performance, outcomes and results may differ materially from those expressed in forward-looking statements. Please refer to the documents filed by Regency Centers Corporation with the SEC, specifically the most recent reports on Forms 10-K and 10-Q, which identify important risk factors which could cause actual results to differ from those contained in the forward-looking statements.
| Item 9.01 | Financial Statements and Exhibits |
(d) Exhibits
Exhibit 99.1 Press release of Regency Centers Corporation dated January 11, 2018
Exhibit 99.2 Supplemental information posted on its website on January 11, 2018
2
SIGNATURES
Pursuant to the requirements of the Securities Exchange Act of 1934, the registrant has duly caused this report to be signed on its behalf by the undersigned hereunto duly authorized.
| REGENCY CENTERS CORPORATION (registrant) | ||||||||
| January 11, 2018 | By: | /s/ J. Christian Leavitt | ||||||
| J. Christian Leavitt, Senior Vice President Finance and Principal Accounting Officer | ||||||||
3
Exhibit 99.1

|
NEWS RELEASE For immediate release
Laura Clark 904 598 7831 |
Regency Centers Updates 2017 and Introduces 2018 Earnings Guidance
JACKSONVILLE, Fla. (January 11, 2018) – Regency Centers Corporation (“Regency” or the “Company”) today announced updated 2017 and initial full-year 2018 earnings guidance (“Guidance”). Selected items are listed herein and a complete listing of guidance components is available on the Company’s website at investors.regencycenters.com.
Updated Full-Year 2017 Guidance
| Previous Guidance |
Updated Guidance | |||
|
Net Income Attributable to Common Stockholders (“Net Income”) |
$0.76 – $0.81 | $1.00 – $1.02 | ||
|
NAREIT Funds From Operations (“NAREIT FFO”) per diluted share |
$3.00 – $3.05 | $3.09 – $3.11 | ||
|
Core Funds From Operations (“Core FFO”) per diluted share |
$3.66 – $3.70 | $3.68 – $3.70 | ||
|
Same Property Net Operating Income (“SPNOI”) Growth excluding termination fees (pro-rata) |
3.2% – 4.0% | +/- 3.6% |
Initial Full-Year 2018 Guidance
| Net Income Attributable to Common Stockholders (“Net Income”) |
$1.47 – $1.56 | |
|
NAREIT Funds From Operations (“NAREIT FFO”) per diluted share |
$3.73 – $3.82 | |
|
Core Funds From Operations (“Core FFO”) per diluted share |
$3.76 – $3.83 | |
|
Operating Funds From Operations (“Operating FFO”) per diluted share |
$3.48 – $3.54 | |
|
Same Property Net Operating Income (“SPNOI”) Growth excluding termination fees (pro-rata) |
2.25% – 3.25% |
Updated 2017 and Initial 2018 Guidance
Net Income
The Company’s updated 2017 Net Income guidance includes incurred costs of approximately $0.51 per diluted share associated with the merger of Regency and Equity One, Inc. No additional costs are anticipated in 2018. 2018 Net Income is expected to be $1.47 to $1.56 per diluted share.
NAREIT FFO
The Company’s updated 2017 NAREIT FFO guidance includes incurred costs of approximately $0.51 per diluted share associated with the merger of Regency and Equity One, Inc. No additional transaction costs are anticipated in 2018. The increase in 2017 NAREIT FFO compared to previous guidance is primarily attributed to recognizing the tax benefit from adjustment to the deferred tax liability balances in the Company’s taxable REIT subsidiaries as a result of the recent tax law changes. 2018 NAREIT FFO is expected to be $3.73 to $3.82 per diluted share.
Core FFO and Introduction of Operating FFO
2017 Core FFO is now expected to be in the range of $3.68 to $3.70 per diluted share. The Company expects 2018 Core FFO to be $3.76 to $3.83 per diluted share.
In 2017, Regency completed its merger with Equity One. Due to purchase accounting adjustments required with the merger under Accounting Standards Codification 805, specifically related to the requirement to mark-to-market all Equity One leases or approximately 35% of Regency’s total rent, non-cash accounting adjustments will have a disproportionate impact on earnings. Regency management operates its business and makes financial decisions based upon earnings before the impact of these non-cash accounting adjustments. Therefore, Regency is introducing Operating Funds From Operations (“Operating FFO”), an earnings metric used by the Company to measure earnings growth.
Operating FFO will continue to exclude certain non-comparable items that affect the Company’s period-over-period performance consistent with the existing definition of Core FFO. The non-cash items that will be excluded from NAREIT FFO in the determination of Operating FFO are amortization of above and below market rent, straight-line rent and amortization of mark-to-market debt adjustments. The Company will provide guidance on Operating FFO on a go-forward basis. 2018 Operating FFO is expected to be $3.48 to $3.54 per diluted share.
Additional detail including a 2018 roll forward of Core FFO, a reconciliation of Operating FFO, and an Operating FFO historical lookback is provided in the guidance supplemental package on the Company’s website.
Update on Investment Activity
Update on 2017 Investment Activity
During fourth quarter 2017, the Company closed on approximately $150 million of acquisitions.
| • | Scripps Ranch Marketplace (San Diego, CA) – In December, Regency acquired Scripps Ranch Marketplace, a 132,000 square foot neighborhood shopping center anchored by Vons for $81.6 million. |
| • | Roosevelt Square (Seattle, WA) – In December, the Company closed on Roosevelt Square, a 150,000 square foot infill retail center anchored by Whole Foods Market for $68.3 million. |
During the fourth quarter of 2017, Regency sold five shopping centers, generating approximately $103 million of gross proceeds. Dispositions included in previously released 2017 disposition guidance that did not close as of year-end are included in 2018 disposition guidance and are now expected to close in early 2018.
During the fourth quarter of 2017, Regency started the development of two projects, with the Company’s share of net estimated development costs totaling $39 million. The first project, Midtown East, is a 174,000 square foot, Wegmans anchored shopping center located in Raleigh, NC. The second development, Indigo Square, is a 51,000 square foot Publix Greenwise anchored shopping center located in Charleston, SC.
Investment Activity Subsequent to Year-end
In 2018, Regency has closed on approximately $34 million of acquisitions to date and started $31 million of developments.
| • | Ballard Blocks I & II (Seattle, WA) – In January 2018, the Company acquired a 50% equity interest in Ballard Blocks I, an operating 132,000 square foot shopping center, anchored by Trader Joe’s, for $27.3 million. Regency also acquired a 50% interest in adjacent land, and concurrently announced the start of Ballard Blocks II, an 114,000 square foot joint venture development anchored by PCC Community Markets. Regency’s pro-rata share of estimated development costs in Ballard II is $31.1 million. |
| • | The District at Metuchen (Metuchen, NJ) – In January 2018, Regency and a co-investment partner acquired District at Metuchen, a 67,000 square foot Whole Foods anchored shopping center located in the New York metro area for a gross purchase price of $33.8 million. The Company’s share of the purchase price was $6.8 million. |
Capital Markets
Equity Offerings
As previously disclosed, on December 14, 2017 the final settlement of the Company’s forward sale agreement occurred. Regency received approximately $89.1 million of net proceeds after adjustments for interest, dividends and the underwriters’ discount but before deducting offering expenses, by delivering 1,250,000 shares of the Company’s common stock.
2018 Investor Day
The Company will host its 2018 Investor Day on Thursday, January 11, 2018 at 12:30 p.m. ET. Webcast information is available on the Company’s website at investors.regencycenters.com.
Reconciliation of Net Income Attributable to Common Stockholders to NAREIT FFO, Core FFO and Operating FFO
| Reconciliation of Net Income to Operating FFO |
Full Year 2017 |
Full Year 2018 |
||||||||||||||
| Net income attributable to common stockholders |
$ | 1.00 | 1.02 | $ | 1.47 | 1.56 | ||||||||||
| Adjustments to reconcile net income to NAREIT FFO: |
||||||||||||||||
| Depreciation and amortization |
2.28 | 2.28 | 2.26 | 2.26 | ||||||||||||
| Gain on sale of operating properties |
(0.19 | ) | (0.19 | ) | 0.00 | 0.00 | ||||||||||
|
|
|
|
|
|
|
|
|
|||||||||
| NAREIT Funds From Operations |
$ | 3.09 | 3.11 | $ | 3.73 | 3.82 | ||||||||||
|
|
|
|
|
|
|
|
|
|||||||||
| Adjustments to reconcile NAREIT FFO to Core FFO: |
||||||||||||||||
| Development pursuit costs |
0.00 | 0.00 | 0.01 | 0.01 | ||||||||||||
| Gain on sale of land |
(0.03 | ) | (0.03 | ) | 0.00 | 0.00 | ||||||||||
| Provision for income taxes |
(0.06 | ) | (0.06 | ) | 0.00 | 0.00 | ||||||||||
| Early extinguishment of debt |
0.08 | 0.08 | 0.00 | 0.00 | ||||||||||||
| Merger related costs |
0.51 | 0.51 | 0.00 | 0.00 | ||||||||||||
| Preferred redemption costs |
0.08 | 0.08 | 0.00 | 0.00 | ||||||||||||
| Hurricane losses |
0.01 | 0.01 | 0.00 | 0.00 | ||||||||||||
| Other non-core costs |
0.00 | 0.00 | 0.02 | 0.00 | ||||||||||||
|
|
|
|
|
|
|
|
|
|||||||||
| Core Funds From Operations |
$ | 3.68 | $ | 3.70 | $ | 3.76 | $ | 3.83 | ||||||||
|
|
|
|
|
|
|
|
|
|||||||||
| Adjustments to reconcile Core FFO to Operating FFO: |
||||||||||||||||
| Straight-line rents, net |
(0.11 | ) | (0.11 | ) | (0.09 | ) | (0.10 | ) | ||||||||
| Above/Below market rent amortization |
(0.15 | ) | (0.16 | ) | (0.16 | ) | (0.16 | ) | ||||||||
| Amortization of mark-to-market debt adjustments |
(0.02 | ) | (0.02 | ) | (0.02 | ) | (0.02 | ) | ||||||||
| Development pursuit costs charged to OFFO |
0.00 | 0.00 | (0.01 | ) | (0.01 | ) | ||||||||||
|
|
|
|
|
|
|
|
|
|||||||||
| Operating Funds From Operations |
$ | 3.40 | $ | 3.41 | $ | 3.48 | $ | 3.54 | ||||||||
|
|
|
|
|
|
|
|
|
|||||||||
Non-GAAP Disclosure
The Company uses certain non-GAAP performance measures, in addition to the required GAAP presentations, as it believes these measures improve the understanding of the Company’s operational results. Regency manages its entire real estate portfolio without regard to ownership structure, although certain decisions impacting properties owned through partnerships require partner approval. Therefore, the Company believes presenting its pro-rata share of operating results regardless of ownership structure, along with other non-GAAP measures, makes comparisons of other REITs’ operating results to the Company’s more meaningful. Management continually evaluates the usefulness, relevance, limitations, and calculation of the Company’s reported non-GAAP performance measures to determine how best to provide relevant information to the public, and thus such reported measures could change.
NAREIT FFO is a commonly used measure of REIT performance, which the National Association of Real Estate Investment Trusts (“NAREIT”) defines as net income, computed in accordance with GAAP, excluding gains and losses from dispositions of depreciable property, net of tax, excluding operating real estate impairments, plus depreciation and amortization, and after adjustments for unconsolidated partnerships and joint ventures. Regency computes NAREIT FFO for all periods presented in accordance with NAREIT’s definition. Many companies use different depreciable lives and methods, and real estate values historically fluctuate with market conditions. Since NAREIT FFO excludes depreciation and amortization and gains and losses from depreciable property dispositions, and impairments, it can provide a performance measure that, when compared year over year, reflects the impact on operations from trends in occupancy rates, rental rates, operating costs, acquisition and development activities, and financing costs. This provides a perspective of the Company’s financial performance not immediately apparent from net income determined in accordance with GAAP. Thus, NAREIT FFO is a supplemental non-GAAP financial measure of the Company’s operating performance, which does not represent cash generated from operating activities in accordance with GAAP and therefore, should not be considered a substitute measure of cash flows from operations. Core FFO and Operating FFO are additional performance measures used by Regency as the computation of NAREIT FFO includes certain non-cash and non-comparable items that affect the Company’s period-over-period performance. Core FFO excludes from NAREIT FFO: (a) transaction related income or expenses; (b) impairments on land; (c) gains or losses from the early extinguishment of debt; (d) development pursuit costs; and (e) other non-comparable amounts as they occur. Operating FFO excludes from Core FFO: (a) non-cash components of earnings derived from above and below market rent amortization, straight-line rents, and amortization of mark-to-market of debt adjustments; and includes (b) development pursuit costs. The Company provides a reconciliation of Net Income to NAREIT FFO to Core FFO to Operating FFO.
About Regency Centers Corporation (NYSE: REG)
Regency Centers is the preeminent national owner, operator, and developer of shopping centers located in affluent and densely populated trade areas. Our portfolio includes thriving properties merchandised with highly productive grocers, restaurants, service providers, and best-in-class retailers that connect to their neighborhoods, communities, and customers. Operating as a fully integrated real estate company, Regency Centers is a qualified real estate investment trust (REIT) that is self-administered, self-managed, and an S&P 500 Index member. For more information, please visit regencycenters.com.
###
Forward-looking statements involve risks and uncertainties. Actual future performance, outcomes and results may differ materially from those expressed in forward-looking statements. Please refer to the documents filed by Regency Centers Corporation with the SEC, specifically the most recent reports on Forms 10-K and 10-Q, which identify important risk factors which could cause actual results to differ from those contained in the forward-looking statements.
Exhibit 99.2

|
January 11, 2018
2018 EARNINGS & VALUATION GUIDANCE
|
Forward-Looking Statements
Forward-looking statements involve risks and uncertainties. Actual future performance, outcomes and results may differ materially from those expressed in forward-looking
statements. Please refer to the documents filed by Regency Centers Corporation (“Regency” or the “Company”) with the Securities and Exchange Commission (“SEC”), specifically the most recent reports on Forms 10-K and 10-Q, which identify important risk factors which could cause actual results to differ from those contained in the forward-looking statements.
Regency Centers 2018 Earnings and Valuation Guidance 1
|
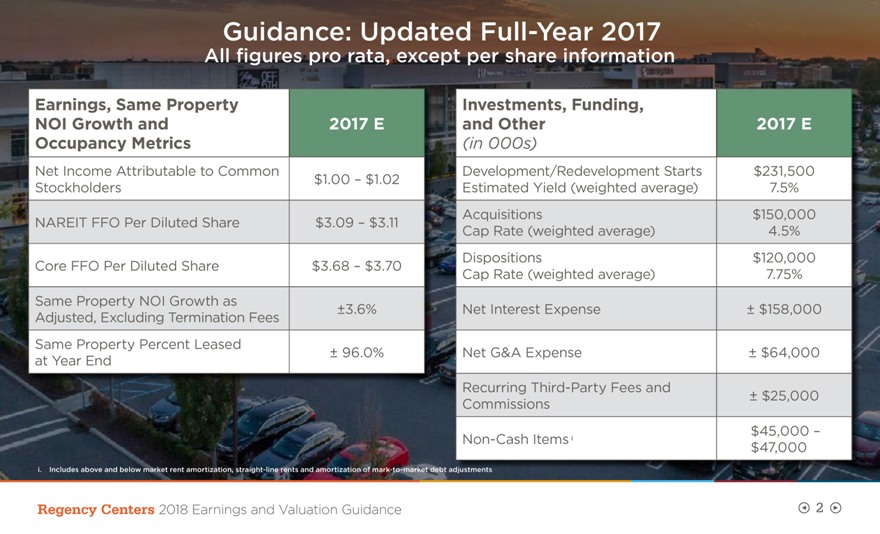
Guidance: Updated Full-Year 2017
All figures pro rata, except per share information
Earnings, Same Property Investments,
Funding,
NOI Growth and 2017 E and Other 2017 E Occupancy Metrics (in 000s)
Net Income Attributable to Common Development/Redevelopment Starts $231,500 $1.00 – $1.02 Stockholders Estimated Yield (weighted average) 7.5% Acquisitions
$150,000 NAREIT FFO Per Diluted Share $3.09 – $3.11 Cap Rate (weighted average) 4.5% Dispositions $120,000 Core FFO Per Diluted Share $3.68 – $3.70 Cap Rate (weighted average) 7.75% Same Property NOI Growth as ±3.6% Net Interest
Expense ± $158,000 Adjusted, Excluding Termination Fees Same Property Percent Leased
± 96.0% Net G&A Expense ± $64,000 at Year End
Recurring Third-Party Fees and
± $25,000 Commissions $45,000 – Non-Cash Itemsi $47,000
i. Includes above and below market rent amortization, straight-line rents and amortization of
mark-to-market debt adjustments
Regency Centers 2018 Earnings and Valuation
Guidance 2
|
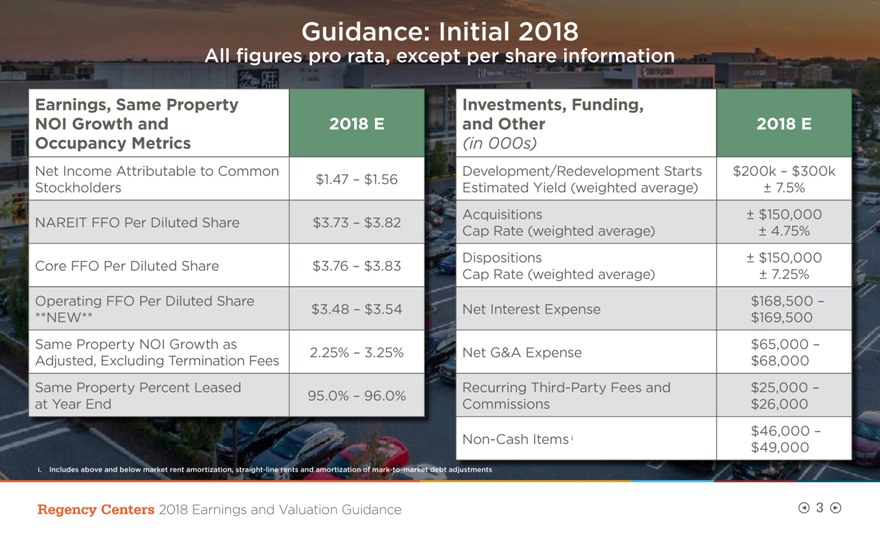
Guidance: Initial 2018
All figures pro rata, except per share information
Earnings, Same Property Investments,
Funding,
NOI Growth and 2018 E and Other 2018 E Occupancy Metrics (in 000s)
Net Income Attributable to Common Development/Redevelopment Starts $200k – $300k $1.47 – $1.56 Stockholders Estimated Yield (weighted average) ±
7.5% Acquisitions ± $150,000 NAREIT FFO Per Diluted Share $3.73 – $3.82 Cap Rate (weighted average) ± 4.75% Dispositions ± $150,000 Core FFO Per Diluted Share $3.76 – $3.83 Cap Rate (weighted average) ± 7.25%
Operating FFO Per Diluted Share $168,500 – $3.48 – $3.54 Net Interest Expense **NEW** $169,500 Same Property NOI Growth as $65,000 – 2.25% – 3.25% Net G&A Expense Adjusted, Excluding Termination Fees $68,000 Same Property
Percent Leased Recurring Third-Party Fees and $25,000 – 95.0% – 96.0% at Year End Commissions $26,000 $46,000 – Non-Cash Itemsi $49,000
i. Includes above and below market rent amortization, straight-line rents and amortization of
mark-to-market debt adjustments
Regency Centers 2018 Earnings and Valuation
Guidance 3
|
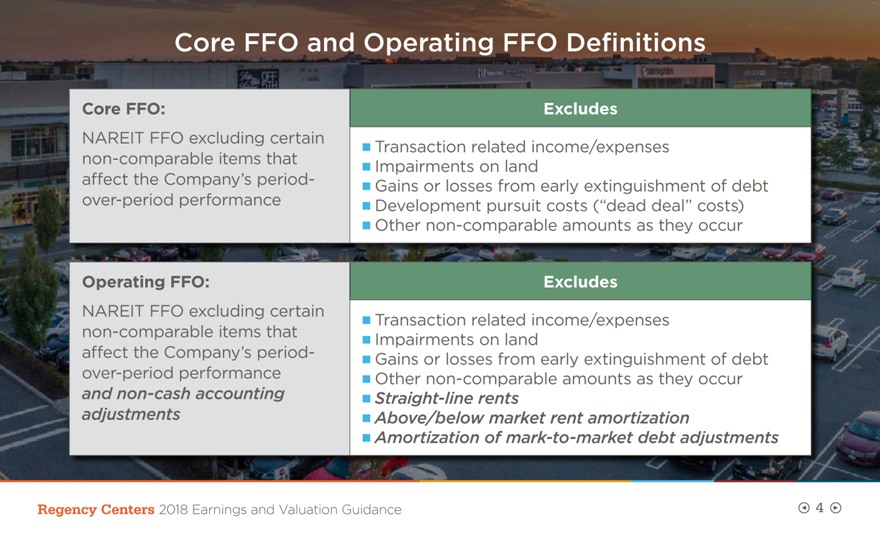
Core FFO and Operating FFO Definitions
Core FFO: Excludes
NAREIT FFO excluding certain
Transaction related income/expenses non-comparable items that Impairments on land affect the Company’s period-
Gains or losses from early extinguishment of debt over-period performance Development pursuit costs (“dead deal” costs) Other
non-comparable amounts as they occur
Operating FFO: Excludes
NAREIT FFO excluding certain
Transaction related income/expenses non-comparable items that Impairments on land affect the Company’s period-
Gains or losses from early extinguishment of debt
over-period performance Other non-comparable amounts as they occur and non-cash accounting Straight-line rents adjustments Above/below market rent amortization
Amortization of mark-to-market debt adjustments
Regency Centers 2018 Earnings and
Valuation Guidance 4
|
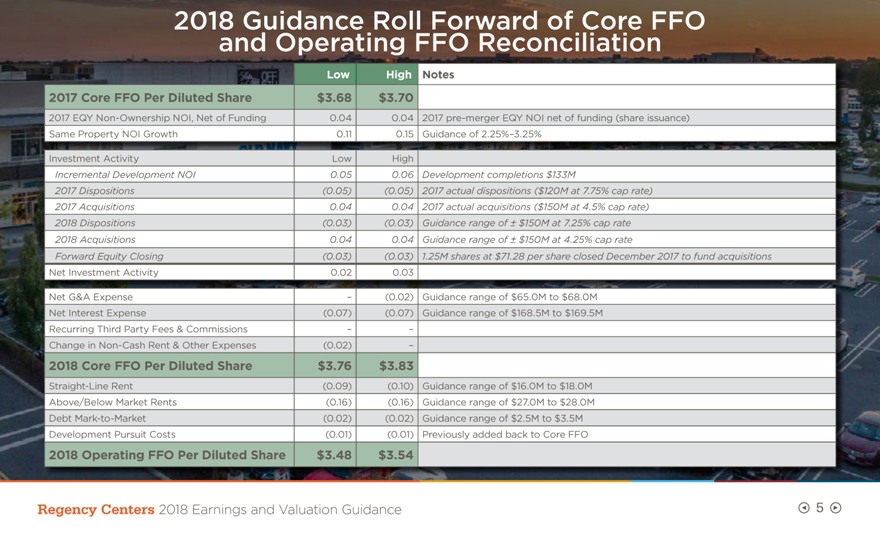
2018 Guidance Roll Forward of Core FFO and Operating
FFO Reconciliation
Low High Notes
2017 Core FFO Per Diluted Share $3.68 $3.70
2017 EQY Non-Ownership NOI, Net of Funding 0.04 0.04 2017 pre-merger EQY NOI net of
funding (share issuance) Same Property NOI Growth 0.11 0.15 Guidance of 2.25%–3.25%
Investment Activity Low High
Incremental Development NOI 0.05 0.06 Development completions $133M
2017 Dispositions (0.05)
(0.05) 2017 actual dispositions ($120M at 7.75% cap rate) 2017 Acquisitions 0.04 0.04 2017 actual acquisitions ($150M at 4.5% cap rate) 2018 Dispositions (0.03) (0.03) Guidance range of ± $150M at 7.25% cap rate 2018 Acquisitions 0.04 0.04
Guidance range of ± $150M at 4.25% cap rate
Forward Equity Closing (0.03) (0.03) 1.25M shares at $71.28 per share closed December 2017 to fund acquisitions
Net Investment Activity 0.02 0.03
Net G&A Expense – (0.02) Guidance
range of $65.0M to $68.0M Net Interest Expense (0.07) (0.07) Guidance range of $168.5M to $169.5M Recurring Third Party Fees & Commissions – –Change in Non-Cash Rent & Other
Expenses (0.02) –
2018 Core FFO Per Diluted Share $3.76 $3.83
Straight-Line Rent (0.09) (0.10) Guidance range of $16.0M to $18.0M Above/Below Market Rents (0.16) (0.16) Guidance range of $27.0M to $28.0M Debt Mark-to-Market (0.02) (0.02) Guidance range of $2.5M to $3.5M Development Pursuit Costs (0.01) (0.01) Previously added back to Core FFO
2018 Operating FFO Per Diluted Share $3.48 $3.54
Regency Centers 2018 Earnings and Valuation
Guidance 5
|
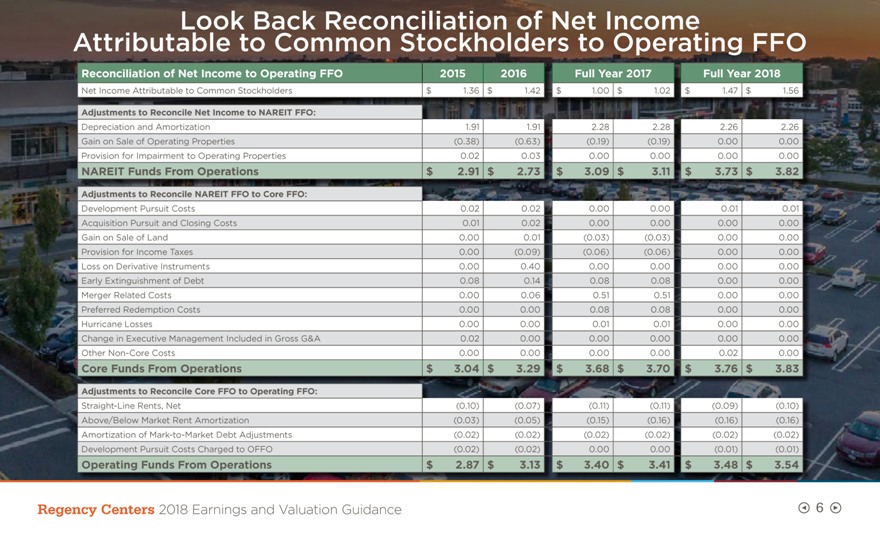
Look Back Reconciliation of Net Income Attributable
to Common Stockholders to Operating FFO
Reconciliation of Net Income to Operating FFO 2015 2016 Full Year 2017 Full Year 2018
Net Income Attributable to Common Stockholders $ 1.36 $ 1.42 $ 1.00 $ 1.02 $ 1.47 $ 1.56
Adjustments to Reconcile Net Income to NAREIT FFO:
Depreciation and
Amortization 1.91 1.91 2.28 2.28 2.26 2.26 Gain on Sale of Operating Properties (0.38) (0.63) (0.19) (0.19) 0.00 0.00 Provision for Impairment to Operating Properties 0.02 0.03 0.00 0.00 0.00 0.00
NAREIT Funds From Operations $ 2.91 $ 2.73 $ 3.09 $ 3.11 $ 3.73 $ 3.82
Adjustments to
Reconcile NAREIT FFO to Core FFO:
Development Pursuit Costs 0.02 0.02 0.00 0.00 0.01 0.01 Acquisition Pursuit and Closing Costs 0.01 0.02 0.00 0.00 0.00 0.00 Gain
on Sale of Land 0.00 0.01 (0.03) (0.03) 0.00 0.00 Provision for Income Taxes 0.00 (0.09) (0.06) (0.06) 0.00 0.00 Loss on Derivative Instruments 0.00 0.40 0.00 0.00 0.00 0.00 Early Extinguishment of Debt 0.08 0.14 0.08 0.08 0.00 0.00 Merger Related
Costs 0.00 0.06 0.51 0.51 0.00 0.00 Preferred Redemption Costs 0.00 0.00 0.08 0.08 0.00 0.00 Hurricane Losses 0.00 0.00 0.01 0.01 0.00 0.00 Change in Executive Management Included in Gross G&A 0.02 0.00 0.00 0.00 0.00 0.00 Other Non-Core Costs 0.00 0.00 0.00 0.00 0.02 0.00
Core Funds From Operations $ 3.04 $ 3.29 $ 3.68 $ 3.70 $ 3.76 $ 3.83
Adjustments to Reconcile Core FFO to Operating FFO:
Straight-Line Rents, Net (0.10) (0.07)
(0.11) (0.11) (0.09) (0.10) Above/Below Market Rent Amortization (0.03) (0.05) (0.15) (0.16) (0.16) (0.16) Amortization of Mark-to-Market Debt Adjustments (0.02) (0.02)
(0.02) (0.02) (0.02) (0.02) Development Pursuit Costs Charged to OFFO (0.02) (0.02) 0.00 0.00 (0.01) (0.01)
Operating Funds From Operations $ 2.87 $ 3.13 $ 3.40 $
3.41 $ 3.48 $ 3.54
Regency Centers 2018 Earnings and Valuation Guidance 6
|
Non-GAAP
Disclosure
The Company uses certain non-GAAP performance measures, in addition to the required GAAP presentations, as it
believes these measures improve the understanding of the Company’s operational results. Regency manages its entire real estate portfolio without regard to ownership structure, although certain decisions impacting properties owned through
partnerships require partner approval. Therefore, the Company believes presenting its pro-rata share of operating results regardless of ownership structure, along with other
non-GAAP measures, makes comparisons of other REITs’ operating results to the Company’s more meaningful. Management continually evaluates the usefulness, relevance, limitations, and calculation of
the Company’s reported non-GAAP performance measures to determine how best to provide relevant information to the public, and thus such reported measures could change. NAREIT FFO is a commonly used
measure of REIT performance, which the National Association of Real Estate Investment Trusts (“NAREIT”) defines as net income, computed in accordance with GAAP, excluding gains and losses from dispositions of depreciable property, net of
tax, excluding operating real estate impairments, plus depreciation and amortization, and after adjustments for unconsolidated partnerships and joint ventures. Regency computes NAREIT FFO for all periods presented in accordance with NAREIT’s
definition. Many companies use different depreciable lives and methods, and real estate values historically fluctuate with market conditions. Since NAREIT FFO excludes depreciation and amortization and gains and losses from depreciable property
dispositions, and impairments, it can provide a performance measure that, when compared year over year, reflects the impact on operations from trends in occupancy rates, rental rates, operating costs, acquisition and development activities, and
financing costs. This provides a perspective of the Company’s financial performance not immediately apparent from net income determined in accordance with GAAP. Thus, NAREIT FFO is a supplemental non-GAAP
financial measure of the Company’s operating performance, which does not represent cash generated from operating activities in accordance with GAAP and therefore, should not be considered a substitute measure of cash flows from operations. Core
FFO and Operating FFO are additional performance measures used by Regency as the computation of NAREIT FFO includes certain non-cash and non-comparable items that affect
the Company’s period-over-period performance. Core FFO excludes from NAREIT FFO: (a) transaction related income or expenses; (b) impairments on land; (c) gains or losses from the early extinguishment of debt; (d) development
pursuit costs; and (e) other non-comparable amounts as they occur. Operating FFO excludes from Core FFO: (a) non-cash components of earnings derived from above
and below market rent amortization, straight-line rents, and amortization of mark-to-market of debt adjustments; and includes (b) development pursuit costs. The
Company provides a reconciliation of Net Income to NAREIT FFO to Core FFO to Operating FFO.
Regency Centers 2018 Earnings and Valuation Guidance 7