

Form FWP Xtant Medical Holdings, Filed by: Xtant Medical Holdings, Inc.
 Tweet
Tweet Share
ShareFREE WRITING PROSPECTUS
Filed Pursuant to Rule 433
Issuer Free Writing Prospectus dated September 29, 2016
Registration No. 333-213350
FREE WRITING PROSPECTUS
Xtant Medical Holdings, Inc. Company Presentation
This presentation highlights basic information about Xtant Medical Holdings, Inc. Because it is a summary, it does not contain all the information you should consider before investing.
We have filed a registration statement (including a prospectus) with the SEC for the offering to which this presentation relates. The registration statement has not yet become effective. Before you invest, you should read the prospectus included in the registration statement (including the risk factors described therein) and other documents we have filed with the SEC for more complete information about us and the offering. You may get these documents for free by visiting EDGAR on the SEC website at http://www.sec.gov.
The preliminary prospectus, dated September 28, 2016, can also be accessed through the following link:
https://www.sec.gov/Archives/edgar/data/1453593/000114420416125750/v449443_s1a.htm.
Alternatively, Xtant Medical Holdings, Inc. or the dealer-manager participating in the offering will arrange to send you the prospectus if you contact Maxim Group, LLC, Maxim Group LLC, Prospectus Department, 405 Lexington Ave., New York, NY, 10174; Telephone: (212)-895-3745: Email: [email protected].

Encompassing Excellence NYSE MKT: XTNT September/October 2016 Investor Presentation NYSE MKT: XTNT | September/October 2016 1
Important Cautions Regarding Forward Looking Statements This presentation contains certain disclosures that may be deemed forward - looking statements within the meaning of the Private S ecurities Litigation Reform Act of 1995 that are subject to significant risks and uncertainties. Forward - looking statements include statements that are predictive in nature, that depend upon or refer to future events or conditions, or that include words such as "continue," "efforts," "expects," "anticipates," "intends," "plans," "believes," "estimates," "projects," "forecasts," "strategy," "will," "goal," "target," "p ros pects," "potential," "optimistic," "confident," "likely," "probable" or similar expressions or the negative thereof. Statements of historical fact also may be deemed to be forward - looking statements. You are cautioned not to pl ace undue reliance on forward - looking statements that speak only as of the date on which they are made. Forward - looking statements reflect management’s current estimates, projections, expectations and be liefs, and are subject to risks and uncertainties outside of our control that may cause actual results to differ materially from what is indicated in those forward - looking statements. These statements by their nature involve risks and uncertainties, and actual results may differ materially depending on a var iet y of important factors, including, among others, the occurrence of the risks described in the "Risk Factors" section of our most recent quarterly report on Form 10 - Q filed with the U.S. Securities and Exch ange Commission. In addition to those factors, the following factors, among others could cause our actual results to differ materially from forward - looking or actual performance: our ability to integrate X - spine’s business and realize the projected benefits of the transaction; our ability to meet our obligations under existing and anticipated contractual obligations, including financial covenants and other obligations in our secured lending facility; our ability to manage cash flow; the ability of our sales force to achieve expected results; and other factors. We assume no duty to update any forward - looking statements. Annualized, pro forma, projected and estimated numbers used in this presentation are used only for illustrative purposes and are not forecasts and may not reflect actual results. This presentation contains certain supplemental measures of performance, such as EBITDA, that are not required by, or present ed in accordance with, generally accepted accounting principles in the United States ("GAAP"). Such measures should not be considered as replacements of GAAP. Further information with respect to and reco nci liations of such measures to the nearest GAAP measure can be found in the Company’s historical filings with the Securities and Exchange Commission Any market or industry data contained in this presentation is based on a variety of sources, including internal data and estimates, independent industry publications, government publicati ons , reports by market research firms or other published independent sources. Industry publications and other published sources generally state that th e information contained therein has been obtained from third - party sources believed to be reliable, but there can be no assurance as to the accuracy or completeness of such information. Our internal d ata and estimates are based upon information obtained from trade and business organizations and other contacts in the markets in which we operate and management's understanding of industry conditions, an d s uch information has not been verified by any independent sources. Accordingly, investors should not place undue reliance on such data and information. NYSE MKT: XTNT | September/October 2016 2
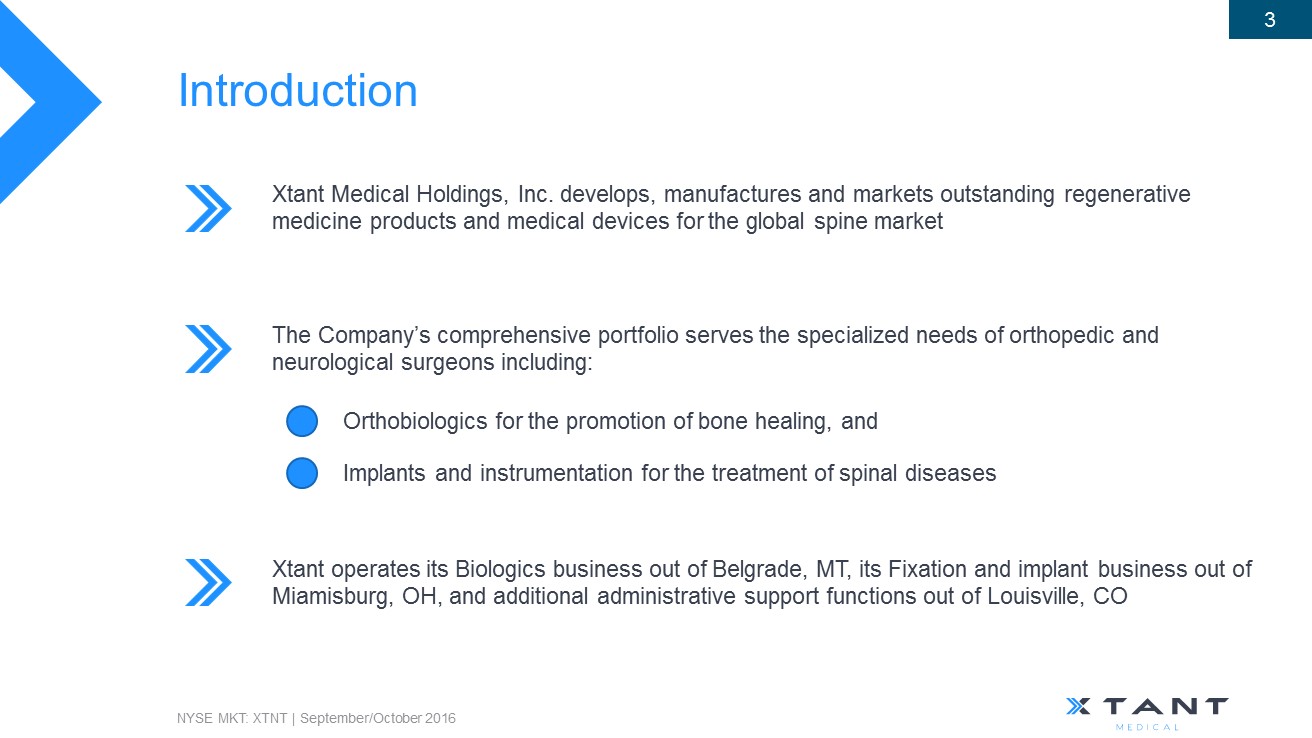
Introduction NYSE MKT: XTNT | September/October 2016 3 The Company’s comprehensive portfolio serves the specialized needs of orthopedic and neurological surgeons including: Orthobiologics for the promotion of bone healing, and Implants and instrumentation for the treatment of spinal diseases Xtant operates its B iologics business out of Belgrade, MT, its Fixation and implant business out of Miamisburg, OH, and additional administrative support functions out of Louisville, CO Xtant Medical Holdings, Inc. develops, manufactures and markets outstanding regenerative medicine products and medical devices for the global spine market

Comprehensive and Diversified Product Portfolio NYSE MKT: XTNT | September/October 2016 4 ANTERIOR CERVICAL FIXATION POSTERIOR CERVICAL/THORACIC SACROILIAC FUSION FIXATION BIOLOGICS THORACOLUMBAR INTERBODY This image cannot currently be displayed. THORACOLUMBAR STRUCTURAL ALLOGRAFT ANTERIOR CERVICAL INTERBODY THORACOLUMBAR FIXATION CERVICAL STRUCTURAL ALLOGRAFT CERVICAL, THORACOLUMBAR & SACROILIAC FUSION BIOLOGICS

Large US Market Opportunity 1 Source: BioMed GPS 2014 2 Source: iData 2014 NYSE MKT: XTNT | September/October 2016 5

Revenue Mix NYSE MKT: XTNT | September/October 2016 6

Operating Results NYSE MKT: XTNT | September/October 2016 7 Increasing Gross Margins $20.9M 3Q15* $22.3M 4Q15 $21.0M 1Q16 $21.5M 2Q16 65.5% 3Q15* 67.0% 4Q15 67.2% 1Q16 68.5% 2Q16 Revenue Gross Margin * 3Q15 Results are presented as pro forma consolidated, all other data is as reported; all are unaudited
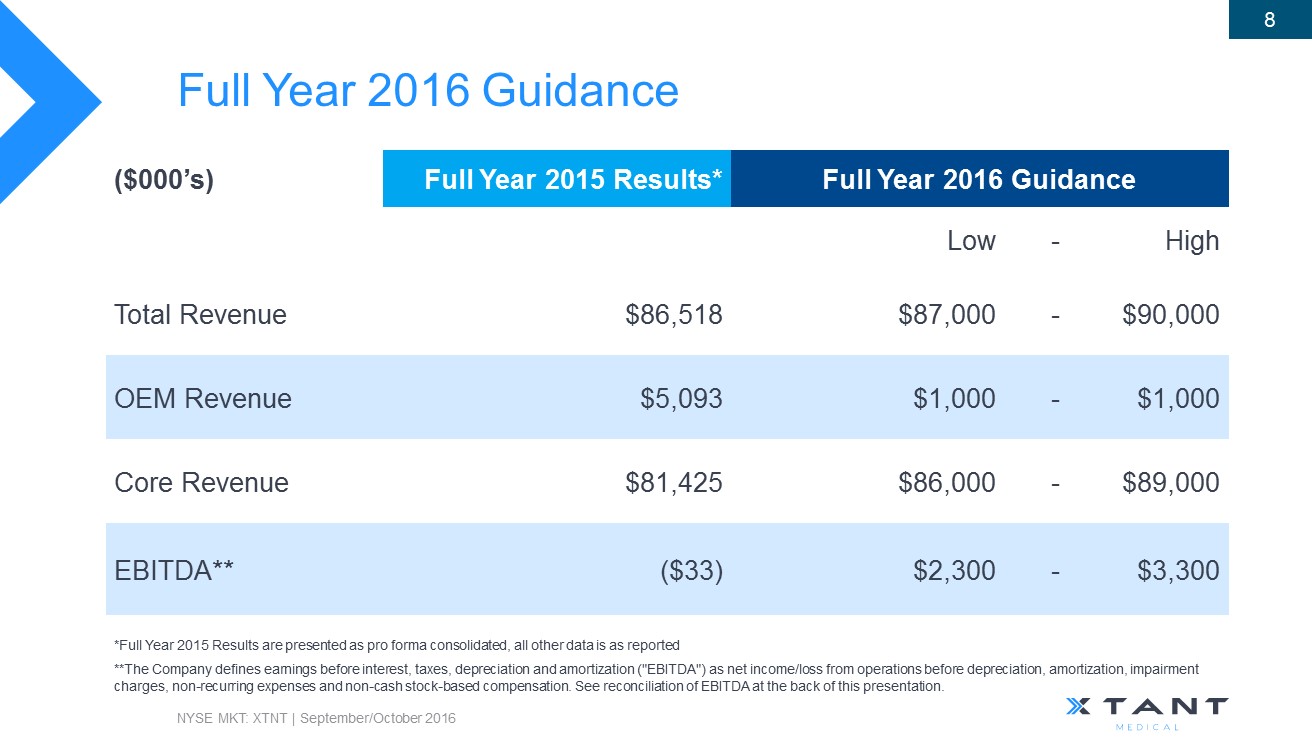
Full Year 2016 Guidance NYSE MKT: XTNT | September/October 2016 8 **The Company defines earnings before interest, taxes, depreciation and amortization ("EBITDA") as net income/loss from operations bef ore depreciation, amortization, impairment charges, non - recurring expenses and non - cash stock - based compensation . See reconciliation of EBITDA at the back of this presentation. ($000’s) Full Year 2015 Results* Full Year 2016 Guidance Low - High Total Revenue $86,518 $87,000 - $90,000 OEM Revenue $5,093 $1,000 - $1,000 Core Revenue $81,425 $86,000 - $89,000 EBITDA** ($33) $2,300 - $3,300 *Full Year 2015 Results are presented as pro forma consolidated, all other data is as reported
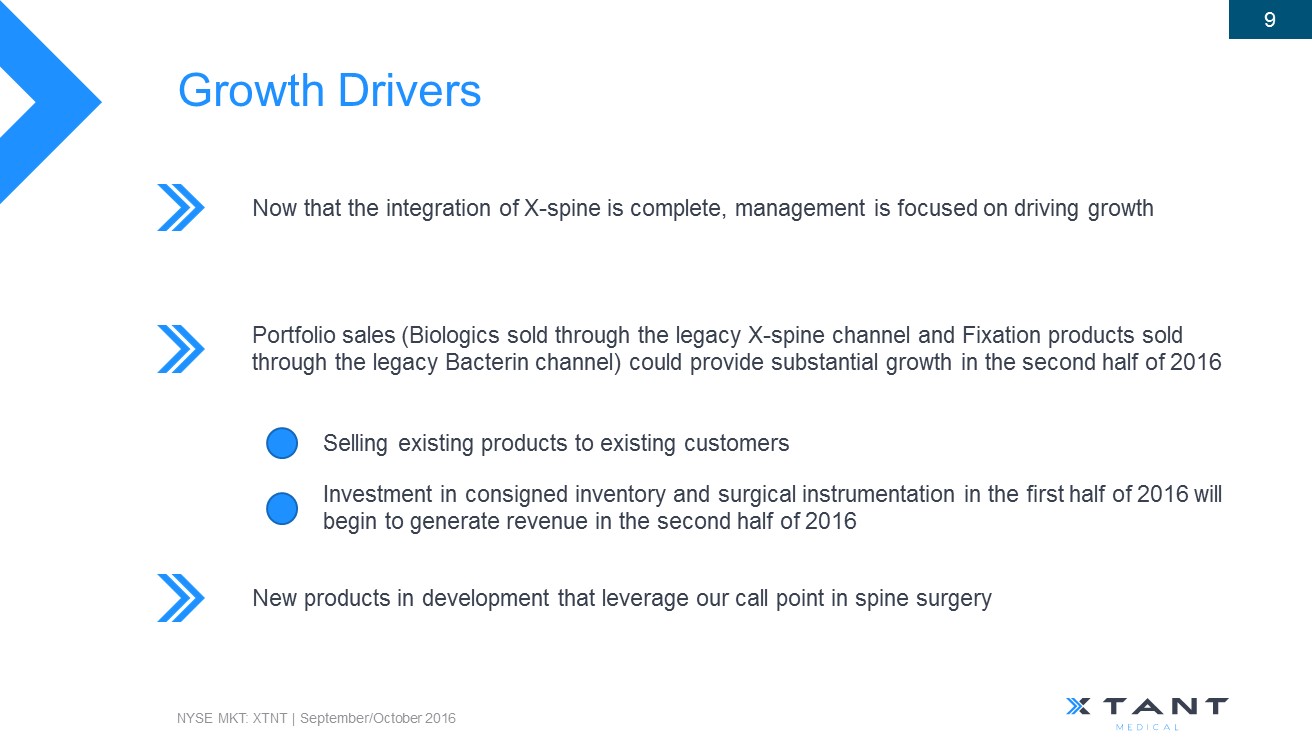
Growth Drivers NYSE MKT: XTNT | September/October 2016 9 Now that the integration of X - spine is complete, management is focused on driving growth Portfolio sales (Biologics sold through the legacy X - spine channel and Fixation products sold through the legacy Bacterin c hannel) could provide substantial growth in the second half of 2016 Selling existing products to existing customers Investment in consigned inventory and surgical instrumentation in the first half of 2016 will begin to generate revenue in the second half of 2016 New products in development that leverage our call point in spine surgery

NYSE MKT: XTNT | September/October 2016 10 Portfolio Selling Example: Posterior Lumbar Solutions $1.5M 2Q16 Revenue from portfolio selling, 6.6% of total revenue, up from $935K in 1Q16 10 - 12% Management goal for portfolio selling
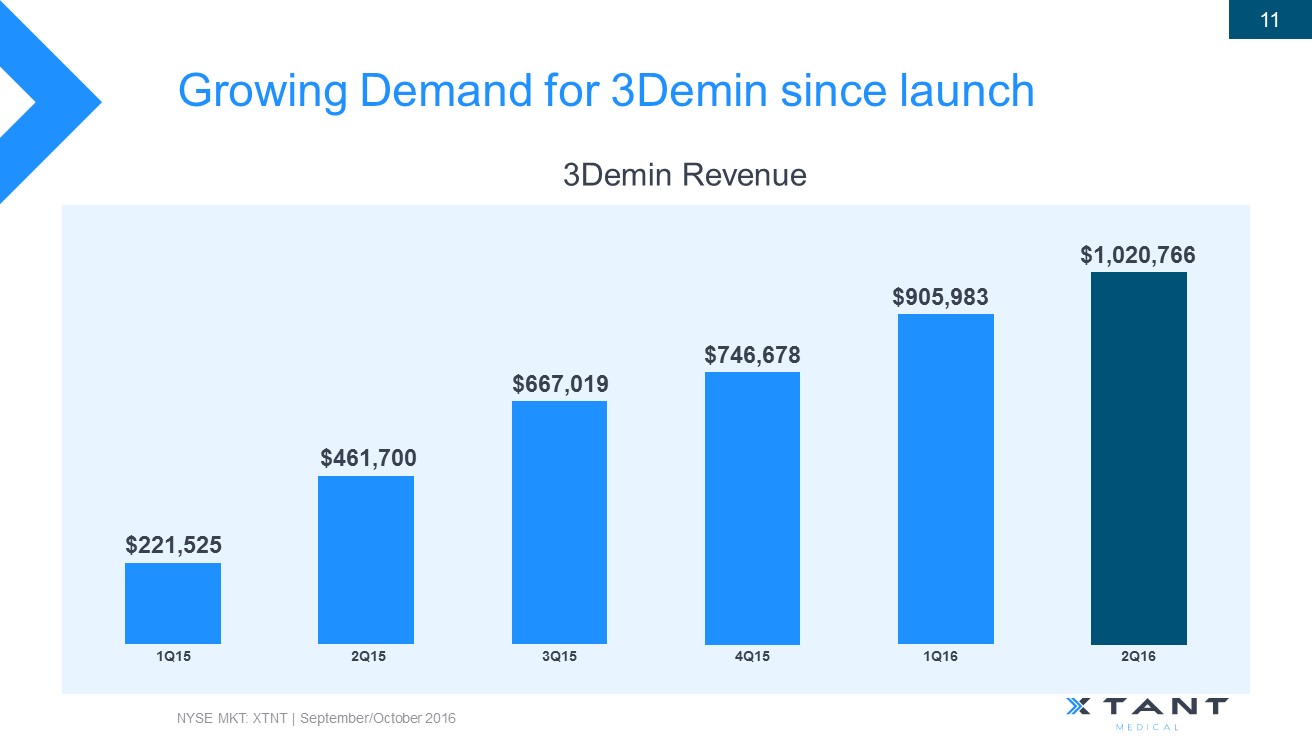
Growing Demand for 3Demin since launch NYSE MKT: XTNT | September/October 2016 11 3Demin Revenue $905,983 1Q16 $746,678 4Q15 $667,019 3Q15 $461,700 2Q15 $221,525 1Q15 $1,020,766 2 Q16

New Products Announced Since Completion of the X - spine Acquisition NYSE MKT: XTNT | September/October 2016 12 • $75,000+ revenue in 2Q16 (Pilot Launch) • Total Addressable Market approximately $282M • 510(k) clearance Announced March 30, 2016 • Total Addressable Market approximately $110M • Revenue Contribution Expected in 2H16 • Total Addressable Market approximately $400M • $87,000+ revenue in 2Q16 (Pilot Launch) • Total Addressable Market approximately $160M

NYSE MKT: XTNT | September/October 2016 13 Announced March 24, 2016 $252 million total addressable market* Unique, viable cell line (MIAMI) Launched end of Q2 2016 *Source: BioMed GPS 2014

FINANCIAL OVERVIEW NYSE MKT: XTNT | September/October 2016 14
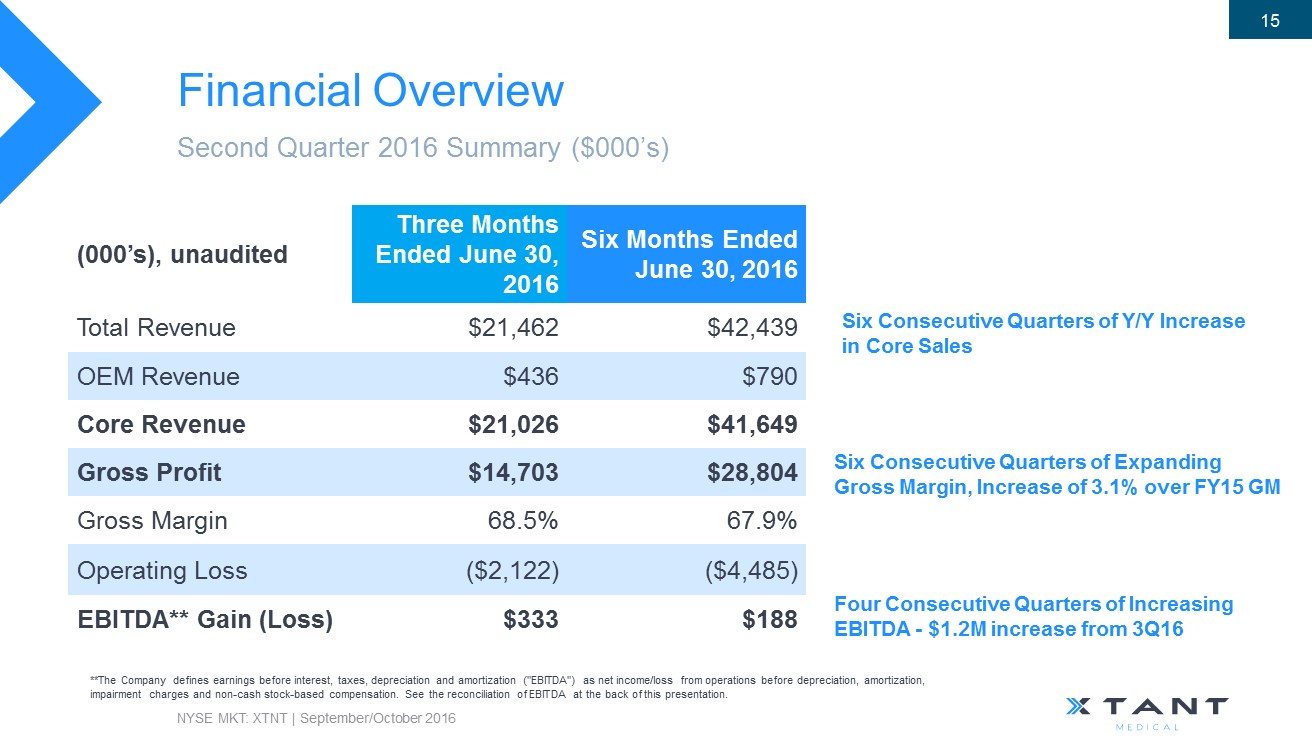
Financial Overview Second Quarter 2016 Summary ($000’s) **The Company defines earnings before interest, taxes, depreciation and amortization ("EBITDA") as net income/loss from operations bef ore depreciation, amortization, impairment charges and non - cash stock - based compensation . See the reconciliation of EBITDA at the back of this presentation. (000’s), unaudited Three Months Ended June 30, 2016 Six Months Ended June 30, 2016 Total Revenue $21,462 $42,439 OEM Revenue $436 $790 Core Revenue $21,026 $41,649 Gross Profit $14,703 $28,804 Gross Margin 68.5% 67.9% Operating Loss ($2,122) ($4,485) EBITDA** Gain (Loss) $333 $188 NYSE MKT: XTNT | September/October 2016 15 Six Consecutive Quarters of Y/Y Increase in Core Sales Six Consecutive Quarters of Expanding Gross Margin, Increase of 3.1% over FY15 GM Four Consecutive Quarters of Increasing EBITDA - $ 1.2M increase from 3Q16

Capitalization NYSE MKT: XTNT | September/October 2016 16 *Results listed under “As Of June 30, 2016” are unaudited (000’s) As of June 30, 2016* Cash & Cash Equivalents $2,217 Debt: Revolving Line of Credit $5,481 Non - Convertible Debt $47,072 Convertible Debt ( Conv. Prices: ~$ 2.2MM at $2.90 and ~$ 68.0MM at $3.88) $70,238 Capital Lease Obligations $961 Total Debt $123,752 Shares Outstanding: Common Stock 12,135 Options ( Wtd . Avg. Strike of $10.83) 562 Warrants ( Wtd . Avg Strike of $7.65) 1,236 Total Common Stock, Options and Warrants 13,933
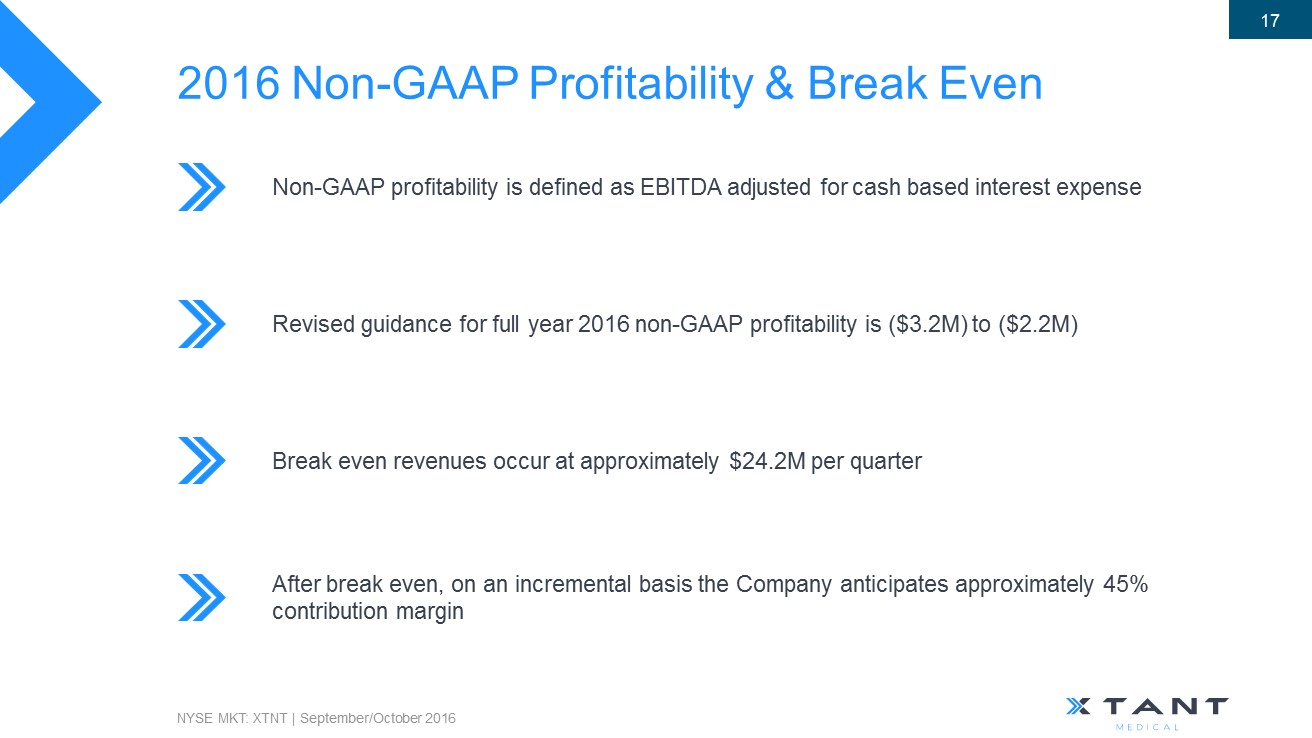
2016 Non - GAAP Profitability & Break Even Non - GAAP profitability is defined as EBITDA adjusted for cash based interest expense Revised guidance for full year 2016 non - GAAP profitability is ($3.2M) to ($2.2M) Break even revenues occur at approximately $24.2M per quarter NYSE MKT: XTNT | September/October 2016 17 After break even, on an incremental basis the Company anticipates approximately 45% contribution margin

Estimated Incremental Revenue Flow Through NYSE MKT: XTNT | September/October 2016 18 ($000’s) Break Even Incremental Quarterly Revenue $24,250 $1,000 Gross Profit $16,611 $750 Gross Margin 68.5% 75% Commissions $7,275 $300 All Other Operations & Cash - Based Interest Expense $9,336 $0 Income From Operations - $450 Operating Margin 0% 45%

SUMMARY NYSE MKT: XTNT | September/October 2016 19 JG2

Financial Guidance **The Company defines earnings before interest, taxes, depreciation and amortization ("EBITDA") as net income/loss from operations before depreciation, amortization, impairment charges and non - cash stock - based compensation. NYSE MKT: XTNT | September/October 2016 20 ($000’s) Full Year 2016 Guidance Low - High Revenue $87,000 - $90,000 EBITDA** $2,300 - $3,300 Cash Bas ed Interest Expense $5,450 - $5,450 Non - GAAP Profitability ($3,150) - ($2,150)

Growth Drivers Xtant is a substantial revenue stage, spine - product business with expanding margins Sales growth in 2016 and 2017 driven by Portfolio Sales and additional inventory and surgical instrumentation to service existing accounts and open new ones Meaningful contribution from new products in second half of 2016 and through 2017 NYSE MKT: XTNT | September/October 2016 21

664 Cruiser Ln. Belgrade, MT 59714 1.406.388.0480 [email protected] CONTACT US xtantmedical.com Investor Relations CG Capital 1.877.889.1972 [email protected] c g.capital NYSE MKT: XTNT

Reconciliation of EBITDA NYSE MKT: XTNT | September/October 2016 Appendix A (000’s) Three Months Ended June 30, 2016 Three Months Ended June 30, 2015* Twelve Months Ended December 31, 2015 Net Loss from Operations ($2,122) ($1,375) ($12,475) Impairment of Assets $0 $0 $234 Acquisition and Integration related expenses $450,756 $0 $4,936 Gain from the Extinguishment of Debt $0 $0 ($2,345) Non - Cash Compensation $135 $214 $794 Depreciation & Amortization $1,869 $2,109 $8,823 EBITDA Gain (Loss) $333 $949 ($33)
Serious News for Serious Traders! Try StreetInsider.com Premium Free!
You May Also Be Interested In
- Summit Financial Group Reports First Quarter 2024 Earnings of $1.14 Per Share
- FTAI Aviation Ltd. and LATAM Airlines Group S.A. Engineer Perpetual Power Program
- Snowline Gold Consolidates 100% of Its Einarson Project and Acquires Adjacent Gold Target With Historical Drill Result of 9.7 Grams per Tonne Gold Over 38.7 M
Create E-mail Alert Related Categories
SEC FilingsSign up for StreetInsider Free!
Receive full access to all new and archived articles, unlimited portfolio tracking, e-mail alerts, custom newswires and RSS feeds - and more!
