

Form FWP EVANS BANCORP INC Filed by: EVANS BANCORP INC
 Tweet
Tweet Share
Share  Common
Equity Offering January 17, 2017
David J. Nasca President & CEO John B. Connerton Executive Vice President & CFO NYSE MKT: EVBN www.evansbank.com Issuer Free Writing Prospectus Dated January 17, 2017 Filed Pursuant to Rule 433 Registration Statement No. 333-210443 |
 This
presentation has been prepared by Evans Bancorp, Inc. (“Evans Bancorp” or the “Company”) solely for informational purposes based on its own information, as well as information from public sources. This presentation has been prepared to assist interested parties in making their own
evaluation of Evans Bancorp and does not purport to contain all of the
information that may be relevant. In all cases, interested parties should conduct their own investigation and analysis of Evans Bancorp and the data set forth in this presentation and other information provided by or on behalf of Evans
Bancorp. This presentation does not constitute an offer to sell, nor a
solicitation of an offer to buy, any securities of Evans Bancorp by any person in any jurisdiction in which it is unlawful for such person to make such an offering or solicitation. Neither the Securities and Exchange Commission (“SEC”) nor any other regulatory body has approved or disapproved of the securities of
Evans Bancorp or passed upon the accuracy or adequacy of this
presentation. Any representation to the contrary is a criminal offense.
Except as otherwise indicated, this presentation speaks as of the date hereof. The
delivery of this presentation shall not, under any circumstances, create any implication that there has been no change in the affairs of the Company after the date hereof.
Certain of the information contained herein may be derived from information provided by
industry sources. Evans Bancorp believes that such information is
accurate and that the sources from which it has been obtained are reliable. Evans
Bancorp cannot guarantee the accuracy of such information, however, and
has not independently verified such information.
From time to time, Evans Bancorp may make forward-looking statements that reflect
the Company’s views with respect to, among other things, future events
and financial performance. Words such as “believes,” “anticipates,”
“expects,” “intends,” “plans,” “estimates,” “targeted” or the negative version of those words or other comparable words are intended to identify forward-looking statements, but are not the exclusive means of identifying such
statements. These forward- looking statements are not historical
facts, and are based on current expectations, estimates and projections about the Company’s industry, management’s beliefs and certain assumptions made by management, many of which, by their nature, are inherently uncertain and beyond the Company’s
control. Accordingly, you are cautioned that any such forward-looking
statements are not guarantees of future performance and are subject to
certain risks, uncertainties and assumptions that are difficult to
predict. Although the Company believes that the expectations reflected in
such forward-looking statements
are reasonable as of the date made, actual results may prove to be materially different
from the expected results expressed or implied by such forward-looking
statements. Unless otherwise required by law, the Company also disclaims any obligation
to update its view of any such risks or uncertainties or to announce
publicly the result of any revisions to the forward-looking statements made in this
presentation. A detailed discussion of the factors that could cause actual results to differ from the anticipated results or other expectations is included in our SEC filings, including our Annual Report
on Form 10-K for the year ended
December 31, 2015. Evans Bancorp has filed a registration statement (including a prospectus) and a prospectus supplement which is preliminary and
subject to completion, with the
SEC for the offering to which this communication relates. Before you invest, you should
read the prospectus in that registration statement, the preliminary
prospectus supplement and the other documents that Evans Bancorp has
filed with the SEC for more complete information about Evans Bancorp and the offering. You may get these documents for free by visiting the SEC website at www.sec.gov. Alternatively, the Company, any underwriter or any
dealer participating in the offering will arrange to send you the
prospectus if you request it by contacting: Sandler O’Neill & Partners, L.P. at toll-free 1-866-805-4128 or Hovde Group, LLC at toll-free 1-866-971-0961. Offering Disclosure © 2017 by Evans Bancorp 2 |
 Offering
Summary Issuer:
Evans Bancorp, Inc. Offering: Follow-on common stock Gross Amount Offered: $14 million Over-Allotment Option: 15% Exchange / Symbol: NYSE MKT / EVBN Market Capitalization¹: $152 million Current Semi-Annual Dividend: $0.38 Dividend Yield¹: 2.1% Use of Proceeds: To support our organic growth and for other general corporate purposes, including contributing capital to the Bank Book-Running Manager: Sandler O’Neill + Partners, L.P Co-Manager: Hovde Group, LLC (1) Based on January 13, 2017 stock price of $35.43/share and 4,300,634 common shares outstanding
Source: SNL Financial, Company documents
© 2017 by Evans Bancorp
3 |
 Corporate
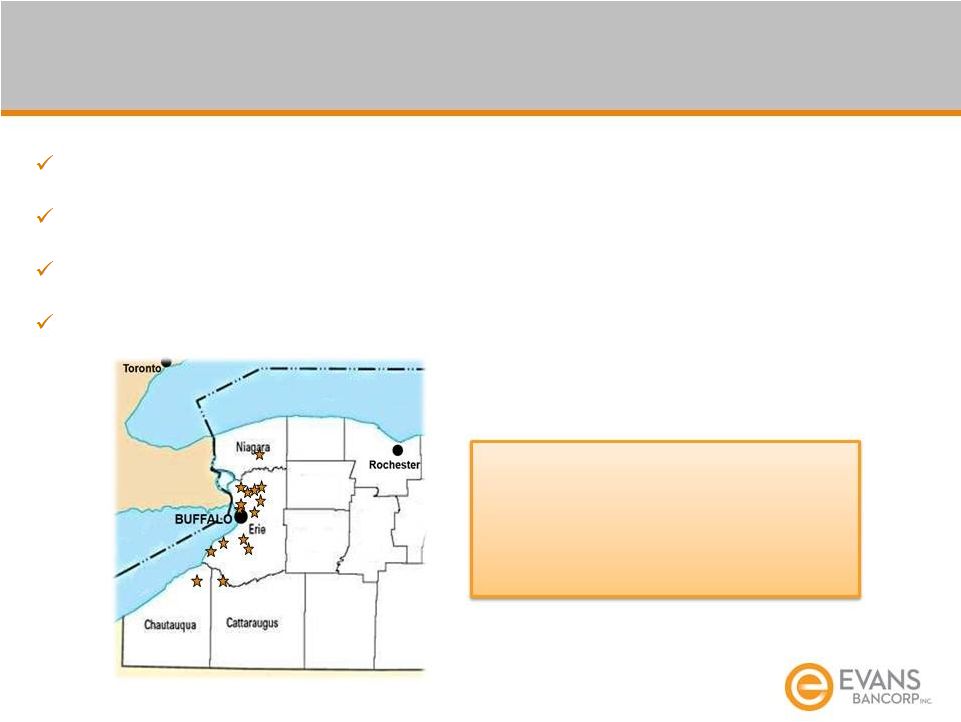
Profile Evans Established:
1920 Headquarters: Hamburg, NY Bank Branches: 14 Insurance Agency Locations: 7 © 2017 by Evans
Bancorp 4 Community-based diversified financial services company Provides banking, insurance and investment services in Western New York Achieved $1 billion in assets on record loan growth Strategy focused on driving greater earnings power and returns |
 Financial
Summary – Q3 2016
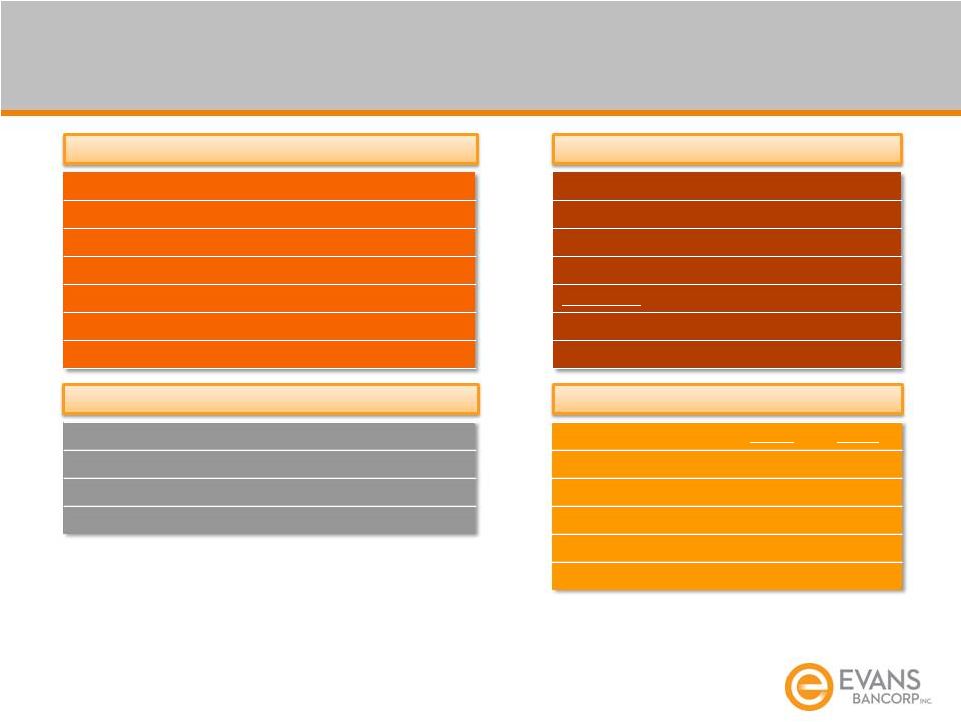
Total Assets: $1.1 billion Net Loans: $899 million Total Deposits: $898 million Loans / Deposits: 102% Nonperforming Assets / Total Assets¹: 1.41% Total Stockholders’ Equity²: $95.2 million Stockholders’ Equity / Total Assets: 8.8% Note: List of companies included in Peer Group can be found in the Appendix (1) Nonperforming assets defined as nonaccrual loans and loans 90 days or more past due and still accruing
(2) Stockholders’ equity includes $8.1 million of goodwill, or $1.89 per share Source: SNL Financial and Company documents Tier 1 Leverage: 9.55% Common Equity Tier 1 Risk-Based Capital: 10.82% Tier 1 Risk-Based Capital: 10.82% Total Risk-Based Capital: 12.07% Stock Price: $35.43 52 week range: $22.87 – $37.67 Market Capitalization: $152 million Total Shares Outstanding: 4.3 million Ownership: Insider: 5% Institutional: 43% Dividend Yield: 2.1% Current Balance Sheet Position Current Balance Sheet Position Consolidated Regulatory Capital Ratios Consolidated Regulatory Capital Ratios Market Data as of January 13, 2017 Market Data as of January 13, 2017 Valuation as of January 13, 2017 Valuation as of January 13, 2017 EVBN Peers Price / BV: 160% 151% Price / TBV: 174% 162% Price / LTM EPS: 19.9x 19.5x Price / Est. 2016 EPS: 18.7x 19.8x Price / Est. 2017 EPS: 15.9x 17.5x © 2017 by Evans Bancorp 5 |
 Management
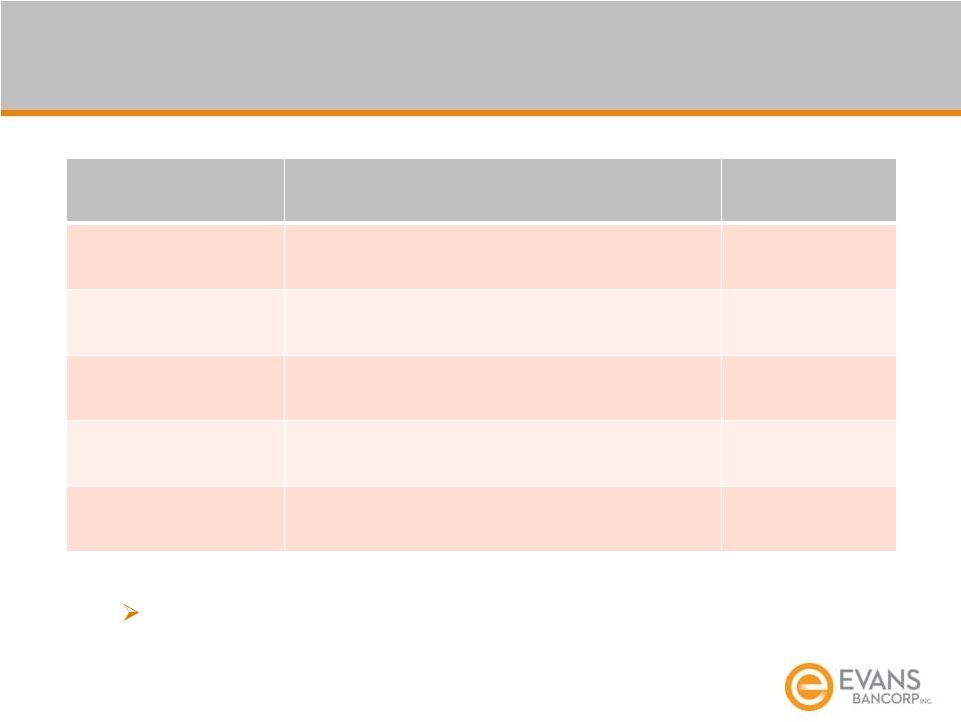
Profile Executive
Position Experience David Nasca President and Chief Executive Officer 34 Years John Connerton Chief Financial Officer 15 Years John Eagleton Chief Lending Officer 32 Years Robert Miller Jr. President of The Evans Agency, LLC 40 Years Paul Ulrich Chief Credit Officer 43 Years © 2017 by Evans Bancorp 6 Average of Over 32 Years of Financial Services Experience |
 Refocus
Community Banking Model
Executed Strategic Plan (Fiscal Years
2013-2015) Effective Risk Management Effective Lending Strategy Fee Based Income Growth Strengthen Operating Model Optimize Technology: Execute core conversion 33% Loans 2013 - 2015 18% Deposits 2013 - 2015 2015 Non-Interest Income = 30% of Total Revenue in 2015 Returned Capital to Shareholders Strategic Plan © 2017 by Evans Bancorp 7 |
 Stock
Performance 3-Year Total Return
(1/13/2014 thru 1/13/2017) 5-Year Total Return (1/13/2012 thru 1/13/2017) +62% +67% +241% +129% Note: Market data as of January 13, 2017; list of companies included in Peer Group can be found in the Appendix
Source: SNL Financial
© 2017 by Evans Bancorp
8 70% 80% 60% 50% 40% 30% 20% 10% 0% (10%) 1/13/2014 5/13/2014 9/13/2014 1/13/2015 5/13/2015 9/13/2015 1/13/2016 5/13/2016 9/13/2016 1/13/2017 EVBN Peer Group Peer Group EVBN 300% 250% 200% 150% 100% 50% 0% 1/13/2012 1/13/2013 1/13/2014 1/13/2015 1/13/2016 1/13/2017 |
 Results
– Q3 2016
Net Income of $2.2 million or $0.51 Per Diluted Share
ROAA: 0.84% ROAE: 9.23% Net Interest Income of $9.1 million Net Interest Margin: 3.67% Total Loans of $913 million¹ Growth of $60 million in Q3 2016 or 28% annualized Deposits of $898 million with Average Cost of 0.45% Growth of $28 million in Q3 2016 or 13% annualized (1) Includes Loans Held For Sale © 2017 by Evans Bancorp 9 |
 Q3 2016
Performance vs. Peers Note: List of companies included in Peer Group can
be found in the Appendix Source: SNL Financial, Company
documents Return on Average Assets
Return on Average Equity
Efficiency Ratio Net Interest Margin © 2017 by Evans Bancorp 10 0.84% 0.84% EVBN Peer Group 9.23% 8.59% EVBN Peer Group 70.23% 64.51% EVBN Peer Group 3.67% 3.47% EVBN Peer Group |
 $809.7 $833.5 $846.8 $939.1 1,084.7 2012 2013 2014 2015 Q3 2016 8% CAGR (2012 – Q3 2016) 8% CAGR (2012 – Q3 2016) Over $1 Billion in Assets (in millions) 18% YOY Q3 16 vs Q3 15 Driven by organic loan and deposit growth Platforms increased future earnings power © 2017 by Evans Bancorp 11 |
 $581.3 $647.0 $695.7 $774.0 $912.9 2012 2013 2014 2015 Q3 2016 Record Loan Growth High quality in-market commercial loans Capturing strong credits from competition Supports core business strategy Strong loan pipeline (in millions) 86% 92% 98% 96% 102% Loan to Deposit Ratio 13% CAGR (2012 – Q3 2016) 1 (1) Excludes $1.6 million in direct financing leases © 2017 by Evans Bancorp 12 |
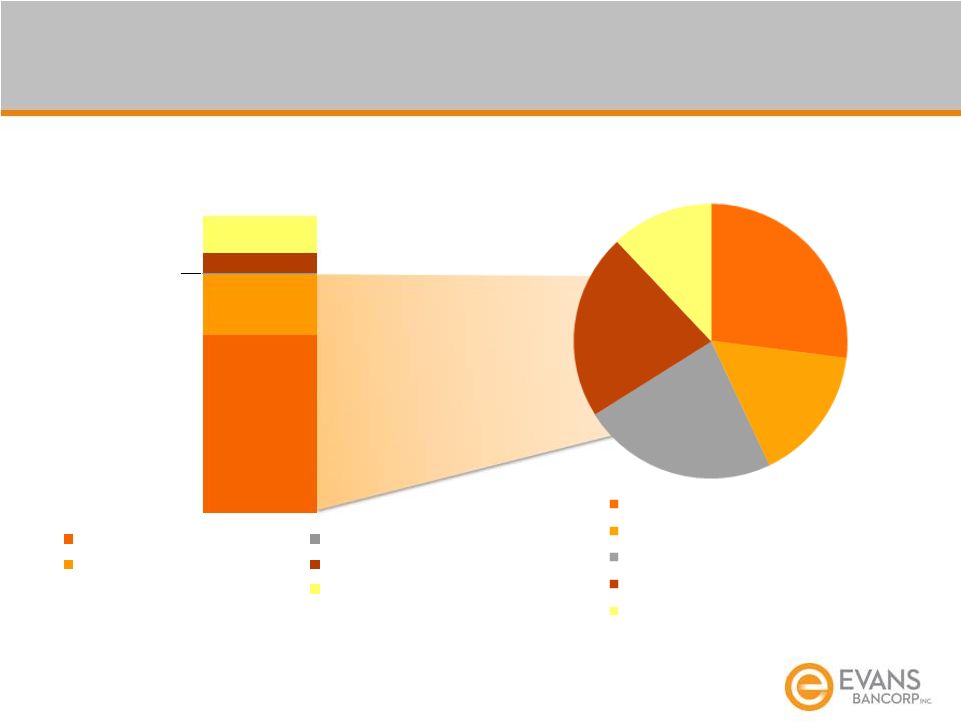 Loan
Portfolio Diversification 27%
16% 23% 22% 12% Q3 2016 Commercial Loan Portfolio Non-owner occupied CRE Owner occupied CRE C & I Multi-family Construction / Development $546 $187 $2 $64 $113 Q3 2016 Total Loan Portfolio: $913 million¹ Average Yield: 4.39% Commercial & Multi-Family² Commercial & Industrial Consumer & Other Home Equities Residential Mortgage² Note: Dollars in millions (1) Total composition does not sum to $913 million due to rounding (2) Includes construction loans 13 © 2017 by Evans Bancorp |
 ©
2017 by Evans Bancorp 14
Solid Credit Fundamentals
Booking high quality assets Solid underwriting discipline Strong customer relationships Note: List of companies included in Peer Group can be found in the Appendix (1) Nonperforming loans defined as nonaccrual loans and loans 90 days past due and still accruing
Source: SNL Financial, Company Documents
ALLL/ NPLs¹/ NCOs/ ALLL/ Total Loans Total Loans Avg. Loans NPLs¹ 9/30/2015 1.84% 1.12% 0.03% 164.7% 12/31/2015 1.66% 2.07% 0.42% 80.3% 3/31/2016 1.65% 2.25% (0.02%) 73.1% 6/30/2016 1.50% 1.88% (0.01%) 79.5% 9/30/2016 1.50% 1.67% 0.03% 89.7% Peer Group (9/30/2016) 1.03% 0.69% 0.05% 142.9% |
 Conservative Securities Portfolio
10% of Total Assets 94% of Obligations of States and Political Subdivisions Rated A or Higher Effective Portfolio Duration is 3.9 Years $105 million Total Securities © 2017 by Evans Bancorp 15 |
 $679.0
$706.6 $707.6 $803.0 $898.0 2012 2013 2014 2015 Q3 2016 8% CAGR (2012 – Q3 2016) 8% CAGR (2012 – Q3 2016) 55% 13% 32% Strong Core Deposit Growth 15% YOY Q3 16 vs Q3 15 15% Demand 9% NOW 14% Savings (in millions) Q3 2016 Deposit Composition Savings & Money Market Time Deposits Demand & NOW Average Cost of Deposits: 0.45% © 2017 by Evans Bancorp 16 New money market account Driving new deposits and cross-sell opportunities YOY Q3 16 vs Q3 15 |
 15% 5% Q3 2016 TTM Non-Interest Income: $11.5 million Non-Interest Income Opportunity 25% of total Q3 2016 TTM revenue Emphasis on expanding: Financial services Employee benefits Insurance Cash management 21% Other Income 59% Insurance Service & Fees Bank-owned Life Insurance Bank Charges © 2017 by Evans Bancorp 17 |
 Capital
Overview Both the Company and the Bank have consistently maintained
regulatory capital ratios significantly above the federal “well
capitalized” standards indicates minimum level to be considered
“well capitalized” 5.00%
8.00% 10.00% 5.00% 8.00% 10.00% Bank Consolidated © 2017 by Evans Bancorp 18 16.00% 14.00% 12.00% 10.00% 8.00% 6.00% 4.00% 2.00% 0.00% 16.00% 14.00% 12.00% 10.00% 8.00% 6.00% 4.00% 2.00% 0.00% Tier 1 Leverage Tier 1 RBC Total RBC Tier 1 Leverage Tier 1 RBC Total RBC 12/31/2014 12/31/2015 9/30/2016 12/31/2014 12/31/2015 9/30/2016 10.78% 10.18% 9.33% 13.65% 11.53% 10.57% 14.91% 12.78% 11.83% 10.84% 10.45% 9.55% 13.60% 11.82% 10.82% 14.85% 13.07% 12.07% |
 2.1% 1.8% EVBN Peer Group Current Dividend Yield Returning Capital to Shareholders $0.26 $0.65 $0.72 $0.76 $0.24 2013¹ 2014 2015 2016 Dividend Payment History $0.50 Note: Market data as of January 13, 2017; list of companies included in Peer Group can be found in the Appendix
(1) One semi-annual dividend of $0.24 was accelerated into 2012 due to tax policy considerations for shareholders
Source: SNL Financial, Company documents
© 2017 by Evans Bancorp
19 |
 Market
Opportunity / Future Vision NYSE MKT:
EVBN www.evansbank.com |
 Public/Private Project
Evans committed $1 million Housing Opportunity Fund (Joint with City of Buffalo) $475 thousand over 2 years The Bank for a Resurgent WNY Seneca Street Lofts Tim Hortons Café & Bake Shop Stanton Building Community Reinvestment - Buffalo Information Technologies Innovation and Commercialization Hub - High Tech Manufacturing Innovation Hub at River Bend - 43 North Startup and Innovation Competition - Buffalo Medical Innovation and Commercialization Hub - Buffalo Manufacturing Works © 2017 by Evans Bancorp 21 |
 Opportunity from Market Disruption
Note: Market share data for Buffalo-Cheektowaga-Niagara Falls, NY Metropolitan
Statistical Area as of June 30, 2016; market share does not sum to 100% due to rounding (1) Reflects Northwest Bank’s purchase of 18 FN branches, consisting of $1.6B in Deposits, in September 2016
(2) Reflects KeyBank’s acquisition of First Niagara in August 2016 Source: FDIC Buffalo MSA © 2017 by Evans Bancorp 22 1.9% 2.5% 3.9% 4.8% 5.1% 27.7% 54.0% Total Deposits in Market: $42.6 billion All Others (9) Citizens Northwest Bank¹ Bank of America Key Bank² M&T Bank |
 Transformative Growth Phase of Strategy
New Four-Year Plan (2016 –
2020) © 2017 by Evans Bancorp 23 Organic Market Growth: Lead with Business Market Disruption Fee-Based Income Growth Retail Transformation Talent Acquisition & Retention Capital Management IT Optimization |
 Investment
Highlights Strong and growing franchise in resurgent WNY
Diverse revenue mix, strong operating fundamentals
Core deposit and loan growth
Lower-risk balance sheet
with solid capital base
Sophisticated / experienced management team
Shareholder return orientation
Historically reasonable valuation
© 2017 by Evans Bancorp
24 |
 Appendix NYSE MKT: EVBN www.evansbank.com |
 Peer
Group Note:
Includes banks that trade on a major exchange (NYSE, NYSE MKT, or NASDAQ) with Total Assets between $1 billion and $3 billion that are headquartered in the Northeast or Mid-Atlantic Regions; exclude targets of announced merger transactions; financial data for the quarter ended September 30,
2016 Source: SNL Financial
© 2017 by Evans Bancorp
26 Company Name Ticker Location Total Assets (000s) Arrow Financial Corporation AROW Glens Falls, NY $2,580,485 CNB Financial Corporation CCNE Clearfield, PA $2,539,944 Enterprise Bancorp, Inc. EBTC Lowell, MA $2,470,849 Sun Bancorp, Inc. SNBC Mount Laurel, NJ $2,189,346 Peoples Financial Services Corp. PFIS Scranton, PA $1,971,239 Republic First Bancorp, Inc. FRBK Philadelphia, PA $1,734,462 Chemung Financial Corporation CHMG Elmira, NY $1,728,865 BCB Bancorp, Inc. BCBP Bayonne, NJ $1,678,936 Old Line Bancshares, Inc. OLBK Bowie, MD $1,650,105 First Bancorp, Inc. FNLC Damariscotta, ME $1,635,088 Bankwell Financial Group, Inc. BWFG New Canaan, CT $1,565,586 Codorus Valley Bancorp, Inc. CVLY York, PA $1,522,981 Orrstown Financial Services, Inc. ORRF Shippensburg, PA $1,354,154 Penns Woods Bancorp, Inc. PWOD Williamsport, PA $1,347,412 First United Corporation FUNC Oakland, MD $1,338,189 Community Financial Corporation TCFC Waldorf, MD $1,281,874 Citizens & Northern Corporation CZNC Wellsboro, PA $1,245,333 ACNB Corporation ACNB Gettysburg, PA $1,208,869 Shore Bancshares, Inc. SHBI Easton, MD $1,157,866 Unity Bancorp, Inc. UNTY Clinton, NJ $1,152,896 AmeriServ Financial, Inc. ASRV Johnstown, PA $1,145,655 Norwood Financial Corp. NWFL Honesdale, PA $1,125,057 1st Constitution Bancorp FCCY Cranbury, NJ $1,055,308 Mid Penn Bancorp, Inc. MPB Millersburg, PA $1,042,687 Howard Bancorp, Inc. HBMD Ellicott City, MD $1,014,787 First Bank FRBA Hamilton, NJ $1,007,685 Bar Harbor Bankshares BHB Bar Harbor, ME $1,717,875 |
 Common
Equity Offering January 17, 2017
NYSE MKT: EVBN www.evansbank.com |
Serious News for Serious Traders! Try StreetInsider.com Premium Free!
You May Also Be Interested In
- Ben Lang on Notion, Building a Community, and the Art of Angel Investing
- PayPoint plc : Director/PDMR Shareholding
- Affimed Announces Acceptance of AFM24 Clinical Abstract at the 2024 Annual Meeting of the American Society of Clinical Oncology
Create E-mail Alert Related Categories
SEC FilingsSign up for StreetInsider Free!
Receive full access to all new and archived articles, unlimited portfolio tracking, e-mail alerts, custom newswires and RSS feeds - and more!
