

Form FWP BRIDGE BANCORP INC Filed by: BRIDGE BANCORP INC
 Tweet
Tweet Share
ShareIssuer Free Writing Prospectus
Dated November 21, 2016
Filed Pursuant to Rule 433
Registration Statement No. 333-210245

NASDAQ: BDGE Common Equity Offering November 21, 2016
Offering Disclosure 2 This presentation has been prepared by Bridge Bancorp, Inc. (“Bridge Bancorp” or the “Company”) solely for informational purp ose s based on its own information, as well as information from public sources. This presentation has been prepared to assist interested parties in making their own evaluat ion of Bridge Bancorp and does not purport to contain all of the information that may be relevant. In all cases, interested parties should conduct their own investigation and analysis of Bridge Bancorp and the data set forth in this presentation and other information provided by or on behalf of Bridge Bancorp. This presentation does not constitute an offer to sell, nor a solicitation of an offer to buy, any securities of Bridge Bancorp by an y person in any jurisdiction in which it is unlawful for such person to make such an offering or solicitation. Neither the Securities and Exchange Commission (“SEC”) nor any other regulatory body has approved or disapproved of the securities of Br idge Bancorp or passed upon the accuracy or adequacy of this presentation. Any representation to the contrary is a criminal offense. Except as otherwise indicated, this presentation speaks as of the date hereof. The delivery of this presentation shall not, under an y c ircumstances, create any implication that there has been no change in the affairs of the Company after the date hereof. Certain of the information contained herein may be derived from information provided by industry sources. Bridge Bancorp believes tha t s uch information is accurate and that the sources from which it has been obtained are reliable. Bridge Bancorp cannot guarantee the accuracy of such information, h owe ver, and has not independently verified such information. From time to time, Bridge Bancorp may make forward - looking statements that reflect the Company’s views with respect to, among other t hings, future events and financial performance. Words such as “believes,” “anticipates,” “expects,” “intends,” “plans,” “estimates,” “targeted” or the negative ver sion of those words or other comparable words are intended to identify forward - looking statements, but are not the exclusive means of identifying such statements. These forwa rd - looking statements are not historical facts, and are based on current expectations, estimates and projections about the Company’s industry, management’s beliefs and certa in assumptions made by management, many of which, by their nature, are inherently uncertain and beyond the Company’s control. Accordingly, you are cautioned that any su ch forward - looking statements are not guarantees of future performance and are subject to certain risks, uncertainties and assumptions that are difficult to predict. Although th e Company believes that the expectations reflected in such forward - looking statements are reasonable as of the date made, actual results may prove to be materially different from the expected results expressed or implied by such forward - looking statements. Unless otherwise required by law, the Company also disclaims any obligation to update its view of any such risks or uncertainties or to announce publicly the result of any revisions to the forward - looking statements made in this presentation. A detailed discussio n of the factors that could cause actual results to differ from the anticipated results or other expectations is included in our SEC filings, including our Annual Report on Form 10 - K for the year ended December 31, 2015 and our quarterly report on Form 10 - Q for the quarter ended March 31, 2016. Bridge Bancorp has filed a registration statement (including a prospectus) and a prospectus supplement which is preliminary and subj ect to completion, with the SEC for the offering to which this communication relates. Before you invest, you should read the prospectus in that registration statemen t, the preliminary prospectus supplement and the other documents that Bridge Bancorp has filed with the SEC for more complete information about Bridge Bancorp and the offerin g. You may get these documents for free by visiting the SEC website at www.sec.gov. Alternatively, the Company, any underwriter or any deal participating in the offering will arrange to send you the prospectus if you request it by contacting: Sandler O’Neill & Partners, L.P. at toll - free 1 - 866 - 805 - 4128 or by emailing [email protected] or Keefe, Bruyette & Woods, Inc . toll free 1 - 800 - 966 - 1559 or emailing [email protected].

Offering Summary 3 Issuer: Bridge Bancorp, Inc. Offering: Follow - on common stock Gross Amount Offered: $50 million Over - Allotment Option: 15% ($7.5 million) Exchange / Symbol: NASDAQ / BDGE Market Capitalization¹: $559 million Current Quarterly Dividend: $0.23 per share Dividend Yield¹ : 2.9% Use of Proceeds: General corporate purposes, including support our organic growth, the pursuit of strategic acquisition opportunities and contributing capital to the bank Book - Running Managers: Sandler O’Neill + Partners, L.P. Keefe, Bruyette & Woods (A Stifel Company) ( 1) As of November 18th , 2016, Stock price of $32.00/share and 17,481,800 common shares outstanding.

Corporate Profile A Growing Long Island Business ▪ Passionate About Long Island Business Committed to Community Banking ▪ Delivering Results to Our Stakeholders Local Decisions Made by Local Bankers ▪ Fueling the Economy with $ 2.6 Billion in Loans Built On A Strong Culture & Identity ▪ Succeeding by Building Relationships & Partnerships 4

Current Franchise 5 Headquarters: Bridgehampton Chartered: 1910 FT Employees: 486 Branches: 40 Nasdaq/Russell 2000 BDGE September 30, 2016 Assets : $3.8 billion Loans: $2.6 billion Deposits: $2.9 billion Market Cap: $559 million (1) (1) As of November 18th, 2016, Stock price of $32.00/share and 17,481,800 common shares outstanding.

Favorable Long Island Demographics 6 Source: SNL Financial LC and Nielsen estimates for 2017. (1) Population density calculated as number of people per square mile. (2) Monthly data as of September 2016. Population Density 1 Businesses per Square Mile Median Household Income Unemployment Rate 2 % of Households w/ 100K+ Income: 51% 46% 36% 30% 26% 4,805 1,648 2,453 422 92 Nassau, NY Suffolk, NY New York City (MSA) NY (State) U.S. 205 71 98 16 4 Nassau, NY Suffolk, NY New York City (MSA) NY (State) U.S. $103,186 $91,963 $70,547 $62,222 $57,462 Nassau, NY Suffolk, NY New York City (MSA) NY (State) U.S. 4.1% 4.3% 5.2% 5.1% 4.8% Nassau, NY Suffolk, NY New York City (MSA) NY (State) U.S.

Management Profile Executive Team ▪ Kevin M. O’Connor, President and Chief Executive Officer ▪ Howard H. Nolan, Chief Operating Officer and Corporate Secretary ▪ James J. Manseau, Chief Retail Banking Officer ▪ Kevin L. Santacroce, Chief Lending Officer ▪ John M. McCaffery , Chief Financial Officer and Treasurer ▪ John P. Vivona , Chief Risk Officer Each with Over 25 Years of Financial Services Experience Continue to Hire Experienced Professionals ▪ Revenue Producers, Compliance & Operational Positions 7

Financial Summary 8 Source: SNL Financial LC and Company documents. Financial data of September 30, 2016. (1) Excludes performing restructured loans. Total Assets: $3.8 Billion Total Loans: $2.6 Billion Total Deposits: $2.9 Billion Loans / Deposits: 88.5% Nonperforming Assets/ Total Assets¹: 0.05% Common Stockholders' Equity: $362.6 Million Book Value per Common Share: $20.75 Regulatory Capital Ratios Tier 1 Leverage Ratio: 7.5% Common Equity Tier 1 Risk-Based Capital Ratio: 9.1% Tier 1 Risk-Based Capital Ratio: 9.7% Total Risk-Based Capital Ratio: 13.3%

Strategic Objectives 9 Be the Preeminent Community Bank in Our Marketplace Grow the Expanded Franchise Attract, Retain and Develop Talented Bankers Maximize the Efficiencies of Our Systems and Processes Identify & Execute Market Opportunities “Execute Our Mission & Deliver Results”
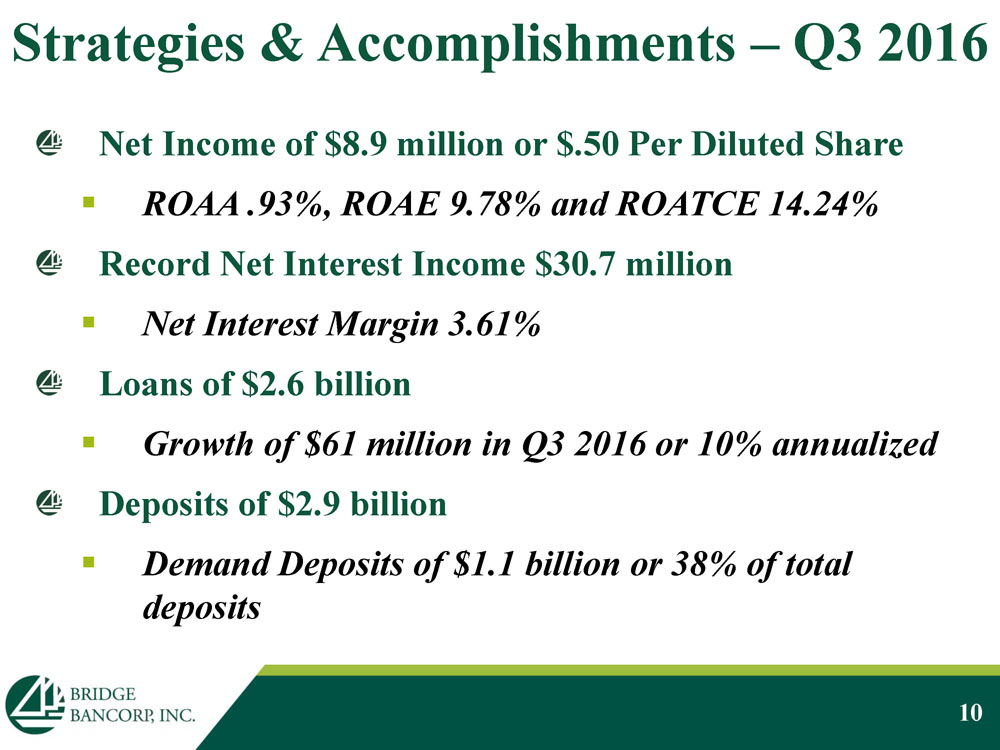
Strategies & Accomplishments – Q3 2016 Net Income of $8.9 million or $.50 Per Diluted Share ▪ ROAA .93 %, ROAE 9.78% and ROATCE 14.24% Record Net Interest Income $30.7 million ▪ Net Interest Margin 3.61% Loans of $2.6 billion ▪ Growth of $61 million in Q3 2016 or 10% annualized Deposits of $2.9 billion ▪ Demand Deposits of $1.1 billion or 38% of total d eposits 10

0.43% 0.46% 0.83% BDGE Proxy Peer Group SNL U.S. Bank $1B-$5B Other Income/Average Assets 3.61% 3.41% 3.61% BDGE Proxy Peer Group SNL U.S. Bank $1B-$5B Net Interest Margin Q3 2016 Performance vs Peers 11 Source: SNL Financial LC. Note: List of companies included in Proxy Peer Group can be found in the Appendix. SNL U.S. Bank $1B - $5B : Includes all Major Exchange (NYSE, NYSE MKT, NASDAQ) Banks in SNL's coverage universe with $1B to $5B in Assets as of most recent financial data . Includes median values. 2.03% 2.06% 2.71% BDGE Proxy Peer Group SNL U.S. Bank $1B-$5B Other Expense/Average Assets 0.21% 0.14% 0.10% BDGE Proxy Peer Group SNL U.S. Bank $1B-$5B Provision for Loan Losses to Average Assets 0.93% 0.94% 0.93% BDGE Proxy Peer Group SNL U.S. Bank $1B-$5B Return on Average Assets 9.78% 9.51% 8.98% BDGE Proxy Peer Group SNL U.S. Bank $1B-$5B Return on Average Equity

Consistent Balance Sheet Growth 12 Total Assets Note: Dollars in millions. Source : SNL Financial LC and Company documents. (1) Includes acquisition of Hamptons State Bank.. (2) Includes acquisition of FNBNY Bancorp, Inc. (3) Includes acquisition of Community National Bank. $573.6 $607.4 $839.1 $897.1 $1,028.3 $1,337.3 $1,624.6 $1,896.6 $2,288.5 $3,782.0 $3,834.0 2006 2007 2008 2009 2010 2011¹ 2012 2013 2014² 2015³ 9/30/2016 $612.1 $798.4 $1,013.3 $1,338.3 $2,410.8 $2,586.3 $1,188.2 $1,409.3 $1,539.1 $1,833.8 $2,843.6 $2,923.7 2011¹ 2012 2013 2014² 2015³ 9/30/2016 2011¹ 2012 2013 2014² 2015³ 9/30/2016 Gross Loans Held for Investment Total Deposits

Diversified Loan Composition 13 Commercial Mortgages: Non - Owner Occupied 26% Commercial Mortgages: Owner Occupied 19 % Multi - Family 11% Equity Loans 7% Residential Mortgages 10% Land & Construction Loans 5% Commercial Loans 21 % Consumer Loans 1 % As of September 30, 2013 $2.6 Billion in Total Loans as of September 30, 2016 with an Average Yield of 4.77% As of September 30, 2016 Commercial Mortgages: Non - Owner Occupied 22% Commercial Mortgages: Owner Occupied 17% Multi - Family 20% Equity Loans 2 % Residential Mortgages 15% Land & Construction Loans 3% Commercial Loans 20% Consumer Loans 1%

CRE Concentration Update Implemented Post - Closing Quality Control Process New Origination System to streamline the lending process and enhance portfolio management Enhanced Annual Review Process Expanding Portfolio Management Data Set (DSCR, NOI, Cap Rates, Market Rates, etc.) Evolving Capital Stress Test to Incorporate Concentration Thresholds 14

Taxi Medallions Total exposure of $27 million is exclusively first lien direct obligations of medallion owners, with 99% fleet medallion owners representing just 1.04% of total loans and 7.13% of the bank’s Tier 2 capital No new originations planned and we anticipate our exposure and concentration levels to decline even further through amortization, pay - downs and total loan portfolio growth Only NYC - Manhattan medallions ; All loans carry personal guarantees and are current as of September 30, 2016 There are no more loans in the portfolio coming due in 2016 . Approximately 12% of the portfolio comes due in Q1 2017 15

Asset Quality Ratios 16 ALLL / Total Loans¹ Past Due & NPLs/Total Loans NPLs / Total Loans YTD Net Loan Losses/ Avg. Total Loans² ALLL / NPLs Historical 09/30/2015 1.30% 0.35% 0.06% 0.03% 1,444% 12/31/2015 1.21 % 0.17% 0.06% 0.05% 1,537% 03/31/2016 1.21% 0.24% 0.07% 0.03% 1,333% 06/30/2016 1.20% 0.31% 0.08% 0.02% 1,108% 09/30/2016 1.19% 0.27% 0.08% 0.03% 1,185% Proxy Peer Group (9/30/2016) 0.90% 0.58% 0.39% 0.06% 376% (1) Bridgehampton National Bank originated loans (2) Annualized

Conservative Securities Portfolio 17 $894 Million in Securities Exceptional Credit Quality with 75% Guaranteed by the U.S. Government Effective Portfolio Duration is 3.07 Years Agency CMO's 48% MBS 17% Agencies 7% Munis 21% Corporate; Others 7% September 30, 2016

Exposure to Interest Rate Risk 18 Interest Rate Risk 9/30/16 12/31/15 Earnings at Risk (Max.) Potential Percentage (%) Change in Future Net Interest Income (“NII”) Year 1 NII (% Change from Year 1 – Base) Up 200 basis points (4.6)% (4.9)% Year 1 NII (% Change from Year 1 – Base) Up 100 basis points (2.2)% (2.6)% Year 1 NII (% Change from Year 1 – Base) Static – – Year 1 NII (% Change from Year 1 – Base) Down 100 basis points (0.1)% (0.2)%

Attractive Deposit Profile 19 $2.9 billion in Deposits, Average Cost of 24 Basis Points 5 Year Annualized Growth of 20% (18% Over 10 Years) Seasoned Bankers Well Known in the Community Branches Still Matter Certificates of Deposit 7% Savings & NOW 17% Money Market 38% Demand Deposits 38% September 30, 2016
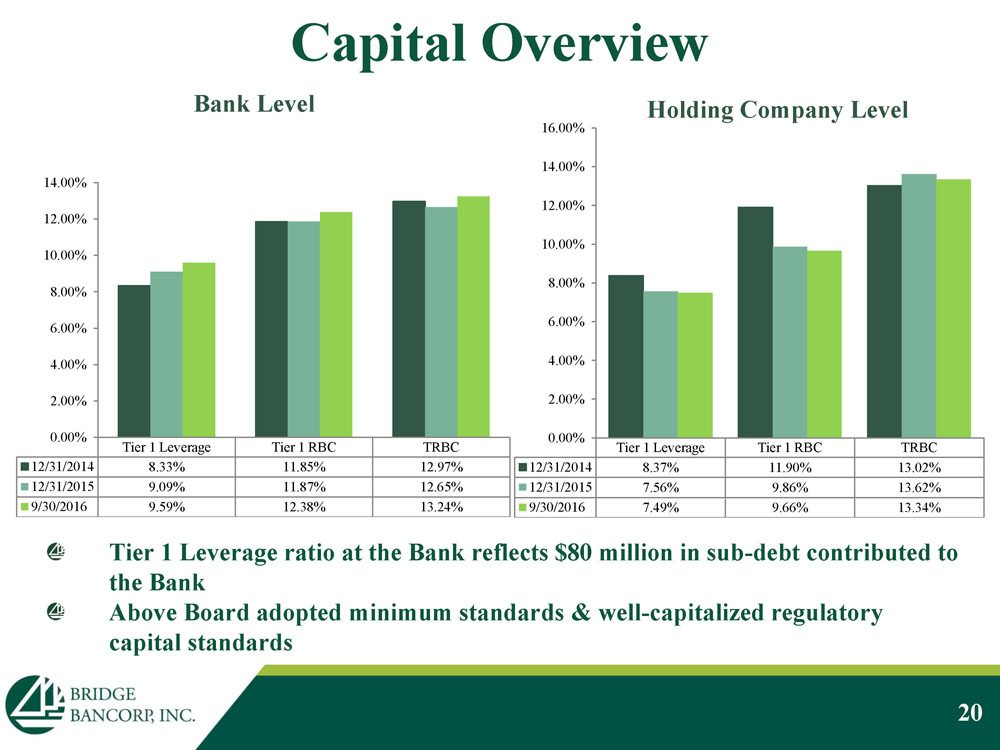
Capital Overview 20 Tier 1 Leverage Tier 1 RBC TRBC 12/31/2014 8.33% 11.85% 12.97% 12/31/2015 9.09% 11.87% 12.65% 9/30/2016 9.59% 12.38% 13.24% 0.00% 2.00% 4.00% 6.00% 8.00% 10.00% 12.00% 14.00% Bank Level Tier 1 Leverage Tier 1 RBC TRBC 12/31/2014 8.37% 11.90% 13.02% 12/31/2015 7.56% 9.86% 13.62% 9/30/2016 7.49% 9.66% 13.34% 0.00% 2.00% 4.00% 6.00% 8.00% 10.00% 12.00% 14.00% 16.00% Holding Company Level Tier 1 Leverage ratio at the Bank reflects $80 million in sub - debt contributed to the Bank Above Board adopted minimum standards & well - capitalized regulatory capital standards

Building Blocks For 2016 & Beyond Expand SBA and Residential Lending Platforms ▪ Leverage Branch Footprint ▪ Received Preferred Lender Provider Status Hired Equipment Finance Team ▪ Diversifies Loan Portfolio with Higher Yielding Assets Hired Experienced Wealth Management Executive ▪ Expands Reach into Newly Acquired Markets NYCB Acquisition of Astoria/Peoples United Acquisition of Suffolk Bancorp ▪ Disruption in Long Island Markets – Customers & Employees ▪ Branch Closures Anticipated in Overlapping Markets 21

Summary Strong & Consistent Financial Performance Outstanding Asset Quality and Balance Sheet Flexibility Superior Franchise Growth with Compelling Opportunities Well - Positioned in Economically Attractive Markets Experienced Management Team and Board of Directors Clear Understanding of Risks, Opportunities and Challenges 22

Appendix

Proxy Peer Group 24 Company Name Ticker Location Total Assets 9/30/2016 TowneBank TOWN Portsmouth, VA 7,830,142 Eagle Bancorp Inc EGBN Bethesda, MD 6,762,132 WSFS Financial Corp . WSFS Wilmington, DE 6,627,593 Brookline Bancorp Inc. BRKL Boston, MA 6,380,312 Flushing Financial Corp. FFIC Uniondale, NY 5,999,255 Dime Community Bancshares Inc. DCOM Brooklyn, NY 5,821,786 Lakeland Bancorp LBAI Oak Ridge, NJ 4,904,291 Sandy Spring Bancorp Inc. SASR Olney, MD 4,810,611 ConnectOne Bancorp, Inc. CNOB Englewood Cliffs, NJ 4,327,804 Century Bancorp Inc. CNBKA Medford, MA 4,298,323 Cardinal Financial Corp. CFNL McLean, VA 4,219,648 Washington Trust Bancorp Inc. WASH Westerly, RI 4,204,034 Meridian Bancorp Inc. EBSB Peabody, MA 4,173,130 OceanFirst Financial Corp. OCFC Toms River, NJ 4,151,017 Univest Corp. of Pennsylvania UVSP Souderton, PA 4,140,444 Oritani Financial Corp. ORIT Township of Washington, NJ 3,794,642 Peapack - Gladstone Financial PGC Bedminster, NJ 3,774,383 First of Long Island Corp. FLIC Glen Head, NY 3,434,495 Bryn Mawr Bank Corp. BMTC Bryn Mawr , PA 3,174,080 Enterprise Bancorp Inc. EBTC Lowell, MA 2,470,849 Suffolk Bancorp SCNB Riverhead, NY 2,196,475 Hingham Instit. for Savings HIFS Hingham, MA 1,960,309 Note: Dollars in thousands Source : SNL Financial LC
Serious News for Serious Traders! Try StreetInsider.com Premium Free!
You May Also Be Interested In
- Down Payment Resource reports highest annual down payment assistance program count growth on record
- HOOKIPA Pharma Announces FDA Clearance of its Investigational New Drug Application for HB-700 for the Treatment of KRAS-Mutated Cancers
- LSL Pharma Group Secures $3.8 Million as the Second and Final Tranche of Its Private Placement of Units
Create E-mail Alert Related Categories
SEC FilingsSign up for StreetInsider Free!
Receive full access to all new and archived articles, unlimited portfolio tracking, e-mail alerts, custom newswires and RSS feeds - and more!
