

Form DEF 14A LINCOLN NATIONAL CORP For: May 27
 Tweet
Tweet Share
ShareTable of Contents
UNITED STATES
SECURITIES AND EXCHANGE COMMISSION
Washington, DC 20549
SCHEDULE 14A
PROXY STATEMENT PURSUANT TO SECTION 14(A) OF THE
SECURITIES EXCHANGE ACT OF 1934 (AMENDMENT NO. )
Filed by the Registrant x
Filed by a Party other than the Registrant ¨
Check the appropriate box:
| ¨ | Preliminary Proxy Statement |
| ¨ | Confidential, For Use of the Commission Only |
| (as permitted by Rule 14a-6(e)(2)) |
| x | Definitive Proxy Statement |
| ¨ | Definitive Additional Materials |
| ¨ | Soliciting Material Pursuant to §240.14a-12 |
Lincoln National Corporation
(Name of Registrant as Specified in Its Charter)
(Name of Person(s) Filing Proxy Statement if other than the Registrant)
Payment of Filing Fee (Check the appropriate box):
| x | No fee required. |
| ¨ | Fee computed on table below per Exchange Act Rules 14a-6(i)(1) and 0-11. |
| 1. | Title of each class of securities to which transaction applies: |
| 2. | Aggregate number of securities to which transaction applies: |
| 3. | Per unit price or other underlying value of transaction computed pursuant to Exchange Act Rule 0-11 (Set forth the amount on which the filing fee is calculated and state how it was determined): |
| 4. | Proposed maximum aggregate value of transaction: |
| 5. | Total fee paid: |
| ¨ | Fee paid previously with preliminary materials. |
| ¨ | Check box if any part of the fee is offset as provided by Exchange Act Rule 0-11(a)(2) and identify the filing for which the offsetting fee was paid previously. Identify the previous filing by registration statement number, or the Form or Schedule and the date of its filing. |
| 1. | Amount Previously Paid: |
| 2. | Form, Schedule or Registration Statement No.: |
| 3. | Filing Party: |
| 4. | Date Filed: |
Table of Contents
Radnor, Pennsylvania / April 15, 2016
DEAR FELLOW SHAREHOLDER:
You are invited to attend our 2016 Annual Meeting of Shareholders, to be held Friday, May 27 at The Ritz-Carlton Hotel in Philadelphia, Pennsylvania. Our Board of Directors and management team look forward to greeting you.
This document describes the matters to be voted on at the Annual Meeting, so please review it carefully.
Many shareholders received a notice of Internet availability instead of paper copies of our proxy statement and our 2015 Annual Report to Shareholders. The notice of Internet availability provides instructions on how to access these documents over the Internet and how to receive a paper or email copy of our proxy materials, including our proxy statement, our 2015 Annual Report to Shareholders and a proxy card. Electronic delivery enables us to more cost-effectively provide you with the information you need while reducing the environmental impact of printing and mailing paper copies.
Please vote your shares of our stock as promptly as possible. You may vote by mailing in a proxy card, by telephone or Internet, or by attending the Annual Meeting and voting in person.
On behalf of the entire Board of Directors, thank you for your continued support.
Sincerely,

William H. Cunningham
Chairman of the Board
Table of Contents
NOTICE OF ANNUAL MEETING OF SHAREHOLDERS
| May 27, 2016 | 9:00 a.m. | The Ritz-Carlton Hotel | ||
| local time | 10 Avenue of the Arts | |||
| Philadelphia, Pennsylvania 19102 |
Mailing date: April 15, 2016
The purpose of the meeting is to:
| 1. | elect seven Directors for a one-year term expiring at the 2017 Annual Meeting of Shareholders; |
| 2. | ratify the appointment of Ernst & Young LLP as our independent registered public accounting firm for 2016; |
| 3. | approve an advisory resolution on the compensation of our named executive officers; |
| 4. | consider and vote upon a shareholder proposal if properly presented at the meeting; and |
| 5. | consider and vote upon any other matters that might come up at the meeting. |
You may vote at the Annual Meeting if you were a shareholder of record at the close of business on March 21, 2016. Please cast your votes by one of the following methods:

|

|

|

| |||
| SIGNING AND RETURNING | TOLL-FREE | THE INTERNET | IN PERSON AT THE | |||
| A PROXY CARD | TELEPHONE | ANNUAL MEETING | ||||
If, going forward, you would like to receive electronic delivery of future proxy materials, please see page 78 for more information.
For the Board of Directors,

Kirkland L. Hicks
Executive Vice President, General Counsel & Secretary
Lincoln National Corporation
Radnor, Pennsylvania
Table of Contents
| 1 | ||||
| 4 | ||||
| 13 | ||||
| 13 | ||||
| 13 | ||||
| 17 | ||||
| 19 | ||||
| AGENDA ITEM 2 - RATIFICATION OF APPOINTMENT OF INDEPENDENT REGISTERED PUBLIC ACCOUNTING FIRM |
23 | |||
| Independent Registered Public Accounting Firm Fees and Services |
23 | |||
| 24 | ||||
| 24 | ||||
| 25 | ||||
| 26 | ||||
| 28 | ||||
| 29 | ||||
| 54 | ||||
| 55 | ||||
| 55 | ||||
| 58 | ||||
| 60 | ||||
| 62 | ||||
| 62 | ||||
| 64 | ||||
| 66 | ||||
| AGENDA ITEM 4 - SHAREHOLDER PROPOSAL TO ADOPT SIMPLE MAJORITY VOTE |
73 | |||
| 75 | ||||
| 75 | ||||
| 76 | ||||
| 78 | ||||
| 82 | ||||
| 82 | ||||
| 83 | ||||
| 83 | ||||
| 83 | ||||
| 83 | ||||
| E-1 | ||||
| EXHIBIT 2 - LIST OF INVESTMENT COMPANIES FROM THE 2014 MCLAGAN SURVEY |
E-4 | |||
| E-5 |
IMPORTANT NOTICE REGARDING THE AVAILABILITY OF PROXY MATERIALS FOR THE ANNUAL MEETING OF SHAREHOLDERS TO BE HELD ON MAY 27, 2016: This proxy statement and the accompanying annual report are available at: www.proxydocs.com/lnc.
Table of Contents
This summary highlights certain information for your convenience. Since it does not contain all of the information you should consider, we encourage you to read the entire proxy statement carefully before voting.
ANNUAL MEETING OF SHAREHOLDERS
| DATE / TIME | PLACE | VOTING | ||
| Friday, May 27, 2016 9:00 a.m. local time |
The Ritz-Carlton Hotel 10 Avenue of the Arts Philadelphia, PA 19102
RECORD DATE |
Shareholders as of the record date are entitled to vote. Each share of common stock is entitled to one vote for each director nominee and one vote for each of the other proposals. | ||
| March 21, 2016
|
||||
VOTING MATTERS
| AGENDA ITEM | OUR BOARD’S VOTING RECOMMENDATION |
WHERE TO FIND MORE INFORMATION | ||||
| 1. | Election of seven directors for a one-year term expiring at the 2017 Annual Meeting of Shareholders. | FOR each director nominee | Page 13 | |||
| 2. | Ratification of the appointment of Ernst & Young LLP as independent registered public accounting firm for 2016. | FOR the ratification | Page 23 | |||
| 3. | Approval of an advisory resolution on the compensation of our named executive officers. | FOR the resolution | Page 26 | |||
| 4. | Shareholder proposal, if properly presented at the meeting. | AGAINST the proposal | Page 73 | |||
BOARD OF DIRECTOR NOMINEES
| NAME OCCUPATION |
AGE | DIRECTOR SINCE |
SKILLS/QUALIFICATIONS | INDEPENDENT | COMMITTEE MEMBERSHIPS | |||||
| William H. Cunningham | 72 | 2006 | • finance and capital management | Yes | • Compensation | |||||
| Professor, University of | • marketing/public relations | • Corporate Governance | ||||||||
| Texas at Austin and James | • corporate governance | |||||||||
| J. Bayless Chair for Free | • Executive (Chair) | |||||||||
| Enterprise at the University’s | • Finance | |||||||||
| McCombs School of Business | ||||||||||
| George W. Henderson, III | 67 | 2006 | • accounting | Yes | • Audit | |||||
| Retired Chairman and Chief | • finance and capital management | • Finance | ||||||||
| Executive Officer, Burlington | ||||||||||
| Industries, Inc. | ||||||||||
| Eric G. Johnson | 65 | 1998 | • business operations and strategic planning | Yes | • Compensation | |||||
| President and Chief Executive | • finance and capital management | • Executive | ||||||||
| Officer, Baldwin Richardson | • marketing/public relations | • Finance (Chair) | ||||||||
| Foods Company | ||||||||||
- 1 -
Table of Contents
BOARD OF DIRECTOR NOMINEES (cont’d.)
| NAME OCCUPATION |
AGE | DIRECTOR SINCE |
SKILLS/QUALIFICATIONS | INDEPENDENT | COMMITTEE MEMBERSHIPS | |||||
| M. Leanne Lachman | 73 | 1985 | • business operations and strategic planning | Yes | • Audit (Chair) | |||||
| President, Lachman | • finance and capital management | |||||||||
| Associates LLC and Executive | • marketing/public relations | |||||||||
| in Residence, Columbia | • corporate governance | |||||||||
| Graduate School of Business | ||||||||||
| William Porter Payne | 68 | 2006 | • finance and capital management | Yes | • Corporate | |||||
| Chairman, Centennial | • marketing/public relations | Governance | ||||||||
| Holding Company, LLC | • legal and regulatory | • Executive | ||||||||
| • corporate governance | ||||||||||
| Patrick S. Pittard | 70 | 2006 | • public accounting | Yes | • Compensation | |||||
| Chairman, PatrickPittard | • finance and capital management | (Chair) | ||||||||
| Advisors, LLC | • talent management | |||||||||
| • corporate governance | ||||||||||
| Isaiah Tidwell | 71 | 2006 | • accounting | Yes | • Audit | |||||
| Retired Executive Vice | • risk management | • Corporate | ||||||||
| President and Georgia | • corporate governance | Governance | ||||||||
| Wealth Management Director, | (Chair) | |||||||||
| Wachovia Bank, N.A. | ||||||||||
The directors continuing in office until the 2017 Annual Meeting are:
| ● | Dennis R. Glass, President and Chief Executive Officer of Lincoln National Corporation; |
| ● | Gary C. Kelly, Chairman of the Board, President and Chief Executive Officer of Southwest Airlines Co.; and |
| ● | Michael F. Mee, retired Executive Vice President and Chief Financial Officer of Bristol-Myers Squibb Company. |
GOVERNANCE HIGHLIGHTS
Sound governance is important to our Board, which regularly evaluates and implements policies that reflect corporate governance best practices. Some of these practices are:
| ● | The Chairman of the Board is an independent director; |
| ● | All of our directors, except for the chief executive officer, are independent; |
| ● | We have majority voting and a director resignation policy for directors in uncontested elections; |
| ● | We have robust stock ownership guidelines for directors and executive officers; |
| ● | Independent directors meet regularly in executive session; |
| ● | The Board and its committees conduct annual self-evaluations; and |
| ● | As of the Annual Meeting in 2017, we will no longer have a classified Board and all directors will stand for election annually. |
- 2 -
Table of Contents
EXECUTIVE COMPENSATION HIGHLIGHTS
The key objectives of our executive compensation program are to:
| MOTIVATE OUR EXECUTIVES | PAY COMPENSATION | RETAIN KEY EXECUTIVE | ||
| TO INCREASE PROFITABILITY | THAT VARIES BASED ON | TALENT, AS THIS IS CRITICAL | ||
| AND SHAREHOLDER RETURN | PERFORMANCE | TO OUR SUCCESS |
We are asking you to cast an advisory, nonbinding vote to approve compensation awarded to our named executive officers (“NEOs”) — our chief executive officer (“CEO”), chief financial officer (“CFO”) and three other most highly paid executive officers, as listed on page 28. At our last Annual Meeting, shareholders expressed strong support for our executive compensation programs, with 97% of votes cast in favor of the advisory resolution on executive compensation.
PAY FOR PERFORMANCE
We seek to align pay and performance by making a significant portion of our NEOs’ compensation dependent on:
| ● | achieving specific annual and long-term strategic and financial goals; and |
| ● | increasing shareholder value. |
2015 Pay Mix. NEO compensation is weighted toward variable compensation (annual and long-term incentives), which is at risk because the actual amounts earned could differ from targeted amounts based on corporate and individual performance. As the following charts show, the vast majority of our CEO’s and other NEOs’ target direct compensation for 2015 could vary significantly based on company performance, including stock-price performance.
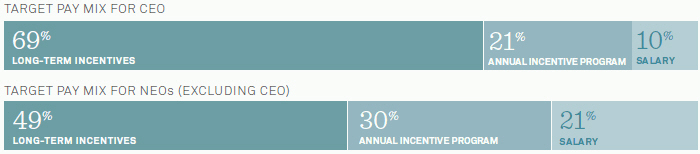
Note, the amounts in these graphs are shown at target and therefore will not match the values reflected in the Summary Compensation Table on page 55. For additional details about our executive compensation programs and our NEOs’ fiscal year 2015 compensation, please see “Compensation Discussion & Analysis” beginning on page 28 and “Executive Compensation Tables” beginning on page 55.
Proxy Statement
ANNUAL MEETING OF SHAREHOLDERS | MAY 27, 2016
The Board of Directors of Lincoln National Corporation (the “Company,” “we,” “us” or “Lincoln”) is soliciting proxies in connection with the proposals to be voted on at the 2016 Annual Meeting of Shareholders, which will be held on Friday, May 27 at The Ritz-Carlton Hotel, 10 Avenue of the Arts, Philadelphia, Pennsylvania 19102, beginning at 9:00 a.m. local time. This proxy statement and a proxy card or a notice of Internet availability were sent to our shareholders on or about April 15. When we refer to the Meeting or the Annual Meeting, we are also referring to any meeting that results from an adjournment of the Annual Meeting.
- 3 -
Table of Contents
Our Board of Directors has 10 members, 9 of whom are non-employees, or outside directors. The Board has determined that all 9 outside directors are independent, as discussed below. The Board may fill a director vacancy or reduce the size of the Board without shareholder approval.
BOARD LEADERSHIP STRUCTURE
The Board has no set policy requiring separation of the offices of CEO and Chairman of the Board (“Chairman”). It believes that the decision on whether or not to separate these roles should be part of the regular succession planning process and made based on the best interests of the Company.
Currently, we separate the roles of CEO and Chairman in recognition of the differences between these roles. The CEO is responsible for setting the Company’s performance and strategic direction and for day-to-day leadership, while the Chairman provides guidance to the CEO and management, consults on the agenda for Board meetings, acts as the key liaison between the Board and management, and presides over meetings of the full Board and of the independent directors. He also has the authority to call special meetings of the Board.
The Board elects the Chairman annually. William H. Cunningham, an independent director, has served as our Chairman since 2009.
BOARD’S ROLE IN RISK OVERSIGHT
Enterprise risk management is an integral part of our business processes. Senior management is primarily responsible for establishing policies and procedures designed to assess and manage the Company’s significant risks. We also have a Corporate Enterprise Risk and Capital Committee, made up of members of senior management and the Chief Risk Officer, that provides oversight of our enterprise-wide risk structure and of our processes to identify, measure, monitor and manage significant risks, including credit, market and operating risk.
The Board’s role is regular oversight of the enterprise risk management process, including reviews of operational, financial, legal/regulatory, compensation, strategic and competitive risks. The Board reviews the most significant risks the Company faces and the manner in which our executives manage these risks. The Board has also delegated certain of its risk oversight efforts to its Committees, as shown below. This structure enables the Board and its Committees to coordinate the risk oversight role, particularly with respect to risk interrelationships. We believe that the separation of the Chairman and CEO roles supports the Board’s oversight role.
|
BOARD AND COMMITTEES: AREAS OF RISK OVERSIGHT
| ||||||
| FULL BOARD
|
AUDIT
|
COMPENSATION
|
FINANCE
| |||
|
● Strategy
● Operations
● Competition
● Financial strategies and transactions |
● Company’s enterprise risk management efforts
● Financial statements
● Financial reporting process
● Accounting and audit matters
● Legal, compliance and regulatory matters |
● Compensation policies and practices
● Executive incentive compensation and stock ownership
● Executive retention and succession planning |
● Investment policies, strategies and guidelines
● Capital management and structure
● Financial plan | |||
- 4 -
Table of Contents
OUR CORPORATE GOVERNANCE GUIDELINES
The Board’s Corporate Governance Guidelines provide a framework for effective corporate governance and set expectations for how the Board should perform its functions. The Guidelines include the following key principles:
| ● | A majority of our Board must at all times be “independent” as defined by Securities and Exchange Commission (“SEC”) rules and New York Stock Exchange (“NYSE”) listing standards. |
| ● | Our independent directors must meet in executive session at least once a year, with no members of management present. Our outside directors, all of whom are independent, meet in connection with each regularly scheduled Board meeting and at any other times they may choose. |
| ● | Only independent directors may serve on the Audit, Compensation and Corporate Governance committees. |
| ● | The written charters of the Audit, Compensation, and Corporate Governance committees comply with the NYSE’s listing standards and are reviewed at least once each year. |
| ● | We have a Code of Conduct, available on our website at www.lfg.com, which includes our “code of ethics” for purposes of SEC rules and our “code of business conduct and ethics” for purposes of the NYSE listing standards. We will disclose amendments to or waivers from a required provision of the code by including such information on our website. |
| ● | Directors may not stand for election or reelection after reaching age 75. |
The full texts of our Corporate Governance Guidelines and committee charters are available on our website at www.lfg.com.
DIRECTOR INDEPENDENCE
Under the Corporate Governance Guidelines, a majority of our directors must at all times be “independent” and meet the NYSE listing standards regarding independence as incorporated in our Corporate Governance Guidelines. Among other things, these standards require the Board to determine that our independent directors have no material relationship with Lincoln other than as directors.
Applying these standards, the Corporate Governance Committee and the Board have reviewed the independence of each director and director nominee, and the Board has determined that:
| ● | directors Cunningham, Henderson, Johnson, Kelly, Lachman, Mee, Payne, Pittard and Tidwell are independent; and |
| ● | all members of the Audit, Compensation and Corporate Governance committees are independent of our management and of the Company. |
In conducting its independence review, the Board will consider, among other things, transactions and relationships between each outside director (or any member of his or her immediate family) and us or our subsidiaries and affiliates. The Board takes into account that in the ordinary course of business, we conduct transactions with companies at which some of our directors are or have been directors, employees or officers. Transactions that are in the ordinary course of business on terms substantially equivalent to those prevailing at the time for comparable transactions, and that fall below the threshold levels set forth in our independence standards do not impact a director’s independence under our standards.
- 5 -
Table of Contents
DIRECTOR NOMINATION PROCESS
Under our Corporate Governance Guidelines, the Board is responsible for selecting its own members. The Corporate Governance Committee is charged with:
| ● | identifying the competencies appropriate for the Board; |
| ● | identifying which, if any, of those competencies may be missing or under-represented on the current Board; |
| ● | identifying individuals with appropriate qualifications and attributes; and |
| ● | recommending to the Board the director nominees for the next annual meeting of shareholders. |
Although there are no specific minimum qualifications for director nominees, the Corporate Governance Committee’s charter allows the Committee to consider any factors it deems appropriate. The Committee reviews with the Board the appropriate skills and characteristics required of directors in the context of the Board’s current make-up. In addition to considering a candidate’s background, experience and professional accomplishments, the Board looks for individuals with, among other attributes, integrity, business acumen, specific skills (such as an understanding of marketing, finance, accounting, regulation and public policy) and a commitment to our shared values.
Although the Board does not have a formal diversity policy, our Corporate Governance Guidelines specify that the Corporate Governance Committee should consider diversity in the director identification and nomination process. As a result, the Committee seeks nominees with a broad diversity of backgrounds, experiences, professions, education and differences in viewpoints and skills. Its goal is to ensure that the directors, as a group, provide a substantive blend of experience, knowledge and ability that enables the Board to fulfill its responsibilities in a constructive and collegial environment. In the annual evaluation of the Board and committees, the Board considers whether the members of the Board reflect such diversity and whether such diversity contributes to a constructive and collegial environment.
The Corporate Governance Committee begins the nomination process each year by deciding whether to renominate current directors. This includes an individual assessment of each director who will be up for reelection the following year. The Committee then reviews the results of the individual director assessments. It considers for renomination those Board members whose skills and experience continue to be relevant to our business and whose performance for the most recent term has also been favorably assessed.
When identifying potential director candidates — whether to replace a director who has retired or resigned or to expand the Board to gain additional capabilities — the Committee determines the skills, experience and other characteristics that a potential nominee should possess (in light of the composition and needs of the Board and its committees, and including whether or not the nominee would be considered independent under the NYSE listing standards) and seeks candidates with those qualifications.
Although not required to do so, the Committee may consider candidates proposed by our directors or our management and may also retain an outside firm to help identify and evaluate potential nominees. The Committee will also consider nominations from shareholders. Such nominations must be submitted in writing to our Corporation Secretary at our principal executive office, and must include the same information that would be required for a candidate to be nominated by a shareholder at a meeting of shareholders as described under “General Information – Shareholder Proposals” on page 82. Any such recommendation must be received by the Corporate Secretary not later than January 27, 2017.
If the Corporate Governance Committee determines that it should conduct a full evaluation of a prospective candidate, including an interview, one or more members of the Committee will do so, and other directors may be asked to interview the candidate as well. Upon completing the evaluation and the interview, the Committee recommends to the Board whether to nominate the individual.
- 6 -
Table of Contents
The nominee evaluation process is the same whether the nomination comes from a Board member, management or a shareholder. If the Corporate Governance Committee recommends a shareholder nominee to the Board, the Board may— as with any nominee—either accept or reject the recommendation.
ANNUAL BOARD EVALUATION
Annually, the Board conducts a self-evaluation to determine whether it and its committees are functioning effectively. The Corporate Governance Committee oversees the Board evaluation process, which is designed to elicit feedback and recommendations from the directors that will improve the effectiveness of the Board. Each year the Committee reviews the overall process for the assessment as well as the substantive matters to be addressed during the evaluation. In general, the evaluation covers a variety of topics including the Company’s strategy, financial performance, risk management and succession planning. The results of the assessment are discussed with each Committee and the full Board following the compilation of the results.
COMMUNICATIONS WITH DIRECTORS
Shareholders and others who wish to communicate with the full Board or its outside (non-executive) directors may do so by sending a letter to either “The Board of Directors” or “The Outside Directors,” as appropriate, at:
Lincoln National Corporation
150 N. Radnor Chester Road
Radnor, PA 19087
Attention: Office of the Corporate Secretary
Our Corporate Secretary receives and processes all communications and will refer relevant and appropriate communications to the Chairman. If a communication relates to possible violations of our Code of Conduct or contains concerns or complaints regarding our accounting, internal auditing controls, or auditing matters or other related concerns, it will be referred to the Audit Committee, which has a policy for reporting such information. The policy can be found on our website at www.lfg.com.
You may communicate with the Board anonymously and/or confidentially. However, if you submit your communication anonymously, we will not be able to contact you in the event we require further information. Also, while we will attempt to preserve your confidentiality whenever possible, we cannot guarantee absolute confidentiality.
BOARD AND COMMITTEE MEETINGS
The Board met four times during 2015, and each director attended 75% or more of the aggregate of: (1) the total number of Board meetings; and (2) the total number of meetings held by committees on which he or she served. Although the Board does not have a formal policy that requires directors to attend our Annual Meeting of Shareholders, directors are encouraged to attend. All of the Company’s directors attended the 2015 Annual Meeting.
- 7 -
Table of Contents
BOARD COMMITTEES
The Board has six standing committees: the Audit Committee, the Compensation Committee, the Corporate Governance Committee, the Executive Committee, the Finance Committee and the Committee on Corporate Action. The table below lists the directors who currently serve on these committees and the number of meetings each committee held during 2015. The Audit, Compensation, Corporate Governance and Finance committees conduct self-evaluations of their committee’s performance each year.
|
CURRENT COMMITTEE MEMBERSHIP AND MEETINGS HELD DURING 2015 (C=CHAIR M=MEMBER)
| ||||||||||||
| AUDIT |
COMPENSATION |
CORPORATE GOVERNANCE |
EXECUTIVE |
FINANCE |
CORPORATE ACTION1 | |||||||
| William H. Cunningham |
M | M | C | M | ||||||||
| Dennis R. Glass |
M | C | ||||||||||
| George W. Henderson, III |
M | M | ||||||||||
| Eric G. Johnson |
M | M | C | |||||||||
| Gary C. Kelly |
M | M | ||||||||||
| M. Leanne Lachman |
C | |||||||||||
| Michael F. Mee |
M | M | M | |||||||||
| William P. Payne |
M | M | ||||||||||
| Patrick S. Pittard |
C | |||||||||||
|
Isaiah Tidwell |
M | C | ||||||||||
|
Number of Meetings in 2015 |
9 | 5 | 4 | 0 | 4 | -- | ||||||
Shaded cells denote committee chair.
1. The Committee on Corporate Action takes all action by the unanimous written consent of the sole member of that Committee, and there were fourteen (14) such consents in 2015.
The functions and responsibilities of our Board’s standing committees are described below. Charters for the Audit, Compensation, Corporate Governance, Executive and Finance committees are available on the Governance section of our website at www.lfg.com.
- 8 -
Table of Contents
AUDIT COMMITTEE
The primary function of the Audit Committee is oversight, including risk oversight. This includes:
| • | helping the Board oversee: (1) the integrity of our financial statements; (2) our compliance with legal and regulatory requirements; (3) the independent auditor’s qualifications and independence; (4) the performance of our general auditor and independent auditor; and (5) our risk assessment and risk management policies and processes |
| • | hiring, firing, and evaluating the performance of the independent auditors and approving their compensation and all of their engagements |
| • | discussing the timing and process for implementing the rotation of the lead audit partner |
| • | discussing our annual and quarterly consolidated financial statements and “Management’s Discussion and Analysis of Financial Condition and Results of Operations” included in our SEC filings and annual report to shareholders |
| • | inquiring about significant risks and exposures, if any, and reviewing and assessing the steps taken to monitor and manage them |
| • | reviewing and discussing the risk policies and procedures adopted by management and the implementation of these policies |
| • | reviewing the qualifications and backgrounds of senior risk officers |
| • | establishing procedures for handling complaints regarding accounting, internal auditing controls or auditing matters and for the confidential, anonymous submission of employee concerns regarding questionable accounting or auditing matters |
| • | consulting with management before the appointment or replacement of the internal auditor |
| • | preparing the report required for inclusion in our annual proxy statement |
| • | reporting the Committee’s activities to the Board on a regular basis and making any recommendations to the Board that the Committee deems appropriate. |
The Board has determined that two of its members meet the definition of “audit committee financial expert” under SEC rules. The Board has named Gary C. Kelly as our “audit committee financial expert” for this proxy statement. The Audit Committee may obtain advice and assistance from internal or external legal, accounting or other advisers.
More information regarding the Audit Committee, including the Audit Committee Report, can be found under “Ratification of Appointment of Independent Registered Public Accounting Firm” beginning on page 23.
- 9 -
Table of Contents
COMPENSATION COMMITTEE
The principal functions of the Compensation Committee include:
| • | establishing our general compensation philosophy in consultation with the compensation consultant and senior management |
| • | ensuring that succession plans are in place for the CEO and other executive officers |
| • | reviewing and approving corporate goals and objectives for NEO compensation |
| • | evaluating the CEO’s performance and setting the CEO’s compensation level based on this evaluation |
| • | evaluating annually whether the Company’s compensation programs create unnecessary risks that could harm the Company |
| • | reviewing with management the Compensation Discussion & Analysis to be included in the proxy statement |
| • | reviewing and approving the strategies, policies and programs related to the compensation of our executive officers and other key personnel |
| • | making recommendations to the Board regarding incentive compensation and equity-based plans, and approving all grants and awards to executive officers under such plans |
| • | approving employment and severance agreements for executive officers |
| • | approving certain employee benefit and executive compensation plans and programs, and changes to such plans and programs |
| • | reporting the Committee’s activities to the Board on a regular basis and making any recommendations the Committee deems appropriate. |
The Compensation Committee may retain or obtain advice on executive compensation-related matters from a compensation consultant, outside legal counsel or other adviser. The Committee is directly responsible for appointing, compensating and overseeing the work of any such advisers and must consider certain independence factors before hiring them. More information concerning the Compensation Committee, including the role of its compensation consultant and our executive officers in determining or recommending the amount or form of executive compensation, can be found in the “Compensation Discussion & Analysis” section beginning on page 28.
- 10 -
Table of Contents
CORPORATE GOVERNANCE COMMITTEE
The principal functions of the Corporate Governance Committee include:
| • | identifying individuals qualified to become Board members |
| • | recommending to the Board nominees for director (including those recommended by shareholders in accordance with our Bylaws) |
| • | taking a leadership role in shaping our corporate governance and recommending to the Board the corporate governance principles applicable to us |
| • | developing and recommending to the Board standards for determining the independence of directors |
| • | making recommendations to the Board regarding the compensation program for directors |
| • | making recommendations to the Board regarding the size of the Board and the membership, size, structure and function of its committees |
| • | helping evaluate the Board and individual directors |
| • | reporting the Committee’s activities to the Board on a regular basis and making any recommendations the Committee deems appropriate. |
The Corporate Governance Committee may hire and terminate search firms; approve any search firm’s fees and terms of retention; and seek advice and assistance from internal or external legal, accounting or other advisers.
EXECUTIVE COMMITTEE
The principal function of the Executive Committee is to act for the Board, when necessary, between Board meetings. In such instances, the Executive Committee may act for the Board in managing and directing the Company’s business and affairs, except for matters expressly delegated to another committee or the full Board. The Executive Committee reports any actions it takes to the Board as soon as practicable.
- 11 -
Table of Contents
FINANCE COMMITTEE
The principal functions of the Finance Committee include:
| • | reviewing and providing guidance to senior management with respect to: |
| – | our annual three-year financial plan; |
| – | our capital structure, including issuance of securities by us or any of our affiliates, significant “off balance sheet” transactions, and our dividend and share repurchase strategies; |
| – | our reinsurance strategies; and |
| – | proposed mergers, acquisitions, divestitures, joint ventures and other strategic investments. |
| • | reviewing our overall credit quality and credit ratings strategy |
| • | reviewing the general account and our investment policies, strategies and guidelines |
| • | reviewing our hedging program and the policies and procedures governing the use of financial instruments, including derivatives |
| • | reviewing the funding adequacy of our qualified pension plans, including significant actuarial assumptions, investment policies and performance |
| • | reporting the Committee’s activities to the Board on a regular basis and making any recommendations the Committee deems appropriate. |
The Finance Committee may seek advice and assistance from internal or external legal, accounting or other advisers.
COMMITTEE ON CORPORATE ACTION
The Committee on Corporate Action was formed to delegate to the sole member, the CEO, the authority to take certain actions on behalf of the Board in accordance with limits set by the Board. The principal functions that have been delegated to the Committee on Corporate Action include:
| • | determining the pricing of the securities offered from our shelf registration statement, including all rates, payments, ratios, discounts and other financial measures related to the pricing of such securities |
| • | approving, as necessary, the underwriting agreement, form of security and other transaction documents relating to the offering and sale of securities under our shelf registration statement |
| • | appointing and removing certain classes of our officers as the Board may determine by resolution. |
- 12 -
Table of Contents
ITEM 1 | ELECTION OF DIRECTORS
Our Board had traditionally been divided into three classes, with each class serving for a three-year term. Elections of the Board had also been “staggered,” meaning that only one class stood for election each year. In recognition of evolving corporate governance practices, we started this process at last year’s Annual Meeting, where the class of directors up for reelection was elected for a one-year term. We will continue this process with this year’s class of directors so that, by the 2017 Annual Meeting, shareholders will elect the entire Board annually.
Each director brings a strong background and set of skills to the Board, giving the Board as a whole expertise, diversity and experience in a wide variety of areas. The Board believes that all of our directors have integrity and honesty and adhere to high ethical standards. They have also demonstrated business acumen and an ability to exercise sound judgment, as well as a commitment to serve the Company.
Unless you direct otherwise or specifically indicate that you wish to abstain from voting for one or more of the nominees on the proxy, your proxy will be voted for each of the nominees below. Each nominee is a current director of the Company and has agreed to continue serving on the Board if elected. If any nominee is unable to serve as a director, proxies may be voted for another person designated by the Board.
| The Board of Directors recommends a vote FOR each of the nominees. |
- 13 -
Table of Contents
Nominees for a Term Expiring at the 2017 Annual Meeting
|
WILLIAM H. CUNNINGHAM
PROFESSOR AT THE |
AGE: 72 DIRECTOR SINCE: 2006
Non-Executive Chairman of the Board since: 2009
Member, Compensation, Corporate Governance, Executive and Finance Committees
|
| CAREER | Mr. Cunningham has been a professor with The University of Texas since 2000. Before that he served as Chancellor and CEO of The University of Texas System, as President of The University of Texas at Austin and as Dean of the McCombs School of Business.
| |
| QUALIFICATIONS | Substantial experience in accounting, marketing, finance and corporate governance, as well as experience leading a large public institution. Mr. Cunningham also has significant experience serving on public company boards, including over 20 years in our industry as a Director of Jefferson-Pilot Corporation, a public insurance company with whom we merged in 2006.
| |
| OTHER PUBLIC COMPANY BOARDS | John Hancock Mutual Funds, 1986–present; and Southwest Airlines Co., 2000–present.
| |
| PRIOR PUBLIC COMPANY BOARD SERVICE IN PAST 5 YEARS | LIN Media LLC, (formerly LIN Television Corporation) 2002–2007 and 2009–2014; and Resolute Energy Corporation, 2009–2015.
|
|
GEORGE W. HENDERSON, III
RETIRED CHAIRMAN |
AGE: 67 DIRECTOR SINCE: 2006
Member, Audit and Finance Committees
Mr. Henderson also serves as a Director of Lincoln Life & Annuity Company of New York, one of our insurance subsidiaries. |
| CAREER | Mr. Henderson was Chairman and CEO of Burlington Industries, a global manufacturer of textile products, 1998–2003. Before that he served as that company’s President and its COO. He was also a member of Burlington’s Board of Directors for 13 years.
| |
| QUALIFICATIONS | Executive leadership and management experience at the highest levels of a global public company; significant experience with international operations and accounting and financial reporting.
| |
| OTHER PUBLIC COMPANY BOARDS | Bassett Furniture Industries, Inc., 2004–present.
|
- 14 -
Table of Contents
|
ERIC G. JOHNSON
PRESIDENT AND CEO OF BALDWIN RICHARDSON FOODS COMPANY |
AGE: 65 DIRECTOR SINCE: 1998
Chair, Finance Committee
Member, Compensation and Executive Committees |
| CAREER | Since 1997, Mr. Johnson has served as President and CEO of Baldwin Richardson Foods Company, a privately held manufacturer of products for the food service industry.
| |
| QUALIFICATIONS | Extensive executive management skills; expertise in marketing, finance and the development and execution of corporate strategy; experience in mergers and acquisitions. Through his years of service on our Board, Mr. Johnson has also developed a deep base of knowledge regarding our business and our industry.
| |
| OTHER PUBLIC COMPANY BOARDS | SUPERVALU, INC., 2013–present.
|

|
M. LEANNE LACHMAN
PRESIDENT OF LACHMAN EXECUTIVE
-IN-RESIDENCE, |
AGE: 73 DIRECTOR SINCE: 1985
Chair, Audit Committee
Ms. Lachman also serves as a Director of Lincoln Life & Annuity Company of New York, one of our insurance subsidiaries. |
| CAREER | Ms. Lachman has served since 2003 as President of Lachman Associates LLC, an independent real estate consultancy, and since 2000 as an Executive-in-Residence at Columbia Business School. Before that she was Managing Director of Lend Lease Real Estate Investments, a global institutional investment manager.
| |
| QUALIFICATIONS | Extensive background in real estate analysis, investment, management, and development, and international operations. Through more than 25 years of service on our Board, she has acquired a deep understanding of our business, our organization and our industry.
| |
| OTHER PUBLIC COMPANY BOARDS | Liberty Property Trust, 1994–present, including service on the audit, compensation and governance committees.
|
- 15 -
Table of Contents
|
WILLIAM PORTER PAYNE
CHAIRMAN OF CENTENNIAL HOLDING COMPANY, LLC |
AGE: 68 DIRECTOR SINCE: 2006
Member, Corporate Governance and Executive Committees |
| CAREER | Mr. Payne is the Chairman of Centennial Holding Company, LLC, a real estate investment firm. Previously, Mr. Payne served in an executive management role with Gleacher and Company, an investment banking and asset management firm. He was with Gleacher from 2000 through 2013.
| |
| QUALIFICATIONS | Extensive financial expertise; experience in providing strategic advisory services to complex organizations. Earlier in his career, Mr. Payne was an attorney specializing in commercial real estate transactions and mergers and acquisitions. His breadth of knowledge brings an interdisciplinary set of skills to the Board. He also has expertise in corporate governance, having served on a number of public company boards.
| |
| PRIOR PUBLIC COMPANY BOARD SERVICE IN PAST 5 YEARS | Cousins Properties, Inc., 1996–2014.
|

|
PATRICK S. PITTARD
CHAIRMAN OF PATRICKPITTARD |
AGE: 70 DIRECTOR SINCE: 2006
Chair, Compensation Committee
Mr. Pittard also serves as a Director of Lincoln Life & Annuity Company of New York, one of our insurance subsidiaries. |
| CAREER | Mr. Pittard is Chairman of Patrick Pittard Advisors LLC, a human capital firm providing “C-level” services such as executive search and talent assessment. He also serves as a leadership instructor at the Terry School of Business at the University of Georgia and was the Chairman and CEO of ACT Bridge from 2011 to 2013. Before that Mr. Pittard was Chairman, President and CEO of Heidrick & Struggles International, Inc., a worldwide provider of executive-level search and leadership services and one of the largest publicly traded global recruiting firms, from which he retired in 2002.
| |
| QUALIFICATIONS | Executive leadership and management experience at the highest levels of a global public company; experience driving strategic organizational growth; expertise in executive compensation, insurance and investments.
| |
| OTHER PUBLIC COMPANY BOARDS | Artisan Funds, 2001–present.
|
- 16 -
Table of Contents

|
ISAIAH TIDWELL
RETIRED EXECUTIVE |
AGE: 71 DIRECTOR SINCE: 2006
Chair, Governance Committee
Member, Audit Committee |
| CAREER | Before retiring in 2005, Mr. Tidwell was an Executive Vice President and Director of Wealth Management operations for Wachovia Bank in Georgia. During his career at Wachovia, he took on various roles with increasing responsibility, eventually becoming Southern Regional Executive before being promoted to Executive Vice President. Earlier in his career, Tidwell was employed in various accounting and financial positions with Celanese Corporation.
| |
| QUALIFICATIONS | Extensive experience in banking, financial services and wealth management. Through his years of service on the boards of other public companies, Mr. Tidwell has also developed knowledge of risk assessment practices and a significant understanding of finance and accounting principles.
| |
| OTHER PUBLIC COMPANY BOARDS | Synder’s–Lance, Inc. (formerly Lance, Inc.), 1995–present.
| |
| PRIOR PUBLIC COMPANY BOARD SERVICE IN PAST 5 YEARS | Harris Teeter Supermarkets, Inc. (formerly Ruddick Corporation), 1999–2014.
|
DIRECTORS CONTINUING IN OFFICE UNTIL THE 2017 ANNUAL MEETING

|
DENNIS R. GLASS
PRESIDENT AND CHIEF |
AGE: 66 DIRECTOR SINCE: 2006
Member, Executive Committee |
| CAREER | Mr. Glass has served as our President since 2006 and our CEO since 2007. He is also President of, and serves on the boards of, our principal insurance subsidiaries. Before our merger with Jefferson-Pilot Corporation, Mr. Glass was President, CEO and a Director of that company.
| |
| QUALIFICATIONS | A seasoned executive who has served in executive-level positions in the insurance industry for over 30 years, Mr. Glass brings to his role as a Director a deep knowledge of our industry, our competitors and our products.
| |
| OTHER PUBLIC COMPANY BOARDS | None in past 5 years.
|
- 17 -
Table of Contents

|
GARY C. KELLY
CHAIRMAN OF THE BOARD, |
AGE: 61 DIRECTOR SINCE: 2009
Member, Audit and Finance Committees |
| CAREER | Mr. Kelly has been CEO of Southwest Airlines since 2004, and President and Chairman since 2008. Previously Mr. Kelly held a number of senior-level positions within the Southwest organization, including CFO. Before joining Southwest, Mr. Kelly served as a CPA for a public auditing firm.
| |
| QUALIFICATIONS | Executive leadership and management experience at the highest levels of a public company; ability to provide insights into operational, regulatory and governance matters; substantial expertise in finance, accounting and financial reporting.
| |
| OTHER PUBLIC COMPANY BOARDS | Southwest Airlines Co., 2004–present.
|

|
MICHAEL F. MEE
RETIRED EXECUTIVE VICE PRESIDENT AND CHIEF FINANCIAL OFFICER OF BRISTOL-MYERS SQUIBB COMPANY |
AGE: 73 DIRECTOR SINCE: 2001
Member, Compensation and Finance Committees |
| CAREER | From 1994 to 2001, Mr. Mee was the Executive Vice President and CFO of Bristol-Myers Squibb Co., a pharmaceutical and health care products company, where he was also a member of the Office of the Chairman. Before joining Bristol-Myers Squibb, Mr. Mee served in senior financial executive positions with several Fortune 500 companies.
| |
| QUALIFICATIONS | Significant public accounting and financial reporting skills; extensive management experience and leadership skills; expertise in corporate strategy, development and investments, international operations and risk assessment.
| |
| OTHER PUBLIC COMPANY BOARDS | None in the past 5 years.
|
- 18 -
Table of Contents
COMPENSATION OF OUTSIDE DIRECTORS
The Board adheres to the following guidelines in establishing outside director compensation:
| ● | We provide competitive compensation to attract and retain high-quality outside directors; and |
| ● | A significant portion of each outside director’s compensation is paid in equity to help align our directors’ interests with those of our shareholders. |
In accordance with our Corporate Governance Guidelines, the Board’s compensation program is reviewed and assessed annually by the Corporate Governance Committee. As part of this review, the Committee may solicit the input of outside compensation consultants. During 2015, the Committee asked Pay Governance LLC, an independent compensation consultant, to provide a competitive analysis of the compensation we provide to our outside directors. As a result of that review and the Committee’s discussion, the Committee recommended to the Board an increase of $10,000 in the cash retainer for the Committee Chairs other than the Audit Committee Chair for 2016.
The following table compares our director fees for 2015 to the revised fees that took effect on January 1, 2016:
| FEES | 2015 | 2016 | ||||||
| BOARD |
||||||||
| Annual Retainer (Cash) |
$86,000 | $86,000 | ||||||
| Deferred LNC Stock Units |
$161,000 | $161,000 | ||||||
| Total Board Fees |
$247,000 | $247,000 | ||||||
| NON-EXECUTIVE CHAIRMAN OF THE BOARD |
||||||||
| Deferred LNC Stock Units |
$200,000 | $200,000 | ||||||
| COMMITTEES (CASH) |
||||||||
| Audit Committee Chair |
$30,000 | $30,000 | ||||||
| Audit Committee Member |
$10,000 | $10,000 | ||||||
| Other Committee Chair |
$10,000 | $20,000 | ||||||
SHARE OWNERSHIP REQUIREMENTS
Lincoln’s share ownership guidelines require outside directors to hold, within five years of joining the Board, interests in the Company’s common stock equal to five (5) times the annual Board cash retainer. Interests in our stock that count toward the share ownership guidelines include Deferred LNC Stock Units, LNC stock owned outright, and 33% of vested stock options. As of December 31, 2015, all of our directors are in compliance with this requirement.
- 19 -
Table of Contents
OPTIONAL DEFERRAL OF ANNUAL RETAINER
In addition to receiving Board fees in the form of Deferred LNC Stock Units, directors may defer the cash component of their annual and committee retainers into various investment options under the Lincoln National Corporation Deferred Compensation Plan for Non-Employee Directors (the “Directors’ DCP”).
The investment options track those offered to employees under the LNC Employees’ 401(k) Savings Plan (the “Employees’ 401(k) Plan”) and include a Lincoln National Corporation Stock Fund investment option (the “LNC Stock Fund”). However, the Directors’ DCP uses “phantom” versions of the Employees’ 401(k) Plan investment options, meaning that accounts are credited with earnings or losses as if the amounts had been invested in the chosen investment options.
All deferred amounts, including the annual retainer paid in Deferred LNC Stock Units, are payable only when the director retires or resigns from the Board. In addition, amounts invested in the LNC Stock Fund upon cessation of a director’s service on the Board are only payable in shares of Lincoln common stock.
MEETING FEES
No additional fees are paid for attending regularly scheduled Board or committee meetings, although the Corporate Governance Committee has discretion to recommend additional compensation ($1,100 per meeting) for additional meetings. Outside directors who are also directors of Lincoln Life & Annuity Company of New York (“LNY”), our indirect, wholly owned subsidiary, receive an annual cash retainer of $15,000 and a fee of $1,100 for each LNY Board and committee meeting they attend. During 2015, three outside directors — Mr. Henderson, Ms. Lachman and Mr. Pittard — also served as directors of LNY.
OTHER BENEFITS
We offer outside directors several benefits in addition to the compensation listed above. These include:
| ● | Financial planning services—up to $20,000 for an initial financial plan and $10,000 for annual updates. The services must be provided by a Lincoln Financial Network financial planner for the director to be reimbursed. |
| ● | Participation—at their own expense—in certain health and welfare benefits, including our self-insured medical and dental plans as well as life insurance and accidental death and dismemberment coverages. |
| ● | Participation in a matching charitable gift program through which the Lincoln Financial Foundation, Inc. matches donations from a director to one or more eligible organizations, up to an annual total of $15,000 for all gifts. |
- 20 -
Table of Contents
| COMPENSATION OF NON-EMPLOYEE DIRECTORS* DURING 2015 | ||||||||||||||
| NAME |
|
FEES EARNED OR PAID IN CASH1 ($) |
|
|
STOCK AWARDS2 ($) |
|
|
ALL OTHER COMPENSATION ($) |
|
TOTAL ($) | ||||
| William J Avery3 |
96,000 | 161,000 | 25,000 | 4,5 | 282,000 | |||||||||
| William H. Cunningham |
86,000 | 361,000 | 15,000 | 5 | 462,000 | |||||||||
| George W. Henderson, III |
115,400 | 161,000 | 10,000 | 5 | 286,400 | |||||||||
| Eric G. Johnson |
96,000 | 161,000 | - | 257,000 | ||||||||||
| Gary C. Kelly |
96,000 | 161,000 | 12,500 | 5 | 269,500 | |||||||||
| M. Leanne Lachman |
135,400 | 161,000 | 15,000 | 5 | 311,400 | |||||||||
| Michael F. Mee |
86,000 | 161,000 | - | 247,000 | ||||||||||
| William Porter Payne |
89,901 | 161,000 | 15,000 | 5 | 265,901 | |||||||||
| Patrick S. Pittard |
113,200 | 161,000 | 10,000 | 4 | 284,200 | |||||||||
|
Isaiah Tidwell |
102,099 | 161,000 | 4,250 | 5 | 267,349 | |||||||||
* As an employee of the Company, Mr. Glass receives no director compensation.
1. As described above, $86,000 of the annual retainer was paid in cash. The fees shown in this column also include any fees that an outside director was paid as the chair of a committee, as a member of the Audit Committee or for service on the Board of LNY.
2. The fair value of the stock awards was determined in accordance with Financial Accounting Standards Board (“FASB”) Accounting Standards Codification (“ASC”) Topic 718, Stock Compensation. The assumptions made in calculating the grant date fair value of stock and option awards are set forth in Note 18 of the Notes to the Consolidated Financial Statements, included in Item 8 of our Form 10-K for fiscal year ended December 31, 2015. Mr. Cunningham received an additional $200,000 in Deferred LNC Stock Units for serving as non-executive Chairman during 2015.
3. Mr. Avery retired from our Board of Directors effective December 31, 2015.
4. Includes the provision of financial planning services with an aggregate incremental cost to us of $10,000 for each of Mr. Avery and Mr. Pittard.
5. Reflects contributions made on the director’s behalf under the matching charitable gift program.
- 21 -
Table of Contents
The following table shows the number of deferred stock units and vested unexercised stock options held by each director as of December 31, 2015:
|
NAME |
DEFERRED LNC STOCK UNITS |
STOCK OPTIONS | ||||
|
William J. Avery |
6,247 | 8,506 | ||||
|
William H. Cunningham |
83,557 | 41,359 | ||||
|
George W. Henderson, III |
53,916 | 33,180 | ||||
|
Eric G. Johnson |
46,661 | 33,180 | ||||
|
Gary C. Kelly |
17,698 | 17,040 | ||||
|
M. Leanne Lachman |
56,869 | 33,180 | ||||
|
Michael F. Mee |
60,111 | 33,180 | ||||
|
William Porter Payne |
34,702 | 25,105 | ||||
|
Patrick S. Pittard |
36,849 | 19,606 | ||||
|
Isaiah Tidwell |
29,215 | 39,314 | ||||
Deferred LNC Stock Units include amounts reported in the Stock Awards column above and phantom units awarded under the LNC Outside Directors’ Value Sharing Plan, which was terminated on July 1, 2004, plus any accrued dividend equivalents, which are automatically reinvested in additional phantom units of our common stock. The stock options held by Messrs. Cunningham and Tidwell include former options for Jefferson-Pilot Corporation common stock, which were converted into stock options for our common stock in connection with our merger with Jefferson-Pilot.
- 22 -
Table of Contents
ITEM 2 | RATIFICATION OF APPOINTMENT OF INDEPENDENT REGISTERED PUBLIC ACCOUNTING FIRM
The Audit Committee evaluates the performance of the Company’s independent auditors each year and determines whether to reengage them or consider other firms. In doing so, the Committee considers the auditor’s service quality and efficiency, capability, technical expertise, and knowledge of our operations and industry.On February 24, 2016, the Committee appointed Ernst & Young LLP (“Ernst & Young”) as our independent registered public accounting firm for fiscal year 2016. We have engaged this firm and its predecessors in this capacity continuously since 1968. In addition, the Committee is involved in the selection of Ernst & Young’s lead engagement partner and ensures that the mandated rotation of the lead partner occurs routinely.
As a matter of good corporate governance, we request that our shareholders ratify (approve) this appointment, even though this is not required. If shareholders do not ratify this appointment, the Audit Committee will take note of that and may reconsider its decision. If shareholders do ratify this appointment, the Committee will still have discretion to terminate Ernst & Young and retain another accounting firm at any time during the year.
Representatives of Ernst & Young will be present at the Annual Meeting, where they will be given the opportunity to make a statement, if they wish to. They will also be available to respond to questions about their audit of our consolidated financial statements and internal controls over financial reporting for fiscal year 2015.
The Board of Directors recommends a vote FOR the ratification of Ernst & Young as our independent registered public accounting firm for 2016.
INDEPENDENT REGISTERED PUBLIC ACCOUNTING FIRM FEES AND SERVICES
The table below shows the total fees that Ernst & Young received for professional services rendered for fiscal years 2015 and 2014, with a breakdown of fees paid for different categories of work.
| FISCAL YEAR ENDED - DECEMBER 31, 2015 |
% OF TOTAL FEES |
FISCAL YEAR ENDED - DECEMBER 31, 2014 |
% OF TOTAL FEES |
|||||||||||||
| Audit Fees1 |
$10,015,790 | 90.9 | $9,841,680 | 88.1 | ||||||||||||
| Audit-Related Fees2 |
937,100 | 8.5 | 1,222,782 | 10.9 | ||||||||||||
| Tax Fees3 |
63,842 | 0.6 | 115,164 | 1.0 | ||||||||||||
| All Other Fees |
— | — | — | — | ||||||||||||
|
TOTAL FEES |
$11,016,732 | 100 | $11,179,626 | 100 | ||||||||||||
- 23 -
Table of Contents
| 1. | Audit Fees. Fees for audit services include fees and expenses associated with the annual audit, the reviews of our interim financial statements included in quarterly reports on Form 10-Q, accounting consultations directly associated with the audit, and services normally provided in connection with statutory and regulatory filings. |
| 2. | Audit-Related Fees. Audit-related services principally include employee benefit plan audits, service auditor reports on internal controls, due diligence procedures in connection with acquisitions and dispositions, reviews of registration statements and prospectuses, and accounting consultations not directly associated with the audit or quarterly reviews. |
| 3. | Tax Fees. Fees for tax services include tax-filing and advisory services. |
AUDIT COMMITTEE PRE-APPROVAL POLICY
The Audit Committee has policies and procedures to pre-approve all audit and permissible non-audit services that our accounting firm provides. Management submits to the Committee for approval a schedule of all audit, tax and other related services it expects the firm to provide during the year. The schedule includes examples of typical or known services expected to be performed, listed by category, to illustrate the types of services to be provided under each category. The Committee pre-approves the services by category, with specific dollar limits for each category. If management wants to engage the accounting firm for additional services, management must receive approval from the Committee for those services. The Committee chair also has the authority to pre-approve services between meetings, subject to certain dollar limitations, and must notify the full Committee of any such pre-approvals at its next scheduled meeting.
Ernst & Young has advised us that neither it nor any member of the firm has any financial interest, direct or indirect, in any capacity in us or our subsidiaries. The Company has made similar inquiries of our directors and executive officers, and we have identified no such direct or indirect financial interest in Ernst & Young.
- 24 -
Table of Contents
Management has primary responsibility for:
| ● | preparing our financial statements; |
| ● | establishing financial reporting systems and internal controls; and |
| ● | reporting on the effectiveness of our internal control over financial reporting. |
The Company’s independent registered public accounting firm is responsible for:
| ● | performing an independent audit of our consolidated financial statements; |
| ● | issuing a report on those financial statements; and |
| ● | issuing an attestation report on our internal control over financial reporting. |
In this context, the Audit Committee has:
| ● | reviewed and discussed with management the audited financial statements for fiscal year 2015; |
| ● | discussed with our accounting firm the matters that the Public Company Accounting Oversight Board (“PCAOB”) requires them to discuss as per Auditing Standard No. 16, Communications with Audit Committee; |
| ● | received the written disclosures and letter from our accounting firm that the PCAOB requires regarding the firm’s communications with the Audit Committee concerning independence; and |
| ● | discussed with our accounting firm that firm’s independence. |
Based upon the review and discussions referred to in this report, the Audit Committee recommended to the Board that the audited consolidated financial statements for fiscal year 2015 be included in the Company’s Annual Report on Form 10-K for fiscal year ending December 31, 2015, for filing with the SEC.
The Audit Committee
William J. Avery
George W. Henderson, III
Gary C. Kelly
M. Leanne Lachman, Chair
Isaiah Tidwell
- 25 -
Table of Contents
ITEM 3 | ADVISORY PROPOSAL ON EXECUTIVE COMPENSATION
The SEC requires that we allow shareholders to vote their approval, on an advisory basis, of the compensation of our named executive officers as disclosed in this proxy statement. As discussed in detail in the Compensation Discussion & Analysis (“CD&A”) section that begins on page 28, our executive compensation principles and underlying programs are designed to:
| ● | align the interests of our executive officers with those of our shareholders |
| ● | link executive pay directly to the attainment of short- and long-term financial/business goals, which we refer to as “pay for performance” |
| ● | attract, motivate and retain key executives who are crucial to our long-term success. |
Key features of our compensation programs include:
Pay for Performance. We link our executives’ targeted direct compensation to the performance of the Company as a whole, with the largest portion delivered as variable pay in the form of long-term equity awards and an annual incentive award. For instance in 2015, 90% of our CEO’s compensation was at risk and variable.
Compensation Tied to Enterprise Performance and Shareholder Return. Our annual and long-term incentive compensation programs have multiple balanced performance measures and goals that tie executive compensation to key enterprise performance metrics and shareholder return.
Governance/Compensation Best Practices. Among the best practices we follow: we have an independent Compensation Committee and compensation consultant; we do not provide tax gross-up benefits; and we have a double-trigger equity vesting requirement upon a change of control of the Company.
Share Ownership Requirements. Our executives are subject to rigorous stock ownership guidelines to further align their interests with the long-term interests of our shareholders. For instance, our CEO is required to hold an amount of our shares equal to seven times his base salary, and our other executive officers must hold shares equal to four times their base salary.
In addition, we recognize that strong governance/compensation principles are essential to an effective executive compensation program. These governance/compensation principles and our executive compensation philosophy are established by the Compensation Committee, which is independent of management and advised by an independent consultant. The Committee regularly reviews the compensation programs applicable to our executive officers to ensure that the programs support our objectives of aligning our executive compensation structure with our shareholders’ interests and current market practices.
Our compensation policies and procedures are described in detail on pages 28 to 54.
Although the advisory vote on this proposal is non-binding — meaning that our Board is not required to adjust our executives’ compensation or our compensation programs or policies as a result of the vote — the Board and the Compensation Committee will consider the voting results when determining compensation policies and decisions, including future executive compensation decisions. Notwithstanding the advisory nature of the vote, the resolution will be approved if more votes are cast for the proposal than against it. Abstentions and broker non-votes will not count as votes cast either for or against the proposal. We intend to hold a non-binding advisory vote on executive compensation each year, with the next such vote at our 2017 Annual Meeting.
- 26 -
Table of Contents
We urge you to read the CD&A and other information in the “Executive Compensation” section, beginning on page 28, which we believe demonstrates that our executive compensation programs align our executives’ compensation with our short- and long-term performance; provide the incentives needed to attract, motivate and retain key executives crucial to our long-term success; and align the interests of our executive officers with those of our shareholders.
The Board unanimously recommends a vote FOR this proposal and FOR the following resolution:
“Resolved, that the shareholders approve, on an advisory basis, the compensation of the named executive officers of the Company, as disclosed pursuant to the compensation disclosure rules of the Securities and Exchange Commission, including the Compensation Discussion & Analysis, the 2015 compensation tables regarding named executive officer compensation, and the accompanying narrative disclosure in this proxy statement.”
- 27 -
Table of Contents
COMPENSATION DISCUSSION & ANALYSIS
|
This Compensation Discussion & Analysis (“CD&A”) contains information about:
● our fundamental pay-for-performance compensation philosophy
● the structure of our compensation programs and the reasoning behind this structure
● how compensation decisions are made and how our compensation programs are administered
● the compensation we paid under our performance-based incentive programs for performance periods ending in 2015, and how it related to our short and long-term performance results
|
The CD&A also details the compensation of our NEOs (also referred to as “executives” or “executive officers”) included in the compensation tables beginning on page 55. These NEOs are:
DENNIS R. GLASS – President and CEO
RANDAL J. FREITAG – Executive Vice President and CFO
| LISA M. BUCKINGHAM – | Executive Vice President, Chief Human Resources Officer, Head of Brand and Enterprise Communications |
WILFORD H. FULLER – President, Annuity Solutions, LFD and LFN
MARK E. KONEN – President, Insurance and Retirement Solutions
We encourage you to read the CD&A in conjunction with the compensation tables on pages 55 to 72.
To ensure the continued effectiveness of our pay-for-performance culture, the Compensation Committee each year reviews and approves the elements, measures, targets and payouts of our executive compensation programs. In setting the programs’ performance measures and goals, the Committee chooses metrics that focus on our overall corporate strategy and are linked to our long-term financial plan. Our executives’ compensation is tied closely to the achievement of short- and long-term goals that (a) support our long-term business strategy and (b) measure the creation of sustainable long-term shareholder value.
At our 2015 Annual Meeting, shareholders expressed strong support for our executive compensation programs, with 97% of votes cast in favor of the advisory resolution on executive compensation.
- 28 -
Table of Contents
OUR PAY FOR PERFORMANCE PHILOSOPHY
We believe that those executives with significant responsibility and a greater ability to influence the Company’s results should have more of their total compensation tied directly to business results. Therefore, the vast majority of our NEO compensation is tied to Company or individual performance (and, for business-unit executives, to the performance of individual business units). This also means that the vast majority of our NEO compensation is “at risk”—executives will not reach their targeted pay amounts if the Company’s performance does not meet expectations.
In keeping with this philosophy, annual and long-term incentive awards are the largest components of total NEO compensation, and the fixed pay element — base salary — is the smallest. The variable components are:
The Annual Incentive Program (“AIP”), which ties compensation to key Company performance metrics that, while measured annually, also support our long-term strategic goals
The Long-Term Incentive Program (“LTI”) which consists of a mix of long-term equity grants —including performance shares tied to metrics that reward increased shareholder value over a three-year period
As the following charts show, the vast majority of our CEO’s and NEOs’ target direct compensation is variable (i.e., based on performance, including that of our stock price.)
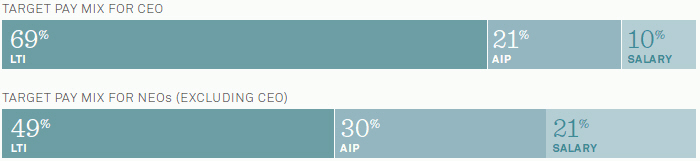
Note, the amounts in these graphs are shown at target and therefore will not match the values reflected in the Summary Compensation Table at page 55 of this proxy statement.
EXECUTIVE COMPENSATION BEST PRACTICES
When evaluating our compensation practices and policies, the Compensation Committee takes into account competitive market trends and the views of our shareholders. Examples of our governance and compensation practices include:
| ● | Robust stock ownership guidelines and stock holding requirements; |
| ● | Moderate change-of-control benefits; |
| ● | The use of an independent compensation consultant for significant compensation decisions regarding our executives; |
| ● | “Double trigger” vesting provisions for our equity awards following our change of control; |
| ● | Clawback provisions on our equity awards; |
| ● | No tax-gross-up benefits upon our change of control; |
| ● | No repricing or exchange of underwater stock options without shareholder approval; |
| ● | Restrictions regarding pledging, hedging and speculation in our securities; and |
| ● | Limited perquisites for executive officers. |
For more information, see “Change of Control Severance Arrangements” on page 53; “Alignment with Shareholders” on page 34; and “Role of the Compensation Consultant” on page 51.
- 29 -
Table of Contents
2015 PERFORMANCE OVERVIEW
We had solid financial results in 2015 as Lincoln’s franchise was resilient in what proved be a very volatile year for capital markets. We continued to focus on growth, profitability, and capital management initiatives that we believe position us well for long-term, sustainable financial results.
Our full year results included the following highlights:
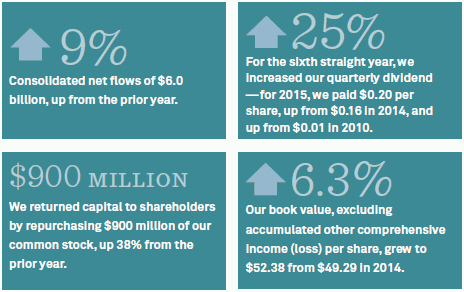
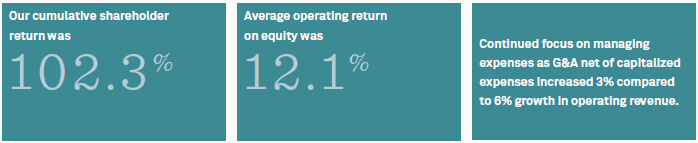
Despite these efforts to continue to build long-term value for our shareholders, our year-over-year stock price decreased 12.8% to $50.26 on December 31, 2015, from $57.67 on December 31, 2014. Over the longer term, our performance was strong. For the three year period from December 31, 2012 to December 31, 2015:
- 30 -
Table of Contents
These charts illustrate some of the measures of our full-year 2015 results. These are also among the key metrics used for our short- and long-term incentive compensation programs.
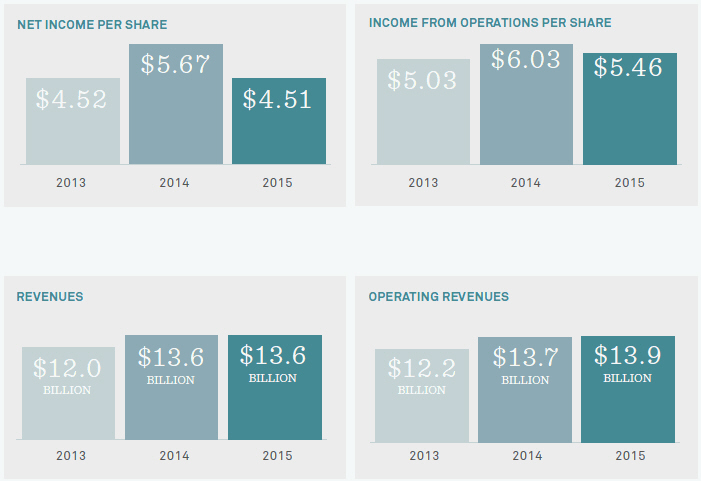
More information on our business performance during 2015 is available in our Form 10-K for fiscal year ended December 31, 2015 (the “2015 Form 10-K”), which is included in the 2015 Annual Report to Shareholders that accompanies this proxy statement. A reconciliation of the measures not shown in accordance with generally accepted accounting principles (“GAAP”) used in this proxy statement to their corresponding GAAP measures can be found in Exhibit 1 on page E-1.
- 31 -
Table of Contents
ELEMENTS OF OUR COMPENSATION PROGRAM
The following table outlines the elements of targeted direct compensation and how each element aligns with our objectives and guiding principles.
|
COMPENSATION ELEMENT |
WHAT IT REWARDS | HOW IT ALIGNS WITH OUR OBJECTIVES |
PERFORMANCE MEASURED |
FIXED OR VARIABLE |
CASH OR EQUITY | |||||
|
BASE SALARY |
· Sustained high level of performance · Demonstrated success in meeting or exceeding key objectives · Highly developed skills and abilities critical to success of the business · Experience and time in position |
· Competitive base salaries enable us to attract and retain top talent · Merit-based salary increases align with our pay-for- performance philosophy |
INDIVIDUAL | FIXED | CASH | |||||
|
ANNUAL INCENTIVE AWARDS |
· Company performance during the year against key financial goals · Specific business-segment performance during the year, measured against strategic business-segment goals |
· Competitive targets enable us to attract and retain top talent · Payouts depend on the achievement of established performance measures and goals that align pay with performance |
CORPORATE AND BUSINESS SEGMENT |
VARIABLE | CASH | |||||
|
LONG-TERM INCENTIVE AWARDS
|
||||||||||
|
NONQUALIFIED STOCK OPTIONS |
· Increase in stock price · Continued service |
· Value is dependent on our stock price; options have no value unless the stock price increases · Three-year ratable vesting supports retention |
CORPORATE | VARIABLE | EQUITY | |||||
| RESTRICTED STOCK UNITS |
· Increase in stock price and dividends · Continued service |
· Value rises or falls as our stock price and dividend increases or decreases · Three-year cliff vesting supports retention |
CORPORATE | VARIABLE | EQUITY | |||||
|
PERFORMANCE SHARES |
· Meeting or exceeding our return on equity goal · Total shareholder return performance relative to that of other companies |
· Payout is based on metrics important to our shareholders and critical to value creation · Three-year performance period supports retention and aligns pay with performance over an extended period of time · Relative performance metric creates incentive to outperform peers |
CORPORATE | VARIABLE | EQUITY | |||||
- 32 -
Table of Contents
OUR EXECUTIVE COMPENSATION PROGRAM PHILOSOPHY
Our executive compensation program has three key objectives:
|
PAY FOR PERFORMANCE |
ALIGNMENT WITH SHAREHOLDERS | |
| To link executive pay directly to the attainment of short-term and long-term financial/business goals, using short-term metrics that correlate with our strategic goals and long-term metrics that correlate to long-term shareholder value | To provide compensation arrangements that link the interests of our executive officers to those of our shareholders | |
|
COMPETITIVE COMPENSATION
| ||
| To attract and retain key executive talent | ||
These objectives, discussed below, guide us in setting and paying compensation to our NEOs.
PAY FOR PERFORMANCE
Our executive compensation program is based on a “pay-for-performance” philosophy: The vast majority of our executives’ target compensation is made up of variable (“at risk”) compensation—in the form of annual cash incentive awards and long-term equity awards—that is linked to consolidated short- and long-term business performance and each individual’s contribution to that performance. In measuring an executive’s contribution, we put a strong emphasis on the individual’s role in implementing strategies and driving performance specific to their function or the operating units they direct.
The key objectives of our pay-for-performance philosophy are to:
| ● | reward the achievement of superior financial results — in both the short term and long term — through balanced incentive programs; |
| ● | offer the opportunity to earn above-market compensation when overall and individual performance exceed expectations; and |
| ● | emphasize compensation that is at risk based on performance rather than compensation that is fixed—for instance, only 10% of our CEO’s target annual pay is fixed. |
Balanced Performance Measure and Goals
It is important to us and to our executives that performance be measurable and that compensation be paid based on criteria that executives and shareholders alike can easily identify and understand.
To implement our pay-for-performance philosophy, the Compensation Committee chooses performance measures for our NEO incentive programs that focus on our overall corporate business strategies and that, if achieved, create sustained growth for our shareholders:
| ● | Our AIP is based on the same key financial measures indicative of Lincoln’s current and future profitability; and |
| ● | Our LTI uses measures that correlate directly to the creation of long-term value for Lincoln shareholders. |
The goals for each performance measure are linked directly to the Company’s financial plan. In setting the goals, management and the Compensation Committee intend for the maximum performance levels to present a substantial challenge for our NEOs, thereby creating a strong incentive to produce superior results. For 2015, the Compensation Committee chose the following performance measures, which it has used since 2011:
- 33 -
Table of Contents
| 2015 ANNUAL INCENTIVE PROGRAM | ||
| PERFORMANCE MEASURE | WHY CHOSEN | |
| Income from Operations per Diluted Share | This is a key measure of profitability that management uses to evaluate our business and that investors commonly use to value companies in the financial services industry. | |
| Sales Growth | In our business, sales create value because, over time and at a compounded growth rate, they are an indicator of future profitability. In addition, we believe that distribution strength (depth and breadth) is an important driver of our valuation and that sales growth is an effective way to measure the value of the distribution franchise and overall product competitiveness. | |
| Controllable Costs | Management establishes annual budgets for the Company and for each business unit that are key to the success of our financial plan. The Compensation Committee sets a budget-related performance goal to reinforce the importance of containing costs and expenses across the entire company. | |
|
2015 LONG-TERM INCENTIVE PROGRAM | ||
| PERFORMANCE MEASURE | WHY CHOSEN | |
| Operating Return on Equity | This is an important measure that stock analysts use to value companies — especially those in the financial services industry — because it is a critical indicator of capital efficiency and is closely aligned with long-term shareholder value. | |
| Relative Total Shareholder Return | This measure reflects the Company’s delivery of shareholder value over time relative to that of peers. | |
ALIGNMENT WITH SHAREHOLDERS
Through our annual and long-term incentive compensation programs, our share ownership requirements and share retention policy, and the design and governance features of our long-term equity programs, we tie the financial interests of our NEOs to those of our shareholders. For both the annual and long-term programs, the Compensation Committee chooses performance goals that align with our strategies for sustained growth and profitability.
- 34 -
Table of Contents
Long-Term Incentives
The equity-based awards that are the basis of our long-term incentive compensation make up the largest part of our NEOs’ targeted direct compensation. To provide a balanced incentive program and to lessen the risk inherent in the greater focus on long-term incentives, executives receive a mix of equity-based compensation awards, which include:
| ● | Performance share awards (“PSAs”) – the number of shares actually received depends on our performance over a three-year period relative to key metrics of shareholder value; |
| ● | Restricted stock units (“RSUs”) – these awards cliff-vest three years from the date of grant (cliff-vesting acts as a retention tool for our executives) and the value ultimately realized depends on how our stock performs over that three-year period; and |
| ● | Nonqualified stock options to purchase our common stock (“Options”) – these awards vest over time and only have value if the stock price rises after the option grants are made. |
Share Ownership Guidelines and Holding Requirements
Our share ownership requirements formalize the Compensation Committee’s belief that our officers should maintain a material personal financial stake in the Company. The requirements also promote a long-term perspective in managing our business by linking the long-term interests of our executives with those of our shareholders and reducing the incentive for short-term risk-taking.
Our share ownership requirements are based on multiples of base salary and vary by job level. Equity interests counted in determining whether share ownership guidelines have been met include:
| ● | shares owned outright; |
| ● | amounts invested in shares of our common stock through our employee benefits plans; |
| ● | restricted stock and RSUs; and |
| ● | in-the-money vested Options. |
|
SHARE OWNERSHIP AND RETENTION REQUIREMENTS
| ||||
|
OFFICER POSITION |
VALUE OF SHARES THAT OFFICER MUST HOLD
|
ADDITIONAL RETENTION REQUIREMENTS | ||
|
CEO |
7 times base salary
|
25% of net profit shares* for 5 years | ||
|
Executive Officers (other than our CEO)
|
4 times base salary |
25% of net profit shares* for 5 years | ||
* Net profit shares reflect the value of an amount of shares remaining after payment of the option exercise price and taxes owed at the time of exercise plus the after-tax value of any vested RSUs or earned performance shares.
In addition to the minimum share ownership levels, each NEO must also retain an amount equal to 25% of the net profit shares resulting from equity-based LTI grants, such as vested RSUs or earned PSAs. This additional amount of shares must be held for five years from the date of exercise for Options or the date of vesting for other awards. If at any point an NEO does not meet the share ownership requirements, the executive must hold 50% of the net profit shares resulting from equity-based LTI awards that are exercised or vest, as applicable, until the required ownership level is met.
- 35 -
Table of Contents
Prohibition on Pledging and Hedging
Our Insider Trading and Confidentiality Policy includes provisions that prohibit: (i) the pledging of our securities; and (ii) the use of derivative instruments to hedge the value of any of our securities.
Multi-Year Performance and Vesting Periods
The multi-year performance criteria and vesting elements of our long-term incentive programs promote the retention of our executives by putting their focus on our long-term performance, thereby aligning our executives’ interests with those of shareholders.
Prohibition on Repricing
Our equity incentive compensation plans prohibit us from reducing the exercise price of outstanding Options without shareholder approval.
Clawback Features
The equity awards for our NEOs are subject to “clawback” and forfeiture provisions, which allow us to rescind an executive’s award(s) under certain conditions, such as if:
| ● | the executive’s employment is terminated for cause; or |
| ● | the executive violates any non-compete, non-disclosure, non-solicitation, non-disparagement or other restrictive covenant. |
For example, if an executive violates any such agreement within six months of having exercised Options or received shares from a PSA, we may rescind the exercise or award and require the executive to return any gain realized or value received.
COMPETITIVE COMPENSATION
In general, we target our executives’ total direct compensation — i.e., base salary, targeted annual incentive compensation and targeted long-term incentive compensation — at the median of the compensation paid to executives in similar positions at the insurance-based financial services and investment management companies with which we compete for talent.
Because the roles and responsibilities of our executives are unlikely to be exactly the same as those of executives with similar titles/roles in our peer companies, we often consider multiple sources of market data for this purpose. However, market data is only one of many factors considered when setting executive compensation targets. For more information on how we set target compensation and our benchmarking processes, please see “Setting Target Compensation” on page 37.
- 36 -
Table of Contents
CONSIDERATION OF OUR 2015 SHAREHOLDER VOTE ON EXECUTIVE COMPENSATION
The Compensation Committee and the Board appreciate and value the views of our shareholders. At our 2015 Annual Meeting of Shareholders, approximately 97% of shareholder votes were cast in favor of the “say on pay” advisory resolution on executive compensation. While we do review the program design on an annual basis, there have not been any significant changes to our compensation program in the last several years. In light of the continued strong shareholder support for our overall pay practices and NEO compensation, the Compensation Committee decided to maintain our general principles and philosophy in structuring executive compensation for 2016.
SETTING TARGET COMPENSATION
The Compensation Committee made compensation decisions for the 2015 calendar year for the NEOs based on a detailed analysis of Company-specific and external data.
BENCHMARKING
To help the Compensation Committee set 2015 target direct compensation levels for our NEOs, Pay Governance performed a comprehensive competitive compensation analysis in November of 2014. They analyzed base pay, annual incentive opportunities, long-term incentive values and total direct compensation (the sum of the elements listed here) to establish market rates for each executive officer position. They then compared our current executive compensation levels to the market median of our peers.
For Messrs. Glass, Freitag and Konen, and Ms. Buckingham, Pay Governance used market data drawn from the stock companies included in the Towers Watson 2014 Diversified Insurance Study of Executive Compensation (the “2014 Towers DI Study”), which are:
| AFLAC |
METLIFE | |
| AIG |
PHOENIX COMPANIES | |
| ALLSTATE |
PRINCIPAL FINANCIAL | |
| AXA GROUP |
PRUDENTIAL FINANCIAL | |
| CIGNA |
SUN LIFE FINANCIAL | |
| CNO FINANCIAL |
TRANSAMERICA | |
| GENWORTH FINANCIAL |
UNUM GROUP | |
| HARTFORD FINANCIAL SERVICES |
VOYA FINANCIAL INC. | |
| JOHN HANCOCK |
- 37 -
Table of Contents
The Compensation Committee believes that these companies are appropriate for compensation benchmarking because, even though none has our exact business mix, each is a major competitor in one or more of our businesses and competes directly with us for talent. Because some of these companies have either higher or lower market capitalization, assets or revenue than we do, the data are size-adjusted, where possible, to ensure comparability with our scope. We have used the same market survey for a number of years, and if the companies included in the study change, we reflect those changes in our benchmarking peer group. Neither the Committee nor management has any input into the companies included in this general industry survey.
The survey data were used as a primary reference for most roles. The Compensation Committee seeks to target total direct compensation within a competitive range of plus or minus 15% of the 50th percentile of market data being used. In some cases the Committee may target compensation above or below this range. Reasons for doing this include:
| ● | organizational considerations; for example, because an executive’s role is considered especially critical to our overall business strategy and to our succession planning; |
| ● | internal pay equity considerations; |
| ● | to gain the specific expertise needed to build a new business or improve an existing one; or |
| ● | to retain highly qualified executives whom we have recruited from outside the insurance industry or whom we believe have skills or experience that will further our corporate strategy. |
For Mr. Fuller, different compensation benchmarking data were reviewed due to the unique nature of his role. As President of Lincoln Financial Distributors (“LFD”) and Lincoln Financial Network (“LFN”), Mr. Fuller is responsible for our wholesale and retail distribution businesses. In addition, Mr. Fuller assumed responsibility for the Annuities business starting in March 2015. In recognition of his role, the Compensation Committee reviewed compensation data for executives in similar positions from the McLagan Partners’ Investment Products Sales and Marketing Survey for 2014, as well as from the companies in the 2014 Towers DI Study. For a list of the companies included in the McLagan Partners’ Investment Products Sales and Marketing Survey, see Exhibit 2 on page E-4.
- 38 -
Table of Contents
TALLY SHEETS
When making compensation decisions, the Compensation Committee considers:
| ● | the recommendations of our Chief Human Resources Officer (“CHRO”), the recommendations of our CEO, and the opinion of the Committee’s independent compensation consultant (although our CHRO and CEO do not make recommendations with respect to their own compensation); |
| ● | the available market data; and |
| ● | reports called “tally sheets” illustrating all elements of targeted total direct compensation, including: |
| ● | base salary; |
| ● | annual and long-term incentive awards; |
| ● | deferred compensation and change in pension; |
| ● | perquisites; and |
| ● | potential payments for various termination scenarios. |
The tally sheets enable the Compensation Committee to analyze the value of total target compensation, as well as the value of compensation actually delivered compared with the value of compensation opportunities the Committee originally established.
The Compensation Committee also uses the tally sheets to assess whether our executive compensation program is consistent with our compensation philosophy and desired positioning relative to the market data. However, tally sheets are just one point of information the Committee uses to determine NEO compensation. The Committee performed a similar analysis to establish the total targeted direct compensation for our CEO.
|
2015 TARGET TOTAL DIRECT COMPENSATION FOR OUR NAMED EXECUTIVE OFFICERS
|
| |||||||||||||||
| NAME | BASE SALARY |
ANNUAL |
LONG-TERM INCENTIVE AWARD AT TARGET |
TOTAL TARGETED |
||||||||||||
| Dennis R. Glass | $1,169,050 | $2,338,100 | $7,764,900 | $11,272,050 | ||||||||||||
| Randal J. Freitag | $650,202 | $812,753 | $1,658,000 | $3,120,955 | ||||||||||||
| Lisa M. Buckingham | $578,448 | $636,293 | $1,067,794 | $2,282,535 | ||||||||||||
| Wilford H. Fuller | $575,000 | $1,035,000 | $1,439,143 | $3,049,143 | ||||||||||||
| Mark E. Konen | $663,320 | $994,980 | $1,654,285 | $3,312,585 | ||||||||||||
- 39 -
Table of Contents
ANNUAL COMPENSATION FOR 2015
During 2015, annual compensation was made up of base salary and a short-term incentive award under the AIP.
BASE SALARY
Base salaries are reviewed annually. In setting base salary levels for 2015, the Compensation Committee started with the 2014 base salaries and then made adjustments based on the compensation analysis discussed above and the individual performance of each NEO. In general, the increases for our NEOs were around 3%, with the exception of Mr. Freitag. The Compensation Committee made a larger adjustment to his base salary to bring it more in line with the current competitive levels within our marketplace for talent. Mr. Freitag’s salary was increased 13% to $650,202.
In March 2015, the Committee met to consider additional compensation changes in light of a reorganization of the business line responsibilities of Mr. Fuller and Mr. Konen following the retirement of an executive officer. The Committee approved an increase in Mr. Fuller’s base salary from $499,000 to $575,000 effective as March 1, 2015. The Committee also approved other changes to their short- and long-term incentive compensation, which are reflected in amounts shown in the Annual Incentive Program section on page 40 and the Long-Term Compensation section on page 45.
The Committee approved the following base salaries for our NEOs effective for 2015:
| NAME |
2015 | |
| Dennis R. Glass |
$1,169,050 | |
| Randal J. Freitag |
$650,202 | |
| Lisa M. Buckingham |
$578,448 | |
| Wilford H. Fuller |
$575,000 | |
| Mark E. Konen |
$663,320 |
ANNUAL INCENTIVE PROGRAM
2015 Payout Opportunities
The table below shows the dollar amount of the estimated threshold, target and maximum payout opportunities for the 2015 AIP that the Compensation Committee established on the grant date; the threshold, target and maximum opportunities are calculated as a percentage of each NEO’s base salary. The threshold opportunity would be payable only in the case where the threshold goal is met for the performance measure with the lowest percentage payout amount.
|
ESTIMATED PAYOUT OPPORTUNITIES UNDER THE 2015 AIP
|
| |||||||||||
| NAME | THRESHOLD | TARGET | MAXIMUM | |||||||||
| Dennis R. Glass | $35,072 | $2,338,100 | $4,676,200 | |||||||||
| Randal J. Freitag | $12,191 | $812,753 | $1,625,505 | |||||||||
| Lisa M. Buckingham | $ 9,544 | $636,293 | $1,272,586 | |||||||||
| Wilford H. Fuller | $23,288 | $1,035,000 | $2,070,000 | |||||||||
| Mark E. Konen | $24,875 | $994,980 | $1,989,960 | |||||||||
- 40 -
Table of Contents
2015 Performance Measures and Goals
In February 2015, the Compensation Committee established the goals and measures for the 2015 AIP.
Performance measures. The Committee selected three performance measures for 2015, the same ones it has used since 2011.
| ● | Income from operations per share |
| ● | Sales growth |
| ● | Management of controllable costs |
The Committee chose these measures because they focus on our overall corporate strategy of balancing top-line revenue growth with profitability and prudent cost management. To learn more about why these measures were selected, see Pay for Performance on page 33.
For purposes of the 2015 AIP, Income from Operations is defined as net income in accordance with GAAP, but excluding the after-tax effects of the items detailed in Exhibit 1 on page E-1. This is one of the financial measures that management uses to assess our results. (To calculate “Income from Operations per Share,” the value of Income from Operations (as defined in Exhibit 1) was divided by the average diluted shares). Management believes that excluding these items from net income better reflects the underlying trends in our businesses because the excluded items are unpredictable and not necessarily indicative of current operating fundamentals or future performance of the business segments. In addition, in most instances decisions regarding these items do not necessarily relate to the operations of the individual segments.
For our CEO, performance is measured entirely at the corporate level, while our other NEOs are assessed on both corporate and business unit performance. To reflect the different roles and responsibilities of our NEOs, the Committee also weights the performance measures differently for each NEO, as shown in the tables on pages 42 to 44. As noted above, the Committee met again in March 2015 to consider and approve revised short-term incentive targets and performance measures and weightings for Messrs. Fuller and Konen to reflect their new business line reporting responsibilities after the reorganization. These revised measures are reflected in the below tables.
Performance goals. In setting the goals for each of the performance measures, management and the Compensation Committee intended the maximum levels to present a significant challenge, therefore requiring exceptionally strong performance to achieve these goals. The target goal for corporate Income from Operations per Share was set after consideration of a number of factors, including a review of our internal financial plan. The target goal for sales growth, at both the corporate and business-unit level, was based on our internal financial plan, emphasizing our corporate strategy to grow and protect the profitability of the business. The target goal for controllable costs was based upon controllable costs as budgeted in our annual financial plan. We believe that our methodology for determining financial performance targets for the AIP supports the following key objectives:
| ● | Aligning incentives with our annual financial plan; |
| ● | Establishing challenging yet achievable incentive targets for our executives; and |
| ● | Setting targets that are consistent with our assessment of opportunities and risks for the upcoming year. |
2015 Performance Results and Actual Payouts
In February 2016, the Compensation Committee certified the performance results for the 2015 AIP. These formulaic results triggered a payout that was below target for all of our NEOs, except Mr. Fuller.
The following tables show the goals, weights, performance results and payout percentages for the 2015 AIP measures for each of our NEOs. Based on actual results, a payout percentage—expressed as a percentage of the NEO’s target payout opportunity—is first determined for each goal. These payouts are then weighted to determine the weighted payout for each goal. The sum of these weighted payouts equals the NEO’s payout percentage.
- 41 -
Table of Contents
The tables also show the resulting performance-based payouts approved by the Compensation Committee under the 2015 AIP for each of our NEOs and how these payouts compared with each NEO’s target payout opportunity under this program.
DENNIS R. GLASS
| CORPORATE MEASURES (100%) |
||||||||||||||||||||||||
| SALES GROWTH | ||||||||||||||||||||||||
| INCOME FROM OPERATIONS PER SHARE |
LIFE | GROUP PROTECTION |
ANNUITIES | RETIREMENT PLAN SERVICES |
ENTERPRISE CONTROLLABLE COSTS |
|||||||||||||||||||
| GOALS |
||||||||||||||||||||||||
|
Threshold |
$5.66 | $636 M | $426 M | $12,320 M | $6,627 M | N/A | ||||||||||||||||||
|
Target |
$6.22 | $723 M | $485 M | $14,000 M | $7,530 M | 100% | ||||||||||||||||||
|
Maximum |
$6.97 | $809 M | $543 M | $15,680 M | $8,434 M | 89% | ||||||||||||||||||
|
RESULTS |
||||||||||||||||||||||||
|
Certified Performance |
$6.08 | $725 M | $408 M | $12,692 M | $7,545 M | 96% | ||||||||||||||||||
|
Payout as Percentage of Target |
81.3% | 102.3% | 0.0% | 41.6% | 101.7% | 134.3% | ||||||||||||||||||
|
Weighting |
50.0% | 11.0% | 8.0% | 10.0% | 6.0% | 15.0% | ||||||||||||||||||
|
Weighted Payout |
40.6% | 11.3% | 0.0% | 4.2% | 6.1% | 20.1% | ||||||||||||||||||
| PAYOUT | ||||||||||||
| PERCENTAGE | ||||||||||||
| TARGET OPPORTUNITY |
(sum of weighted payouts) |
PAYOUT AMOUNT |
||||||||||
| ACTUAL PAYOUT UNDER THE 2015 AIP |
$2,338,100 | 82.3% | $ | 1,924,256 | ||||||||
RANDAL J. FREITAG
| CORPORATE MEASURES (92.5%) |
BUSINESS UNIT | |||||||||||||||||||||||||||
| MEASURES | ||||||||||||||||||||||||||||
| SALES GROWTH | ||||||||||||||||||||||||||||
| INCOME FROM OPERATIONS PER SHARE |
LIFE | GROUP PROTECTION |
ANNUITIES | RETIREMENT PLAN SERVICES |
ENTERPRISE CONTROLLABLE COSTS |
CONTROLLABLE COSTS FINANCE |
||||||||||||||||||||||
| GOALS |
||||||||||||||||||||||||||||
|
Threshold |
$5.66 | $636 M | $426 M | $12,320 M | $6,627 M | N/A | N/A | |||||||||||||||||||||
|
Target |
$6.22 | $723 M | $485 M | $14,000 M | $7,530 M | 100% | 100% | |||||||||||||||||||||
|
Maximum |
$6.97 | $809 M | $543 M | $15,680 M | $8,434 M | 89% | 90% | |||||||||||||||||||||
|
RESULTS |
||||||||||||||||||||||||||||
|
Certified Performance |
$6.08 | $725 M | $408 M | $12,692 M | $7,545 M | 96% | 98.9% | |||||||||||||||||||||
|
Payout as Percentage of Target |
81.3% | 102.3% | 0.0% | 41.6% | 101.7% | 134.3% | 110.8% | |||||||||||||||||||||
|
Weighting |
50.0% | 11.0% | 8.0% | 10.0% | 6.0% | 7.5% | 7.5% | |||||||||||||||||||||
|
Weighted Payout |
40.6% | 11.3% | 0.0% | 4.2% | 6.1% | 10.1% | 8.3% | |||||||||||||||||||||
| PAYOUT | ||||||||||||
| PERCENTAGE | ||||||||||||
| TARGET OPPORTUNITY |
(sum of weighted payouts) |
PAYOUT AMOUNT |
||||||||||
| ACTUAL PAYOUT UNDER THE 2015 AIP |
$812,753 | 80.5% | $654,266 | |||||||||
- 42 -
Table of Contents
LISA M. BUCKINGHAM
| CORPORATE MEASURES (85%) |
BUSINESS UNIT MEASURES | |||||||||||||||||||||||||||
| SALES GROWTH | ||||||||||||||||||||||||||||
| INCOME FROM OPERATIONS PER SHARE |
LIFE | GROUP PROTECTION |
ANNUITIES | RETIREMENT PLAN SERVICES |
CONTROLLABLE COSTS HUMAN RESOURCES |
CONTROLLABLE COSTS MARKETING |
||||||||||||||||||||||
| GOALS |
||||||||||||||||||||||||||||
|
Threshold |
$5.66 | $636 M | $426 M | $12,320 M | $6,627 M | N/A | N/A | |||||||||||||||||||||
|
Target |
$6.22 | $723 M | $485 M | $14,000 M | $7,530 M | 100% | 100% | |||||||||||||||||||||
|
Maximum |
$6.97 | $809 M | $543 M | $15,680 M | $8,434 M | 90% | 90% | |||||||||||||||||||||
|
RESULTS |
||||||||||||||||||||||||||||
|
Certified Performance |
$6.08 | $725 M | $408 M | $12,692 M | $7,545 M | 97.9% | 98.3% | |||||||||||||||||||||
|
Payout as Percentage of Target |
81.3% | 102.3% | 0.0% | 41.6% | 101.7% | 121.1% | 117.1% | |||||||||||||||||||||
|
Weighting |
50.0% | 11.0% | 8.0% | 10.0% | 6.0% | 7.5% | 7.5% | |||||||||||||||||||||
|
Weighted Payout |
40.6% | 11.3% | 0.0% | 4.2% | 6.1% | 9.1% | 8.8% | |||||||||||||||||||||
| PAYOUT PERCENTAGE |
||||||||||||
| TARGET OPPORTUNITY |
(sum of weighted payouts) |
PAYOUT AMOUNT |
||||||||||
| ACTUAL PAYOUT UNDER THE 2015 AIP |
$636,293 | 80.0% | $509,034 | |||||||||
WILFORD H. FULLER
| CORPORATE MEASURES |
BUSINESS UNIT MEASURES (80%) |
|||||||||||||||||||||||||||
| SALES GROWTH | ||||||||||||||||||||||||||||
| INCOME FROM OPERATIONS PER SHARE |
INCOME FROM OPERATIONS FOR ANNUITIES |
NET CONTRIBUTION MARGIN FOR LFD AND LFN |
LIFE | ANNUITIES | RPS SMALL MARKET |
CONTROLLABLE LFD & LFN |
||||||||||||||||||||||
| GOALS |
||||||||||||||||||||||||||||
|
Threshold |
$5.66 | $840 M | ($4.4) M | $636 M | $12,320 M | $1,870 M | N/A | |||||||||||||||||||||
|
Target |
$6.22 | $954 M | $15.6 M | $723 M | $14,000 M | $2,125 M | 100% | |||||||||||||||||||||
|
Maximum |
$6.97 | $1,107 M | $35.6 M | $809 M | $15,680 M | $2,380 M | 85% | |||||||||||||||||||||
|
RESULTS |
||||||||||||||||||||||||||||
| Certified Performance |
$6.08 | $998 M | $16.5 M | $725 M | $12,692 M | $2,131 M | 92.0% | |||||||||||||||||||||
|
Payout as Percentage of Target |
81.3% | 128.8% | 104.5% | 102.3% | 41.6% | 102.4% | 155.9% | |||||||||||||||||||||
|
Weighting |
20.0% | 26.0% | 10.0% | 12.5% | 12.5% | 9.0% | 10.0% | |||||||||||||||||||||
|
Weighted Payout |
16.3% | 33.5% | 10.5% | 12.8% | 5.2% | 9.2% | 15.6% | |||||||||||||||||||||
| PAYOUT | ||||||||||||
| PERCENTAGE | ||||||||||||
| TARGET OPPORTUNITY |
(sum of weighted payouts) |
PAYOUT AMOUNT |
||||||||||
| ACTUAL PAYOUT UNDER THE 2015 AIP |
$1,035,000 | 103.0% | $1,066,050 | |||||||||
- 43 -
Table of Contents
MARK E. KONEN
| CORPORATE | BUSINESS UNIT MEASURES (80%) |
|||||||||||||||||||||||||||||||
| MEASURES | ||||||||||||||||||||||||||||||||
| INCOME FROM OPERATIONS | SALES GROWTH |
|||||||||||||||||||||||||||||||
| INCOME FROM OPERATIONS PER SHARE |
LIFE | GROUP PROTECTION |
RPS | LIFE | GROUP PROTECTION |
RPS | CONTROLLABLE COSTS LIFE, GP AND RPS |
|||||||||||||||||||||||||
| GOALS |
||||||||||||||||||||||||||||||||
|
Threshold |
$5.66 | $486 M | $48 M | $123 M | $636 M | $426 M | $6,627 M | N/A | ||||||||||||||||||||||||
|
Target |
$6.22 | $552 M | $55 M | $140 M | $723 M | $485 M | $7,530 M | 100% | ||||||||||||||||||||||||
|
Maximum |
$6.97 | $640 M | $63 M | $162 M | $809 M | $543 M | $8,434 M | 90% | ||||||||||||||||||||||||
|
RESULTS |
||||||||||||||||||||||||||||||||
|
Certified Performance |
$6.08 | $488 M | $43 M | $141 M | $725 M | $408 M | $7,545 M | 98.7% | ||||||||||||||||||||||||
|
Payout as Percentage of Target |
81.3% | 27.3% | 0.0% | 104.5% | 102.3% | 0.0% | 101.7% | 113.0% | ||||||||||||||||||||||||
|
Weighting |
20.0% | 12.0% | 12.0% | 12.0% | 10.0% | 10.0% | 14.0% | 10.0% | ||||||||||||||||||||||||
|
Weighted Payout |
16.3% | 3.3% | 0.0% | 12.5% | 10.2% | 0.0% | 14.2% | 11.3% | ||||||||||||||||||||||||
| PAYOUT | ||||||||||||
| PERCENTAGE | ||||||||||||
| TARGET OPPORTUNITY |
(sum of weighted payouts) |
PAYOUT AMOUNT |
||||||||||
| ACTUAL PAYOUT UNDER THE 2015 AIP |
$994,980 | 67.8% | $674,596 | |||||||||
The Compensation Committee can, at its discretion, reduce award payouts by including, rather than excluding, certain factors — listed in Items A through H of Exhibit 3 on page E-5 — if it determines that these factors were relevant to individual performance. The Committee may also make other discretionary adjustments to the calculation of the performance results if the net effect would be to reduce award amounts. In certifying the results for the 2015 AIP awards, the Compensation Committee did not reduce the award payout levels from the formulaic results.
- 44 -
Table of Contents
LONG-TERM COMPENSATION AWARDED OR VESTED IN 2015
Long-term compensation for our NEOs generally includes three equity elements:
| ● | Options, which have a 10-year term and vest ratably over three years; |
| ● | RSUs, which cliff-vest in three years; and |
| ● | PSAs, which vest, if at all, depending on the outcome of pre-established performance measures over a three-year performance period. Consistent with our fundamental pay-for-performance philosophy, these awards are linked to metrics that measure the creation of long-term shareholder value, with above-target compensation paid out only when performance has exceeded the target level. PSA payouts are capped at two times target. |
2015 LTI AWARD MIX
The charts below show our targeted long-term incentive mix — i.e., the percentage of the total 2015 LTI award delivered through each equity element for our CEO and the other NEOs. Starting in 2014, in recognition of our CEO’s career stage, the Compensation Committee reduced the percentage of his LTI award delivered as Options and increased the percentage delivered as RSUs. They made additional revisions to the mix for the CEO in 2015. For the other NEOs, the Committee increased the percentage of their LTI award delivered as PSAs and decreased the amount delivered as RSUs, and this mix remained the same for 2015.
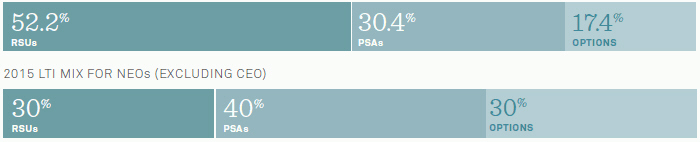
The RSUs and PSAs will be paid in shares of our common stock if the applicable vesting requirements and, in the case of PSAs, performance targets are met. Long-term equity-based awards such as these encourage our NEOs to act as owners, thus aligning their interests with those of shareholders. The Options, which vest ratably over a three-year period, and the RSUs, which cliff vest in three years, are not tied to formulas that could focus our executives on specific short-term outcomes. Instead, the value of these awards to our NEOs depends on the positive financial performance of our Company over time, as expressed through the multi-year increase in share value. These equity awards are subject to the clawback provisions detailed on page 36.
- 45 -
Table of Contents
2015-2017 PERFORMANCE SHARE AWARDS
The 2015-2017 performance cycle began on January 1, 2015, and ends on December 31, 2017. In February 2015, the Committee established:
| ● | the threshold, target, and maximum PSA amounts payable to the NEOs; |
| ● | the relevant performance measures (ROE and Relative TSR); |
| ● | the peer group used to assess Relative TSR performance; |
| ● | the relative weighting of each performance measure; and |
| ● | the goals for threshold, target and maximum payouts for each performance measure. |
The maximum goals were intended to present a challenge for management and create appropriate incentives for our executives to create financial growth and long-term shareholder value. For each performance measure, the maximum payout, 200% of target, occurs when performance is superior and the minimum payout, 25% of target, results when the performance threshold is met but not exceeded. For example, the minimum award for a performance measure is calculated as follows: 25% multiplied by the relative weighting of the performance measure multiplied by the target payout opportunity.
The two performance measures for the 2015-2017 (Return on Equity and Relative Total Shareholder Return) are weighted equally. For any portion of the PSAs to ultimately vest, the minimum achievement level for at least one of the performance measures must be attained. In other words, if performance on both measures falls below the threshold, there is no payout.
PERFORMANCE AWARD MEASURES, WEIGHTINGS, AND GOALS
FOR THE 2015-2017 PERFORMANCE AWARD CYCLE
| Return on Equity (ROE) | Relative Total Shareholder Return (TSR) | |||||||||
| Why Chosen: A key measure of our financial health that management uses to evaluate our business and that is also used by investors to value companies in the financial services industry. It provides a meaningful measure of performance that is closely tied to long-term shareholder value. | Why Chosen: Assesses the Company’s delivery of shareholder value over time relative to that of our peers. | |||||||||
| Relative weight: 50%
|
Relative weight: 50%
|
|||||||||
|
GOAL AT THRESHOLD |
GOAL AT TARGET |
GOAL AT MAXIMUM |
GOAL AT THRESHOLD |
GOAL AT TARGET |
GOAL AT MAXIMUM | |||||
|
11.61% |
12.26% | 12.91% | RANKING OF 8TH |
MEDIAN OF PEER GROUP |
RANKING OF 1ST TO 3RD | |||||
Among the factors the Committee considered in setting the TSR and ROE performance measures were peer group performance, market data and our financial plan. In establishing the weightings of the performance share plan measures, the Compensation Committee took into account its belief, and that of management, that, over the long-term, ROE is a key input to shareholder value and TSR represents the actual value delivered to shareholders. The specific goals for each measure were set for compensation purposes only and do not constitute, and should not be viewed as, management’s projection of future results.
- 46 -
Table of Contents
ROE for the 2015-2017 performance period is an absolute measure that is to be calculated as of the end of the performance period. ROE is defined as Income from Operations (as defined above with respect to the 2015 AIP) divided by average shareholders’ equity for the year. Shareholders’ equity excludes accumulated other comprehensive income or other similar items and any increase in equity due to goodwill associated with an acquisition during the performance period.
TSR for the 2015-2017 performance period is a relative measure based on Lincoln’s TSR for the performance period ranked against the TSR results for the peer group shown below. The Committee believes that the performance peer group should be limited to companies that publish financial results against which our results are compared and that offer competing insurance and financial products. The TSR Performance Peer group was updated for the 2015-2017 performance period to remove Protective Life, which was acquired by a foreign company, and to add Voya Financial Inc. (formerly ING).
2015-2017 RELATIVE TSR PERFORMANCE PEER GROUP
| GENWORTH FINANCIAL |
SUN LIFE FINANCIAL | |
|
MANULIFE |
SYMETRA FINANCIAL | |
|
METLIFE |
TORCHMARK | |
|
PRINCIPAL FINANCIAL |
UNUM GROUP | |
|
PRUDENTIAL FINANCIAL |
VOYA FINANCIAL |
As noted above, the Committee met again on March 30, 2015, to consider and approve revised long-term incentive targets for Messrs. Fuller and Konen to reflect their new business line reporting responsibilities after the reorganization. These revised targets are reflected in the below tables. While the incremental LTI awards for Messrs. Fuller and Konen were approved by the Committee on March 30, 2015, in accordance with our Equity Award Procedures discussed on page 52, the effective date of these grants was May 1, 2015, the first day of the open window period following the meeting. If earned, the 2015-2017 performance share awards will be paid out in shares of our common stock. The table shows the number of shares that our executives have the potential to earn at different performance levels:
|
ESTIMATED SHARE PAYOUT OPPORTUNITIES UNDER THE 2015-2017 PERFORMANCE AWARD CYCLE AS OF GRANT DATE* |
| |||||||||||
| NAME | THRESHOLD (#) | TARGET (#) | MAXIMUM (#) | |||||||||
| Dennis R. Glass |
5,069 | 40,551 | 81,102 | |||||||||
| Randal J. Freitag |
1,423 | 11,384 | 22,768 | |||||||||
| Lisa M. Buckingham |
917 | 7,332 | 14,664 | |||||||||
| Wilford H. Fuller |
1,238 | 9,902 | 19,804 | |||||||||
| Mark E. Konen |
1,421 | 11,367 | 22,734 | |||||||||
* Amounts do not include dividend equivalents
The grant date fair value of the Options, RSUs and PSAs awarded in 2015 are included in the Summary Compensation Table on page 55. Additional details regarding the 2015-2017 PSAs granted to the NEOs can be found in the Grants of Plan-Based Awards table on page 58.
- 47 -
Table of Contents
2013-2015 LTI PROGRAM
The Compensation Committee established the performance-based 2013 LTI Program at its February 2013 meeting, with performance metrics that measure the creation of long-term shareholder value. The Committee approved the equity awards under the 2013 LTI Program, including grants of Options, RSUs and PSAs.
Options and RSUs
The Options vested over a three-year period, with one-third vesting on the anniversary of the grant date. The RSUs cliff vested three years from the date of grant. The final tranche of Options and the RSUs vested on February 28, 2016. Additional details regarding the Options and RSUs granted in 2013 can be found in the Outstanding Equity Awards table on page 60.
2013-2015 Performance Share Awards
At that February 2013 meeting, the Committee also established the 2013-2015 performance cycle for PSAs for the period that began January 1, 2013, and ended on December 31, 2015. The Compensation Committee set:
| ● | the threshold, target and maximum PSA amounts payable to the NEOs; |
| ● | the relevant performance measures (ROE and Relative TSR); |
| ● | the relative weighting of each performance measure; and |
| ● | the goals for threshold, target and maximum payouts for each performance measure (25%, 100% and 200% of target, respectively). |
The payouts for the 2013-2015 LTI PSAs could have ranged from 0% to 200% of each NEO’s target, with a threshold payout for each performance measure equal to 25% of target. For the PSA to be payable, the threshold or minimum achievement level for at least one of the performance measures must have been attained. Therefore, a minimum award would be calculated as follows: 25% multiplied by the relative weighting of the performance measure multiplied by the target amount.
The following table shows the number of shares that each NEO had the potential to earn under the 2013-2015 LTI performance period at the threshold, target and maximum levels:
|
ESTIMATED SHARE PAYOUT OPPORTUNITIES UNDER THE 2013–2015 PERFORMANCE AWARD CYCLE AS OF GRANT DATE* |
| |||||||||||
| NAME | THRESHOLD (#) | TARGET (#) | MAXIMUM (#) | |||||||||
| Dennis R. Glass |
9,293 | 74,340 | 148,680 | |||||||||
| Randal J. Freitag |
1,958 | 15,665 | 31,330 | |||||||||
| Lisa M. Buckingham |
1,513 | 12,102 | 24,204 | |||||||||
| Wilford H. Fuller |
1,733 | 13,862 | 27,724 | |||||||||
| Mark E. Konen |
2,320 | 18,563 | 37,126 | |||||||||
| * | Amounts do not include dividend equivalents. |
- 48 -
Table of Contents
In February 2016, the Compensation Committee reviewed the reports and analysis that management provided regarding our performance during the 2013-2015 performance cycle and determined the results for each performance measure, as shown in the graphic below. As of December 31, 2015, the Company’s ROE, was 11% which matched the goal at maximum shown in the table below. The Company’s TSR for the performance period was 116%, which was ranked 2nd among the peers listed below. As a result of the strong performance by the Company in each of these key metrics over the performance period (which met the maximum performance level for each measure), the Compensation Committee approved a payout of the 2013-2015 performance share awards at 200% of target.
PERFORMANCE GOALS, ACTUAL RESULTS AND ACTUAL PAYOUT PERCENTAGES
FOR THE 2013-2015 PERFORMANCE AWARD CYCLE
|
Return on Equity (ROE) Relative weight: 50% |
Relative Total Shareholder Return (TSR) Relative weight: 50% | |||||||||||
| GOAL AT THRESHOLD | GOAL AT TARGET | GOAL AT MAXIMUM |
GOAL AT THRESHOLD |
GOAL AT TARGET | GOAL AT MAXIMUM | |||||||
| 10% | 10.5% | 11% | RANKING OF 7th |
MEDIAN OF PEER GROUP |
RANKING OF 1ST TO 2ND | |||||||
| ACTUAL RESULTS | PAYOUT AS PERCENTAGE OF TARGET |
ACTUAL RESULTS |
PAYOUT AS PERCENTAGE OF TARGET | |||||||||
| 11% | 200% | 2ND IN PEER GROUP (TSR OF 116%) |
200% | |||||||||
ROE for the 2013-2015 LTI performance period was an absolute measure that was calculated as of the end of the three year performance period. ROE was calculated using the definition of Income from Operations that the Committee set for the 2013 AIP and divided by average Shareholders’ Equity for the year. The definition of ROE used in this calculation can be found in Exhibit 3 on page E-5.
TSR for the 2013-2015 LTI was based on our TSR results for the performance period ranked against the TSR results for the peer group shown below:
2013-2015 RELATIVE TSR PEER GROUP
| GENWORTH FINANCIAL |
PRUDENTIAL FINANCIAL | |
|
MANULIFE |
SYMETRA FINANCIAL | |
|
METLIFE |
SUN LIFE FINANCIAL | |
|
PRINCIPAL FINANCIAL |
TORCHMARK | |
|
PROTECTIVE LIFE 1 |
UNUM GROUP |
1. Due to the acquisition of Protective Life during the 2013-2015 performance period, it was removed from the Peer Group in accordance with the provisions of the 2013 LTI program.
TSR was defined as the change in the price of a share of our common stock plus dividends paid, over the relevant performance period, divided by the price of a share of our common stock at the beginning of the performance period. We used an average of the prices of the common stock as reported on the NYSE consolidated transactions tape for the 45 calendar days preceding the beginning and end dates to determine the beginning and ending share prices for the performance period to eliminate the effects of any short-term volatility on the stock price.
- 49 -
Table of Contents
The table below shows the resulting payouts:
|
ACTUAL PAYOUTS UNDER 2013-2015 PERFORMANCE SHARE AWARDS | ||||||
| NAME | TARGET (# OF SHARES) |
PAYOUT PERCENTAGE OF TARGET |
PAYOUT (# OF SHARES)1 | |||
| Dennis R. Glass |
74,340 | 200% | 148,680 | |||
| Randal J. Freitag |
15,665 | 200% | 31,330 | |||
| Lisa M. Buckingham |
12,102 | 200% | 24,204 | |||
| Wilford H. Fuller |
13,862 | 200% | 27,724 | |||
| Mark E. Konen |
18,563 | 200% | 37,126 | |||
1. Share amounts do not include dividends accrued through the vesting date. For the actual payout amounts including dividends, see the Outstanding Equity Awards Table on page 60.
PARTICIPATION IN EXECUTIVE COMPENSATION DECISIONS
ROLE OF THE COMPENSATION COMMITTEE
The Compensation Committee has primary authority for determining the compensation of our executive officers, including our NEOs. Specifically, it:
| ● | approves the individual pay components and aggregate compensation amounts for our executives; |
| ● | determines the form(s) in which compensation will be paid — i.e., cash or equity — and the equity vehicles to be used, including Options, PSAs or RSUs, among others; and |
| ● | establishes the target award levels and performance measures for the various short- and long-term compensation programs. |
For a description of the Compensation Committee’s principal functions, see “The Board of Directors and Committees – Compensation Committee” on page 10.
The Compensation Committee normally determines the portion of performance-based incentive awards earned for completed performance cycles at its first regularly scheduled meeting of the calendar year (usually in February) following the end of the applicable performance cycle. During this meeting, the Committee reviews financial results for the various performance measures for the just-completed annual and long-term performance cycles; certifies the achievement (or non-achievement) of the performance goals; and approves the earned portion of the awards, as appropriate.
ROLE OF MANAGEMENT
In determining executive compensation, the Compensation Committee considers input from a number of sources, including executive management. However, neither our CEO nor our CHRO play any role in, and are not present for, any discussions regarding their own compensation. Specifically, our CEO and CHRO provide the Compensation Committee with their views and insight on NEO compensation (for roles other than their own), including:
| ● | their assessment of individual performance, the business environment, succession planning and retention; and |
| ● | recommendations for base salary, target annual incentive awards and target long-term incentive awards for each NEO. |
The Committee views this input as an essential component of the process.
- 50 -
Table of Contents
ROLE OF THE COMPENSATION CONSULTANT
The Compensation Committee regularly consults with Pay Governance LLC, an independent compensation consultant, for advice regarding compensation practices for our executives. The Committee has the sole authority to hire or fire any compensation consultant, as well as to establish the scope of the consultant’s work.
During 2015, Pay Governance provided the Committee with:
| ● | an evaluation of our executive officers’ base salaries and short- and long-term target incentive compensation relative to that of identified peers and the broader market; |
| ● | an evaluation of the alignment of the Company’s executive compensation with Company performance; |
| ● | information on trends in executive compensation, such as the use of various forms of equity compensation and the prevalence of different types of compensation vehicles; |
| ● | an advance review of all management-prepared materials for each Committee meeting; |
| ● | assistance in the review and discussion of all material agenda items; |
| ● | an independent review of our analytical work related to executive compensation; |
| ● | insight and advice in connection with the design of, and changes to, our equity grants and short- and long-term incentive plans; and |
| ● | feedback regarding our CEO’s total targeted direct compensation package. |
Pay Governance does not provide us with any services other than advising the Compensation Committee on executive compensation and the Corporate Governance Committee on director compensation. The Compensation Committee has assessed the independence of Pay Governance pursuant to SEC rules and concluded that no conflict of interest exists.
RISK CONSIDERATIONS RELATING TO COMPENSATION
The structure and administration of our compensation programs are designed to, among other objectives, appropriately balance risk and reward. As part of the annual risk assessment of our compensation plans, we identify, analyze and evaluate all of our employee compensation programs to assess any risks these programs might pose. The process includes, but is not limited to:
| ● | identifying all of the compensation programs that cover our employees; |
| ● | reviewing these programs from a design and governance perspective, including evaluating the behavior each program was designed to encourage and detailing the flow of compensation for each program; |
| ● | identifying any risks inherent in the programs, including analyzing whether any of the programs encourage our executives or any other employees to take risks that could harm the Company; and |
| ● | identifying and discussing any additional risk mitigation factors in the program design and any additional risk controls outside of the compensation process specific to each business model. |
Once the annual assessment is completed, our CFO and the Head of Total Rewards formally review the analysis of our programs and discuss the findings with the Compensation Committee.
- 51 -
Table of Contents
Some of the features of our compensation programs that limit risk include the following:
| ● | our incentive plan awards are based on a variety of performance indicators, thus minimizing the potential for any single indicator of performance to have an undue influence on payout; |
| ● | the Compensation Committee approves the final incentive plan awards and has the authority to decrease the awards even if the performance goals are met; |
| ● | the “clawback” features of our equity awards, which allow us to rescind an executive’s award(s) under certain conditions; |
| ● | the multi-year performance criteria for our LTI programs and the multi-year vesting elements of our other equity awards, which link the interests of our executives with the long-term health of the Company; |
| ● | the balanced pay mix, which minimizes the significance of any single element of pay and decreases the likelihood that an executive would take inappropriate risks to inflate such pay; |
| ● | our share ownership guidelines and holding requirements, which encourage our executives to focus on sustaining long-term performance rather than maximizing performance in any single year; and |
| ● | fixed compensation is set at a level that allows executives to meet their essential financial needs. |
For 2015, the Compensation Committee discussed the evaluation and risk assessment review of our compensation programs and confirmed that our compensation programs do not create risks that are reasonably likely to have a material adverse effect on the Company. The risk assessment for this year also identified other aspects of the administration and oversight of our plans that build considerable risk mitigation into the plans’ organizational structure.
OTHER COMPENSATION CONSIDERATIONS
Equity Award Procedures. The Compensation Committee formally approves our equity grant procedures, including procedures for granting Options. All Options are granted with a “strike,” or exercise, price set at the closing price of our common stock as reported on the composite transactions table of the NYSE on the grant date. Although the Compensation Committee Chair may approve changes to executive compensation, subject to the Committee’s review and ratification, only the full Committee or the Board has the authority to grant equity awards to executive officers.
Although the Compensation Committee typically makes equity award grants during its first regularly scheduled meeting of the calendar year, the Committee or the Board may also grant equity awards to executives at other regularly scheduled or special meetings or by taking action through unanimous written consent in order to accommodate special circumstances such as new hires or promotions.
| ● | For equity awards granted to executives at a regularly scheduled meeting of the Board or Committee, the grant date is the date of the meeting. |
| ● | For equity awards granted at a “special” meeting of the Board or Committee that does not occur during the period in which trading of our securities is permitted under our Insider Trading and Confidentiality Policy (a “window period”), the grant becomes effective on the first business day of the next window period. (Window periods generally begin on the later of the second business day after our quarterly earnings release or the first business day after our public call with investors.) |
| ● | For equity awards granted by unanimous consent, the grant becomes effective on the first business day of the week following the effective date of the written consent; however, if that business day is not during a window period, the grant becomes effective on the first business day of the next window period. |
- 52 -
Table of Contents
Tax Considerations. The Internal Revenue Code of 1986, as amended (“IRC”) generally limits a public company’s corporate income tax deduction for compensation to $1 million per year for each “covered employee,” which includes each NEO (other than our CFO). However, this limit does not apply to compensation that qualifies as “performance-based” under IRC rules. In general, we intend to design our incentive award grants to qualify as performance-based compensation under the IRC rules, and our grants are subject to limits established under the LNC 2014 Incentive Compensation Plan (referred to hereinafter as the “2014 ICP,” or collectively with the LNC 2009 Amended and Restated Incentive Compensation Plan as the “ICP”) in compliance with the relevant IRC rules.
In certain circumstances, the Compensation Committee may limit compensation awards or pay compensation that does not qualify as performance-based under the IRC rules.
| ● | For PSAs, the Committee may reduce the target award or payout for any “covered employee” or increase or decrease any other executive’s individual payout, based on certain circumstances that may occur during the cycle. |
| ● | The Committee may also award non-performance-based compensation to “covered employees” based on circumstances that could affect performance results, such as changing economic and market conditions, mergers or acquisitions, sale of a business, restructuring charges, reserve strengthening or release, and/or extraordinary natural occurrences or man- made events (e.g., acts of war). In doing so, the Committee would consider various factors, including investor reaction, stock price performance, performance of peers, retention considerations, and our CEO’s recommendation. |
Despite the Compensation Committee’s efforts to structure the AIP and PSAs for our executives in a manner intended to be exempt from Section 162(m), and as a result not subject to its deduction limits, because of ambiguities and uncertainties as to the application and interpretation of Section 162(m) and the regulations issued thereunder, no assurance can be given that compensation we intend to satisfy the requirements for exemption from Section 162(m) in fact will. Further, the Compensation Committee reserves the right to modify compensation that was initially intended to be exempt from Section 162(m) if it determines that such modifications are consistent with our business needs.
EMPLOYEE BENEFIT PLANS
We offer our executives some additional benefits not offered to our non-executive employees, in some cases to replace benefits the executives lose as a result of regulatory limits in the broad-based tax-qualified plans. We use these benefits to attract and retain key employees, since our competitors typically offer the same types of benefits.
Our Deferred Compensation Plan. We provide certain benefits to our executive officers, including NEOs, through our nonqualified defined contribution plan — the Lincoln National Corporation Deferred Compensation & Supplemental/ Excess Retirement Plan (the “DC SERP”). For more information on the DC SERP, see page 64.
Change-of-Control Severance Arrangements. We offer our executives a severance plan that provides potential benefits in connection with a change of control of the Company. Payment of benefits under this plan, the Lincoln National Corporation Executives’ Severance Benefit Plan (the “LNC COC Plan”), is triggered when an executive’s employment is terminated (under specific circumstances) in anticipation of or within two years after our change of control. The objectives of the change-of-control benefits are to:
| ● | retain qualified executives in the face of an actual or threatened change of control of the Company; |
| ● | enable executives to help our Board assess any proposed change of control of the Company and advise whether such a proposal is in the best interests of the Company, our shareholders, our policyholders and customers without being unduly influenced by the possibility of employment termination; and |
| ● | demonstrate to those executives our desire to treat them fairly and competitively in such circumstances. |
- 53 -
Table of Contents
Each year the Compensation Committee reviews a tally sheet prepared by Pay Governance that estimates for each NEO the benefits associated with a potential change of control of the Company and the cost of those benefits to us. For 2015, the Committee found that the estimated costs for these benefits would be reasonable. For more information on the LNC COC Plan, see page 66.
Severance Plans. We also offer our NEOs and our other executive officers a severance plan in the event their job is eliminated, other than in connection with our change of control. The plan pays 52 weeks of severance benefits as well as a lump-sum stipend of $200/week for each week of the severance period. To qualify for benefits under this plan (the Severance Plan for Officers of Lincoln National Corporation (the “Officers’ Severance Plan”)), the officer must sign our standard form of agreement, waiver and release of claims, which includes forfeiture provisions for competition and solicitation. Any payments made under the Officers’ Severance Plan reduce, on a dollar-for-dollar basis, any payments the officer receives under the LNC COC Plan. For more information on the Officers’ Severance Plan, see page 67.
The Compensation Committee has reviewed and discussed this Compensation Discussion & Analysis with management and has recommended to the Board that the Compensation Discussion & Analysis be included in this proxy statement and incorporated by reference into the Company’s 2015 Form 10-K.
The Compensation Committee
William H. Cunningham
Eric G. Johnson
Michael F. Mee
Patrick S. Pittard, Chair
- 54 -
Table of Contents
The table below shows the compensation of our NEOs for 2015. See “Narrative to Summary Compensation Table” below for more information.
| SUMMARY COMPENSATION TABLE | ||||||||||||||||||||||||||||||||||||
| NAME AND PRINCIPAL POSITION |
YEAR | SALARY | BONUS | STOCK AWARDS |
OPTION AWARDS |
NON-EQUITY INCENTIVE PLAN COMPENSATION |
CHANGE IN EARNINGS |
ALL OTHER COMPENSATION |
TOTAL | |||||||||||||||||||||||||||
| ($) | ($) | ($)1 | ($)2 | ($)3 | ($)4 | ($)5 | ($)6 | |||||||||||||||||||||||||||||
| DENNIS R. GLASS |
2015 | 1,169,050 | — | 6,816,576 | 1,350,013 | 1,924,256 | 26,864 | 728,575 | 12,015,334 | |||||||||||||||||||||||||||
| President and CEO of LNC |
2014 | 1,135,000 | — | 5,589,052 | 1,350,010 | 3,000,940 | 272,177 | 848,154 | 12,195,333 | |||||||||||||||||||||||||||
| 2013 | 1,100,000 | — | 4,204,470 | 2,135,005 | 3,999,600 | — | 739,083 | 12,178,158 | ||||||||||||||||||||||||||||
| RANDAL J. FREITAG |
2015 | 650,202 | — | 1,273,405 | 497,407 | 654,266 | — | 248,199 | 3,323,479 | |||||||||||||||||||||||||||
| Executive Vice President |
2014 | 575,384 | — | 1,027,891 | 421,258 | 899,670 | 55,425 | 258,141 | 3,237,769 | |||||||||||||||||||||||||||
| and CFO |
2013 | 558,625 | — | 885,969 | 449,876 | 1,100,235 | — | 220,232 | 3,214,937 | |||||||||||||||||||||||||||
| LISA M. BUCKINGHAM7 |
2015 | 578,448 | — | 820,152 | 320,348 | 509,034 | — | 211,967 | 2,439,949 | |||||||||||||||||||||||||||
| Executive Vice President, |
||||||||||||||||||||||||||||||||||||
| CHRO, Head of Brand and |
||||||||||||||||||||||||||||||||||||
| Enterprise Communications |
||||||||||||||||||||||||||||||||||||
| WILFORD H. FULLER |
2015 | 555,880 | — | 1,105,348 | 431,755 | 1,066,050 | — | 333,888 | 3,492,921 | |||||||||||||||||||||||||||
| President, Annuity Solutions, |
2014 | 484,000 | — | 863,206 | 353,752 | 1,489,171 | — | 365,026 | 3,555,155 | |||||||||||||||||||||||||||
| LFD and LFN |
2013 | 484,000 | — | 784,009 | 398,093 | 2,103,658 | — | 307,934 | 4,077,694 | |||||||||||||||||||||||||||
| MARK E. KONEN |
2015 | 663,320 | — | 1,270,610 | 496,294 | 674,596 | — | 275,266 | 3,380,086 | |||||||||||||||||||||||||||
| President, Insurance and |
2014 | 644,008 | — | 1,115,015 | 456,950 | 1,061,196 | 114,854 | 308,849 | 3,700,872 | |||||||||||||||||||||||||||
| Retirement Solutions |
2013 | 625,250 | — | 1,049,887 | 533,107 | 1,323,529 | — | 276,995 | 3,808,768 | |||||||||||||||||||||||||||
| 1. | Represents the grant date fair value of stock awards granted in 2015, 2014 and 2013 under the ICP. Values were determined in accordance with FASB ASC Topic 718 (Topic 718), and the assumptions made in calculating them can be found in Note 18 of the Notes to the Consolidated Financial Statements in Item 8 of our 2015 Form 10-K. Stock awards granted in 2015 include grants of RSUs and PSAs, the latter of which are subject to performance conditions. |
The table below shows the grant date fair value of the RSUs and PSAs, as well as the value of the PSAs assuming the maximum level of performance (200% of target) is achieved under both the ROE and TSR performance measures described on page 46. The grant date fair value for the PSAs was calculated in accordance with Topic 718 using a performance factor of 1.17, the probable outcome on the date of grant. The stock awards granted in 2015 are described in more detail in the Grants of Plan-Based Awards table on page 58.
| Named Executive Officer | Grant Date Fair Value of 2015 RSU |
Grant Date Fair Value of 2015 PSA |
Value of 2015 PSA at Maximum Performance Level |
|||||||||
| ($) | ($) | ($) | ||||||||||
| Dennis R. Glass |
4,052,449 | 2,764,126 | 4,725,003 | |||||||||
| Randal J. Freitag |
497,424 | 775,981 | 1,326,464 | |||||||||
| Lisa M. Buckingham |
320,372 | 499,780 | 854,325 | |||||||||
| Wilford H. Fuller |
431,794 | 673,554 | 1,151,374 | |||||||||
| Mark E. Konen |
496,323 | 774,286 | 1,323,567 | |||||||||
- 55 -
Table of Contents
2. Represents the grant-date fair value of Option awards granted in 2015, 2014 and 2013 under the ICP. Values were determined in accordance with Topic 718, and the assumptions made in calculating them can be found in Note 18 of the Notes to the Consolidated Financial Statements in Item 8 of our 2015 Form 10-K. The Option awards granted in 2015 are described in more detail in the Grants of Plan-Based Awards table on page 58.
3. Represents the AIP awards earned for the 2015 performance period under the ICP. More information on the AIP awards is provided in the Grants of Plan-Based Awards table on page 58 and in the CD&A on pages 40 to 44.
4. These amounts reflect the total of all increases in the actuarial present value of each NEO’s accumulated benefits under our qualified and nonqualified defined benefit pension plans shown in the Pension Benefits table on page 63. We froze these pension plans at the end of 2007. The year-end present values were computed using the same assumptions as those used for financial reporting purposes. For year-end 2015 those are a 4.50% interest rate to discount the normal retirement age (age 65 or current age if higher) lump sum value of annuity payments which were converted using an interest discount rate of 4.75% and the IRS-prescribed IRC 417(e)(3) mortality table for 2016. For Messrs. Freitag and Konen the amounts attributable to the change in pension value for 2015 resulted in a decrease of (17,209) and (28,926), respectively. The NEOs did not have any preferential nonqualified deferred compensation earnings.
5. The table below gives details on all Other Compensation:
| Name | Perquisitesa ($) |
401 (k)
Match, ($) |
Additional Company Contributions into ($) |
Total ($) |
||||||||||||
| Dennis R. Glass |
78,057 | 35,000 | 615,518 | 728,575 | ||||||||||||
| Randal J. Freitag |
12,700 | 33,390 | 202,109 | 248,199 | ||||||||||||
| Lisa M. Buckingham |
— | 26,500 | 185,467 | 211,967 | ||||||||||||
| Wilford H. Fuller |
— | 26,500 | 307,388 | 333,888 | ||||||||||||
| Mark E. Konen |
12,700 | 35,000 | 227,566 | 275,266 | ||||||||||||
| (a) | For Mr. Glass, $56,457 of the amount reflects the aggregate incremental cost of personal use of the corporate aircraft. Mr. Glass generally uses the corporate aircraft for personal use only when necessary to accommodate his business schedule. The amount also reflects $15,000 in matching charitable gifts made by Lincoln Financial Foundation, Inc. on his behalf, and the reimbursement of financial planning and tax-preparation expenses. |
For Mr. Freitag, the amount reflects $10,000 in matching charitable gifts made by Lincoln Financial Foundation, Inc. on his behalf and the reimbursement of tax-preparation expenses.
For Mr. Konen, the amount reflects $10,000 in matching charitable gifts made by Lincoln Financial Foundation, Inc. on his behalf, and the reimbursement of tax-preparation expenses.
More information regarding perquisites and personal benefits, including a discussion of how we value personal use of the corporate aircraft, can be found under “Narrative to the Summary Compensation Table” on page 57.
| (b) | Represents Company matching, core and transition contributions under our Employees’ 401(k) Plan. |
| (c) | Represents excess Company matching, core and transition contributions to the DC SERP, which are amounts above IRC limits. Also, for all NEOs except Mr. Glass, this amount includes an additional contribution — a “special executive credit” to the DC SERP — which is described in more detail on page 64. |
6. Some numbers might not add due to rounding.
7. Ms. Buckingham was not an NEO in prior years.
- 56 -
Table of Contents
NARRATIVE TO SUMMARY COMPENSATION TABLE
2015 Annual Incentive Program
For the 2015 AIP, the dollar amounts included in the Summary Compensation Table for each of our NEOs reflect the performance results for this program as certified by the Compensation Committee in February 2016. These results triggered a below-target payout for each NEO, except for Mr. Fuller. For more details on the 2015 AIP, including the performance measures, targets and final results, see the CD&A, pages 40 to 44.
Perquisites and Personal Benefits
Below are the primary perquisites and personal benefits we offered our NEOs in 2015, not all of which were actually received:
Financial Planning and Tax Preparation Services. We offer to reimburse our NEOs, along with other officers, up to $6,000 annually for financial-planning services provided by a Lincoln Financial Network financial planner and up to $2,700 annually for tax-preparation services provided by a certified public accountant other than Ernst & Young, our accounting firm. For the financial-planning services, we reimburse the first $1,800 of such services, plus 50% of costs above that amount up to the $6,000 maximum. Any unused portion of the $2,700 tax-preparation reimbursement may be applied to the financial-planning reimbursement, but not vice versa.
Personal Use of the Corporate Aircraft. Since 2005, the Board has advised our CEO to use the corporate aircraft for both business and personal travel, when practical, because of security concerns and to maximize his time devoted to our business. If an executive (and any guests of the executive) uses the corporate aircraft for personal purposes, we treat this usage as a perquisite for proxy-statement reporting purposes and calculate the value of such services based on the total incremental cost to us. For personal flights, that cost is based on a cost-per-flight-hour charge that reflects the operating costs of the aircraft, including regularly required maintenance, inspections and related fees/taxes. We also include as an incremental cost any flights required to reposition the corporate aircraft (i.e., dead-head flights) because of a personal flight. When executives, their families and invited guests fly on the corporate aircraft as additional passengers on business flights, there is no incremental cost. Finally, if more than one executive is on a personal flight, we allocate the incremental cost on a proportional basis depending on the number of guests of each executive.
Matching Charitable Gift Program. Under this program, the Lincoln Financial Foundation, Inc. matches gifts from an NEO to one or more eligible recipient organizations, up to an annual total maximum of $10,000.
Retirement Benefits
Under the DC SERP, our participating NEOs are eligible for an additional contribution — a “special executive credit” — as a percentage of “Total Pay.” For the purpose of determining the special executive credit, “Total Pay” under the DC SERP means base salary and AIP paid during the fiscal year.
For each NEO, the special executive credit is calculated annually as follows: 15% of Total Pay expressed as a percentage, offset by the total of: (a) the NEO’s maximum basic matching contribution opportunity (6%); plus (b) core contributions (4%); plus (c) transition contributions, if any (up to 8%), as determined under the Employees’ 401(k) Plan, each expressed as a percentage. For more details on the DC SERP, the contributions and the calculations of these amounts, see page 64.
- 57 -
Table of Contents
The table below shows the awards granted to our NEOs during 2015 under the ICP.
| ESTIMATED POSSIBLE PAYOUTS | ESTIMATED FUTURE PAYOUTS | |||||||||||||||||||||||||||||||||||||||||||
| UNDER NON-EQUITY INCENTIVE | UNDER EQUITY INCENTIVE | ALL OTHER | ALL OTHER | GRANT | ||||||||||||||||||||||||||||||||||||||||
| PLAN AWARDS1 | PLAN AWARDS2 | STOCK | OPTION | DATE FAIR | ||||||||||||||||||||||||||||||||||||||||
| AWARDS: | AWARDS: | EXERCISE | VALUE OF | |||||||||||||||||||||||||||||||||||||||||
|
|
|
|
|
|||||||||||||||||||||||||||||||||||||||||
| NUMBER OF | NUMBER OF | OR BASE | STOCK | |||||||||||||||||||||||||||||||||||||||||
| SHARES OF | SECURITIES | PRICE OF | AND | |||||||||||||||||||||||||||||||||||||||||
| STOCK OR | UNDERLYING | OPTION | OPTION | |||||||||||||||||||||||||||||||||||||||||
| NAME | GRANT DATE |
THRESHHOLD ($) |
TARGET ($) |
MAXIMUM ($) |
THRESHHOLD (#) |
TARGET (#) |
MAXIMUM (#) |
UNITS3 (#) |
OPTIONS4 (#) |
AWARDS ($/SH) |
AWARDS5 ($) |
|||||||||||||||||||||||||||||||||
|
|
|
|
|
|
|
|
|
|
|
|
|
|
||||||||||||||||||||||||||||||||
| DENNIS R. GLASS |
35,072 | 2,338,100 | 4,676,200 | |||||||||||||||||||||||||||||||||||||||||
| 2/25/15 | 5,069 | 40,551 | 81,102 | 2,764,126 | ||||||||||||||||||||||||||||||||||||||||
| 2/25/15 | 69,558 | 4,052,449 | ||||||||||||||||||||||||||||||||||||||||||
| 2/25/15 | 102,460 | 58.26 | 1,350,013 | |||||||||||||||||||||||||||||||||||||||||
| RANDAL J. FREITAG |
12,191 | 812,753 | 1,625,505 | |||||||||||||||||||||||||||||||||||||||||
| 2/25/15 | 1,423 | 11,384 | 22,768 | 775,981 | ||||||||||||||||||||||||||||||||||||||||
| 2/25/15 | 8,538 | 497,424 | ||||||||||||||||||||||||||||||||||||||||||
| 2/25/15 | 37,751 | 58.26 | 497,407 | |||||||||||||||||||||||||||||||||||||||||
| LISA M. BUCKINGHAM |
9,544 | 636,293 | 1,272,586 | |||||||||||||||||||||||||||||||||||||||||
| 2/25/15 | 917 | 7,332 | 14,664 | 499,780 | ||||||||||||||||||||||||||||||||||||||||
| 2/25/15 | 5,499 | 320,372 | ||||||||||||||||||||||||||||||||||||||||||
| 2/25/15 | 24,313 | 58.26 | 320,348 | |||||||||||||||||||||||||||||||||||||||||
| WILFORD H. FULLER |
23,288 | 1,035,000 | 2,070,000 | |||||||||||||||||||||||||||||||||||||||||
| 2/25/15 | 1,042 | 8,339 | 16,678 | 568,421 | ||||||||||||||||||||||||||||||||||||||||
| 2/25/15 | 6,254 | 364,358 | ||||||||||||||||||||||||||||||||||||||||||
| 2/25/15 | 27,653 | 58.26 | 364,356 | |||||||||||||||||||||||||||||||||||||||||
| 5/1/2015 | 195 | 1,563 | 3,126 | 105,133 | ||||||||||||||||||||||||||||||||||||||||
| 5/1/2015 | 1,173 | 67,436 | ||||||||||||||||||||||||||||||||||||||||||
| 5/1/2015 | 5,177 | 57.49 | 67,399 | |||||||||||||||||||||||||||||||||||||||||
| MARK E. KONEN |
24,875 | 994,980 | 1,989,960 | |||||||||||||||||||||||||||||||||||||||||
| 2/25/15 | 1,347 | 10,772 | 21,544 | 734,265 | ||||||||||||||||||||||||||||||||||||||||
| 2/25/15 | 8,079 | 470,683 | ||||||||||||||||||||||||||||||||||||||||||
| 2/25/15 | 35,722 | 58.26 | 470,673 | |||||||||||||||||||||||||||||||||||||||||
| 5/1/2015 | 74 | 595 | 1,190 | 40,022 | ||||||||||||||||||||||||||||||||||||||||
| 5/1/2015 | 446 | 25,641 | ||||||||||||||||||||||||||||||||||||||||||
| 5/1/2015 | 1,968 | 57.49 | 25,621 | |||||||||||||||||||||||||||||||||||||||||
1. Represents potential 2015 AIP awards. Actual amounts the NEOs earned are reflected in the Summary Compensation Table. More information on the 2015 AIP awards, including the applicable performance targets, is provided in the CD&A on pages 40 to 44.
2. Represents 30.4% of our CEO’s 2015 LTI target, and 40% of the other NEO’s 2015 LTI target, each awarded as PSAs for the 2015-2017 performance period, payable 100% in shares. Awards under the 2015-2017 performance cycle will be determined in the first quarter of 2018 (for the performance period ending December 31, 2017), and the amount of the award that vests may range from 0% to 200% of target depending upon the attainment of pre-established performance goals. For more information on the 2015-2017 performance awards and the performance goals that apply to these awards, see pages 45 to 47 in the CD&A. Dividend equivalents accrue on the LTI performance share awards, based on normal dividend rates, and are payable in stock only if the related LTI award actually vests based on certification of performance.
3. Represents 52.2% of our CEO’s 2015 LTI target, and 30% of the other NEO’s 2015 LTI target, each awarded as RSUs that cliff-vest on the third anniversary of the grant date; these RSUs are described in more detail in the CD&A on page 45. Dividend equivalents accrue on the RSUs, are credited in the form of additional RSUs on each date that dividends are paid on our common stock, and are payable only in stock and only upon vesting of the related RSU award.
4. Represents 17.4% of our CEO’s 2015 LTI target, and 30% of the other NEO’s 2015 LTI target, each awarded in the form of Options as described in more detail in the CD&A on page 45. The Options have 10-year terms and vest ratably over a three-year period, with one-third vesting on each of the first three anniversaries of the grant date. These Options do not have a reload feature.
5. Represents the grant date fair value of the award determined in accordance with Topic 718. All assumptions made in calculating the aggregate fair value can be found in Note 18 of the Notes to the Consolidated Financial Statements included in Item 8 of our 2015 Form 10-K.
- 58 -
Table of Contents
NARRATIVE TO GRANTS OF PLAN-BASED AWARDS TABLE
The following terms also apply to these awards:
| ● | The exercise price and tax-withholding obligations related to the exercise of all Options may be paid by withholding or delivering shares, subject to certain conditions. |
| ● | For stock awards, we withhold a sufficient number of shares to satisfy the NEO’s mandatory minimum tax-withholding obligations upon vesting at the NEO’s election. |
| ● | The Options and stock awards granted in 2015 will vest fully: (1) if the executive dies or becomes permanently disabled; or (2) upon a “change of control” and either: (a) the termination of the executive’s employment by the Company for any reason other than “cause”; or (b) the executive’s termination of his or her employment for “good reason,” as those terms are defined in the LNC COC Plan. |
| ● | Options and stock awards are not transferable except by will or under trust and estates law, unless the Compensation Committee permits such a transfer. The Compensation Committee has not permitted a transfer of any of the awards shown in the Grants of Plan-Based Awards table above. |
| ● | In general, when an executive voluntarily leaves the Company after reaching age 55 with at least five years of service, or is involuntarily terminated for any reason other than cause and signs a general release of claims against us, the executive will receive a pro-rated performance award (but only if the applicable performance goals are achieved and the Compensation Committee does not withhold payout of the award, which it has the discretion to do). The pro-rated award will be based on the number of days of service out of the total number of days in the three-year performance cycle. Any payout will be made at the same time, and in the same manner, as other participants are paid. |
| ● | In general, Options and RSU awards granted in 2015 will vest on a pro rata basis if an executive voluntarily leaves the Company after reaching age 55 with at least five years of service, or is involuntarily terminated for any reason other than cause and signs a general release of claims against us. |
| ● | The Options, RSUs and PSAs granted to our CEO will fully vest upon his retirement from the Company, with the PSAs vesting subject to the achievement of the applicable performance goals. |
| ● | The Options, RSUs and PSAs are subject to forfeiture and “clawback” provisions, including non-compete, non-solicitation, non-disparagement and confidentiality/non-disclosure covenants. Specifically, we may require the NEO to return the shares (or possibly the cash received, in the case of Options) to us upon breach of one of the covenants. The restrictive covenants and forfeiture provisions expire six months after an Option exercise, an RSU award vesting, or the payment of shares in accordance with a PSA. Additionally, we have the right to claw back any vested shares if the NEO is terminated for cause at any time after an award vests (no expiration date). |
| ● | Any vested Options may be exercised by the executive or his beneficiary (as applicable) until the earliest of: |
| – | the expiration of the Option term; |
| – | one year after the date the executive died or became disabled; |
| – | five years after the date the executive voluntarily left the Company after reaching age 55 with at least five years of service; or |
| – | three months after the date the executive was involuntarily terminated for any reason other than cause. |
- 59 -
Table of Contents
OUTSTANDING EQUITY AWARDS AT FISCAL YEAR-END
The table below provides information on unexercised Options, unvested stock awards and unvested equity incentive plan awards for each NEO as of the end of 2015.
| OPTION AWARDS | STOCK AWARDS | |||||||||||||||||||||||||||||||
| NAME | NUMBER
OF (#) |
NUMBER
OF (#) |
OPTION EXERCISE ($) |
OPTION EXPIRATION DATE |
NUMBER OF (#) |
MARKET ($) |
EQUITY INCENTIVE PLAN AWARDS: NUMBER OF UNEARNED SHARES, UNITS OR OTHER RIGHTS THAT HAVE NOT VESTED (#) |
EQUITY INCENTIVE PLAN AWARDS: MARKET OR PAYOUT VALUE OF UNEARNED SHARES, UNITS OR OTHER RIGHTS THAT HAVE NOT VESTED3 ($) | ||||||||||||||||||||||||
| DENNIS R. GLASS |
319,694 | 52.76 | 02/07/18 | 59,789 | 3,004,995 | 154,178 | 4 | 7,748,986 | ||||||||||||||||||||||||
| 176,354 | 97,178 | 29.54 | 02/28/23 | 58,740 | 2,952,272 | 95,334 | 5 | 4,791,487 | ||||||||||||||||||||||||
| 33,903 | 67,808 | 50.77 | 02/24/24 | 67,423 | 3,388,680 | 40,989 | 6 | 2,060,107 | ||||||||||||||||||||||||
| 102.460 | 58.26 | 02/25/25 | ||||||||||||||||||||||||||||||
| RANDAL J. FREITAG |
4,373 | 70.66 | 02/22/17 | 13,085 | 657,652 | 32,488 | 4 | 1,632,847 | ||||||||||||||||||||||||
| 15,966 | 52.76 | 02/07/18 | 8,500 | 427,210 | 22,664 | 5 | 1,139,093 | |||||||||||||||||||||||||
| 6,478 | 25.78 | 02/22/20 | 8,630 | 433,744 | 11,507 | 6 | 578,342 | |||||||||||||||||||||||||
| 25,179 | 30.64 | 02/23/21 | ||||||||||||||||||||||||||||||
| 52,198 | 24.99 | 02/22/22 | ||||||||||||||||||||||||||||||
| 40,953 | 20,477 | 29.54 | 02/28/23 | |||||||||||||||||||||||||||||
| 10,579 | 21,159 | 50.77 | 02/24/24 | |||||||||||||||||||||||||||||
| 37,751 | 58.26 | 02/25/25 | ||||||||||||||||||||||||||||||
| LISA M. BUCKINGHAM |
13,228 | 30.64 | 02/23/21 | 10,109 | 508,078 | 25,089 | 4 | 1,261,425 | ||||||||||||||||||||||||
| 23,367 | 24.99 | 02/22/22 | 6,010 | 302,063 | 16,028 | 5 | 805,567 | |||||||||||||||||||||||||
| 31,638 | 15,820 | 29.54 | 02/28/23 | 5,558 | 279,345 | 7,411 | 6 | 372,477 | ||||||||||||||||||||||||
| 7,481 | 14,964 | 50.77 | 02/24/24 | |||||||||||||||||||||||||||||
| 24,313 | 58.26 | 02/25/25 | ||||||||||||||||||||||||||||||
| WILFORD H. FULLER |
22,485 | 30.64 | 02/23/21 | 11,580 | 582,011 | 28,748 | 4 | 1,444,874 | ||||||||||||||||||||||||
| 41,209 | 24.99 | 02/22/22 | 7,137 | 358,706 | 19,034 | 5 | 956,649 | |||||||||||||||||||||||||
| 36,239 | 18,120 | 29.54 | 02/28/23 | 6,321 | 317,693 | 8,429 | 6 | 423,642 | ||||||||||||||||||||||||
| 8,883 | 17,769 | 50.77 | 02/24/24 | 1,181 | 59,357 | 1,574 | 6 | 79,109 | ||||||||||||||||||||||||
| 27,653 | 58.26 | 02/25/25 | ||||||||||||||||||||||||||||||
| 5,177 | 57.49 | 05/01/25 | ||||||||||||||||||||||||||||||
| MARK E. KONEN |
44,140 | 70.66 | 02/22/17 | 14,954 | 751,588 | 38,498 | 4 | 1,934,909 | ||||||||||||||||||||||||
| 84,591 | 52.76 | 02/07/18 | 9,005 | 452,591 | 24,586 | 5 | 1,235,692 | |||||||||||||||||||||||||
| 8,306 | 16.24 | 05/14/19 | 8,081 | 406,151 | 10,888 | 6 | 547,231 | |||||||||||||||||||||||||
| 33,749 | 30.64 | 02/23/21 | 445 | 22,366 | 599 | 6 | 30,106 | |||||||||||||||||||||||||
| 49,355 | 24.99 | 02/22/22 | ||||||||||||||||||||||||||||||
| 48,529 | 24,266 | 29.54 | 02/28/23 | |||||||||||||||||||||||||||||
| 11,475 | 22,952 | 50.77 | 02/24/24 | |||||||||||||||||||||||||||||
| 35,722 | 58.26 | 02/25/25 | ||||||||||||||||||||||||||||||
| 1,968 | 57.49 | 05/01/25 | ||||||||||||||||||||||||||||||
- 60 -
Table of Contents
1. These Options were not exercisable at the end of 2015. The following table shows the dates when Options in this column vest and become exercisable.
| Expiration Dates | Vesting Dates | |
| 2/28/2023 | Balance vested on 2/28/2016 | |
| 2/24/2024 | Balance vests equally on 2/24/2016 and 2/24/2017 | |
| 2/25/2025 | Vests in 3 equal annual installments beginning on 2/25/2016 | |
| 5/1/2025 | Vests in 3 equal annual installments beginning on 5/1/2016 |
2. These stock awards are RSUs that vest as follows:
| Vested On | Vest On | Vest On | Vest On | |||||
| Dennis R. Glass | 59,798 | 58,740 | 67,423 | |||||
| 2/28/2016 | 2/24/2017 | 2/25/2018 | N/A | |||||
| Randal J. Freitag | 13,085 | 8,500 | 8,630 | |||||
| 2/28/2016 | 2/24/2017 | 2/25/2018 | N/A | |||||
| Lisa M. Buckingham | 10,109 | 6,010 | 5,558 | |||||
| 2/28/2016 | 2/24/2017 | 2/25/2018 | N/A | |||||
| Wilford H. Fuller | 11,580 | 7,137 | 6,321 | 1,181 | ||||
| 2/28/2016 | 2/24/2017 | 2/25/2018 | 5/1/2018 | |||||
| Mark E. Konen | 14,954 | 9,005 | 8,081 | 445 | ||||
| 2/28/2016 | 2/24/2017 | 2/25/2018 | 5/1/2018 |
The stock awards include accrued but unpaid dividend equivalents credited in additional RSUs calculated at the normal dividend rate and settled in shares of our common stock only upon distribution of the vested award.
| 3. | This represents the product of the number of shares/units and the closing price of our common stock as reported on the composite tape of the NYSE on December 31, 2015, which was $50.26. |
| 4. | Represents PSAs that were granted in connection with the 2013-2015 performance cycle and vested on February 24, 2016, plus accrued dividend equivalents. Awards vested based on the actual performance certified by the Compensation Committee on February 24, 2016. |
| 5. | Represents PSAs granted in connection with the 2014-2016 performance cycle. Because our performance as of the end of the last fiscal year for this performance cycle exceeded the target performance measures, these awards are shown at maximum (200% of target), plus accrued but unpaid dividend equivalents. However, the amount, if any, of these awards that will be paid out will depend upon the actual performance over the full performance period and the Compensation Committee’s certification of the performance after completion of the performance cycle, which should occur in the first quarter of 2017 for the 2014-2016 performance cycle. |
| 6. | Represents PSAs granted in connection with the 2015-2017 performance cycle. Because our performance as of the end of the last fiscal year for this performance cycle was above threshold, these awards are shown at target, plus accrued but unpaid dividend equivalents. However, the amount, if any, of these awards that will be paid out will depend upon the actual performance over the full performance period and the Compensation Committee’s certification of the performance after completion of the performance cycle which should occur in the first quarter of 2018 for the 2015-2017 performance cycle. |
- 61 -
Table of Contents
OPTION EXERCISES AND STOCK VESTED
The table below provides information on Options exercised and stock awards that vested during 2015.
| OPTION AWARDS | STOCK AWARDS | |||||||||||||||
| NAME | NUMBER OF SHARES ACQUIRED ON EXERCISE |
AGGREGATE VALUE REALIZED ON EXERCISE |
NUMBER OF SHARES ACQUIRED ON VESTING1 |
AGGREGATE VALUE REALIZED ON VESTING2 |
||||||||||||
| Dennis R. Glass |
676,515 | 14,518,347 | 242,723 | 14,157,968 | ||||||||||||
| Randal J. Freitag |
17,335 | 370,508 | 51,311 | 2,993,120 | ||||||||||||
| Lisa M. Buckingham |
22,000 | 862,978 | 27,621 | 1,611,232 | ||||||||||||
| Wilford H. Fuller |
— | — | 48,611 | 2,837,115 | ||||||||||||
| Mark E. Konen |
12,500 | 458,883 | 60,560 | 3,531,310 | ||||||||||||
| 1. | For each NEO this includes shares delivered for RSUs that vested on February 22, 2015, and PSAs that vested on February 25, 2015. For Mr. Glass, the amount also reflects shares withheld on February 25, 2015, from a grant of RSUs to comply with IRC tax-withholding regulations that apply to equity grants with early retirement provisions. For Mr. Konen, the amount also reflects shares withheld on November 16, 2015, from grants of RSUs to comply with IRC tax-withholding regulations that apply to equity grants with retirement vesting provisions. |
| 2. | Calculated as shares vested times the closing price of our common stock as reported on the composite tape of the NYSE on the vesting date (or the last date before vesting that was a trading day for the NYSE). These prices were: $58.51 for February 20, 2015; $58.26 for February 25, 2015; and $55.21 for November 16, 2015. |
RETIREMENT PLANS
The LNC Retirement Plan. As of December 31, 2007, we converted our retirement program from a defined-benefit to a defined-contribution design. As a result, benefit accruals ceased (i.e., were “frozen”) under the Lincoln National Corporation Retirement Plan for Employees Hired Prior to January 1, 2008 (the “LNC Retirement Plan”), a defined benefit plan.
Excess Retirement Plan. The Lincoln National Corporation Excess Retirement Plan (the “Excess Plan”) paid, or “restored,” benefits that would have been paid under the LNC Retirement Plan if certain limits were not imposed by Sections 401(a) and 415 of the IRC. The Excess Plan calculated benefits using the same formula as the qualified retirement plans that it “restored,” but without the IRC limits. The amount of the qualified retirement benefit payment is then deducted from, or offset against, the benefit calculated under the Excess Plan.
When the LNC Retirement Plan was “frozen,” the Excess Plan was also “frozen.” In addition, if the Company undergoes a change of control, no enhanced benefits are payable under the Excess Plan.
The table below shows the present value of the “frozen” accrued benefit, as of December 31, 2015, under the LNC Retirement Plan and the Excess Plan for each of our NEOs except for Ms. Buckingham and Mr. Fuller, who are not eligible to participate in either plan.
- 62 -
Table of Contents
| PENSION BENEFITS | ||||||||||||||
| NAME | PLAN NAME | NUMBER OF YEARS OF CREDITED SERVICE (#) |
PRESENT VALUE OF ACCUMULATED BENEFIT2,3 ($) |
PAYMENTS DURING LAST FISCAL YEAR ($) |
||||||||||
| Dennis R. Glass |
LNC Retirement Plan | 13 | 594,622 | — | ||||||||||
| Excess Plan |
13 | 2,066,215 | — | |||||||||||
| Randal J. Freitag |
LNC Retirement Plan | 11.5 | 267,349 | — | ||||||||||
| Excess Plan |
11.5 | 13,031 | — | |||||||||||
|
Lisa M. Buckingham |
N/A | N/A | N/A | |||||||||||
| Wilford H. Fuller |
N/A | N/A | N/A | |||||||||||
| Mark E. Konen |
LNC Retirement Plan | 12 | 352,090 | — | ||||||||||
| Excess Plan |
12 | 314,438 | — | |||||||||||
| 1. | No benefits have accrued under these plans after December 31, 2007. |
| 2. | All present values were determined using the same interest rate and mortality assumptions used for financial reporting purposes. The amounts shown for Messrs. Glass, Freitag and Konen reflect the present value of the lump sum payable at normal retirement age (age 65 or current age if higher) converted using a discount rate of 4.75% and the IRS-prescribed IRC 417(e)(3) mortality table for 2016. |
- 63 -
Table of Contents
NONQUALIFIED DEFERRED COMPENSATION
We have adopted the DC SERP, a nonqualified plan that permits our NEOs and other officers to defer amounts of salary and annual incentive bonus that cannot be deferred under our tax-qualified Employees’ 401(k) Plan due to the IRC limits.
The amount of eligible compensation (base salary and annual incentive bonus) that employees may contribute to the Employees’ 401(k) Plan is subject to annual plan and IRC limits. During 2015, Lincoln made the following contributions to the Employees’ 401(k) Plan:
| ● | a dollar-for-dollar basic matching contribution on the first 6% of eligible compensation contributed; |
| ● | a “core contribution” of 4% of eligible compensation; and |
| ● | for certain employees based on age and years of service as of December 31, 2007, a “transition contribution” of up to 8% of eligible compensation. |
Any “core” and/or “transition” contributions that cannot be contributed to the Employees’ 401(k) Plan due to plan and/or IRC limits are contributed to the DC SERP.
SPECIAL EXECUTIVE CREDIT
For all NEOs except Mr. Glass, an additional contribution — a “special executive credit” as a percentage of “Total Pay”—was made to the DC SERP in 2015. For the purpose of determining this credit, “Total Pay” under the DC SERP is defined as base salary plus annual incentive bonus paid during the fiscal year. For each NEO, the special executive credit is calculated annually as follows: 15% of Total Pay, expressed as a percentage, offset by the total of: (a) the executive officer’s maximum basic matching contribution opportunity (6%); plus (b) core contributions (4%); plus (c) transition contributions, if any, (up to 8%) as determined under the Employees’ 401(k) Plan and the DC SERP, each expressed as a percentage.
Mr. Glass did not receive a special executive credit in 2015 because he received a transition credit in excess of 5% under the Employees’ 401(k) Plan. Typically, special executive credits are calculated and credited to the DC SERP by March of the following year. In accordance with the terms of the DC SERP, effective 2018, the special executive credit will equal 5% of Total Pay for each executive officer as a result of the expiration of the transition contributions. In 2015, the special executive credits for our NEOs, expressed as a percentage of Total Pay, were: 2.4% for Mr. Freitag; 5% for Ms. Buckingham; 5% for Mr. Fuller; and 1.6% for Mr. Konen.
Special executive credits vest on the earlier of: five years after becoming eligible to receive special executive credits under the DC SERP; death; eligibility for long-term disability benefits under a Company-sponsored plan; or reaching age 62. However, executive officers as of January 1, 2008 — including Messrs. Glass and Konen — were immediately vested in their special executive credits.
ADDITIONAL TERMS OF THE DC SERP
| ● | We will pay out amounts based upon the total performance of the investment measures selected by the participant |
| ● | Our NEOs may select from a menu of “phantom” investment options used as investment measures for calculating the investment return notionally credited to their deferrals. These are generally the same investment options that are available under the Employees’ 401(k) Plan. |
| ● | Amounts deferred and contributed under the DC SERP are credited to “notional” (or bookkeeping) accounts and are subsequently credited with earnings or losses mirroring the performance of the available investment options under the Employees’ 401(k) Plan. |
| ● | All matching contributions are initially invested in the same investment options that the participant has elected for salary and bonus deferrals and are credited with notional earnings or losses. |
- 64 -
Table of Contents
| ● | Our NEOs may at any time change their investment elections or, subject to our Insider Trading and Confidentiality Policy, transfer amounts between investments. |
| ● | Our NEOs may change investment elections with respect to the LNC stock unit fund only during permitted trading “window” periods, which generally occur quarterly. We will issue actual shares of our common stock in settlement of these stock units when amounts credited to the LNC stock unit fund are actually paid to the participants. Before settlement, the participants have no rights associated with ownership of our common stock, including voting rights. |
| ● | The DC SERP is an unfunded plan and represents an unfunded promise to pay the benefits credited to each participant. |
The table below provides information on each NEO’s deferrals and on contributions we made to the DC SERP on their behalf during 2015. It also shows each NEO’s aggregate balance under the DC SERP as of December 31, 2015.
|
NONQUALIFIED DEFERRED COMPENSATION
|
||||||||||||||||||||
| NAME | EXECUTIVE CONTRIBUTIONS ($) |
COMPANY ($) |
AGGREGATE EARNINGS IN LAST FY ($) |
AGGREGATE WITHDRAWALS/ DISTRIBUTIONS ($) |
AGGREGATE BALANCE LAST FYE3 ($) |
|||||||||||||||
| Dennis R. Glass |
250,199 | 615,518 | 222,200 | 125,927 | 21,820,370 | |||||||||||||||
| Randal J. Freitag |
92,992 | 202,109 | (36,465 | ) | 115,547 | 1,511,036 | ||||||||||||||
| Lisa M. Buckingham |
133,241 | 185,467 | (25,359 | ) | — | 1,597,305 | ||||||||||||||
| Wilford H. Fuller |
122,703 | 307,388 | (113,935 | ) | — | 2,723,075 | ||||||||||||||
| Mark E. Konen |
676,517 | 227,566 | 152,587 | — | 5,459,119 | |||||||||||||||
| 1. | Amounts shown reflect deferral of a portion of salary for 2015 (included as Salary in the Summary Compensation Table for 2015) and deferral of a portion of the AIP amounts paid in 2015 relating to 2014 performance (included as Non-Equity Plan Compensation in the Summary Compensation Table for 2014). These amounts are: |
|
Named Executive Officer |
Salary | ($) | Incentive Plan | ($) | ||||
| Dennis R. Glass |
70,143 | 180,056 | ||||||
| Randal J. Freitag |
39,012 | 53,980 | ||||||
| Lisa M. Buckingham |
57,845 | 75,396 | ||||||
| Wilford H. Fuller |
33,353 | 89,350 | ||||||
| Mark E. Konen |
39,799 | 636,718 |
| 2. | Amounts shown reflect our employer contributions into the DC SERP during 2015, some of which were included in All Other Compensation for 2014 in the Summary Compensation Table but credited in 2015. |
| 3. | In addition to the amounts shown in footnote 1 above, this column includes amounts that were reported in prior years’ Summary Compensation Tables to the extent the NEO was an NEO at the time. These amounts are as follows: $1,579,339 for Mr. Glass; $307,952 for Mr. Freitag; $371,241 for Mr. Fuller; and $635,018 for Mr. Konen. Ms. Buckingham was not an NEO in prior years. |
- 65 -
Table of Contents
POTENTIAL PAYMENTS UPON TERMINATION OR CHANGE OF CONTROL
The narrative below describes the various termination and change-of-control arrangements applicable to our NEOs that are not available to all employees on a non-discriminatory basis. The narrative is followed by tables showing potential payments each NEO would have received in the event of their termination (voluntary, involuntary or in connection with our change of control) occurring on December 31, 2015.
CHANGE-OF-CONTROL ARRANGEMENTS
All of our executive officers, including our NEOs, are eligible to participate in the LNC COC Plan. NEOs become eligible for benefits under the LNC COC Plan if, either in anticipation of or within two years after our change of control:
| ● | the NEO’s employment terminates for any reason other than “cause” (defined as conviction of a felony, fraudulent or willful misconduct by the executive that is materially and demonstrably injurious to our business or reputation, or the willful and continued failure of the executive to perform his or her duties, despite warning notices) or the NEO’s death or disability; or |
| ● | the NEO terminates his or her employment for “good reason” (defined as a “material and adverse” change in the NEO’s responsibilities, a reduction in salary or target annual incentive bonus opportunity, or our failure to provide compensation and benefits materially similar to those offered in the past – with the exception of broad-based changes to our benefit plans that affect a significant portion of our employees). |
If the conditions for payment under the LNC COC Plan are met, the Company would make a cash payment to the NEO based on a multiple of “annual base salary” and “target bonus.” For purposes of the LNC COC Plan:
| ● | “annual base salary” means the highest annual rate of salary during the 12-month period immediately preceding the date of termination; and |
| ● | “target bonus” means the target set for annual incentive bonus under the ICP for the calendar year in which the NEO was terminated or for the year in which the change of control occurred, whichever is higher. |
The amounts payable under the LNC COC Plan would be determined as follows:
| Chief Executive Officer
|
3 times annual base salary | + | 3 times target bonus | |||
| All Other Participating Executives (including our other NEOs) |
2 times annual base salary | + | 2 times target bonus |
Benefits offered under the LNC COC Plan do not include any tax “gross ups” to cover any excise tax amounts deemed to be “excess parachute payments” under IRC Section 280G.
- 66 -
Table of Contents
In addition to the cash payment, our NEOs would receive the following additional benefits and benefit enhancements under the LNC COC Plan:
| ● | Reimbursement, for a maximum of 18 months, of premiums the NEO paid for the continuation of coverage under our welfare benefit plans in accordance with the Consolidated Omnibus Budget Reconciliation Act; |
| ● | For purposes of determining eligibility for retiree medical and dental coverage, additional credited service equal to the period that severance pay would be payable to the NEO under our broad-based employees’ severance plan; |
| ● | Vesting of AIP and LTI awards for each completed performance period, with awards for open performance periods paid at target and pro-rated to reflect the date on which the termination occurred and paid out at the end of the performance period (although the Compensation Committee has discretion under the ICP to fully vest awards); and |
| ● | Reimbursement of the cost of outplacement services, up to a maximum of 15% of the NEO’s highest rate of annual base salary during the 12-month period immediately preceding the date of employment termination. |
NEOs in the LNC COC Plan may be eligible to receive payments under the LNC Severance Pay Plan or other severance arrangements (as described below). However, any payments they receive under those plans would reduce, on a dollar-for-dollar basis, the amount of any cash payment they receive under the LNC COC Plan.
As a condition to an NEO’s receiving payments or benefits, the LNC COC Plan imposes non-disparagement and confidentiality obligations, as well as a non-solicitation obligation for two years following termination of the executive’s employment.
CHANGE-OF-CONTROL FEATURES OF OTHER PLANS AND PROGRAMS
Options and RSUs
Unvested grants of Options and RSUs will vest and become either immediately exercisable or non-forfeitable only upon: (i) our change of control; and (ii) either: (a) termination of the executive’s employment for any reason other than “cause;” or (b) the executive’s termination of his or her employment for “good reason.” In addition, the Compensation Committee may determine whether outstanding PSAs will be paid in shares immediately upon our change of control, including the discretion as to whether to pay at target or maximum.
Severance Plans
We sponsor the Officers’ Severance Plan, which provides 52 weeks of severance benefits to our executive officers, including our NEOs, as well as a lump-sum severance stipend of $200/week for each week of the severance period. Executive officers are paid in a lump sum no earlier than six months after the date the officer’s job was eliminated.
To qualify for benefits under the Officers’ Severance Plan, an officer must sign our standard form of agreement, waiver and release of claims, which includes forfeiture provisions for competition and solicitation, among other conditions.
All officers, including NEOs, also participate in the LNC Severance Pay Plan, a broad-based severance plan available to all employees on an equal basis, with benefits triggered by job elimination or job restructuring.
- 67 -
Table of Contents
Deferred Compensation Plan
Upon our change of control, our NEOs will receive the following benefit enhancements under the DC SERP:
| ● | Any unvested special executive credits will vest immediately. |
| ● | Executives eligible for benefits under the LNC COC Plan, as of the date of our change of control and who separate from service within two years after such change of control, will receive an additional two (or three, in the case of our CEO) years’ worth of core contributions, transition contributions, matching contributions, and special executive credits. |
POTENTIAL PAYMENT TABLES
The tables below show potential payments to each NEO if the NEO’s employment were terminated as a result of:
| ● | early retirement or voluntary termination; |
| ● | involuntary not-for-cause termination; |
| ● | for-cause termination; |
| ● | involuntary termination following our change of control; or |
| ● | death or disability. |
Please note the following regarding the amounts in the tables:
| ● | Under the DC SERP, except for Mr. Freitag, the amounts shown in the Nonqualified Deferred Compensation Table on page 65 under the Aggregate Balance at fiscal year-end were fully vested as of December 31, 2015, and therefore are fully payable and unaffected by the various termination scenarios. The DC SERP amounts are shown as lump sums, but are payable as either lump sums or as 5-, 10-, 15- or 20-year annual installments. |
| ● | The amounts assume that termination was effective December 31, 2015, and are therefore estimates. The amounts actually paid at termination would differ from these estimates, which constitute forward-looking statements for purposes of the Private Securities Litigation Reform Act of 1995. Additional assumptions are described in footnotes to the tables. |
Long-term incentive compensation reflects equity-based awards that had not yet vested on the date of a termination event for which vesting continues post-termination or is accelerated as a result of the termination event. All awards held by each NEO at December 31, 2015, that would have become vested and/or exercisable upon a termination event are shown at a value using the closing price of our common stock on December 31, 2015, which was $50.26. In general, vesting occurs as follows:
| ● | Options – Unvested Options will vest and become exercisable upon the NEO’s death or permanent disability. Unvested Options will also vest and become immediately exercisable following our change of control if: (a) the executive’s employment is terminated for any reason other than “cause;” or (b) the executive terminates his or her employment for “good reason.” If an NEO retires or is involuntarily terminated without cause, the Options will vest pro rata for the time the NEO was employed during the vesting period, unless the NEO has reached age 62, in which case the Options vest in full upon retirement. |
- 68 -
Table of Contents
| ● | Unvested RSUs will vest upon the NEO’s death or permanent disability. Unvested RSUs will also vest upon our change of control if: (a) the NEO’s employment is terminated for any reason other than “cause”; or (b) the executive terminates his or her employment for “good reason.” If an NEO, other than the CEO, retires or is involuntarily terminated without cause, the RSUs will vest pro rata for the time the executive was employed during the vesting period. If our CEO retires his RSUs vest in full. |
| ● | PSAs — Upon the NEO’s death or permanent disability, the PSAs will vest. Unvested PSAs will also vest upon our change of control if: (a) the NEO’s employment is terminated for any reason other than “cause”; or (b) the executive terminates his or her employment for “good reason.” If an NEO, other than the CEO, retires or is involuntarily terminated without cause, the PSAs will vest pro rata for the time the executive was employed during the performance period. If our CEO retires his PSAs vest in full. Amounts in the table are calculated based on payouts at target for the 2014-2016 and 2015-2017 performance cycles. Under all termination events except our change of control, the PSAs are paid only at the end of the actual performance cycle. The effect of our change of control is discussed in detail beginning on page 66. |
The tables exclude benefits — such as accrued vacation pay, distributions from the Employees’ 401(k) Plan, disability benefits, and life insurance benefits equal to one times salary — that all employees are eligible to receive on the same basis. The tables do not reflect the changes made to the Officers’ Severance Plan set forth in our Current Report on Form 8-K filed on March 1, 2016.
- 69 -
Table of Contents
Amounts in the table are estimates based on a hypothetical termination on December 31, 2015.
| POTENTIAL PAYMENTS | ||||||||||||
| TRIGGER EVENTS | ||||||||||||
| BENEFITS AND PAYMENTS
|
EARLY RETIREMENT1 /VOLUNTARY TERMINATION ($) |
INVOLUNTARY NOT-FOR-CAUSE TERMINATION2 ($) |
FOR-CAUSE TERMINATION ($) |
INVOLUNTARY TERMINATION AFTER CHANGE- OF-CONTROL ($) |
DISABILITY ($) |
DEATH ($) | ||||||
|
Dennis R. Glass |
||||||||||||
| Compensation: |
||||||||||||
| Annual Incentive Compensation |
1,924,256 | 1,924,256 | — | 1,924,256 | 1,924,256 | 1,924,256 | ||||||
| Options |
2,013,514 | 2,013,514 | — | 2,013,514 | 2,013,514 | 2,013,514 | ||||||
| RSUs |
9,345,948 | 9,345,948 | — | 9,345,948 | 9,345,948 | 9,345,948 | ||||||
| PSAs3 |
8,330,334 | 8,330,334 | — | 8,330,334 | 8,330,334 | 8,330,334 | ||||||
| Benefits & Perquisites: |
||||||||||||
| DC SERP4 |
— | — | — | 1,641,346 | — | — | ||||||
| Miscellaneous Payments5 |
— | — | — | 181,958 | — | — | ||||||
| Cash Severance |
— | — | — | 10,521,450 | — | — | ||||||
| Total |
21,614,062 | 21,614,062 | 0 | 33,958,816 | 21,614,062 | 21,614,062 | ||||||
|
Randal J. Freitag |
||||||||||||
| Compensation: |
||||||||||||
| Annual Incentive Compensation |
— | 654,266 | — | 654,266 | 654,266 | 654,266 | ||||||
| Options |
— | 355,695 | — | 424,277 | 424,277 | 424,277 | ||||||
| RSUs |
— | 1,007,965 | — | 1,518,606 | 1,518,606 | 1,518,606 | ||||||
| PSAs |
— | 1,388,902 | — | 1,388,902 | 1,964,312 | 1,964,312 | ||||||
| Benefits & Perquisites: |
||||||||||||
| DC SERP4 |
— | — | — | 533,751 | 130,829 | 168,026 | ||||||
| Miscellaneous Payments5 |
— | 10,400 | — | 104,130 | — | — | ||||||
| Cash Severance |
— | 650,202 | — | 2,925,910 | — | — | ||||||
| Total |
0 | 4,067,430 | 0 | 7,549,842 | 4,692,290 | 4,729,487 | ||||||
|
Lisa M. Buckingham |
||||||||||||
| Compensation: |
||||||||||||
| Annual Incentive Compensation |
— | 509,034 | — | 509,034 | 509,034 | 509,034 | ||||||
| Options |
— | 274,794 | — | 327,777 | 327,777 | 327,777 | ||||||
| RSUs |
— | 745,734 | — | 1,089,486 | 1,089,486 | 1,089,486 | ||||||
| PSAs |
— | 1,023,377 | — | 1,023,377 | 1,405,923 | 1,405,923 | ||||||
| Benefits & Perquisites: |
||||||||||||
| DC SERP4 |
— | 66,620 | — | 431,042 | — | 66,620 | ||||||
| Miscellaneous Payments5 |
— | 10,400 | — | 93,367 | — | — | ||||||
| Cash Severance |
— | 578,448 | — | 2,429,482 | — | — | ||||||
|
Total |
0 | 3,208,407 | 0 | 5,903,565 | 3,332,220 | 3,398,840 | ||||||
- 70 -
Table of Contents
| POTENTIAL PAYMENTS | ||||||||||||||||||||||||
| TRIGGER EVENTS | ||||||||||||||||||||||||
| BENEFITS AND PAYMENTS |
|
EARLY RETIREMENT1 / VOLUNTARY TERMINATION |
|
|
INVOLUNTARY NOT-FOR-CAUSE TERMINATION2 |
|
|
FOR-CAUSE TERMINATION |
|
|
INVOLUNTARY TERMINATION AFTER CHANGE- OF-CONTROL |
|
DISABILITY | DEATH | ||||||||||
| ($) | ($) | ($) | ($) | ($) | ($) | |||||||||||||||||||
|
Wilford H. Fuller |
||||||||||||||||||||||||
| Compensation: |
||||||||||||||||||||||||
| Annual Incentive Compensation |
— | 1,066,050 | — | 1,066,050 | 1,066,050 | 1,066,050 | ||||||||||||||||||
| Options |
— | 314,752 | — | 375,439 | 375,439 | 375,439 | ||||||||||||||||||
| RSUs |
— | 874,648 | — | 1,317,767 | 1,317,767 | 1,317,767 | ||||||||||||||||||
| PSAs |
— | 1,208,904 | — | 1,208,904 | 1,703,512 | 1,703,512 | ||||||||||||||||||
| Benefits & Perquisites: |
||||||||||||||||||||||||
| DC SERP4 |
— | 102,253 | — | 669,251 | — | 102,253 | ||||||||||||||||||
| Miscellaneous Payments5 |
— | 10,400 | — | 92,850 | — | — | ||||||||||||||||||
| Cash Severance |
— | 575,000 | — | 3,220,000 | — | — | ||||||||||||||||||
| Total |
0 | 4,152,007 | 0 | 7,950,261 | 4,462,768 | 4,565,021 | ||||||||||||||||||
|
Mark E. Konen |
||||||||||||||||||||||||
| Compensation: |
||||||||||||||||||||||||
| Annual Incentive Compensation |
674,596 | 674,596 | — | 674,596 | 674,596 | 674,596 | ||||||||||||||||||
| Options |
421,501 | 421,501 | — | 502,771 | 502,771 | 502,771 | ||||||||||||||||||
| RSUs |
1,109,682 | 1,109,682 | — | 1,632,696 | 1,632,696 | 1,632,696 | ||||||||||||||||||
| PSAs |
1,571,798 | 1,571,798 | — | 1,571,798 | 2,162,638 | 2,162,638 | ||||||||||||||||||
| Benefits & Perquisites: |
||||||||||||||||||||||||
| DC SERP4 |
— | 27,592 | — | 505,182 | — | 27,592 | ||||||||||||||||||
| Miscellaneous Payments5 |
— | 10,400 | — | 106,098 | — | — | ||||||||||||||||||
| Cash Severance |
— | 663,320 | — | 3,316,600 | — | — | ||||||||||||||||||
|
Total |
3,777,577 | 4,478,889 | 0 | 8,309,741 | 4,972,701 | 5,000,293 | ||||||||||||||||||
- 71 -
Table of Contents
| 1. | Based on their age and years of service, for Messrs. Glass and Konen this column reflects benefits based on retirement under our plans. For Messrs. Freitag and Fuller, and Ms. Buckingham, this column reflects benefits payable under a voluntary termination scenario. |
| 2. | Because of Mr. Glass’s years of service and age, if his employment were involuntarily terminated without cause, he would be entitled to the same benefits as if he had retired under our plans. As a result, this column shows benefits based on retirement under our plans. For Messrs. Freitag, Fuller and Konen, and Ms. Buckingham, the amounts shown in this column are payable only if the officer has been “job eliminated” (as defined in our plan document), and has signed and not revoked an agreement, waiver and release in a form acceptable to the Company. |
| 3. | For all trigger events except termination for cause, the PSAs would be payable. |
| 4. | For Ms. Buckingham and Messrs. Glass, Fuller and Konen, the values for the DC SERP do not reflect the year-end balance shown in the Nonqualified Deferred Compensation Table on page 65, as they are fully vested in this amount, which would be payable under each scenario. For Mr. Freitag and Ms. Buckingham, values for the DC SERP do not reflect the vested account balance, but only the unvested balances that would be payable only under certain termination scenarios. The Special Executive Credit credited in 2016 to Messrs. Freitag, Fuller and Konen, and Ms. Buckingham is payable only under certain termination scenarios. Upon Involuntary Termination after Change in Control, Mr. Glass receives an additional three years of employer contributions under the DC SERP provisions based on his rate of pay and target bonus percentage in effect at the date of termination. Upon Involuntary Termination after Change in Control, Messrs. Freitag, Fuller and Konen, and Ms. Buckingham receive an additional two years of employer contributions under the DC SERP provisions based on their rate of pay and target bonus percentage in effect at the date of termination. |
| 5. | Amounts shown under Involuntary Not-for-Cause Termination reflect a cash stipend provided over the severance period. Amounts shown under Involuntary Termination after Change in Control reflect amounts for outplacement, tax preparation and financial planning services, and fully subsidized health and dental benefits through age 65. |
- 72 -
Table of Contents
ITEM 4 | SHAREHOLDER PROPOSAL TO ADOPT SIMPLE MAJORITY VOTE
We expect the following proposal (Proposal 4 on the proxy card and voting instruction card) to be presented by a shareholder at the annual meeting. Names, addresses and share holdings of the shareholder proponent and, where applicable, of co-filers will be supplied promptly upon oral or written request.
RESOLUTION PROPOSED BY SHAREHOLDER:
PROPOSAL 4 — SIMPLE MAJORITY VOTE
RESOLVED, Shareholders request that our board take the steps necessary so that each voting requirement in our charter and bylaws that calls for a greater than simple majority vote be eliminated, and replaced by a requirement for a majority of the votes cast for and against applicable proposals, or a simple majority in compliance with applicable laws. If necessary, this means the closest standard to a majority of the votes cast for and against such proposals consistent with applicable laws.
Shareowners are willing to pay a premium for shares of corporations that have excellent corporate governance. Supermajority voting requirements, the target of this proposal, have been found to be one of six entrenching mechanisms that are negatively related to company performance according to “What Matters in Corporate Governance” by Lucien Bebchuk, Alma Cohen and Allen Ferrell of the Harvard Law School. Supermajority requirements are used to block initiatives supported by most shareowners but opposed by a status quo management.
This proposal topic won from 74% to 88% support at Weyerhaeuser, Alcoa, Waste Management, Goldman Sachs, FirstEnergy, McGraw-Hill, and Macy’s. Currently a 1%-minority can frustrate the will of our 74%-shareholder majority. In other words a 1%-minority could have the power to prevent shareholders from improving our corporate governance.
Please vote to protect shareholder value:
Simple Majority Vote — Proposal 4
OUR RESPONSE — STATEMENT IN OPPOSITION TO PROPOSAL:
The Board has carefully considered the above proposal and believes that it is not in the best interest of our shareholders. Consequently, the Board recommends that shareholders vote against the proposal for the following reasons:
VOTING REQUIREMENTS
The Board believes that the supermajority voting standards in the Company’s Restated Articles of Incorporation (the “Articles”) and our Amended and Restated Bylaws (collectively with the Articles, the “Governance Documents”) are appropriate and necessary. Pursuant to the Governance Documents, supermajority approval is required under the Governance Documents for, among other things, certain fundamental changes to the Company’s corporate governance, including the process for election and removal of directors, certain transactions with “Interested Stockholders” (described below) and the approval of certain fundamental corporate changes such as a merger, consolidation, or sale of substantially all of the assets of the Company. The Board believes that in these circumstances the higher voting requirements are more representative of all shareholders.
- 73 -
Table of Contents
BROAD CONSENSUS OF ALL SHAREHOLDERS
Indiana law permits supermajority voting requirements and a number of publicly traded companies have adopted these provisions to preserve and maximize long-term value for all shareholders. Because these provisions give holders of less than a majority of the outstanding shares the ability to defeat a proposed extraordinary transaction or fundamental change, they generally have the effect of giving minority shareowners a greater voice in corporate structure and governance. The Board strongly believes that extraordinary transactions and fundamental changes to corporate governance should have the support of a broad consensus of Lincoln’s shareholders rather than a simple majority. Our governing documents were intentionally drafted to include a supermajority vote standard that would apply to the areas described above because of their importance to the Company. The Board also believes that the supermajority vote requirements protect shareholders, particularly minority shareholders, against the potentially self-interested actions of short-term investors. Without these provisions, it would be possible for a group of short-term shareholders to approve an extraordinary transaction that is not in the best interest of the Company and opposed by nearly half of Lincoln’s shareholders.
PROTECTION AGAINST CERTAIN TAKEOVERS
The Company’s supermajority voting provisions protect shareholders by encouraging persons or firms making unsolicited takeover bids to negotiate directly with the Board. The Board has a fiduciary duty under the law to act in a manner that it believes to be in the best interests of the Company, considering the effects of any action on shareholders, employees, suppliers, customers and communities in which offices or facilities of the Company are located. All but one of our directors are independent under the standards adopted by the New York Stock Exchange. Supermajority voting requirements encourage potential acquirers to deal directly with the Board. We believe that the Board is in the best position to evaluate proposed offers, to consider alternatives, and to protect shareholders against abusive tactics during a takeover process, and as appropriate, to negotiate the best possible return for all shareholders. Elimination of these supermajority provisions would make it more difficult for the Company’s independent, shareholder-elected Board to preserve and maximize value for all shareholders in the event of an unsolicited takeover bid.
CORPORATE GOVERNANCE PRACTICES
Sound governance is important to our Board, which regularly evaluates and implements policies that reflect corporate governance best practices. Some of these practices are:
| ● | The Chairman of the Board is an independent director; |
| ● | All of our directors, except for the chief executive officer, are independent; |
| ● | We have majority voting and a director resignation policy for directors in uncontested elections; |
| ● | We have robust stock ownership guidelines for directors and executive officers; |
| ● | Independent directors meet regularly in executive session; |
| ● | The Board and its committees conduct annual self-evaluations; and |
| ● | As of the Annual Meeting in 2017, we will no longer have a classified Board and all directors will stand for election annually. |
Consistent with its current practice, the Board will continue to evaluate the future implementation of appropriate corporate governance measures. However, for the reasons discussed above, the Board does not believe it is in the best interests of shareholders or the Company to implement the proponent’s request for the lowest possible voting thresholds on all matters on which shareholders vote.
| For these reasons, the Board of Directors oppose this proposal and recommends a vote AGAINST the proposal. |
- 74 -
Table of Contents
COMPENSATION COMMITTEE INTERLOCKS AND INSIDER PARTICIPATION
William H. Cunningham, Eric G. Johnson, Michael F. Mee and Patrick S. Pittard served on the Compensation Committee during 2015. No member of the Compensation Committee had any relationship requiring disclosure under the “Related-Party Transactions,” as discussed below, and no member was an employee, officer, or former officer of us or our subsidiaries. In addition, no member of the Board of Directors is an executive officer of another entity at which one of our executive officers serves on the Board of Directors.
Our Board’s Corporate Governance Committee has a written policy for reviewing, approving and ratifying transactions with related parties. This policy applies to any transaction or proposed transaction that we must disclose publicly to comply with SEC rules, and it requires that the Corporate Governance Committee (or the full Board) pre-approve or ratify such transactions. In approving or ratifying any transaction or proposed transaction, the Committee must determine that the transaction is fair and reasonable to Lincoln and otherwise complies with our policy on conflicts of interest. This policy does not require the Committee to obtain a fairness opinion or other third-party support for its actions, although it has discretion to do so. If the Committee does not ratify a transaction with a related party, Lincoln and/or the related party must make all reasonable efforts to terminate or unwind the transaction.
The policy does not apply to transactions in which we, our subsidiaries or affiliated planners provide insurance, annuities, mutual funds or similar products, or financial services on terms and conditions substantially similar to those available to similarly situated third parties in arm’s-length transactions. This exception also applies to products and services provided to or by an entity of which a related person is an executive officer or employee, provided that the related person receives the same benefits generally available to employees having an equivalent title at the other entity.
BlackRock, Inc. (“BlackRock”), acting in various fiduciary capacities, filed a Schedule 13G with the SEC reporting that as of December 31, 2015, BlackRock beneficially owned approximately 7% of our outstanding common stock. In the ordinary course of business, our subsidiaries have agreements with subsidiaries of BlackRock to include BlackRock funds in certain of our products. In 2015, our subsidiaries recorded revenues of approximately $11.9 million from BlackRock subsidiaries. In addition, BlackRock provides sub-advisory services to our subsidiaries. For 2015, our subsidiaries paid BlackRock approximately $4.7 million for these services.
The Vanguard Group (“Vanguard”), acting in various fiduciary capacities, filed a Schedule 13G with the SEC reporting that as of December 31, 2015, Vanguard beneficially owned approximately 8% of our outstanding common stock. In the ordinary course of business, our subsidiaries have agreements with subsidiaries of Vanguard to include Vanguard funds in certain of our products. In 2015, our subsidiaries recorded revenues of approximately $300,000 from Vanguard subsidiaries.
The Company has a three-year contract with Truven Health to provide certain data and information related to the Company’s healthcare benefits. Phillip Buckingham, the husband of Lisa M. Buckingham, our CHRO, serves as the Chief Financial Officer of Truven Health. We expect to pay Truven Health approximately $134,000 per year under the contract.
- 75 -
Table of Contents
SECURITY OWNERSHIP OF MORE THAN 5% BENEFICIAL OWNERS
Our common stock trades on the NYSE under the symbol “LNC.” We have no other types of stock outstanding. The following table lists persons or entities that, to the best of our knowledge, were beneficial owners of more than 5% of our common stock as of December 31, 2015. The information shown is based solely on our review of Schedules 13G filed with the SEC.
|
SECURITY OWNERSHIP OF CERTAIN BENEFICIAL OWNERS AS OF DECEMBER 31, 2015
| ||||||
|
TITLE OF CLASS
|
NAME AND ADDRESS OF BENEFICIAL OWNER
|
AMOUNT AND NATURE OF BENEFICIAL OWNERSHIP
|
PERCENT OF CLASS
| |||
| Common Stock | BlackRock, Inc. 55 East 52nd Street New York, NY 10022
|
18,971,763 | 7.0% | |||
| Common Stock | The Vanguard Group 100 Vanguard Blvd. Malvern, PA 19355
|
20,606,885 | 8.32% | |||
- 76 -
Table of Contents
SECURITY OWNERSHIP OF DIRECTORS, NOMINEES AND EXECUTIVE OFFICERS
The following table shows the number of shares of common stock and stock units beneficially owned on March 16, 2016, by each director, director nominee and NEO, individually, and by all directors and executive officers as a group. LNC Stock Units are non-voting, non-transferable “phantom” stock units that track the economic performance of our common stock; a unit has the same value as a share of our common stock.
|
SECURITY OWNERSHIP OF DIRECTORS, NOMINEES AND EXECUTIVE OFFICERS AS OF MARCH 16, 2016 |
| |||||||||||||||||||
| NAME |
|
AMOUNT OF LNC COMMON STOCK AND NATURE OF BENEFICIAL OWNERSHIP |
1 |
|
PERCENTAGE OF CLASS |
|
|
LNC STOCK UNITS |
2 |
|
TOTAL OF LNC COMMON STOCK AND STOCK UNITS |
|
|
TOTAL PERCENTAGE OF CLASS |
| |||||
| Lisa M. Buckingham | 141,269 | * | 0 | 141,269 | * | |||||||||||||||
| William H. Cunningham | 41,918 | * | 84,089 | 126,007 | * | |||||||||||||||
| Randal J. Freitag | 281,624 | * | 442 | 282,066 | * | |||||||||||||||
| Wilford H. Fuller | 312,295 | * | 38,087 | 350,382 | * | |||||||||||||||
| Dennis R. Glass | 1,310,386 | * | 71,353 | 1,381,739 | * | |||||||||||||||
| George W. Henderson III | 33,786 | * | 54,260 | 88,046 | * | |||||||||||||||
| Eric G. Johnson | 39,781 | * | 46,958 | 86,739 | * | |||||||||||||||
| Gary C. Kelly | 20,040 | * | 17,811 | 37,851 | * | |||||||||||||||
| Mark E. Konen | 430,419 | * | 0 | 430,419 | * | |||||||||||||||
| M. Leanne Lachman | 33,180 | * | 57,231 | 90,411 | * | |||||||||||||||
| Michael M. Mee | 34,017 | * | 60,494 | 94,511 | * | |||||||||||||||
| William P. Payne | 36,628 | * | 34,923 | 71,551 | * | |||||||||||||||
| Patrick S. Pittard | 15,871 | * | 37,084 | 52,955 | * | |||||||||||||||
| Isaiah Tidwell | 33,759 | * | 29,402 | 63,160 | * | |||||||||||||||
| All Directors and Executive Officers as a group –18 persons | 2,920,209 | 1.20 | % | 532,134 | 3,452,343 | 1.41 | % | |||||||||||||
| *Each | of these amounts represents less than 1% of the outstanding shares of our common stock as of March 16, 2016. |
| 1. | The number of shares that each person named in this table has a right to acquire within 60 days of March 16, 2016 is as follows: Ms. Buckingham, 107,120 shares; Mr. Cunningham, 33,180 shares; Mr. Freitag, 199,365 shares; Mr. Fuller, 146,762 shares; Mr. Glass, 695,186 shares; Mr. Henderson, 33,180 shares; Mr. Johnson, 33,180 shares; Mr. Kelly, 17,040 shares; Mr. Konen, 328,449 shares; Ms. Lachman, 33,180 shares; Mr. Mee, 33,180 shares; Mr. Payne, 25,105 shares; Mr. Pittard, 9,803 shares; Mr. Tidwell, 33,180 shares; and all directors and officers as a group, 1,827,196 shares. Mr. Kelly’s shares include 3,000 shares held in a family trust. Mr. Konen’s shares include 21,457 shares held in a family trust. |
| 2. | LNC Stock Units are non-voting, non-transferable phantom stock units that track the economic performance of our common stock. |
- 77 -
Table of Contents
Q: Why did I receive this proxy statement or notice of Internet availability of proxy materials?
You received a copy of this proxy statement (or a notice of Internet availability of proxy materials) because you owned shares of our stock on March 21, 2016, the record date, and that entitles you to vote at the Annual Meeting. This proxy statement describes the matters to be voted on at the meeting and provides information on those matters. It also provides certain information about the Company that we must disclose to you when the Board solicits your proxy.
Q: Why did some shareholders receive a one-page notice in the mail regarding the Internet availability of proxy materials instead of a full set of the printed proxy materials?
The Securities and Exchange Commission allows us to provide access to proxy materials via the Internet rather than mailing a printed copy to each shareholder. Most shareholders received a notice of Internet availability, which explains how to access the proxy materials on the Internet and how to vote using the Internet.
Q: How can I get a paper copy of the proxy materials?
The notice of Internet availability (the “Notice”) contains instructions on how to obtain a paper copy of all proxy materials — including our proxy statement, our 2015 annual report and a proxy card form. If you would like to receive paper copies of our proxy materials, please follow the instructions in the Notice and submit your request by May 15 to ensure that you receive the materials before the Annual Meeting.
Q: How can I sign up for Internet access to the proxy materials?
If you hold shares registered in your name, you may sign up at www.proxypush.com/lnc to receive access to the proxy material over the Internet for future meetings, rather than receiving mailed copies. If you chose Internet access, you will receive an email notifying you when the Annual Report and Proxy Statement are available, with links to access the documents on a website with instructions on how to vote via the Internet. Your enrollment for Internet access will remain in effect for subsequent years, although you can cancel it up to two weeks prior to the record date for any annual meeting.
If you hold your shares in “street name,” you may be able to obtain Internet access to proxy materials by contacting your broker, bank or other intermediary.
Q: What will I be voting on at the Annual Meeting?
You are being asked to:
1. elect seven directors for a one-year term expiring at the 2017 Annual Meeting of Shareholders;
2. ratify the appointment of Ernst & Young LLP as the independent registered public accounting firm for 2016;
3. approve an advisory (non-binding) resolution on the compensation of our named executive officers; and
4. consider and vote on a shareholder proposal if properly presented at the meeting.
- 78 -
Table of Contents
The Board recommends that you vote FOR agenda items 1, 2 and 3 and AGAINST agenda item 4.
While it is possible that other matters could come up for voting at the meeting, the Board is not aware of any other matters at present.
Q: How do I attend the Annual Meeting?
If you attend the Annual Meeting, you will be asked to present valid, government-issued photo indentification, such as a driver’s license. If you are a holder of record, the top half of your proxy card or your Notice is your admission ticket. If you hold your shares in street name, you will need proof of ownership to be admitted to the meeting. A recent brokerage statement or a letter from your bank or broker are examples of proof of ownership. If you want to vote your shares held in street name in person, you must get a legal proxy in your name from the broker, bank or other nominee that holds your shares, and submit it with your vote.
Attendance at the Annual Meeting is limited to shareholders of the Company as of the record date (March 21, 2016). Each shareholder may appoint only one proxy holder or representative to attend the Annual Meeting on his or her behalf.
Q: Who is entitled to vote?
Only shareholders of record at the close of business on March 21, 2016, the record date for the meeting, are entitled to vote at the Annual Meeting.
Q: What constitutes a quorum at the Annual Meeting?
A majority of all outstanding shares entitled to vote at the Annual Meeting constitutes a quorum, which is the minimum number of shares that must be present or represented by proxy at the Annual Meeting in order to transact business. As of the record date, we had 239,018,665 shares of common stock, issued, outstanding and entitled to vote at the Annual Meeting. Once a share is counted as present at the Annual Meeting, it will be deemed present for quorum purposes for the entire meeting (and for any meeting resulting from a postponement of the Annual Meeting, unless a new record date is set).
Abstentions and broker non-votes will be counted for purposes of determining whether a quorum is present. Generally, “broker non-votes” occur when brokerage firms return proxies for which no voting instructions have been received and the broker does not have discretionary authority to vote on the proposal.
Q: How do I vote?
You are entitled to one vote for each share of common stock you own. You will find the number of shares you own (and may vote) on the proxy card or the Notice that you received.
You may vote:

|
IN PERSON. If you are a shareholder of record (i.e., you own your shares directly and not through a broker-dealer or other financial institution), you may vote your shares at the meeting or send a personal representative, with an appropriate proxy, to vote on your behalf.
If you own your shares in “street name” (i.e., through a broker-dealer or other financial institution), you will need to present a proxy card from the institution that holds your shares to vote at the meeting.
Note: You cannot vote in person at the Annual Meeting if you only own share equivalents through the LNC Stock Fund of the Employees’ 401(k) Savings Plan, the LNL Agents’ 401(k) Savings Plan, or the LNL ABGA Money Purchase Plan, or through our dividend reinvestment plan. |
- 79 -
Table of Contents
| For instructions on voting these share equivalents, see below under “How do I vote my 401(k), Money Purchase Plan, and/or dividend reinvestment plan shares?” For more information on voting in person, including appropriate forms of proof of ownership and directions to the meeting, contact Shareholder Services at 1800-237-2920 or [email protected]. |

|
BY MAIL. If you received a paper copy of the proxy materials, please mark, date, sign and mail the proxy card in the prepaid envelope the Company provided. For any other matter properly brought forth at the Annual Meeting, the individuals named as proxies will, to the extent permissible, vote all proxies in the manner they believe to be in our best interests.
BY TELEPHONE OR INTERNET. Whether you received a paper copy of the proxy materials or viewed them online, you may vote either by telephone (within the United States, Canada or Puerto Rico only) or through the Internet, as follows:
CALL: 866-883-3382
VISIT: WWW.PROXYPUSH.COM/LNC
To use telephone or Internet voting, you must provide your assigned control number noted on the proxy card or Notice. In addition to the instructions that appear on the proxy card or Notice, step-by-step instructions will be provided by a prerecorded telephone message or at the designated website.
If you hold your shares in “street name,” please check your proxy card or Notice, or contact your broker, nominee, fiduciary or other custodian, to determine if you will be able to vote by telephone or Internet. |

Q: How many votes are needed to approve each proposal?
Assuming a quorum is present, a majority of the votes cast by the holders of shares entitled to vote at the annual meeting is required to elect each director, to ratify the appointment of Ernst & Young as our accounting firm, and to approve the advisory resolution on the compensation of our NEOs.
The proposal regarding the approval of our NEOs’ compensation is advisory only and not binding on the Board. Any other proposal that is properly presented at the Annual Meeting will be approved if the number of votes cast in favor of the proposal exceeds the number of votes cast against the proposal.
Q: How do abstentions, unmarked proxy cards and broker non-votes affect the voting results?
Abstentions: Abstentions will not count as votes cast either for or against a nominee or a proposal.
Unmarked Proxy Cards: If you sign and return a proxy or voting instruction card but do not mark how your shares are to be voted, the individuals named as proxies will vote your shares, if permitted, as the Board recommends.
Broker Non-Votes: If you hold your shares in “street name,” you may instruct your broker how to vote your shares. If you do not provide voting instructions, your shares are referred to as “broker non-votes” and the bank, broker or other custodian may vote your shares, at its discretion, only on the ratification of the appointment of our accounting firm. These broker non-votes will be included in the calculation of the number of shares considered to be present at the meeting for purposes of determining a quorum, but will not be considered in determining the number of votes necessary for approval. Broker non-votes will not count as votes cast either for or against a nominee or a proposal.
- 80 -
Table of Contents
Q: Can I revoke my proxy or change my vote after I vote my proxy?
Yes, you may revoke your proxy or change your vote at any time prior to the Annual Meeting. To do so either:
1. notify our Corporate Secretary in writing that you are revoking your vote;
2. submit a new proxy by mail, telephone or Internet; or
3. attend the meeting and vote your shares in person.
Q: How do I vote my 401(k), Money Purchase Plan, and/or dividend reinvestment plan shares?
If you have invested in the LNC Stock Fund of the Employees’ 401(k) Plan, the LNL Agents’ 401(k) Savings Plan, or the LNL ABGA Money Purchase Plan, your voting instructions, whether submitted via telephone or through the Internet (as described above), tell the trustee of your plan how to vote the shares of common stock allocated to the plans. If our stock books contain identical account information regarding common stock that you own directly and common stock that you have an interest in through these plans, you will receive a single proxy/voting instruction card representing all shares you own. If you participate in one of these plans and do not provide the trustee with your voting instructions by 11:59 p.m. Eastern Time on May 24, the trustee of the plans will vote the shares in your account in proportion to the shares held by the plans for which voting instructions have been received.
If you participate in our dividend reinvestment plan, your proxy/voting instruction card(s) will also include the number of shares of common stock allocated to your accounts in that plan. To vote your shares in that plan, you must return your proxy/voting instruction card(s) or submit your voting instructions by telephone or over the Internet as instructed on your proxy/voting instruction card(s).
Q: Who may solicit proxies?
Our directors, officers and employees, as well as Georgeson Inc., our proxy solicitation firm, may solicit proxies on behalf of the Board in person, by mail, telephone, fax and other electronic means.
Q: Who pays the costs of soliciting proxies?
We pay the cost of soliciting proxies. Our fee to Georgeson Inc. to solicit proxies this year is $12,000, plus reasonable expenses. Our directors, officers and employees receive no additional compensation for soliciting proxies. We will reimburse certain brokerage firms, banks, custodians and other fiduciaries for the reasonable mailing and other expenses they incur in forwarding proxy materials to the beneficial owners of stock that those organizations hold of record.
- 81 -
Table of Contents
TO BE INCLUDED IN OUR PROXY MATERIALS
If you wish to include a shareholder proposal in the proxy materials for our 2017 Annual Meeting of Shareholders, you must submit the proposal, in accordance with SEC Rule 14a-8, to our Corporate Secretary, who must receive the proposal by December 16, 2016.
TO BE PRESENTED IN PERSON AT SHAREHOLDER MEETINGS
Our Bylaws set forth advance-notice procedures with respect to proposals and director nominations submitted by a shareholder for presentation directly at an annual meeting, rather than for inclusion in our proxy statement. If you wish to propose a director nominee—or any other matter of business—at an annual shareholder meeting, you must follow the procedures contained in our Bylaws, which include notifying the Corporate Secretary at least 90 but not more than 120 days before the first anniversary of the prior year’s annual meeting. Based on this year’s annual meeting date of May 27, 2016, a notice will be considered timely received for the 2017 Annual Meeting of Shareholders if our Corporate Secretary receives it no earlier than January 27, 2017, and no later than February 26, 2017.
If any annual meeting is scheduled to be held more than thirty (30) days before or more than thirty (30) days after the first anniversary of the prior year’s annual meeting, you must give your notice by the close of business on the later of (i) the date 90 days prior to the scheduled annual meeting or (ii) the tenth day following the date that the scheduled annual meeting is first publicly announced or disclosed. All such proposals and director nominations must satisfy the requirements set forth in our Bylaws, a copy of which is available on our website (www.lfg.com) in the “About Us” section under the “Corporate Governance” header. You many also obtain a hard copy of our Bylaws at no cost by contacting our Corporate Secretary.
If any such matter is brought before the meeting in accordance with our Bylaws, the individuals identified on the proxy card may, if the matter will be voted on, vote the shares represented by proxies at their discretion in the manner they believe to be in our best interests. However, the person presiding at a meeting of shareholders (the chairman) is authorized by the Bylaws to determine whether the proposed business was properly brought before the meeting or was lawful or appropriate for consideration at the meeting or whether a nomination for director was properly made. If the chairman determines that any of these requirements was not met, then the proposed business shall not be transacted or the defective nomination shall be disregarded.
- 82 -
Table of Contents
To the extent that this proxy statement has been or will be specifically incorporated by reference into any of our other filings under the Securities Act of 1933 or the Exchange Act, the sections of this proxy statement entitled “Audit Committee Report” and “Compensation Committee Report” shall not be deemed to be so incorporated, unless specifically provided otherwise in such filing.
COMPLIANCE WITH BENEFICIAL OWNERSHIP REPORTING
Section 16(a) of the Exchange Act requires that our directors, certain officers, and those who are beneficial owners of more than 10% of our stock file reports of their holdings and transactions with the SEC and the NYSE. Based on statements from our directors and our officers subject to Section 16, as well as a review of the reports filed for transactions during 2015, we believe that each of our directors and officers subject to Section 16 met all applicable filing requirements.
You may request a printed copy of our Annual Report on Form 10-K, at no charge, by writing to: Corporate Secretary, Lincoln National Corporation, 150 N. Radnor Chester Road, Radnor, PA 19087. In addition, you can access our Form 10-K and other reports on the SEC’s website at www.sec.gov and on our website at www.lfg.com.
The Board of Directors is not aware of any matters that will be presented for action at the Annual Meeting other than those mentioned in this proxy statement. However, if any other matter should properly come before the meeting, the persons authorized by the accompanying proxy will vote and act with respect to such matter(s) in what they believe to be in the best interests of the Company and its shareholders.
A list of shareholders entitled to vote at the Annual Meeting will be available for examination at the Annual Meeting.
For the Board of Directors,
Kirkland L. Hicks
Executive Vice President,
General Counsel & Secretary
April 15, 2016
- 83 -
Table of Contents
RECONCILIATION OF NON-GAAP MEASURES
DEFINITION OF INCOME (LOSS) FROM OPERATIONS, OPERATING REVENUES AND OPERATING RETURN ON EQUITY
Income (loss) from operations, operating revenues and operating return on equity (“ROE”) are non-GAAP financial measures and do not replace GAAP revenues, net income (loss) and ROE. We exclude the after-tax effects of the following items from GAAP net income (loss) to arrive at income (loss) from operations: realized gains and losses associated with the following (“excluded realized gain (loss)”): sales or disposals and impairments of securities; change in the fair value of derivative investments, embedded derivatives within certain reinsurance arrangements and our trading securities; change in the fair value of the derivatives we own to hedge our guaranteed death benefit (“GDB”) riders within our variable annuities, which is referred to as “GDB derivatives results”; change in the fair value of the embedded derivatives of our guaranteed living benefit (“GLB”) riders within our variable annuities accounted for under the Derivatives and Hedging and the Fair Value Measurements and Disclosures Topics of the Financial Accounting Standards Board (“FASB”) Accounting Standards Codification (“ASC”) (“embedded derivative reserves”), net of the change in the fair value of the derivatives we own to hedge the changes in the embedded derivative reserves, the net of which is referred to as “GLB net derivative results”; and changes in the fair value of the embedded derivative liabilities related to index call options we may purchase in the future to hedge contract holder index allocations applicable to future reset periods for our indexed annuity products accounted for under the Derivatives and Hedging and the Fair Value Measurements and Disclosures Topics of the FASB ASC (“indexed annuity forward-starting option”); change in reserves accounted for under the Financial Services – Insurance – Claim Costs and Liabilities for Future Policy Benefits Subtopic of the FASB ASC resulting from benefit ratio unlocking on our GDB and GLB riders (“benefit ratio unlocking”); income (loss) from the initial adoption of new accounting standards; income (loss) from reserve changes (net of related amortization) on business sold through reinsurance; gain (loss) on early extinguishment of debt; losses from the impairment of intangible assets; and income (loss) from discontinued operations.
Operating revenues represent GAAP revenues excluding the pre-tax effects of the following items, as applicable: excluded realized gain (loss); amortization of deferred front-end loads (“DFEL”) arising from changes in GDB and GLB benefit ratio unlocking; amortization of deferred gains arising from the reserve changes on business sold through reinsurance; and revenue adjustments from the initial adoption of new accounting standards.
ROE measures how efficiently we generate profits from the resources provided by our net assets. ROE is calculated by dividing annualized income (loss) from operations by average equity, excluding accumulated other comprehensive income (loss) (“AOCI”). Management evaluates return on equity by both including and excluding average goodwill within average equity.
Income (loss) from operations, operating revenues and return on equity (including and excluding average goodwill within average equity), excluding AOCI, using annualized income (loss) from operations are financial measures we use to evaluate and assess our results. Management believes that these performance measures explain the results of the company’s ongoing businesses in a manner that allows for a better understanding of the underlying trends in the company’s current business because the excluded items are unpredictable and not necessarily indicative of current operating fundamentals or future performance of the business segments, and, in most instances, decisions regarding these items do not necessarily relate to the operations of the individual segments.
The company uses its prevailing corporate federal income tax rate of 35% while taking into account any permanent differences for events recognized differently in its financial statements and federal income tax returns when reconciling non-GAAP measures to the most comparable GAAP measure.
E-1
Table of Contents
(millions of dollars, except per share data)
| FOR THE YEAR ENDED DECEMBER 31, |
||||||||||||
| 2015 | 2014 | 2013 | ||||||||||
| Total Revenues |
$ | 13,572 | $ | 13,554 | $ | 11,969 | ||||||
| Less: |
||||||||||||
| Excluded realized gain (loss) |
(329 | ) | (165 | ) | (273 | ) | ||||||
| Amortization of DFEL on benefit ratio unlocking |
(2 | ) | – | – | ||||||||
| Amortization of deferred gains arising from reserve changes on business sold through reinsurance |
3 | 3 | 3 | |||||||||
|
|
|
|
|
|
|
|||||||
| Total Operating Revenues |
$ | 13,900 | $ | 13,716 | $ | 12,239 | ||||||
|
|
|
|
|
|
|
|||||||
| Net Income (Loss) Available to Common Stockholders – Diluted |
$ | 1,150 | $ | 1,519 | $ | 1,244 | ||||||
| Less: |
||||||||||||
| Adjusted for deferred units of LNC stock in our Deferred compensation plans(1) |
(4 | ) | 4 | – | ||||||||
| Net Income (Loss) |
$ | 1,154 | $ | 1,515 | 1,244 | |||||||
| Less (2): |
||||||||||||
| Excluded realized gain (loss) |
(214 | ) | (106 | ) | (178 | ) | ||||||
| Benefit ratio unlocking |
(29 | ) | 7 | 36 | ||||||||
| Income (loss) from reserve changes (net of related amortization) on business sold through reinsurance |
2 | 2 | 2 | |||||||||
| Income (loss) from discounted operations |
– | 1 | – | |||||||||
|
|
|
|
|
|
|
|||||||
| Income (Loss) from Operations |
$ | 1,395 | $ | 1,611 | $ | 1,384 | ||||||
|
|
|
|
|
|
|
|||||||
| Earnings (Loss) Per Common Share (Diluted) |
||||||||||||
| Income (loss) from operations |
$ | 5.46 | $ | 6.03 | $ | 5.03 | ||||||
| Net income (loss) |
4.51 | 5.67 | 4.52 | |||||||||
| Average Stockbrokers’ Equity |
||||||||||||
| Average equity, including average AOCI |
$ | 15,001 | $ | 14,996 | $ | 13,945 | ||||||
| Average AOCI |
2,308 | 2,726 | 2,477 | |||||||||
|
|
|
|
|
|
|
|||||||
| Average equity, excluding AOCI |
12,693 | 12,270 | 11,468 | |||||||||
| Average goodwill |
2,273 | 2,273 | 2,273 | |||||||||
|
|
|
|
|
|
|
|||||||
| Average equity, excluding AOCI and goodwill |
$ | 10,240 | $ | 9,997 | $ | 9,195 | ||||||
|
|
|
|
|
|
|
|||||||
| Return on Equity, Excluding AOCI |
||||||||||||
| Net income (loss) with average equity including goodwill |
9.1 | % | 12.3 | % | 10.8 | % | ||||||
| Income (loss) from operations with average equity including goodwill |
11.0 | % | 13.1 | % | 12.1 | % | ||||||
| Income (loss) from operations with average equity excluding goodwill |
13.4 | % | 16.1 | % | 15.0 | % | ||||||
| 1. | The numerator used in the calculation of our diluted EPS is adjusted to remove the mark-to-market adjustment for deferred units of LNC stock in our deferred compensation plans if the effect of equity classification would result in a more dilutive EPS. |
| 2. | We use our prevailing federal income tax rate of 35% while taking into account any permanent difference for events recognized differently in our financial statements and federal income tax returns when reconciling our non-GAAP measures to the most comparable GAAP measure. |
E-2
Table of Contents
DEFINITION OF BOOK VALUE PER SHARE EXCLUDING AOCI
Book value per share excluding AOCI is calculated based upon a non-GAAP financial measure. It is calculated by dividing (a) stockholders’ equity excluding AOCI by (b) common shares outstanding. We provide book value per share excluding AOCI to enable investors to analyze the amount of our net worth that is primarily attributable to our business operations. Management believes book value per share excluding AOCI is useful to investors because it eliminates the effect of items that can fluctuate significantly from period to period, primarily based on changes in interest rates. Book value per share is the most directly comparable GAAP measure. A reconciliation of book value per share to book value per share excluding AOCI as of December 31, 2014 and 2013, is presented below.
| AS OF DECEMBER 31, | ||||||||||||
| 2015 | 2014 | 2013 | ||||||||||
| Book value per share, including AOCI |
$ | 51.17 | $ | 61.35 | $ | 51.17 | ||||||
| Per share impact of AOCI |
5.94 | 12.06 | 5.94 | |||||||||
| Book value per share, excluding AOCI |
45.23 | 49.29 | 45.23 | |||||||||
Sales as reported consist of the following: MoneyGuard®, our linked benefit product – 15% of single premium deposits; single premium bank-owned universal life and variable universal life – 15% of single premium deposits; universal life (“UL”), indexed universal life, variable universal life (“VUL”), and corporate-owned UL and VUL – five-year commisionable premiums plus 5% of excess premiums received, including an adjustment for internal replacements of approximately 50% of commissionable premiums; term – 100% of annualized first year premiums; Annuities – deposits from new and existing customers; and Group Protection – annualized first year premiums from new policies.
E-3
Table of Contents
MCLAGAN PARTNERS 2014 INVESTMENT PRODUCT SALES & MARKETING SURVEY US SELECT GROUP RESULTS LIST OF PARTICIPANTS
| Aberdeen Asset Management | Jennison Associates, LLC | |
| Acadian Asset Management, LLC | John Hancock Funds | |
| AEGON USA, LLC | LaSalle Investment Management | |
| Allianz Global Investors ex. PIMCO | Lazard Asset Management LLC | |
| American Beacon Advisors | Loomis, Sayles & Company, L.P. | |
| American Century Investments | Lord, Abbett & Co., LLC | |
| AMG Funds LLC | MacKay Shields LLC | |
| AQR Capital Management, LLC | MFS Investment Management | |
| Arrowstreet Capital, L.P. | Nationwide | |
| Artisan Partners Limited Partnership | Natixis Global Associates | |
| AXA Investment Managers | Neuberger Berman Group | |
| Babson Capital Management LLC | New York Life Investment Management LLC | |
| Barrow, Hanley, Mewhinner & Strauss | Nuveen Investments | |
| William Blair & Company, L.L.C. | OFI Global Asset Management/OppenheimerFunds | |
| BMO Global Asset Management | Old Mutual Asset Management | |
| BNP Paribas Investment Partners | Pacific Investment Management Company LLC | |
| BNY Mellon Cash Investment Strategies | Pacific Life Insurance Company | |
| Brandywine Global Investment Management, LLC | PineBridge Investments | |
| Bridgewater Associates, Inc. | Pioneer Investment Management | |
| Brown Brothers Harriman & Co. | PPM America, Inc. | |
| CRBE Global Investors | The Principal Financial Group | |
| Charles Schwab Investment Management, Inc. | Prudential Financial | |
| ClearBridge Investments | Putnam Investments | |
| Conning Holdings Corp. | Pyramis Global Advisors | |
| Delaware Investments | Rogge Global Partners Plc | |
| Eaton Vance Investment Managers | Schroder Investment Management NA Inc. | |
| Fidelity Investments | Standish Mellon Asset Management Company LLC | |
| First Eagle Investment Management, LLC | Stone Harbor Investment Partners LP | |
| Franklin Templeton Investments | Sun Trust Bank/RidgeWorth Capital Management | |
| GMO LLC | T. Rowe Price Associates, Inc. | |
| Great-West Financial | Thornburg Investment Management, Inc. | |
| Guggenheim Investments | TIAA-CREF | |
| Harris Associates | Trust Company of the West | |
| Hartford Investment Management Company | USAA Investment Management Co. | |
| HSBC Global Asset Management | T. Rowe Price Associates, Inc. | |
| Jackson National Life Insurance Company | Virtus Investment Partners, Inc. | |
| Janus Capital Group | Waddell & Reed, Inc. |
E-4
Table of Contents
DEFINITIONS FOR INCENTIVE COMPENSATION PROGRAMS 2015 AIP
For the 2015 AIP, “Income from Operations” is defined as set forth in our Annual Report on Form 10-K for the year ended December 31, 2014, which is set forth in Exhibit 1. In addition, for calculating Income from Operations for the 2015 AIP the following items may be excluded from Income from Operations, all net of tax:
| A. | Expenses related to acquisitions, mergers, divestitures, integration and restructuring activities, including restructuring charges, and losses associated with changes to employee benefit plans; |
| B. | Reductions in earnings in the performance period from those in the base year as a result of the ongoing impact of a change in accounting principle; |
| C. | Losses and expenses resulting from claims, damages, judgments, liabilities and settlements arising from legal and regulatory proceedings in excess of $10 million; |
| D. | Reductions in earnings resulting from the sale or reinsurance of a business or block of business; |
| E. | Reduction in earnings from increases in our effective tax rate and the related taxes due to legislative changes and changes in income tax laws, including but not limited to, changes in the computation of the separate account dividends received deduction under the federal income tax law and increases to the corporate tax rate; |
| F. | Reduction in earnings resulting from changes in regulatory requirements governing the Company, including but not limited to, the Dodd-Frank Wall Street Reform and Consumer Protection Act; |
| G. | Reduction in earnings resulting from changes in the assumptions used in our actuarial models and systems, the changes resulting from the review of such models and systems and the changes to or conversion of actuarial systems; and |
| H. | Reduction in earnings from significant disruptions in the operations of the Company as could result from a natural disaster, act of God, act of terrorism, inability of the capital markets to function and other similar items in nature that impact the operations of the Company. |
2013 LTI
For the 2013 LTI Program, Return on Equity (“ROE”) was defined as follows:
Income from Operations, as defined below, divided by average Shareholders’ Equity for the relevant period. Shareholders’ Equity excludes Accumulated Other Comprehensive Income or other similar items and excludes the increase in equity due to goodwill associated with an acquisition during the performance period. ROE was calculated as of December 31, 2015, using the average of the beginning and ending common shares outstanding for 2015.
Income from Operations is defined as net income for the relevant performance period in accordance with generally accepted accounting principles, but excluding the after-tax effects of the following items:
| 1) | Realized gains and losses – defined as the following: |
| a. | Sales or disposals of securities; |
| b. | Impairments of securities; |
| c. | Change in the fair value of derivatives, embedded derivatives within certain reinsurance arrangements and the change in the fair value of our trading securities; |
| d. | Change in the fair value of the derivatives we own to hedge our guaranteed death benefit (“GDB”) riders within our variable annuities; |
| e. | Change in the guaranteed living benefit (“GLB”) embedded derivative reserves accounted for at fair value, net of the change in the fair value of the derivatives we own to hedge them; and |
| f. | Changes in the fair value of the embedded derivative liabilities related to index call options we may purchase in the future to hedge contract holder index allocations applicable to future reset periods for our indexed annuity products accounted for at fair value; |
E-5
Table of Contents
| 2) | Changes in reserves resulting from benefit ratio unlocking on our GDB and GLB riders; |
| 3) | Income (loss) from the initial adoption of new accounting standards |
| 4) | Gain or loss on early extinguishment of debt; |
| 5) | Income (loss) from reserve changes (net of related amortization) on business sold through reinsurance |
| 6) | Losses from the impairment of intangible assets; and |
| 7) | Income (loss) from discontinued operations – both the income in the period and the gain or loss on disposition (U.S. generally accepted accounting principles (“U.S. GAAP”) require that when a business meets the criteria for being classified as Discontinued Operations, all prior periods must be restated). |
In addition, the following items will be excluded from Income from Operations, all net of tax:
| A. | Expenses related to acquisitions, mergers, divestitures, integration and restructuring activities, including restructuring charges and losses associated with changes to employee benefit plans; |
| B. | Reductions in earnings in the performance period from those in the base year as a result of the ongoing impact of a change in accounting principle; |
| C. | Losses and expenses resulting from claims, damages, judgments, liabilities and settlements arising from legal and regulatory proceedings in excess of $10 million; |
| D. | Reductions in earnings resulting from the sale or reinsurance of a business or block of business; |
| E. | Reduction in earnings from increases in our effective tax rate and the related taxes due to legislative changes in income tax laws, including but not limited to, changes in the computation of the separate account dividends received deduction under the federal income tax law and increases to the corporate tax rate; |
| F. | Reduction in earnings resulting from changes in regulatory requirements governing the Company, including but not limited to, the Dodd-Frank Wall Street Reform and Consumer Protection Act; |
| G. | Reduction in earnings resulting from changes in the assumptions used in our actuarial models and systems, the changes resulting from the review of such models and systems and the changes to or conversion of actuarial systems; and |
| H. | Reduction in earnings from significant disruptions in the operations of the Company as could result from a natural disaster, act of God, act of terrorism, the inability of the capital markets to function, and other similar items in nature that impact the operations of the Company. |
Unless otherwise defined above, all terms have the meaning as set forth in our Annual Report on Form 10-K for the year ended December 31, 2012.
E-6
Table of Contents
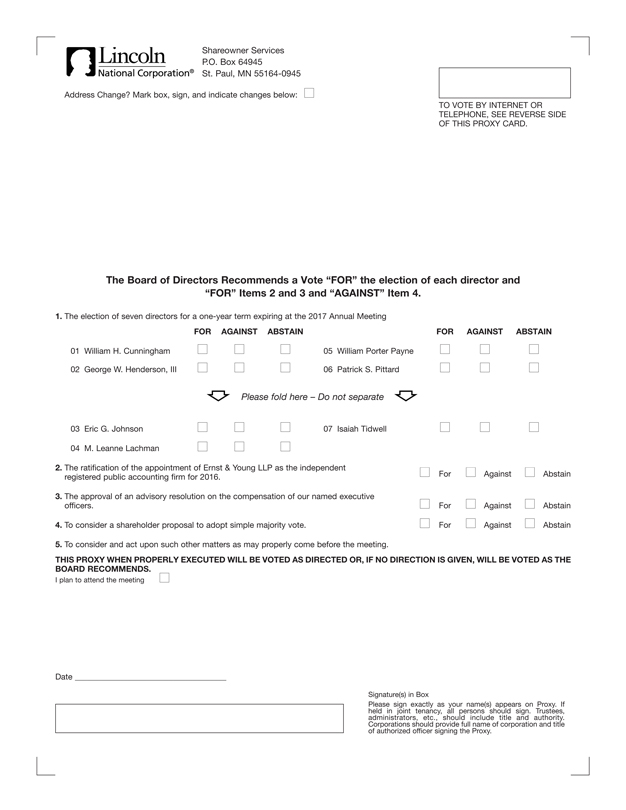
Shareowner Services P.O. Box 64945 St. Paul, MN 55164-0945
Address Change? Mark box, sign, and indicate changes below: ?
TO VOTE BY INTERNET OR
TELEPHONE, SEE REVERSE SIDE OF THIS PROXY CARD.
The Board of Directors Recommends a Vote “FOR” the election of each director and “FOR” Items 2
and 3 and “AGAINST” Item 4.
1. The election of seven directors for a one-year term expiring at the 2017 Annual Meeting
FOR AGAINST ABSTAIN
FOR AGAINST ABSTAIN
01 William H. Cunningham
02 George W. Henderson, III
05 William Porter Payne
06 Patrick S. Pittard
Please fold here – Do not separate
03 Eric G. Johnson
04 M. Leanne Lachman
07 Isaiah Tidwell
The ratification of the appointment of Ernst & Young LLP as the independent registered public accounting firm for 2016.
The approval of an advisory resolution on the compensation of our named executive officers.
To
consider a shareholder proposal to adopt simple majority vote.
5. To consider and act upon such other matters as may properly come before the meeting.
THIS PROXY WHEN PROPERLY EXECUTED WILL BE VOTED AS DIRECTED OR, IF NO DIRECTION IS GIVEN, WILL BE VOTED AS THE BOARD RECOMMENDS.
I plan to attend the meeting ?
Date
Signature(s) in Box
Please sign exactly as your name(s) appears on Proxy. If held in joint
tenancy, all persons should sign. Trustees, administrators, etc., should include title and authority. Corporations should provide full name of corporation and title of authorized officer signing the Proxy.
Table of Contents
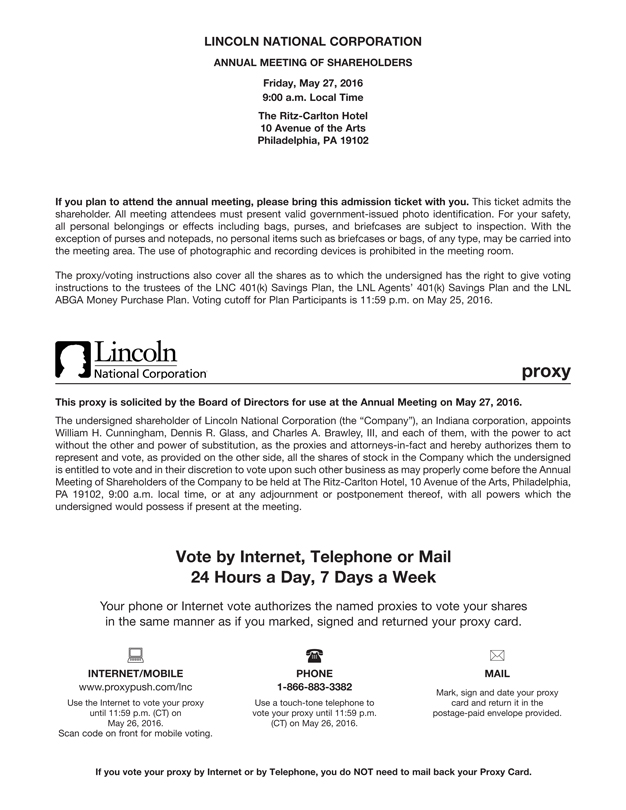
LINCOLN NATIONAL CORPORATION
ANNUAL MEETING OF
SHAREHOLDERS
Friday, May 27, 2016 9:00 a.m. Local Time
The Ritz-Carlton
Hotel
10 Avenue of the Arts Philadelphia, PA 19102
If you plan to attend the
annual meeting, please bring this admission ticket with you. This ticket admits the shareholder. All meeting attendees must present valid government-issued photo identification. For your safety, all personal belongings or effects including bags,
purses, and briefcases are subject to inspection. With the exception of purses and notepads, no personal items such as briefcases or bags, of any type, may be carried into the meeting area. The use of photographic and recording devices is prohibited
in the meeting room.
The proxy/voting instructions also cover all the shares as to which the undersigned has the right to give voting instructions to the trustees
of the LNC 401(k) Savings Plan, the LNL Agents’ 401(k) Savings Plan and the LNL ABGA Money Purchase Plan. Voting cutoff for Plan Participants is 11:59 p.m. on May 25, 2016.
This proxy is solicited by the Board of Directors for use at the Annual Meeting on May 27, 2016.
The undersigned shareholder of Lincoln National Corporation (the “Company”), an Indiana corporation, appoints William H. Cunningham, Dennis R. Glass, and Charles A.
Brawley, III, and each of them, with the power to act without the other and power of substitution, as the proxies and attorneys-in-fact and hereby authorizes them to represent and vote, as provided on the other side, all the shares of stock in the
Company which the undersigned is entitled to vote and in their discretion to vote upon such other business as may properly come before the Annual Meeting of Shareholders of the Company to be held at The Ritz-Carlton Hotel, 10 Avenue of the Arts,
Philadelphia, PA 19102, 9:00 a.m. local time, or at any adjournment or postponement thereof, with all powers which the undersigned would possess if present at the meeting.
Vote by Internet, Telephone or Mail
24 Hours a Day, 7 Days a Week
Your phone or Internet vote authorizes the named proxies to vote your shares in the same manner as if you marked, signed and returned your proxy card.
INTERNET/MOBILE PHONE MAIL
www.proxypush.com/lnc 1-866-883-3382
Mark, sign and date your proxy
Use the Internet to vote your proxy Use a touch-tone telephone
to card and return it in the
until 11:59 p.m. (CT) on vote your proxy until 11:59 p.m. postage-paid envelope provided.
May 26, 2016.(CT) on May 26, 2016.
Scan code on front for mobile voting.
If you vote your proxy by Internet or by Telephone, you do NOT need to mail back your Proxy Card.
Serious News for Serious Traders! Try StreetInsider.com Premium Free!
You May Also Be Interested In
- AERWINS Technologies Announces Additional Staff Determination
- Smart for Life Announces the Successful Completion of Restructuring Program
- Pinnacle Financial Partners Announces 1Q24 Dividend
Create E-mail Alert Related Categories
SEC FilingsSign up for StreetInsider Free!
Receive full access to all new and archived articles, unlimited portfolio tracking, e-mail alerts, custom newswires and RSS feeds - and more!
