

Form 8-K/A NABORS INDUSTRIES LTD For: Aug 02
 Tweet
Tweet Share
Share
UNITED STATES
SECURITIES AND EXCHANGE COMMISSION
Washington, D.C. 20549
Form 8-K/A
CURRENT REPORT
PURSUANT TO SECTION 13 OR 15(d) OF THE
SECURITIES EXCHANGE ACT OF 1934
Date of Report (Date of earliest event reported) August 2, 2016
NABORS INDUSTRIES LTD.
(Exact name of registrant as specified in its charter)
|
Bermuda |
|
001-32657 |
|
98-0363970 |
|
(State or Other Jurisdiction of |
|
(Commission File Number) |
|
(I.R.S. Employer |
|
Crown House |
|
N/A |
|
(Address of principal executive offices) |
|
(Zip Code) |
(441) 292-1510
(Registrant’s telephone number, including area code)
N/A
(Former name or former address, if changed since last report.)
Check the appropriate box below if the Form 8-K filing is intended to simultaneously satisfy the filing obligation of the registrant under any of the following provisions:
o Written communications pursuant to Rule 425 under the Securities Act (17 CFR 230.425)
o Soliciting material pursuant to Rule 14a-12 under the Exchange Act (17 CFR 240.14a-12)
o Pre-commencement communications pursuant to Rule 14d-2(b) under the Exchange Act (17 CFR 240.14d-2(b))
o Pre-commencement communications pursuant to Rule 13e-4(c) under the Exchange Act (17 CFR 240.13e-4(c))
Explanatory Note
This Amendment No. 1 to the Current Report on Form 8-K amends Item 8.01 of the Current Report on Form 8-K previously filed on August 2, 2016 (the “Original Form 8-K”) solely to address an inadvertent omission of data on slide 7 of the investor presentation furnished as Exhibit 99.2 thereto. A full copy of the investor presentation with the revised slide 7 is furnished hereto as Exhibit 99.3 and should be referred to in lieu of Exhibit 99.2 in the Original Form 8-K. No other changes have been made to the Original Form 8-K.
Item 9.01 Financial Statements and Exhibits.
(d) Exhibits
|
Exhibit No. |
|
Description |
|
|
|
|
|
99.3 |
|
Investor Information (as revised) |
SIGNATURE
Pursuant to the requirements of the Securities Exchange Act of 1934, the Registrant has duly caused this report to be signed on its behalf by the undersigned hereunto duly authorized.
|
|
|
NABORS INDUSTRIES LTD. |
|
|
|
|
|
|
|
|
|
Date: August 3, 2016 |
By: |
/s/ Mark D. Andrews |
|
|
|
Mark D. Andrews |
|
|
|
Corporate Secretary |
Exhibit 99.3
2Q16 Earnings Presentation August 03, 2016 Presented by: Anthony G. Petrello Chairman, President, & Chief Executive Officer William J. Restrepo Chief Financial Officer

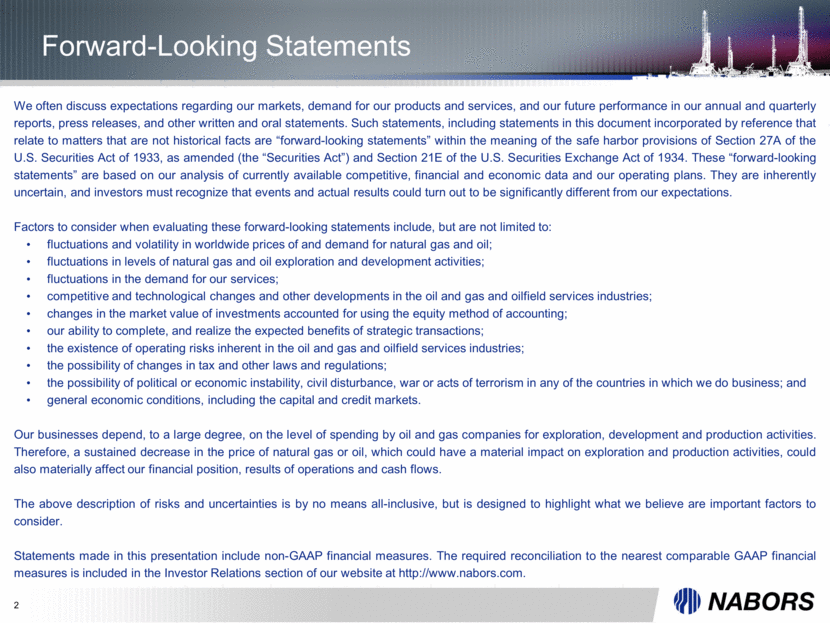
2 We often discuss expectations regarding our markets, demand for our products and services, and our future performance in our annual and quarterly reports, press releases, and other written and oral statements. Such statements, including statements in this document incorporated by reference that relate to matters that are not historical facts are “forward-looking statements” within the meaning of the safe harbor provisions of Section 27A of the U.S. Securities Act of 1933, as amended (the “Securities Act”) and Section 21E of the U.S. Securities Exchange Act of 1934. These “forward-looking statements” are based on our analysis of currently available competitive, financial and economic data and our operating plans. They are inherently uncertain, and investors must recognize that events and actual results could turn out to be significantly different from our expectations. Factors to consider when evaluating these forward-looking statements include, but are not limited to: fluctuations and volatility in worldwide prices of and demand for natural gas and oil; fluctuations in levels of natural gas and oil exploration and development activities; fluctuations in the demand for our services; competitive and technological changes and other developments in the oil and gas and oilfield services industries; changes in the market value of investments accounted for using the equity method of accounting; our ability to complete, and realize the expected benefits of strategic transactions; the existence of operating risks inherent in the oil and gas and oilfield services industries; the possibility of changes in tax and other laws and regulations; the possibility of political or economic instability, civil disturbance, war or acts of terrorism in any of the countries in which we do business; and general economic conditions, including the capital and credit markets. Our businesses depend, to a large degree, on the level of spending by oil and gas companies for exploration, development and production activities. Therefore, a sustained decrease in the price of natural gas or oil, which could have a material impact on exploration and production activities, could also materially affect our financial position, results of operations and cash flows. The above description of risks and uncertainties is by no means all-inclusive, but is designed to highlight what we believe are important factors to consider. Statements made in this presentation include non-GAAP financial measures. The required reconciliation to the nearest comparable GAAP financial measures is included in the Investor Relations section of our website at http://www.nabors.com. Forward-Looking Statements
3 Financial Overview
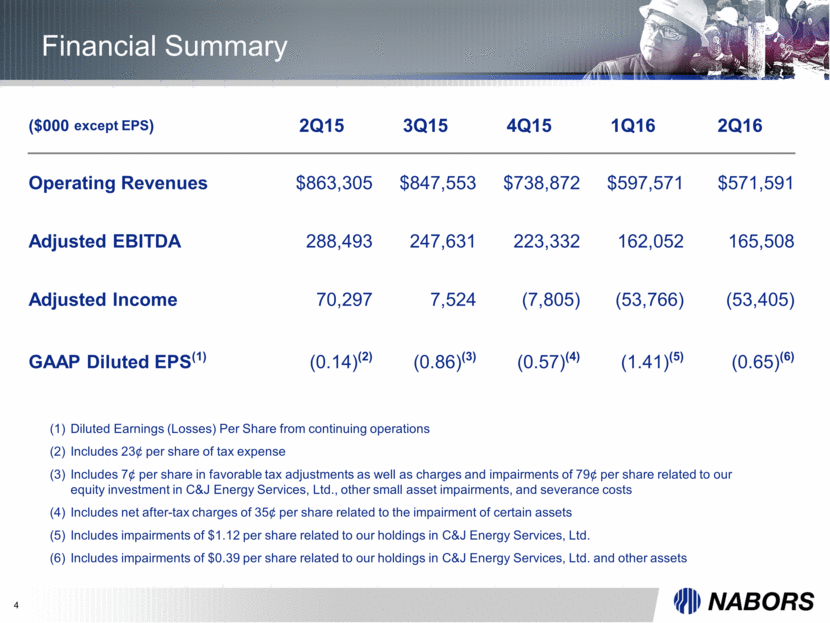
4 Financial Summary Diluted Earnings (Losses) Per Share from continuing operations Includes 23¢ per share of tax expense Includes 7¢ per share in favorable tax adjustments as well as charges and impairments of 79¢ per share related to our equity investment in C&J Energy Services, Ltd., other small asset impairments, and severance costs Includes net after-tax charges of 35¢ per share related to the impairment of certain assets Includes impairments of $1.12 per share related to our holdings in C&J Energy Services, Ltd. Includes impairments of $0.39 per share related to our holdings in C&J Energy Services, Ltd. and other assets ($000 except EPS) 2Q15 3Q15 4Q15 1Q16 2Q16 Operating Revenues $863,305 $847,553 $738,872 $597,571 $571,591 Adjusted EBITDA 288,493 247,631 223,332 162,052 165,508 Adjusted Income 70,297 7,524 (7,805) (53,766) (53,405) GAAP Diluted EPS(1) (0.14)(2) (0.86)(3) (0.57)(4) (1.41)(5) (0.65)(6)
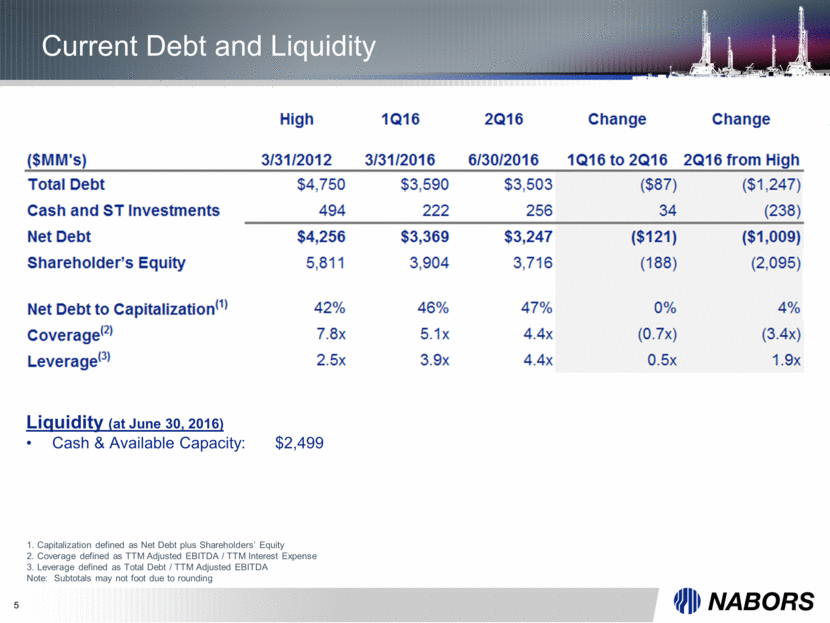
5 Current Debt and Liquidity 1. Capitalization defined as Net Debt plus Shareholders’ Equity 2. Coverage defined as TTM Adjusted EBITDA / TTM Interest Expense 3. Leverage defined as Total Debt / TTM Adjusted EBITDA Note: Subtotals may not foot due to rounding High 1Q16 2Q16 Change Change ($MM's) 3/31/2012 3/31/2016 6/30/2016 1Q16 to 2Q16 2Q16 from High Total Debt $4,750 $3,590 $3,503 ($87) ($1,247) Cash and ST Investments 494 222 256 34 (238) Net Debt $4,256 $3,369 $3,247 ($121) ($1,009) Shareholder's Equity 5,811 3,904 3,716 (188) (2,095) Net Debt to Capitalization(1) 42% 46% 47% 0% 4% Coverage(2) 7.8x 5.1x 4.4x (0.7x) (3.4x) Leverage(3) 2.5x 3.9x 4.4x 0.5x 1.9x Liquidity (at June 30, 2016) Cash & Available Capacity: $2,499
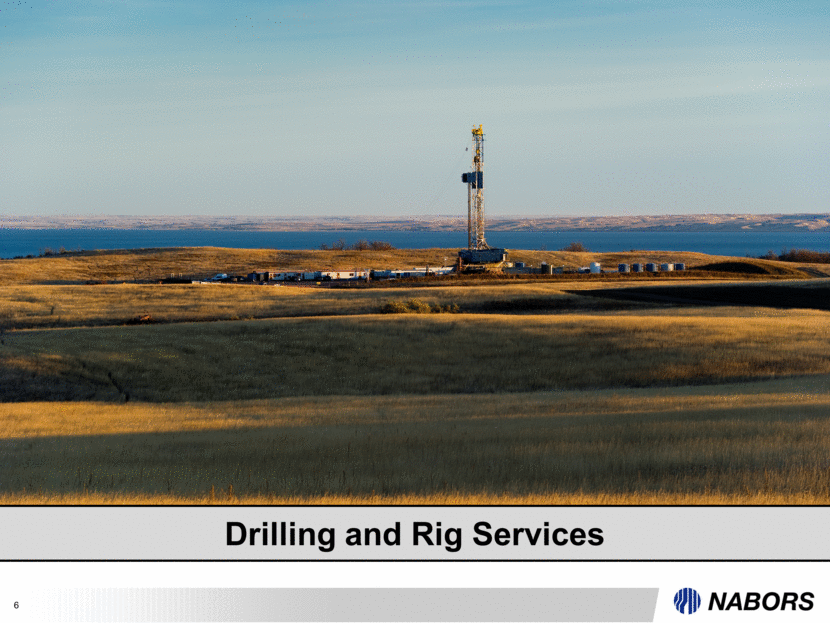
6 Drilling and Rig Services
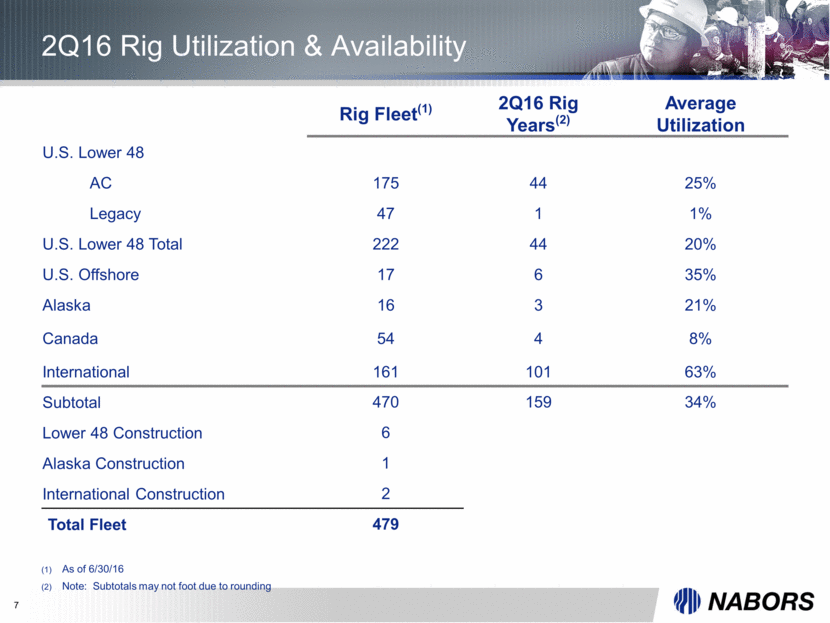
7 2Q16 Rig Utilization & Availability As of 6/30/16 Note: Subtotals may not foot due to rounding Rig Fleet(1) 2Q16 Rig Years(2) Average Utilization U.S. Lower 48 AC 175 44 25% Legacy 47 1 1% U.S. Lower 48 Total 222 44 20% U.S. Offshore 17 6 35% Alaska 16 3 21% Canada 54 4 8% International 161 101 63% Subtotal 470 159 34% Lower 48 Construction 6 Alaska Construction 1 International Construction 2 Total Fleet 479
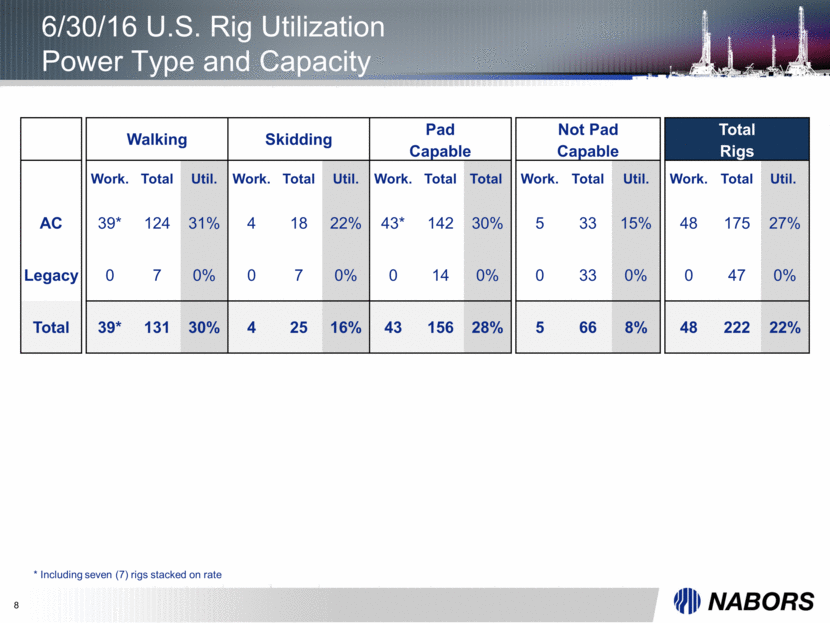
8 6/30/16 U.S. Rig Utilization Power Type and Capacity * Including seven (7) rigs stacked on rate Walking Skidding Pad Not Pad Total Capable Capable Rigs Work. Total Util. Work. Total Util. Work. Total Total Work. Total Util. Work. Total Util. AC 39* 124 31% 4 18 22% 43* 142 30% 5 33 15% 48 175 27% Legacy 0 7 0% 0 7 0% 0 14 0% 0 33 0% 0 47 0% Total 39* 131 30% 4 25 16% 43 156 28% 5 66 8% 48 222 22%
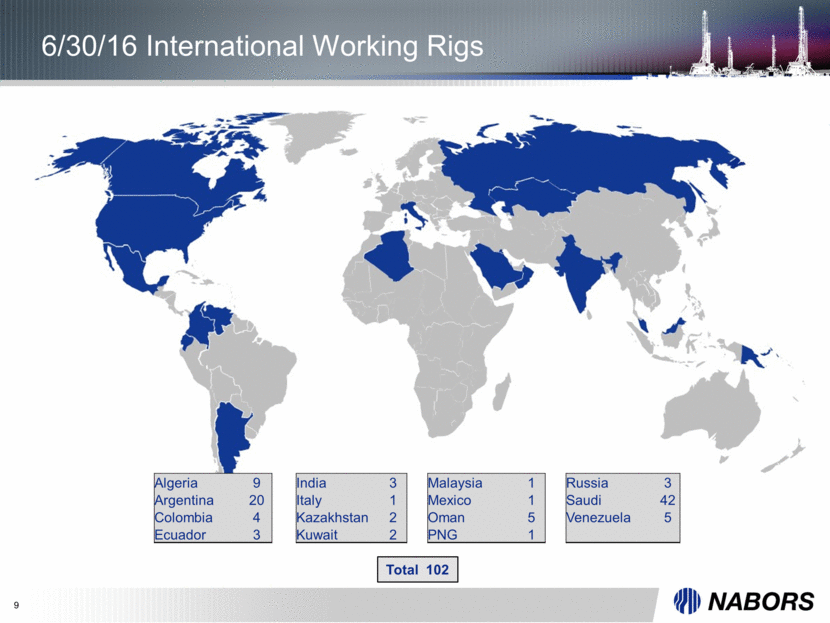
9 6/30/16 International Working Rigs Total 102 Algeria 9 India 3 Malaysia 1 Russia 3 Argentina 20 Italy 1 Mexico 1 Saudi 42 Colombia 4 Kazakhstan 2 Oman 5 Venezuela 5 Ecuador 3 Kuwait 2 PNG 1
10 Appendix
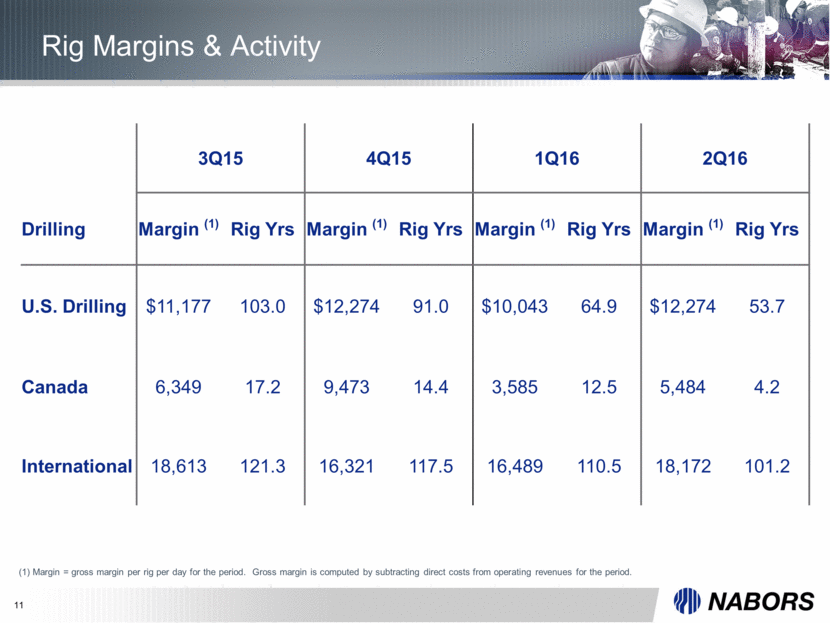
11 Rig Margins & Activity (1) Margin = gross margin per rig per day for the period. Gross margin is computed by subtracting direct costs from operating revenues for the period. 3Q15 4Q15 1Q16 2Q16 Drilling Margin (1) Rig Yrs Margin (1) Rig Yrs Margin (1) Rig Yrs Margin (1) Rig Yrs U.S. Drilling $11,177 103.0 $12,274 91.0 $10,043 64.9 $12,274 53.7 Canada 6,349 17.2 9,473 14.4 3,585 12.5 5,484 4.2 International 18,613 121.3 16,321 117.5 16,489 110.5 18,172 101.2
Serious News for Serious Traders! Try StreetInsider.com Premium Free!
You May Also Be Interested In
- Nauti-Craft, Marine Suspension Inventor, celebrates the Christening of a New Boat, the IMPULSE
- Clearday introduces digital assistants in residential communities
- Form 8.3 - ABRDN European Logistics
Create E-mail Alert Related Categories
SEC FilingsSign up for StreetInsider Free!
Receive full access to all new and archived articles, unlimited portfolio tracking, e-mail alerts, custom newswires and RSS feeds - and more!
