

Form 8-K/A Manitex International, For: Jan 15
 Tweet
Tweet Share
Share
UNITED STATES
SECURITIES AND EXCHANGE COMMISSION
WASHINGTON, D.C. 20549
FORM 8-K/A
(Amendment No. 1)
CURRENT REPORT
Pursuant to Section 13 or 15(d)
of the Securities Exchange Act of 1934
Date of report (Date of the earliest event reported) January 15, 2015
MANITEX INTERNATIONAL, INC.
(Exact Name of Registrant as Specified in Its Charter)
| Michigan | 001-32401 | 42-1628978 | ||
| (State or Other Jurisdiction of Incorporation) |
(Commission File Number) |
(IRS Employer Identification No.) |
| 9725 Industrial Drive, Bridgeview, Illinois | 60455 | |||
| (Address of Principal Executive Offices) | (Zip Code) | |||
(708) 430-7500
(Registrant’s Telephone Number, Including Area Code)
(Former Name or Former Address, if Changed Since Last Report)
Check the appropriate box below if the Form 8-K filing is intended to simultaneously satisfy the filing obligation of the registrant under any of the following provisions:
| ¨ | Written communications pursuant to Rule 425 under the Securities Act (17 CFR 230.425) |
| ¨ | Soliciting material pursuant to Rule 14a-12 under the Exchange Act (17 CFR 240.14a-12) |
| ¨ | Pre-commencement communications pursuant to Rule 14d-2(b) under the Exchange Act (17 CFR 240.14d-2(b)) |
| ¨ | Pre-commencement communications pursuant to Rule 13e-4(c) under the Exchange Act (17 CFR 240.13e-4(c)) |
Explanatory Note
This Amendment No. 1 on Form 8-K/A amends and supplements the Current Report on Form 8-K of Manitex International, Inc. a Michigan corporation (the “Registrant”), filed with the Securities and Exchange Commission (the “Commission”) on January 21, 2015 (the “Initial Form 8-K”) to include financial statements and pro forma financial information permitted pursuant to Item 9.01 of Form 8-K to be excluded from the Initial Form 8-K and filed by amendment to the Initial Form 8-K no later than 71 days after the date on which the Initial Form 8-K was required to be filed. As previously reported in the Initial Form 8-K, effective as of January 15, 2015 the Registrant completed the purchase of PM Group on January 15, 2015.
| Item 9.01 | Financial Statement Exhibits |
| (a) | Financial Statement of Business Acquired |
Audited financial statements of the PM Group for the year ended December 31, 2013 that include audited statements of financial position as of December 31, 2013 and 2012, and consolidated statements of income, consolidated statements of comprehensive income, statements of changes in equity and statements of cash flows for each of the years ended December 31, 2013, 2012 and 2011 and the related Independent Auditors Report thereon are included as Exhibit 99.1 to this Current Report on Form 8-K/A and are incorporated herein by reference.
Unaudited interim financial statements of PM Group for the nine month period ended September 30, 2014 that include unaudited condensed consolidated statements of financial position as of September 30, 2014 and December 31, 2013 and condensed consolidated unaudited statements of income, unaudited condensed consolidated statements of comprehensive income, unaudited condensed consolidated statements of changes in equity and unaudited statements of cash flows for the nine month periods ended September 30, 2014 and 2013 are included as Exhibit 99.2 to this Current Report on Form 8-K/A and are incorporated herein by reference.
| (b) | Pro Forma Financial Information |
The Unaudited Pro Forma Condensed Consolidated Statement of Income for the year ended December 31, 2013, the Unaudited Pro Forma Condensed Consolidated Balance Sheet as of September 30, 2014, the Unaudited Pro Forma Condensed Consolidated Statement of Income for the nine month period ended September 30, 2014, and the notes to the Unaudited Pro Forma Condensed Consolidated Financial Information of Manitex are included as Exhibit 99.3 to this Current Report on Form 8-K/A and are incorporated herein by reference.
| (c) | Exhibit Index |
| 23.1 | Consent of Deloitte & Touche S.p.A. | |
| 99.1 | Audited financial statements of PM Group for the year ended December 31, 2013 | |
| 99.2 | Unaudited interim financial statements of PM Group for the nine month period ended September 30, 2014 | |
| 99.3 | Unaudited Pro Forma Condensed Consolidated Statement of Income for the year ended December 31, 2013, Unaudited Pro Forma Condensed Consolidated Balance Sheet as of September 30, 2014, Unaudited Pro Forma Condensed Consolidated Statement of Income for the nine month period ended September 30, 2014, and the notes to the Unaudited Pro Forma Condensed Consolidated Financial Information of Manitex International, Inc. | |
SIGNATURES
Pursuant to the requirements of the Securities Exchange Act of 1934, the registrant has duly caused this report to be signed on its behalf by the undersigned hereunto duly authorized.
Date: March 26, 2015
| MANITEX INTERNATIONAL, INC. | ||
| By: | /s/ DAVID H. GRANSEE | |
| Name: | David H. Gransee | |
| Title: | Vice President & Chief Financial Officer | |
EXHIBIT INDEX
| Exhibit Number |
Description | |
| 23.1 | Consent of Deloitte & Touche S.p.A. | |
| 99.1 | Audited financial statements of PM Group for the year ended December 31, 2013 | |
| 99.2 | Unaudited interim financial statements of PM Group for the nine month period ended September 30, 2014 | |
| 99.3 | Unaudited Pro Forma Condensed Consolidated Statement of Income for the year ended December 31, 2013, Unaudited Pro Forma Condensed Consolidated Balance Sheet as of September 30, 2014, Unaudited Pro Forma Condensed Consolidated Statement of Income for the nine month period ended September 30, 2014, and the notes to the Unaudited Pro Forma Condensed Consolidated Financial Information of Manitex International, Inc. | |
Exhibit 23.1
CONSENT OF INDEPENDENT AUDITORS
We consent to the incorporation by reference in Registration Statement Nos. 333-191881 and 333-202103 on Form S-3 and No. 333-126978 on Form S-8 of our report dated December 1, 2014, relating to the financial statements of PM Group S.p.A. included in this Current Report on Form 8-K/A.
/s/ Deloitte & Touche S.p.A.
Milan, Italy
March 26, 2015
Exhibit 99.1
ANNUAL REPORT AT DECEMBER 31, 2013
GROUP CONSOLIDATED FINANCIAL STATEMENTS
PM GROUP
1

|
Deloitte & Touche S.p.A. Piazza Malpighi 4/2 40123 Bologna Italia Tel +39 051 65811 Fax +39 051 230874 www.deloitte.it |
INDEPENDENT AUDITORS’ REPORT
To the Board of Directors of
PM Group S.p.A.
We have audited the accompanying consolidated financial statements of PM Group S.p.A. and its subsidiaries (the “Group”) which comprise the consolidated statement of financial position as of December 31, 2013 and 2012, and the consolidated statements of income, comprehensive income, changes in equity and cash flows for each of the three years in the period ended December 31, 2013, and the related notes to the consolidated financial statements.
Management’s Responsibility for the Consolidated Financial Statements
Management is responsible for the preparation and fair presentation of these consolidated financial statements in accordance with International Financial Reporting Standards as issued by the International Accounting Standards Board; this includes the design, implementation, and maintenance of internal control relevant to the preparation and fair presentation of consolidated financial statements that are free from material misstatement, whether due to fraud or error.
Auditors’ Responsibility
Our responsibility is to express an opinion on these consolidated financial statements based on our audits. We conducted our audits in accordance with auditing standards generally accepted in the United States of America. Those standards require that we plan and perform the audit to obtain reasonable assurance about whether the consolidated financial statements are free from material misstatement.
An audit involves performing procedures to obtain audit evidence about the amounts and disclosures in the consolidated financial statements. The procedures selected depend on the auditor’s judgment, including the assessment of the risks of material misstatement of the consolidated financial statements, whether due to fraud or error. In making those risk assessments, the auditor considers internal control relevant to the Group’s preparation and fair presentation of the consolidated financial statements in order to design audit procedures that are appropriate in the circumstances, but not for the purpose of expressing an opinion on the effectiveness of the Group’s internal control. Accordingly, we express no such opinion. An audit also includes evaluating the appropriateness of accounting policies used and the reasonableness of significant accounting estimates made by management, as well as evaluating the overall presentation of the consolidated financial statements.
We believe that the audit evidence we have obtained is sufficient and appropriate to provide a basis for our audit opinion.
Opinion
In our opinion, the consolidated financial statements referred to above present fairly, in all material respects, the financial position of PM Group S.p.A. and its subsidiaries as of December 31, 2013 and 2012, and the results of their operations and their cash flows for each of the three years in the period ended December 31, 2013, in accordance with the International Financial Reporting Standards as issued by the International Accounting Standards Board.
/s/ Deloitte & Touche S.p.A.
Bologna, Italy
December 1, 2014
2
Consolidated Statement of Financial Position
| (in Euro) |
31/12/2013 | 31/12/2012 | ||||||||
| NON-CURRENT ASSETS |
||||||||||
| Tangible assets |
(1) | 19,256,205 | 24,730,071 | |||||||
| Goodwill |
(2) | 33,192,959 | 68,142,670 | |||||||
| Other intangible assets |
(3) | 3,715,926 | 6,740,592 | |||||||
| Investments in other entities |
1,560 | 3,952 | ||||||||
| Deferred tax assets |
(4) | 5,703,493 | 8,055,179 | |||||||
| Other non-current assets |
(5) | 161,832 | 298,531 | |||||||
|
|
|
|
|
|||||||
| Total non-current assets |
62,031,975 | 107,970,995 | ||||||||
|
|
|
|
|
|||||||
| CURRENT ASSETS |
||||||||||
| Inventory |
(6) | 13,851,167 | 30,999,477 | |||||||
| Trade receivables |
(7) | 28,521,700 | 31,900,571 | |||||||
| Current tax receivables |
(8) | 2,066,842 | 2,469,100 | |||||||
| Dividends receivable |
300,000 | 0 | ||||||||
| Cash and cash equivalents |
(9) | 2,220,199 | 2,217,357 | |||||||
| Other current assets |
(10) | 1,570,414 | 1,282,425 | |||||||
|
|
|
|
|
|||||||
| Total current assets |
48,530,322 | 68,868,930 | ||||||||
|
|
|
|
|
|||||||
| Assets held for sale |
(32) | 44,640,884 | 0 | |||||||
|
|
|
|
|
|||||||
| TOTAL ASSETS |
155,203,181 | 176,839,925 | ||||||||
|
|
|
|
|
|||||||
| LIABILITIES AND SHAREHOLDERS’ EQUITY |
||||||||||
| Share capital |
23,311,420 | 23,311,420 | ||||||||
| Reserves |
-34,324 | -185,602 | ||||||||
| Accumulated deficit |
-49,299,634 | -12,360,095 | ||||||||
| Shareholders’ equity - Group |
-26,022,538 | 10,765,723 | ||||||||
| Capital and reserves of non-controlling interests |
905,756 | 957,823 | ||||||||
| Net profit (loss) attributable to non-controlling interests |
29,961 | -31,573 | ||||||||
| Shareholders’ equity attributable to non-controlling interests |
935,717 | 926,250 | ||||||||
|
|
|
|
|
|||||||
| TOTAL SHAREHOLDERS’ EQUITY |
(11) | -25,086,821 | 11,691,973 | |||||||
|
|
|
|
|
|||||||
| NON-CURRENT LIABILITIES |
||||||||||
| Non-current financial payables |
(12) | 1,137,551 | 19,041,611 | |||||||
| Employee benefits |
(13) | 1,413,558 | 2,640,541 | |||||||
| Provisions for risks and charges |
(14) | 1,437,325 | 1,091,403 | |||||||
| Deferred tax liabilities |
(15) | 3,038,312 | 2,883,045 | |||||||
|
|
|
|
|
|||||||
| Total non-current liabilities |
7,026,746 | 25,656,600 | ||||||||
|
|
|
|
|
|||||||
| CURRENT LIABILITIES |
||||||||||
| Current financial payables |
(16) | 100,162,961 | 102,583,464 | |||||||
| Liabilities for financial instruments and derivatives |
(17) | 2,141,069 | 3,140,057 | |||||||
| Current tax payables |
(18) | 1,624,037 | 2,102,781 | |||||||
| Current trade payables |
(19) | 22,131,036 | 25,238,003 | |||||||
| Other current liabilities |
(20) | 4,498,986 | 6,427,047 | |||||||
|
|
|
|
|
|||||||
| Total current liabilities |
130,558,089 | 139,491,352 | ||||||||
|
|
|
|
|
|||||||
| Liabilities held for sale |
(32) | 42,705,167 | 0 | |||||||
|
|
|
|
|
|||||||
| TOTAL LIABILITIES AND SHAREHOLDERS’ EQUITY |
155,203,181 | 176,839,925 | ||||||||
|
|
|
|
|
|||||||
PM GROUP
4
Consolidated Statement of income
| (in Euro) |
31/12/2013 | 31/12/2012 | 31/12/2011 | |||||||||||
| Revenue from operating activities |
(21) | 78,599,391 | 89,499,575 | 77,456,904 | ||||||||||
| Other revenue and income |
(22) | 1,813,681 | 2,089,834 | 1,672,182 | ||||||||||
| Change in inventories or finished goods and work in progress |
-3,729,115 | -939,667 | 678,906 | |||||||||||
| Increase in non-current assets due to capitalisation of internal costs |
(23) | 2,028,908 | 2,288,470 | 2,123,202 | ||||||||||
| Cost of raw material |
(24) | -39,324,976 | -46,406,557 | -38,953,219 | ||||||||||
| Services |
(25) | -12,862,803 | -18,570,751 | -18,812,548 | ||||||||||
| Personnel |
(26) | -17,921,205 | -16,497,431 | -16,061,409 | ||||||||||
| Other operating expenses |
(27) | -2,532,914 | -2,799,310 | -2,718,078 | ||||||||||
| Depreciation and amortisation |
(28) | -3,048,540 | -3,505,865 | -3,429,054 | ||||||||||
| Impairment of goodwill and development costs |
(28) | -18,057,240 | 0 | 0 | ||||||||||
| Provisions |
(29) | -1,567,575 | -1,120,276 | -1,626,687 | ||||||||||
|
|
|
|
|
|
|
|||||||||
| Operating profit /(loss) |
-16,602,388 | 4,038,022 | 330,199 | |||||||||||
|
|
|
|
|
|
|
|||||||||
| Financial income and exchange gains |
(30) | 1,724,164 | 1,171,385 | 741,674 | ||||||||||
| Financial expenses and exchange losses |
(30) | -6,634,041 | -8,203,773 | -7,290,800 | ||||||||||
|
|
|
|
|
|
|
|||||||||
| Loss before taxation |
-21,512,265 | -2,994,366 | -6,218,927 | |||||||||||
|
|
|
|
|
|
|
|||||||||
| Taxes on income |
(31) | -980,858 | -526,165 | 319,986 | ||||||||||
|
|
|
|
|
|
|
|||||||||
| Net Loss from contiunuing operations |
-22,493,123 | -3,520,531 | -5,898,941 | |||||||||||
|
|
|
|
|
|
|
|||||||||
| Profit (Loss) from discontinued operations |
(32) | -14,467,773 | 931,037 | 312,388 | ||||||||||
|
|
|
|
|
|
|
|||||||||
| Net Loss for the period |
-36,960,896 | -2,589,494 | -5,586,553 | |||||||||||
|
|
|
|
|
|
|
|||||||||
| Profit (Loss) attributable to non-controlling interests |
29,961 | -31,573 | -18,925 | |||||||||||
|
|
|
|
|
|
|
|||||||||
| Net Loss attributable to the Group |
-36,990,857 | -2,557,921 | -5,567,628 | |||||||||||
|
|
|
|
|
|
|
|||||||||
PM GROUP
5
Consolidated statement of comprehensive income
| (in Euro) |
31/12/2013 | 31/12/2012 | 31/12/2011 | |||||||||
| Net Loss for the period (A) |
(36,960,896 | ) | (2,589,494 | ) | (5,586,553 | ) | ||||||
|
|
|
|
|
|
|
|||||||
| Gains/(losses) from translation into Euro of financial statements of foreign entities |
168,800 | (116,578 | ) | (70,398 | ) | |||||||
|
|
|
|
|
|
|
|||||||
| Total other items of comprehensive income that will be recycled through the income statement, net of tax effect (b1) |
168,800 | (116,578 | ) | (70,398 | ) | |||||||
|
|
|
|
|
|
|
|||||||
| Actuarial gains/(losses) from defined benefit plans |
(17,435 | ) | 0 | 0 | ||||||||
|
|
|
|
|
|
|
|||||||
| Total other items of comprehensive income that will not subsequently be recycled through the income statement, net of tax effect (b2) |
(17,435 | ) | 0 | 0 | ||||||||
|
|
|
|
|
|
|
|||||||
| Total other items of comprehensive income, net of tax effect (b1) + (b2) = (B) |
151,365 | (116,578 | ) | (70,398 | ) | |||||||
|
|
|
|
|
|
|
|||||||
| Total comprehensive (loss) for the period (A)+(B) |
(36,809,531 | ) | (2,706,072 | ) | (5,656,951 | ) | ||||||
|
|
|
|
|
|
|
|||||||
| Total comprehensive income (loss) attributable to non-controlling interests |
29,961 | (35,884 | ) | (21,675 | ) | |||||||
|
|
|
|
|
|
|
|||||||
| TOTAL COMPREHENSIVE (LOSS) ATTRIBUTABLE TO THE GROUP |
(36,839,492 | ) | (2,670,188 | ) | (5,635,276 | ) | ||||||
|
|
|
|
|
|
|
|||||||
PM GROUP
6
Consolidated Statement of changes in equity
| (in Euro) |
Share capital |
Reserve for additional paid-in capital |
Translation reserve |
Reserve under IAS 19 |
Total reserves |
Accumulated Deficit |
Shareholders’ equity - Group |
Capital and reserves of non- controlling interests |
Profit/ (Loss) attributable to non- controlling interests |
Shareholders’ equity of non- controlling interests |
TOTAL SHAREHOLDERS’ EQUITY |
|||||||||||||||||||||||||||||||||
| Shareholders’ equity at 1/1/2011 |
17,811,420 | 3,281,863 | (5,774 | ) | 3,276,089 | (4,234,459 | ) | 16,853,050 | 990,265 | (6,456 | ) | 983,809 | 17,836,859 | |||||||||||||||||||||||||||||||
| Share capital increase |
5,500,000 | (3,281,863 | ) | (3,281,863 | ) | 2,218,137 | 2,218,137 | |||||||||||||||||||||||||||||||||||||
| Movement on translation reserve |
(67,648 | ) | (67,648 | ) | (67,648 | ) | (2,750 | ) | (2,750 | ) | (70,398 | ) | ||||||||||||||||||||||||||||||||
| Loss for year ended December 31, 2011 |
0 | (5,567,628 | ) | (5,567,628 | ) | (18,925 | ) | (18,925 | ) | (5,586,553 | ) | |||||||||||||||||||||||||||||||||
|
|
|
|
|
|
|
|
|
|
|
|
|
|
|
|
|
|
|
|
|
|
|
|||||||||||||||||||||||
| Shareholders’ equity at 31/12/2011 |
23,311,420 | 0 | (73,422 | ) | 0 | (73,422 | ) | (9,802,087 | ) | 13,435,911 | 987,515 | (25,381 | ) | 962,134 | 14,398,045 | |||||||||||||||||||||||||||||
|
|
|
|
|
|
|
|
|
|
|
|
|
|
|
|
|
|
|
|
|
|
|
|||||||||||||||||||||||
| Movement on translation reserve |
(112,267 | ) | (112,267 | ) | (112,267 | ) | (4,311 | ) | (4,311 | ) | (116,578 | ) | ||||||||||||||||||||||||||||||||
| Loss for year ended December 31, 2012 |
0 | (2,557,921 | ) | (2,557,921 | ) | (31,573 | ) | (31,573 | ) | (2,589,494 | ) | |||||||||||||||||||||||||||||||||
|
|
|
|
|
|
|
|
|
|
|
|
|
|
|
|
|
|
|
|
|
|
|
|||||||||||||||||||||||
| Shareholders’ equity at 31/12/2012 |
23,311,420 | 0 | (185,689 | ) | 0 | (185,689 | ) | (12,360,008 | ) | 10,765,723 | 983,204 | (56,954 | ) | 926,250 | 11,691,973 | |||||||||||||||||||||||||||||
|
|
|
|
|
|
|
|
|
|
|
|
|
|
|
|
|
|
|
|
|
|
|
|||||||||||||||||||||||
| Movement on translation reserve |
168,800 | 168,800 | 168,800 | 0 | 168,800 | |||||||||||||||||||||||||||||||||||||||
| Movement on IAS 19 reserve |
(17,435 | ) | (17,435 | ) | (17,435 | ) | 0 | (17,435 | ) | |||||||||||||||||||||||||||||||||||
| Effect of Acquisition of 41% of Air Service |
0 | 0 | (13,494 | ) | (13,494 | ) | (13,494 | ) | ||||||||||||||||||||||||||||||||||||
| Effect of share capital increase PM Argentina |
0 | 7,000 | 7,000 | (7,000 | ) | (7,000 | ) | 0 | ||||||||||||||||||||||||||||||||||||
| Other movements |
0 | 44,231 | 44,231 | 0 | 44,231 | |||||||||||||||||||||||||||||||||||||||
| Profit (Loss) for year ended December 31, 2013 |
0 | (36,990,857 | ) | (36,990,857 | ) | 29,961 | 29,961 | (36,960,896 | ) | |||||||||||||||||||||||||||||||||||
|
|
|
|
|
|
|
|
|
|
|
|
|
|
|
|
|
|
|
|
|
|
|
|||||||||||||||||||||||
| Shareholders’ equity at 31/12/2013 |
23,311,420 | 0 | (16,889 | ) | (17,435 | ) | (34,324 | ) | (49,299,634 | ) | (26,022,538 | ) | 962,710 | (26,993 | ) | 935,717 | (25,086,821 | ) | ||||||||||||||||||||||||||
|
|
|
|
|
|
|
|
|
|
|
|
|
|
|
|
|
|
|
|
|
|
|
|||||||||||||||||||||||
PM GROUP
7
Consolidated Statement of cash flows
| (in Euro) |
2013 | 2012 | 2011 | |||||||||
| Cash flows generated by operating activities |
||||||||||||
| Net Loss for the period |
(36,960,896 | ) | (2,589,494 | ) | (5,586,553 | ) | ||||||
| Adjustments made in order to reconciile net loss with the cash flows generated by operating activities |
||||||||||||
| - Depreciation and amortization |
4,260,362 | 4,736,000 | 4,609,807 | |||||||||
| - Impairment |
31,161,078 | 0 | 0 | |||||||||
| - Deferred tax/Deferred tax income |
1,358,668 | (517,350 | ) | (505,299 | ) | |||||||
| - Income and expenses on derivatives |
(891,250 | ) | 699,108 | 856,722 | ||||||||
| - Financial income recognized in Statement of Income |
(832,914 | ) | (1,171,385 | ) | (741,674 | ) | ||||||
| - Finance costs recognised in Statement of Income |
6,634,041 | 7,504,665 | 6,434,078 | |||||||||
| - Change in Employee Severance Indemnity Provision and other employee benefits |
(147,157 | ) | 156,835 | (196,349 | ) | |||||||
| Operating profit before changes in working capital |
4,581,932 | 8,818,379 | 4,870,732 | |||||||||
| Effect of changes in assets and liabilities in net working capital |
||||||||||||
| - Trade receivables |
(13,403,851 | ) | 1,544,207 | (1,759,298 | ) | |||||||
| - Inventory |
4,540,514 | 8,734,411 | (8,883,337 | ) | ||||||||
| - Other current assets |
(197,938 | ) | 472,449 | (669,455 | ) | |||||||
| - Trade payables |
7,271,301 | (8,480,233 | ) | 7,449,004 | ||||||||
| - Other current liabilities |
775,744 | (6,530,114 | ) | 5,474,122 | ||||||||
| - Tax receivables |
(624,357 | ) | (251,491 | ) | (252,590 | ) | ||||||
| - Tax payables |
213,148 | 1,532,111 | 217,617 | |||||||||
| - Taxes paid during the period |
(430,618 | ) | (561,151 | ) | (247,717 | ) | ||||||
| - Other non current assets |
16,488 | (27,751 | ) | 4,406 | ||||||||
| - Provisions for risks and charges |
1,743,204 | 82,669 | (143,290 | ) | ||||||||
|
|
|
|
|
|
|
|||||||
| Cash generated by operating activities (A) |
4,485,567 | 5,333,486 | 6,060,194 | |||||||||
|
|
|
|
|
|
|
|||||||
| Cash flows generated (absorbed) by investing activities |
||||||||||||
| - Payments for property, plant and equipment |
(1,046,042 | ) | (1,625,351 | ) | (1,355,838 | ) | ||||||
| - Proceeds from disposal of property, plant and equipment |
184,603 | 205,710 | 193,468 | |||||||||
| - Payments for intangible assets |
(2,716,892 | ) | (2,758,025 | ) | (2,403,850 | ) | ||||||
| - Interest received |
3,948 | 11,059 | 54,083 | |||||||||
| - Proceeds on sale of financial assets |
413 | 0 | 0 | |||||||||
|
|
|
|
|
|
|
|||||||
| Change in cash absorbed by investing activities (B) |
(3,573,971 | ) | (4,166,607 | ) | (3,512,137 | ) | ||||||
|
|
|
|
|
|
|
|||||||
| Cash flows generated by operating activities after cash flows absorbed by investing activities (A-B) |
911,596 | 1,166,879 | 2,548,057 | |||||||||
|
|
|
|
|
|
|
|||||||
| Cash flows (absorbed) generated by financing activities |
||||||||||||
| Short term financial payables and derivatives arranged (repaid) |
2,778,715 | 3,761,876 | 1,673,646 | |||||||||
| Medium/long term financial payables and derivatives arranged (repaid) |
1,419,965 | (3,160,896 | ) | (1,621,996 | ) | |||||||
| Interest paid |
(5,237,304 | ) | (5,870,815 | ) | (4,391,006 | ) | ||||||
| Share capital increase and reserves paid in cash |
30,737 | 0 | 2,218,137 | |||||||||
|
|
|
|
|
|
|
|||||||
| Change in cash absorbed by financing activities |
(1,007,887 | ) | (5,269,835 | ) | (2,121,219 | ) | ||||||
|
|
|
|
|
|
|
|||||||
| Movement on translation reserve |
168,800 | (116,578 | ) | (70,398 | ) | |||||||
| Reclassification of assets held for sale |
(69,668 | ) | 0 | 0 | ||||||||
| Increase (decrease) in cash and cash equivalents |
2,842 | (4,219,534 | ) | 356,440 | ||||||||
|
|
|
|
|
|
|
|||||||
| Cash and cash equivalents at start of period |
2,217,357 | 6,436,891 | 6,080,451 | |||||||||
|
|
|
|
|
|
|
|||||||
| Cash and cash equivalents at end of period |
2,220,199 | 2,217,357 | 6,436,891 | |||||||||
|
|
|
|
|
|
|
|||||||
PM GROUP
8
EXPLANATORY NOTES
General information
PM Group S.p.A. (the “Parent Company” or “Company” or “PM”) is a company which is subject to the laws of the Italian Republic. PM Group S.p.A. and its subsidiaries (“PM Group” or “Group”) operate primarily in Italy, France, Spain, Chile, Romania, Argentina and the United States of America. The Group manufactures: (i) truck mounted hydraulic knuckle boom cranes (“Business Unit PM”), (ii) truck mounted aerial platforms (“Business Unit Oil & Steel”) and (iii) production, sale and rental of building structure, like scaffolding, formworks for walls and slabs (“Business Unit Pilosio”).
Structure and content of the consolidated financial statements
The group consolidated financial statements to which these explanatory notes relate (hereinafter: the “Group Consolidated Financial Statements”) include: (i) the statements of income, comprehensive income, changes in equity and cash flows for the years ended December 31, 2011, 2012 and 2013 and (ii) the statements of financial position as of December 31, 2012 and 2013. The Group Consolidated Financial Statements have been drawn up in accordance with the International Financial Reporting Standards (“IFRS”) as issued by the International Accounting Standards Board (“IASB”). The designation “IFRS” also includes all valid International Accounting Standards (“IAS”), as well as all interpretations of the IFRS Interpretation Committee, previously known as the International Financial Reporting Interpretations Committee (“IFRIC”), and before that the Standing Interpretations Committee (“SIC”). The financial statements were authorized and approved on December 1, 2014, by Board of Directors. This basis of preparation was considered best to represent the balance sheet, income statement and financial situation of the Company and the Group:
| • | Statement of financial position prepared with current assets/liabilities classified separately from non-current assets/liabilities; |
| • | Statement of income costs classified based on their nature; |
| • | Statement of cash flows prepared under the indirect method. |
PM GROUP
9
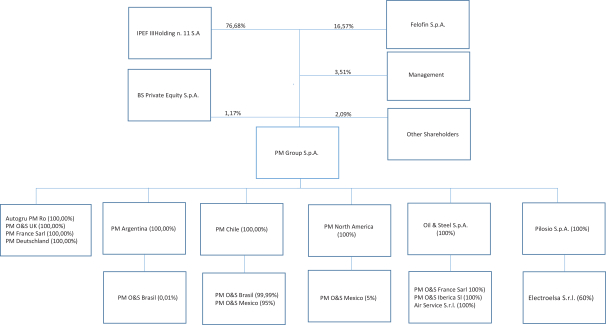
Group organizational structure
The chart below shows the Group’s organizational structure as at December 31, 2013:
Significant Accounting Policies
Basis of preparation
These consolidated financial statements have been prepared in Euro which is the main currency in the countries where the PM Group companies conduct their business.
The amounts reported in the consolidated financial statements are stated in Euro.
The consolidated financial statements have been prepared on the historical cost basis except for certain properties and financial instruments that are measured at revalued amounts or fair values at the end of each reporting period, as explained in the accounting policies below.
Historical cost is generally based on the fair value of the consideration given in exchange for goods and services.
PM GROUP
10
Fair value is the price that would be received to sell an asset or paid to transfer a liability in an orderly transaction between market participants at the measurement date, regardless of whether that price is directly observable or estimated using another valuation technique. In estimating the fair value of an asset or a liability, the Group takes into account the characteristics of the asset or liability if market participants would take those characteristics into account when pricing the asset or liability at the measurement date. Fair value for measurement and/or disclosure purposes in these consolidated financial statements is determined on such a basis, except for share-based payment transactions that are within the scope of IFRS 2, leasing transactions that are within the scope of IAS 17, and measurements that have some similarities to fair value but are not fair value, such as net realisable value in IAS 2 or value in use in IAS 36.
Basis of consolidation
The consolidated financial statements incorporate the financial statements of the Group and entities (including structured entities) controlled by the Company and its subsidiaries. Control is achieved when the Company:
| • | has power over the investee; |
| • | is exposed, or has rights, to variable returns from its involvement with the investee; and |
| • | has the ability to use its power to affect its returns. |
The Company reassesses whether or not it controls an investee if facts and circumstances indicate that there are changes to one or more of the three elements of control listed above.
Consolidation of a subsidiary begins when the Company obtains control over the subsidiary and ceases when the Company loses control of the subsidiary. Specifically, income and expenses of a subsidiary acquired or disposed of during the year are included in the consolidated statement of profit or loss and other comprehensive income from the date the Company gains control until the date when the Company ceases to control the subsidiary.
Profit or loss and each component of other comprehensive income are attributed to the owners of the Company and to the non-controlling interests. Total comprehensive income of subsidiaries is attributed to the owners of the Company and to the non-controlling interests even if this results in the non-controlling interests having a deficit balance.
When necessary, adjustments are made to the financial statements of subsidiaries to bring their accounting policies into line with the Group’s accounting policies.
All intragroup assets and liabilities, equity, income, expenses and cash flows relating to transactions between members of the Group are eliminated in full on consolidation.
Companies which PM Group controls directly or indirectly are consolidated on a line-by-line basis. This involves including all assets and liabilities in their entirety from the date when control was acquired until the date when it ends. Control may be exercised through a direct or indirect holding of a majority of shares with voting rights or through a dominant influence expressed by the power to determine, also indirectly under contractual or legal agreements, the financial and operational decisions of the entity, while obtaining the related benefits, even without any share ownership relationship. The presence of potential voting rights exercisable at the reporting date is considered for the purposes of determining control.
PM GROUP
11
The main consolidation principles adopted when applying the line-by-line consolidation method are as follows:
| - | subsidiaries are consolidated from the date on which control is effectively transferred to the Group and cease to be consolidated from the date on which control is transferred out of the Group; |
| - | if necessary, adjustments are made to the financial statements of subsidiaries in order to bring the accounting principles used into line with those adopted by the Group; |
| - | the assets and liabilities, income and expenses of companies consolidated under the line-by-line method are included in full in the consolidated financial statements. The carrying amount of the investments is eliminated against the corresponding portion of equity of the consolidated companies while attributing to each asset and liability item its fair value at the date of acquisition of control (acquisition method as defined by IFRS 3 “Business combinations”). Any residual positive difference is recorded under “Goodwill” while any residual negative difference is recorded in the income statement. |
| - | Receivable and payable, revenue and cost balances between consolidated companies and the effects of all significant transactions between them are eliminated; |
| - | The portions of shareholders’ equity and the net profit/loss for the period attributable to non-controlling interests are disclosed separately under shareholders’ equity and in the consolidated income statement; |
| - | Subsidiaries consolidated on a line-by-line basis but held for sale are classified in accordance with IFRS 5. Therefore, once consolidated on a line-by-line basis, the related assets are classified under a single caption “Assets held for sale”, the liabilities are classified under a single caption “Liabilities held for sale” and the result for the period is classified in the income statement under a single caption “Profit or loss from discontinued operations” |
Foreign currencies
In preparing the financial statements of each individual group entity, transactions in currencies other than the entity’s functional currency (foreign currencies) are recognised at the rates of exchange prevailing at the dates of the transactions. At the end of each reporting period, monetary items denominated in foreign currencies are retranslated at the rates prevailing at that date. Non-monetary items carried at fair value that are denominated in foreign currencies are retranslated at the rates prevailing at the date when the fair value was determined. Non-monetary items that are measured in terms of historical cost in a foreign currency are not retranslated.
Exchange differences on monetary items are recognised in profit or loss in the period in which they arise.
For the purposes of presenting these consolidated financial statements, the assets and liabilities of the Group’s foreign operations are translated into Euros using exchange rates prevailing at the end of each reporting period. Income and expense items are translated at the average exchange rates for the period, unless exchange rates fluctuate significantly during that period, in which case the exchange rates at the dates of the transactions are used. Exchange differences arising, if any, are recognised in other comprehensive income and accumulated in equity (and attributed to non-controlling interests as appropriate).
On the disposal of a foreign operation (i.e. a disposal of the Group’s entire interest in a foreign operation, or a disposal involving loss of control over a subsidiary that includes a foreign operation, or a partial disposal of an interest in a joint arrangement or an associate that includes a foreign operation of which the retained interest becomes a financial asset), all of the exchange differences accumulated in equity in respect of that operation attributable to the owners of the Company are reclassified to profit or loss.
In addition, in relation to a partial disposal of a subsidiary that includes a foreign operation that does not result in the Group losing control over the subsidiary, the proportionate share of accumulated exchange
PM GROUP
12
differences are re-attributed to non-controlling interests and are not recognised in profit or loss. For all other partial disposals (i.e. partial disposals of associates or joint arrangements that do not result in the Group losing significant influence or joint control), the proportionate share of the accumulated exchange differences is reclassified to profit or loss.
Goodwill and fair value adjustments to identifiable assets acquired and liabilities assumed through acquisition of a foreign operation are treated as assets and liabilities of the foreign operation and translated at the rate of exchange prevailing at the end of each reporting period. Exchange differences arising are recognised in other comprehensive income.
Financial statements expressed in currencies other than the Euro are translated into Euro applying the rules indicated above. The exchange rates applied for 2013 are shown below:
| 2011 |
||||||||
| Currency |
Closing | Average | ||||||
| US Dollar |
1.29 | 1.39 | ||||||
| Romanian Lei |
4.32 | 4.24 | ||||||
| GB Pound |
0.84 | 0.87 | ||||||
| Chilean Peso |
672.00 | 672.47 | ||||||
| Argentinean Peso |
5.57 | 5.74 | ||||||
| 2012 |
||||||||
| Currency |
Closing | Average | ||||||
| US Dollar |
1.32 | 1.29 | ||||||
| Romanian Lei |
4.44 | 4.46 | ||||||
| GB Pound |
0.82 | 0.81 | ||||||
| Chilean Peso |
631.73 | 625.07 | ||||||
| Argentinean Peso |
6.49 | 5.85 | ||||||
| 2013 |
||||||||
| Currency |
Closing | Average | ||||||
| US Dollar |
1.38 | 1.33 | ||||||
| Romanian Lei |
4.47 | 4.42 | ||||||
| GB Pound |
0.83 | 0.85 | ||||||
| Chilean Peso |
724.77 | 658.27 | ||||||
| Argentinean Peso |
8.99 | 7.28 | ||||||
| Brazilian Real |
3.26 | 2.87 | ||||||
| Mexican Peso |
18.07 | 16.96 | ||||||
The separate financial statements which have been consolidated have a December 31 reporting date i.e. the same as the consolidated financial statements and are those specifically prepared and approved by the Boards of Directors of the individual companies, as adjusted, where necessary, to bring them into line with the accounting principles of the holding company.
A full list of the investments included in the scope of consolidation at December 31, 2013 with details of shareholders’ equity and profit/loss for the period calculated in accordance with the applicable accounting standards (some subsidiaries prepared their separate financial statements at December 31, 2013 in accordance with Italian or foreign statutory reporting principles but prepared consolidated reporting packages for the PM consolidation process in accordance with IFRS) is shown in the following table:
PM GROUP
13
Consolidated companies:
| Name |
Location |
Country |
Share Capital (local currency/000) |
Shareholders’ equity (Euro/000) |
Including profit (loss) for 2013 (Euro/000) |
% interest held |
||||||||||||
| 1 |
PM Group | San Cesario sul Panaro | Italy | EUR | 23,311 | (26,478) | (40,371) | |||||||||||
| 2 |
Autogru PM RO | Arad | Romania | RON | 8,482 | 2,163 | 1 | 100.00 | % | |||||||||
| 3 |
PM North America | Rolling Meadows, Ill | USA | USD | 25 | 104 | 1 | 100.00 | % | |||||||||
| 4 |
PM France | Chassieu | France | EUR | 150 | (368) | (6) | 100.00 | % | |||||||||
| 5 |
PM Argentina | Buenos Aires | Argentina | ARS | 60 | 252 | (1,072) | 100.00 | % | |||||||||
| 6 |
PM Deutschland | Ulm | Germany | EUR | 25 | 32 | 2 | 100.00 | % | |||||||||
| 7 |
PM Chile | Santiago | Chile | CLP | 19,742 | (149) | (385) | 100.00 | % | |||||||||
| 8 |
Oil & Steel | San Cesario sul Panaro | Italy | EUR | 362 | (5,611) | (8,112) | 100.00 | % | |||||||||
| 9 |
PM Oil & Steel UK | London | UK | GBP | 300 | (10) | 0 | 100.00 | % | |||||||||
| 10 |
PM Oil & Steel France | Chassieu | France | EUR | 35 | (137) | (126) | 100.00 | % | |||||||||
| 11 |
PM Oil & Steel Iberica | Valencia | Spain | EUR | 200 | 103 | (102) | 100.00 | % | |||||||||
| 12 |
Air Service | Modena | Italy | EUR | 115 | 77 | (38) | 100.00 | % | |||||||||
| 13 |
Pilosio | Feletto Umberto | Italy | EUR | 5,000 | 1,186 | (8,485) | 100.00 | % | |||||||||
| 14 |
Electroelsa | Poggibonsi | Italy | EUR | 400 | 2,216 | 61 | 60.00 | % | |||||||||
| 15 |
PM Oil & Steel do Brasil | Sao Paulo | Brazil | BRL | 600 | 177 | (7) | 100.00 | % | |||||||||
| 16 |
PM Oil & Steel Mexico | Mexico City | Mexico | MXN | 350 | 14 | (5) | 100.00 | % | |||||||||
All Group companies are consolidated on a line-by-line basis.
At December 31, 2013, changes to the scope of consolidation or to the percentage interests held in subsidiaries compared to December 31, 2012 were as follows.
| - | PM Argentina: following a share issue (Euro 1,000 thousand) wholly subscribed by PM Group, the percentage interest held by PM Group increased from 95% to 100 % |
| - | PM Oil & Steel was incorporated on January 31, 2013 and is owned by PM Chile (99.99%) and PM Argentina (0.01%) |
| - | PM Oil & Steel Mexico was incorporated on November 13, 2013 and is owned by PM Chile (95%) and PM North America (5%) |
These changes did not have any significant effect on the 2013 consolidated financial statements.
Going Concern
In the year ended December 31, 2013, the Group incurred losses totaling Euro 36,991 thousand which reduced its shareholders’ equity to Euro (26,023) thousand. The losses were primarily due to impairment charges recognized on goodwill and development cost assets as described in more detail in note 2. At December 31, 2013, financial payables amounted to Euro 101,300 thousand compared to Euro 95,826 at December 31, 2012, excluding the financial payables of the Pilosio S.p.A (“Pilosio BU”). As a consequence of the financial results, the Group was not in compliance with covenants set out in the loan agreements as of December 31, 2013. The Group failed to make principal repayments due on certain loans payable outstanding at December 31, 2013, and starting in July 2013 failed to make payments on interest accruing on the senior loan payable. This resulted in the Group defaulting on its loans payable to the creditor banks totaling Euro 78,921 thousand at December 31, 2013. Consequently, the balance in default has been reclassified to current financial payables in the consolidated financial statements.
In 2014, management finalized an operation (“the Operation”) intended to restructure the financial indebtedness of the Group and restore the equity level. The Operation was to be implemented in accordance with Article 182 bis of the Bankruptcy Act. When the new business plan was being finalized, two entities - Manitex International Inc. (“Manitex” or “the Investor”) and Columna Holdings Limited (the company wholly controlling the parent company of PM Group - “Columna”) submitted to the Company and the creditor banks certain proposals to invest in the Company and its subsidiary Pilosio S.p.A. Following the negotiations between Manitex, Columna and the creditor banks, the Operation was finalized on July 2014.
PM GROUP
14
The main terms of the Operation are as follows:
| • | Increase the net equity of the PM Group by Euro 44.5 million through a capital contribution of Euro 12 million cash and the acquisition of Euro 32.5 million of outstanding principal loans payable balance from the credit banks by Manitex. Subsequent to the capital contribution, Manitex will own 100% of the shares of PM Group; |
| • | Modification of the repayment terms of the remaining outstanding principal balance of approximately Euro 32.5 million through an extension of the maturity date, and covenants on terms more favorable to Group.; |
| • | Restructuring the financial position of Oil & Steel S.p.A (“Oil & Steel) through PM Group’s purchase of Oil & Steel’s loans payable balance from the creditor banks totaling approximately Euro 6,077 thousand at a purchase price corresponding to 15% of the outstanding balance. This amount foregone by the creditor banks would lead to a further reduction of the Group’s outstanding loans payable by approximately Euro 5.1 million; |
| • | A further purchase of Euro 5,000 thousand of the outstanding loan payable through a put and call option agreement between Manitex and the creditor bank. The agreement will be settled based on a purchase price to be determined from the consolidated financial statements of the PM Group at December 31, 2017; |
| • | Additional loan of Euro 1,500 thousand granted by existing creditor banks to Oil & Steel S.p.A.; |
| • | Repayment of a portion of the loans payable balance totaling Euro 5,250 thousand by PM Group when the Debt Restructuring Agreement becomes effective; |
| • | The sale of Pilosio for a price of Euro 1,000 to a company owned by Columna, and therefore associated company of the current majority shareholder of PM group, and therefore, a related party. |
The above terms have been included in Commitment Letters signed by Columna and Manitex respectively on July 16, 2014 and July 17, 2014 as well as in the PM Group and Oil & Steel Debt Restructuring Agreement signed by the creditor banks in July 2014. Both the Commitment Letters and the PM Group and Oil & Steel Debt Restructuring Agreement (collectively the “Agreement”) are subject to certain conditions, the most significant of which is the definitive approval by the competent Courts of the Agreement with respect to Article 182 bis of the Bankruptcy Act, signed by PM Group, Oil & Steel and the creditor banks. On November 18, 2014, the Courts in Modena have approved the Agreement.
In view of the expected impact of the Operation and taking into account the difficult conditions in some of its main markets, the Group has prepared a new Business Plan for the period 2014 – 2017 which was approved by the holding company Board of Directors on June 10, 2014. Both the new business plan and the Operation provide that, before Manitex is offered the option to subscribe to the share capital increase, the current shareholders must be offered the chance to subscribe a share capital increase also for Euro 44,500 thousand.
Regardless of whether the share capital increase is subscribed to by the current shareholders or by Manitex, the new Business Plan forecasts sufficient cash flows to meet the Group’s remaining obligations following the completion of the Operation.
The situation outlined above - specifically: i) the Group’s current negative shareholders’ equity and precarious financial situation; ii) issues and uncertainty regarding the economic environment; iii) the resulting uncertainty which inevitably affects the forecasts reflected in the Business Plan in relation to the Group’s future operating performance (in terms of both revenue and profitability); iv) the fact that the Operation has not yet been completed – confirms the existence of uncertainty that could cast doubts over the Group’s ability to continue to operate as a going concern. Nonetheless, after evaluating the uncertainties described above, given the state of progress of the Operation and the fact that the Courts in Modena have approved the Agreement in terms of Article 182 bis of the Bankruptcy Act signed by PM Group, Oil & Steel and the
PM GROUP
15
creditor banks, management considers it probable that the Operation will have a positive outcome in the near future and, consequently, that the Group’s economics and financial situation will be improved. For these reasons, management reasonably believes that the Group has sufficient resources to continue to operate in the near future and have, therefore, prepared these consolidated financial statements on a going concern basis.
Note that failure to complete the Operation would undermine the going concern assumption and require the Group to follow the procedures provided for by law when dealing with business failure. This would result in changes to the valuation criteria applied to a number of assets and liabilities, in particular to tangible and intangible assets and deferred tax assets, which ultimately could result in significant writedowns.
Changes in the Group’s ownership interests in existing subsidiaries
Changes in the Group’s ownership interests in subsidiaries that do not result in the Group losing control over the subsidiaries are accounted for as equity transactions. The carrying amounts of the Group’s interests and the non-controlling interests are adjusted to reflect the changes in their relative interests in the subsidiaries. Any difference between the amount by which the non-controlling interests are adjusted and the fair value of the consideration paid or received is recognised directly in equity and attributed to owners of the Company.
When the Group loses control of a subsidiary, a gain or loss is recognised in profit or loss and is calculated as the difference between (i) the aggregate of the fair value of the consideration received and the fair value of any retained interest and (ii) the previous carrying amount of the assets (including goodwill), and liabilities of the subsidiary and any non-controlling interests. All amounts previously recognised in other comprehensive income in relation to that subsidiary are accounted for as if the Group had directly disposed of the related assets or liabilities of the subsidiary (i.e. reclassified to profit or loss or transferred to another category of equity as specified/permitted by applicable IFRSs). The fair value of any investment retained in the former subsidiary at the date when control is lost is regarded as the fair value on initial recognition for subsequent accounting under IAS 39, when applicable, the cost on initial recognition of an investment in an associate or a joint venture.
Business combinations
Acquisitions of businesses are accounted for using the acquisition method. The consideration transferred in a business combination is measured at fair value, which is calculated as the sum of the acquisition-date fair values of the assets transferred by the Group, liabilities incurred by the Group to the former owners of the acquiree and the equity interests issued by the Group in exchange for control of the acquiree. Acquisition-related costs are generally recognised in profit or loss as incurred.
At the acquisition date, the identifiable assets acquired and the liabilities assumed are recognised at their fair value, except that:
| • | deferred tax assets or liabilities, and assets or liabilities related to employee benefit arrangements are recognised and measured in accordance with IAS 12 Income Taxes and IAS 19 respectively; |
| • | assets (or disposal groups) that are classified as held for sale in accordance with IFRS 5 Non-current Assets Held for Sale and Discontinued Operations are measured in accordance with that Standard. |
Goodwill is measured as the excess of the sum of the consideration transferred, the amount of any non-controlling interests in the acquiree, and the fair value of the acquirer’s previously held equity interest in the acquiree (if any) over the net of the acquisition-date amounts of the identifiable assets acquired and the liabilities assumed. If, after reassessment, the net of the acquisition-date amounts of the identifiable assets acquired and liabilities assumed exceeds the sum of the consideration transferred, the amount of any non-controlling interests in the acquiree and the fair value of the acquirer’s previously held interest in the acquiree (if any), the excess is recognised immediately in profit or loss as a bargain purchase gain.
PM GROUP
16
Non-controlling interests that are present ownership interests and entitle their holders to a proportionate share of the entity’s net assets in the event of liquidation may be initially measured either at fair value or at the non-controlling interests’ proportionate share of the recognised amounts of the acquiree’s identifiable net assets. The choice of measurement basis is made on a transaction-by-transaction basis. Other types of non-controlling interests are measured at fair value or, when applicable, on the basis specified in another IFRS.
When the consideration transferred by the Group in a business combination includes assets or liabilities resulting from a contingent consideration arrangement, the contingent consideration is measured at its acquisition-date fair value and included as part of the consideration transferred in a business combination. Changes in the fair value of the contingent consideration that qualify as measurement period adjustments are adjusted retrospectively, with corresponding adjustments against goodwill. Measurement period adjustments are adjustments that arise from additional information obtained during the ‘measurement period’ (which cannot exceed one year from the acquisition date) about facts and circumstances that existed at the acquisition date.
The subsequent accounting for changes in the fair value of the contingent consideration that do not qualify as measurement period adjustments depends on how the contingent consideration is classified. Contingent consideration that is classified as equity is not remeasured at subsequent reporting dates and its subsequent settlement is accounted for within equity. Contingent consideration that is classified as an asset or a liability is remeasured at subsequent reporting dates in accordance with IAS 39, or IAS 37 Provisions, Contingent Liabilities and Contingent Assets, as appropriate, with the corresponding gain or loss being recognised in profit or loss.
When a business combination is achieved in stages, the Group’s previously held equity interest in the acquiree is remeasured to its acquisition-date fair value and the resulting gain or loss, if any, is recognised in profit or loss. Amounts arising from interests in the acquiree prior to the acquisition date that have previously been recognised in other comprehensive income are reclassified to profit or loss where such treatment would be appropriate if that interest were disposed of.
If the initial accounting for a business combination is incomplete by the end of the reporting period in which the combination occurs, the Group reports provisional amounts for the items for which the accounting is incomplete. Those provisional amounts are adjusted during the measurement period (see above), or additional assets or liabilities are recognised, to reflect new information obtained about facts and circumstances that existed at the acquisition date that, if known, would have affected the amounts recognised at that date.
Goodwill
Goodwill arising on an acquisition of a business is carried at cost as established at the date of acquisition of the business (see note above) less accumulated impairment losses, if any.
For the purposes of impairment testing, goodwill is allocated to each of the Group’s cash-generating units (or groups of cash-generating units) that is expected to benefit from the synergies of the combination.
A cash-generating unit to which goodwill has been allocated is tested for impairment annually, or more frequently when there is an indication that the unit may be impaired. If the recoverable amount of the cash-generating unit is less than its carrying amount, the impairment loss is allocated first to reduce the carrying amount of any goodwill allocated to the unit and then to the other assets of the unit pro rata based on the carrying amount of each asset in the unit. Any impairment loss for goodwill is recognised directly in profit or loss. An impairment loss recognised for goodwill is not reversed in subsequent periods.
PM GROUP
17
On disposal of the relevant cash-generating unit, the attributable amount of goodwill is included in the determination of the profit or loss on disposal.
Non-current assets held for sale
Non-current assets and disposal groups are classified as held for sale if their carrying amount will be recovered principally through a sale transaction rather than through continuing use. This condition is regarded as met only when the asset (or disposal group) is available for immediate sale in its present condition subject only to terms that are usual and customary for sales of such asset (or disposal group) and its sale is highly probable. Management must be committed to the sale, which should be expected to qualify for recognition as a completed sale within one year from the date of classification.
When the Group is committed to a sale plan involving loss of control of a subsidiary, all of the assets and liabilities of that subsidiary are classified as held for sale when the criteria described above are met, regardless of whether the Group will retain a non-controlling interest in its former subsidiary after the sale.
Non-current assets (and disposal groups) classified as held for sale are measured at the lower of their previous carrying amount and fair value less costs to sell.
Revenue recognition
Revenue is measured at the fair value of the consideration received or receivable. Revenue is reduced for estimated customer returns, rebates and other similar allowances.
Sale of goods
Revenue from the sale of goods is recognised when the goods are delivered and title has passed, at which time all the following conditions are satisfied:
| • | the Group has transferred to the buyer the significant risks and rewards of ownership of the goods; |
| • | the Group retains neither continuing managerial involvement to the degree usually associated with ownership nor effective control over the goods sold; |
| • | the amount of revenue can be measured reliably; |
| • | it is probable that the economic benefits associated with the transaction will flow to the Group; and |
| • | the costs incurred or to be incurred in respect of the transaction can be measured reliably. |
Rendering of services
Revenue from a contract to provide services is recognised by reference to the stage of completion of the contract. The stage of completion of the contract is determined as follows:
| • | installation fees are recognised by reference to the stage of completion of the installation, determined as the proportion of the total time expected to install that has elapsed at the end of the reporting period; |
PM GROUP
18
| • | servicing fees included in the price of products sold are recognised by reference to the proportion of the total cost of providing the servicing for the product sold; and |
| • | revenue from time and material contracts is recognised at the contractual rates as labour hours and direct expenses are incurred. |
Dividend and interest income
Dividend income from investments is recognised when the shareholder’s right to receive payment has been established (provided that it is probable that the economic benefits will flow to the Group and the amount of income can be measured reliably).
Interest income from a financial asset is recognised when it is probable that the economic benefits will flow to the Group and the amount of income can be measured reliably. Interest income is accrued on a time basis, by reference to the principal outstanding and at the effective interest rate applicable, which is the rate that exactly discounts estimated future cash receipts through the expected life of the financial asset to that asset’s net carrying amount on initial recognition.
Leasing
Leases are classified as finance leases whenever the terms of the lease transfer substantially all the risks and rewards of ownership to the lessee. All other leases are classified as operating leases.
Assets held under finance leases are initially recognised as assets of the Group at their fair value at the inception of the lease or, if lower, at the present value of the minimum lease payments. The corresponding liability to the lessor is included in the consolidated statement of financial position as a finance lease obligation.
Lease payments are apportioned between finance expenses and reduction of the lease obligation so as to achieve a constant rate of interest on the remaining balance of the liability. Finance expenses are recognised immediately in profit or loss, unless they are directly attributable to qualifying assets, in which case they are capitalised in accordance with the Group’s general policy on borrowing costs. Contingent rentals are recognised as expenses in the periods in which they are incurred.
Operating lease payments are recognised as an expense on a straight-line basis over the lease term, except where another systematic basis is more representative of the time pattern in which economic benefits from the leased asset are consumed. Contingent rentals arising under operating leases are recognised as an expense in the period in which they are incurred.
In the event that lease incentives are received to enter into operating leases, such incentives are recognised as a liability. The aggregate benefit of incentives is recognised as a reduction of rental expense on a straight-line basis, except where another systematic basis is more representative of the time pattern in which economic benefits from the leased asset are consumed.
Borrowing costs
Borrowing costs directly attributable to the acquisition, construction or production of qualifying assets, which are assets that necessarily take a substantial period of time to get ready for their intended use or sale, are added to the cost of those assets, until such time as the assets are substantially ready for their intended use or sale.
PM GROUP
19
Investment income earned on the temporary investment of specific borrowings pending their expenditure on qualifying assets is deducted from the borrowing costs eligible for capitalisation.
All other borrowing costs are recognised in profit or loss in the period in which they are incurred.
Retirement benefit costs and termination benefits
Payments to defined contribution retirement benefit plans are recognised as an expense when employees have rendered service entitling them to the contributions.
For defined benefit retirement benefit plans, the cost of providing benefits is determined using the projected unit credit method, with actuarial valuations being carried out at the end of each annual reporting period. Remeasurement, comprising actuarial gains and losses, the effect of the changes to the asset ceiling (if applicable) and the return on plan assets (excluding interest), is reflected immediately in the statement of financial position with a charge or credit recognised in other comprehensive income in the period in which they occur. Remeasurement recognised in other comprehensive income is reflected immediately in retained earnings and will not be reclassified to profit or loss. Past service cost is recognised in profit or loss in the period of a plan amendment. Net interest is calculated by applying the discount rate at the beginning of the period to the net defined benefit liability or asset. Defined benefit costs are categorised as follows:
| • | service cost (including current service cost, past service cost, as well as gains and losses on curtailments and settlements); |
| • | net interest expense or income; and |
| • | remeasurement. |
The Group presents the first two components of defined benefit costs in profit or loss in the line item personel. Curtailment gains and losses are accounted for as past service costs.
The retirement benefit obligation recognised in the consolidated statement of financial position represents the actual deficit or surplus in the Group’s defined benefit plans. Any surplus resulting from this calculation is limited to the present value of any economic benefits available in the form of refunds from the plans or reductions in future contributions to the plans.
A liability for a termination benefit is recognised at the earlier of when the entity can no longer withdraw the offer of the termination benefit and when the entity recognises any related restructuring costs.
Taxation
Income tax expense represents the sum of the tax currently payable and deferred tax.
Current tax
The tax currently payable is based on taxable profit for the year. Taxable profit differs from ‘profit before tax’ as reported in the consolidated statement of income because of items of income or expense that are taxable or deductible in other years and items that are never taxable or deductible. The Group’s current tax is calculated using tax rates that have been enacted or substantively enacted by the end of the reporting period.
PM GROUP
20
Deferred tax
Deferred tax is recognised on temporary differences between the carrying amounts of assets and liabilities in the consolidated financial statements and the corresponding tax bases used in the computation of taxable profit. Deferred tax liabilities are generally recognised for all taxable temporary differences. Deferred tax assets are generally recognised for all deductible temporary differences to the extent that it is probable that taxable profits will be available against which those deductible temporary differences can be utilised. Such deferred tax assets and liabilities are not recognised if the temporary difference arises from the initial recognition (other than in a business combination) of assets and liabilities in a transaction that affects neither the taxable profit nor the accounting profit. In addition, deferred tax liabilities are not recognised if the temporary difference arises from the initial recognition of goodwill.
The carrying amount of deferred tax assets is reviewed at the end of each reporting period and reduced to the extent that it is no longer probable that sufficient taxable profits will be available to allow all or part of the asset to be recovered.
Deferred tax liabilities and assets are measured at the tax rates that are expected to apply in the period in which the liability is settled or the asset realised, based on tax rates (and tax laws) that have been enacted or substantively enacted by the end of the reporting period.
The measurement of deferred tax liabilities and assets reflects the tax consequences that would follow from the manner in which the Group expects, at the end of the reporting period, to recover or settle the carrying amount of its assets and liabilities.
Current and deferred tax for the year
Current and deferred tax are recognised in profit or loss, except when they relate to items that are recognised in other comprehensive income or directly in equity, in which case, the current and deferred tax are also recognised in other comprehensive income or directly in equity respectively. Where current tax or deferred tax arises from the initial accounting for a business combination, the tax effect is included in the accounting for the business combination.
Property, plant and equipment
Tangible assets are stated in the consolidated statement of financial position at acquisition or production cost, less any subsequent accumulated depreciation and subsequent accumulated impairment losses.
Assets under construction are carried at cost, less any recognised impairment loss. Cost includes professional fees and, for qualifying assets, borrowing costs capitalised in accordance with the Group’s accounting policy. Such properties are classified to the appropriate categories of property, plant and equipment when completed and ready for intended use. Depreciation of these assets, on the same basis as other property assets, commences when the assets are ready for their intended use.
Freehold land is not depreciated.
Depreciation is recognised so as to write off the cost or valuation of assets (other than freehold land and properties under construction) less their residual values over their useful lives, using the straight-line method as follows:
| Depreciation rate | ||
| Buildings |
3% | |
| Plant and machinery |
10 – 15.5% | |
| Industrial and commercial equipment |
25% | |
| Other tangible assets |
10 – 25% |
PM GROUP
21
The estimated useful lives, residual values and depreciation method are reviewed at the end of each reporting period, with the effect of any changes in estimate accounted for on a prospective basis.
Assets held under finance leases are depreciated over their expected useful lives on the same basis as owned assets. However, when there is no reasonable certainty that ownership will be obtained by the end of the lease term, assets are depreciated over the shorter of the lease term and their useful lives.
An item of property, plant and equipment is derecognised upon disposal or when no future economic benefits are expected to arise from the continued use of the asset. Any gain or loss arising on the disposal or retirement of an item of property, plant and equipment is determined as the difference between the sales proceeds and the carrying amount of the asset and is recognised in profit or loss.
Intangible assets
Intangible assets acquired separately
Intangible assets with finite useful lives that are acquired separately are carried at cost less accumulated amortisation and accumulated impairment losses. Amortisation is recognised on a straight-line basis over their estimated useful lives, as follows:
| Depreciation rate | ||||
| Development costs |
20 | % | ||
| Patents and intellectual property rights |
20 | % | ||
| Concessions, licenses, trademarks |
20 | % | ||
The estimated useful life and amortisation method are reviewed at the end of each reporting period, with the effect of any changes in estimate being accounted for on a prospective basis. Intangible assets with indefinite useful lives that are acquired separately are carried at cost less accumulated impairment losses.
Internally-generated intangible assets - research and development expenditure
Expenditure on research activities is recognised as an expense in the period in which it is incurred.
An internally-generated intangible asset arising from development (or from the development phase of an internal project) is recognised if, and only if, all of the following have been demonstrated:
| • | the technical feasibility of completing the intangible asset so that it will be available for use or sale; |
| • | the intention to complete the intangible asset and use or sell it; |
| • | the ability to use or sell the intangible asset; |
| • | how the intangible asset will generate probable future economic benefits; |
PM GROUP
22
| • | the availability of adequate technical, financial and other resources to complete the development and to use or sell the intangible asset; and |
| • | the ability to measure reliably the expenditure attributable to the intangible asset during its development. |
The amount initially recognised for internally-generated intangible assets is the sum of the expenditure incurred from the date when the intangible asset first meets the recognition criteria listed above. Where no internally-generated intangible asset can be recognised, development expenditure is recognised in profit or loss in the period in which it is incurred.
Subsequent to initial recognition, internally-generated intangible assets are reported at cost less accumulated amortisation and accumulated impairment losses, on the same basis as intangible assets that are acquired separately.
Derecognition of intangible assets
An intangible asset is derecognised on disposal, or when no future economic benefits are expected from use or disposal. Gains or losses arising from derecognition of an intangible asset, measured as the difference between the net disposal proceeds and the carrying amount of the asset, are recognised in profit or loss when the asset is derecognised.
Impairment of tangible and intangible assets other than goodwill
At the end of each reporting period, the Group reviews the carrying amounts of its tangible and intangible assets to determine whether there is any indication that those assets have suffered an impairment loss. If any such indication exists, the recoverable amount of the asset is estimated in order to determine the extent of the impairment loss (if any). When it is not possible to estimate the recoverable amount of an individual asset, the Group estimates the recoverable amount of the cash-generating unit to which the asset belongs. When a reasonable and consistent basis of allocation can be identified, corporate assets are also allocated to individual cash-generating units, or otherwise they are allocated to the smallest group of cash-generating units for which a reasonable and consistent allocation basis can be identified.
Intangible assets with indefinite useful lives and intangible assets not yet available for use are tested for impairment at least annually, and whenever there is an indication that the asset may be impaired.
Recoverable amount is the higher of fair value less costs to sell and value in use. In assessing value in use, the estimated future cash flows are discounted to their present value using a pre-tax discount rate that reflects current market assessments of the time value of money and the risks specific to the asset for which the estimates of future cash flows have not been adjusted.
If the recoverable amount of an asset (or cash-generating unit) is estimated to be less than its carrying amount, the carrying amount of the asset (or cash-generating unit) is reduced to its recoverable amount. An impairment loss is recognised immediately in profit or loss.
Inventories
Inventories are stated at the lower of cost and net realisable value. Costs of inventories are determined on a first-in-first-out basis. Net realisable value represents the estimated selling price for inventories less all estimated costs of completion and costs necessary to make the sale.
PM GROUP
23
Provisions
Provisions are recognised when the Group has a present obligation (legal or constructive) as a result of a past event, it is probable that the Group will be required to settle the obligation, and a reliable estimate can be made of the amount of the obligation.
The amount recognised as a provision is the best estimate of the consideration required to settle the present obligation at the end of the reporting period, taking into account the risks and uncertainties surrounding the obligation. When a provision is measured using the cash flows estimated to settle the present obligation, its carrying amount is the present value of those cash flows (when the effect of the time value of money is material).
When some or all of the economic benefits required to settle a provision are expected to be recovered from a third party, a receivable is recognised as an asset if it is virtually certain that reimbursement will be received and the amount of the receivable can be measured reliably.
Restructurings
A restructuring provision is recognised when the Group has developed a detailed formal plan for the restructuring and has raised a valid expectation in those affected that it will carry out the restructuring by starting to implement the plan or announcing its main features to those affected by it. The measurement of a restructuring provision includes only the direct expenditures arising from the restructuring, which are those amounts that are both necessarily entailed by the restructuring and not associated with the ongoing activities of the entity.
Warranties
Provisions for the expected cost of warranty obligations under local sale of goods legislation are recognised at the date of sale of the relevant products, at the management’ best estimate of the expenditure required to settle the Group’s obligation.
Financial instruments
Financial assets and financial liabilities are recognised when a group entity becomes a party to the contractual provisions of the instruments.
Financial assets and financial liabilities are initially measured at fair value. Transaction costs that are directly attributable to the acquisition or issue of financial assets and financial liabilities (other than financial assets and financial liabilities at fair value through profit or loss) are added to or deducted from the fair value of the financial assets or financial liabilities, as appropriate, on initial recognition. Transaction costs directly attributable to the acquisition of financial assets or financial liabilities at fair value through profit or loss are recognised immediately in profit or loss.
Financial assets
Financial assets are classified into the following specified categories: financial assets ‘at fair value through profit or loss’ (FVTPL), ‘held-to-maturity’ investments, ‘available-for-sale’ (AFS) financial assets and ‘loans and receivables’.
PM GROUP
24
The classification depends on the nature and purpose of the financial assets and is determined at the time of initial recognition. As of 31 December 2013 and 2012, the Group did not have any “held-to-maturity” investments, AFS financial assets or FVTPL. The Group does not enter into hedge transactions for speculative purposes.
Loans and receivables
Loans and receivables are non-derivative financial assets with fixed or determinable payments that are not quoted in an active market. Loans and receivables (including trade and other receivables, bank balances and cash) are measured at amortised cost using the effective interest method, less any impairment.
Interest income is recognised by applying the effective interest rate, except for short-term receivables when the effect of discounting is immaterial.
Impairment of financial assets
Financial assets are assessed for indicators of impairment at the end of each reporting period. Financial assets are considered to be impaired when there is objective evidence that, as a result of one or more events that occurred after the initial recognition of the financial asset, the estimated future cash flows of the investment have been affected.
For all financial assets, objective evidence of impairment could include:
| • | significant financial difficulty of the issuer or counterparty; or |
| • | breach of contract, such as a default or delinquency in interest or principal payments; or |
| • | it becoming probable that the borrower will enter bankruptcy or financial re-organisation; or |
| • | the disappearance of an active market for that financial asset because of financial difficulties. |
For certain categories of financial assets, such as trade receivables, assets are assessed for impairment on a collective basis even if they were assessed not to be impaired individually. Objective evidence of impairment for a portfolio of receivables could include the Group’s past experience of collecting payments, an increase in the number of delayed payments in the portfolio past the average credit period of 60 days, as well as observable changes in national or local economic conditions that correlate with default on receivables.
For financial assets carried at amortised cost, the amount of the impairment loss recognised is the difference between the asset’s carrying amount and the present value of estimated future cash flows, discounted at the financial asset’s original effective interest rate.
For financial assets that are carried at cost, the amount of the impairment loss is measured as the difference between the asset’s carrying amount and the present value of the estimated future cash flows discounted at the current market rate of return for a similar financial asset. Such impairment loss will not be reversed in subsequent periods.
The carrying amount of the financial asset is reduced by the impairment loss directly for all financial assets with the exception of trade receivables, where the carrying amount is reduced through the use of an
PM GROUP
25
allowance account. When a trade receivable is considered uncollectible, it is written off against the allowance account. Subsequent recoveries of amounts previously written off are credited against the allowance account. Changes in the carrying amount of the allowance account are recognised in profit or loss.
For financial assets measured at amortised cost, if, in a subsequent period, the amount of the impairment loss decreases and the decrease can be related objectively to an event occurring after the impairment was recognised, the previously recognised impairment loss is reversed through profit or loss to the extent that the carrying amount of the investment at the date the impairment is reversed does not exceed what the amortised cost would have been had the impairment not been recognised.
Derecognition of financial assets
The Group derecognises a financial asset when the contractual rights to the cash flows from the asset expire, or when it transfers the financial asset and substantially all the risks and rewards of ownership of the asset to another party. If the Group neither transfers nor retains substantially all the risks and rewards of ownership and continues to control the transferred asset, the Group recognises its retained interest in the asset and an associated liability for amounts it may have to pay. If the Group retains substantially all the risks and rewards of ownership of a transferred financial asset, the Group continues to recognise the financial asset and also recognises a collateralised borrowing for the proceeds received.
On derecognition of a financial asset in its entirety, the difference between the asset’s carrying amount and the sum of the consideration received and receivable and the cumulative gain or loss that had been recognised in other comprehensive income and accumulated in equity is recognised in profit or loss.
On derecognition of a financial asset other than in its entirety (e.g. when the Group retains an option to repurchase part of a transferred asset), the Group allocates the previous carrying amount of the financial asset between the part it continues to recognise under continuing involvement, and the part it no longer recognises on the basis of the relative fair values of those parts on the date of the transfer. The difference between the carrying amount allocated to the part that is no longer recognised and the sum of the consideration received for the part no longer recognised and any cumulative gain or loss allocated to it that had been recognised in other comprehensive income is recognised in profit or loss. A cumulative gain or loss that had been recognised in other comprehensive income is allocated between the part that continues to be recognised and the part that is no longer recognised on the basis of the relative fair values of those parts.
Financial liabilities and equity instruments
Classification as debt or equity
Debt and equity instruments issued by a group entity are classified as either financial liabilities or as equity in accordance with the substance of the contractual arrangements and the definitions of a financial liability and an equity instrument.
Equity instruments
An equity instrument is any contract that evidences a residual interest in the assets of an entity after deducting all of its liabilities. Equity instruments issued by a group entity are recognised at the proceeds received, net of direct issue costs.
Repurchase of the Company’s own equity instruments is recognised and deducted directly in equity. No gain or loss is recognised in profit or loss on the purchase, sale, issue or cancellation of the Company’s own equity instruments.
PM GROUP
26
Financial liabilities
Financial liabilities are classified as either financial liabilities ‘at FVTPL’ or ‘other financial liabilities’.
Financial liabilities at FVTPL
Financial liabilities are classified as at FVTPL when the financial liability is either held for trading or it is designated as at FVTPL.
A financial liability is classified as held for trading if:
| • | it has been incurred principally for the purpose of repurchasing it in the near term; or |
| • | on initial recognition it is part of a portfolio of identified financial instruments that the Group manages together and has a recent actual pattern of short-term profit-taking; or |
| • | it is a derivative that is not designated and effective as a hedging instrument. |
A financial liability other than a financial liability held for trading may be designated as at FVTPL upon initial recognition if:
| • | such designation eliminates or significantly reduces a measurement or recognition inconsistency that would otherwise arise; or |
| • | the financial liability forms part of a group of financial assets or financial liabilities or both, which is managed and its performance is evaluated on a fair value basis, in accordance with the Group’s documented risk management or investment strategy, and information about the grouping is provided internally on that basis; or |
| • | it forms part of a contract containing one or more embedded derivatives, and IAS 39 permits the entire combined contract to be designated as at FVTPL. |
Financial liabilities at FVTPL are stated at fair value, with any gains or losses arising on remeasurement recognised in profit or loss. The net gain or loss recognised in profit or loss incorporates any interest paid on the financial liability and is included in the ‘other gains and losses’ line item. Fair value is determined in the manner described in paragraph “Fair Value measurment”.
Other financial liabilities
Other financial liabilities (including borrowings and trade and other payables) are subsequently measured at amortised cost using the effective interest method.
The effective interest method is a method of calculating the amortised cost of a financial liability and of allocating interest expense over the relevant period. The effective interest rate is the rate that exactly discounts estimated future cash payments (including all fees and points paid or received that form an integral part of the effective interest rate, transaction costs and other premiums or discounts) through the expected life of the financial liability, or (where appropriate) a shorter period, to the net carrying amount on initial recognition.
PM GROUP
27
Financial guarantee contracts
A financial guarantee contract is a contract that requires the issuer to make specified payments to reimburse the holder for a loss it incurs because a specified debtor fails to make payments when due in accordance with the terms of a debt instrument.
Financial guarantee contracts issued by a group entity are initially measured at their fair values and, if not designated as at FVTPL, are subsequently measured at the higher of:
| • | the amount of the obligation under the contract, as determined in accordance with IAS 37; and |
| • | the amount initially recognised less, where appropriate, cumulative amortisation recognised in accordance with the revenue recognition policies. |
Derecognition of financial liabilities
The Group derecognises financial liabilities when, and only when, the Group’s obligations are discharged, cancelled or they expire. The difference between the carrying amount of the financial liability derecognised and the consideration paid and payable is recognised in profit or loss.
Derivative financial instruments
The Group enters into a variety of derivative financial instruments to manage its exposure to interest rate. Further details of derivative financial instruments are disclosed in note 17.
Derivatives are initially recognised at fair value at the date the derivative contracts are entered into and are subsequently remeasured to their fair value at the end of each reporting period. The resulting gain or loss is recognised in profit or loss immediately unless the derivative is designated and effective as a hedging instrument, in which event the timing of the recognition in profit or loss depends on the nature of the hedge relationship.
Embedded derivatives
Derivatives embedded in non-derivative host contracts are treated as separate derivatives when they meet the definition of a derivative, their risks and characteristics are not closely related to those of the host contracts and the contracts are not measured at FVTPL.
Use of estimates
Preparation of financial statements requires Group Management to make estimates and assumptions based on complex and/or subjective judgments. These estimates are based on past experience and assumptions considered reasonable and realistic on the basis of information known at the time of the estimate. The use of such estimates and assumptions has effects on the amount of assets and liabilities, on the determination and disclosure of contingent assets and liabilities at the reporting date and on the amount of revenues and costs in the reporting period. The final amount of the line items in relation to which the estimate and assumptions were made might differ from that reported in the financial statements. This is due to the uncertainty which characterizes the assumptions and conditions based on which the estimates are made.
PM GROUP
28
Estimates are used to record provisions for bad debts, provisions for obsolete and slow moving inventory, depreciation and amortization, impairment of assets, provisions for employee benefits, tax provisions and other provisions. Estimates and assumptions are revised periodically and the effects of any variation are immediately reflected in the financial statements.
At this point, we note that the situation created by the current economic and financial crisis made it necessary to make assumptions regarding future performance and these assumptions are subject to uncertainty. We cannot exclude the possibility that, in the coming year, actual results will be different than those forecast and, therefore, the carrying amount of the related items might have to be adjusted - possibly significantly – though, obviously, the amount of any such adjustments cannot be estimated or foreseen. This applies all the more in light of the uncertainties affecting the going concern assumption, as described in the previous notes.
Main estimates made by Management
We summarize below the key estimates and the main assumptions made by Management when applying the accounting principles and which could have a significant effect on the amounts reported or in relation to which significant adjustments to the reported amount of assets and liabilities could emerge in the reporting period after the one to which the consolidated financial statements relate.
| • | Non-current assets: non-current assets include intangible assets (including Goodwill) and equity investments. The Group periodically revises the carrying amount of non-current assets held and utilized and the carrying amount of assets held for sale, when facts and circumstances make this necessary. This process is performed using estimates of the cash flows expected from the use or sale of the asset and appropriate discount rates to calculate the present value. In accordance with the accounting principles adopted to prepare the financial statements, the carrying value of goodwill is tested each year for any impairment which should be reflected in the income statement. The impairment test involves allocating the goodwill to cash generating units and determining its recoverable amount. If recoverable amount is lower than the carrying amount of the cash generating units, the goodwill allocated to them is adjusted accordingly. The allocation of goodwill to the cash generating units and the determination of their recoverable amount requires the use of estimates which depend on factors that may change over time with consequent effects – possibly significant – on the valuations performed by management. |
| • | Impairment of value of assets: in accordance with the accounting principles applied by the Group, tangible and intangible assets with a determinate useful life are tested for impairment. Impairment adjustments are recorded when there are indicators which suggest it will prove difficult to recover the net carrying amount of the assets through use. Testing for such indicators of impairment requires the management to make subjective assessments based on the information available within the Group and on the market, as well as based on their past experience. Moreover, when a potential impairment of value is identified, the Group calculates the amount using appropriate valuation techniques. Proper identification of factors indicating a potential impairment of value and estimates of the amount in question rely on factors which may vary over time, influencing the valuations and estimates made by management. When the carrying amount of a non-current asset has been impaired, the Company adjusts it for the difference between the carrying amount of the asset and its recoverable amount through use or disposal, as determined based on the Group’s most recent business plans. It should also be noted that the recoverability of the assets reported in the financial statements is subject to realization of the business plans. This must be considered bearing in mind the inherent uncertainty attaching to business plans, in relation to whether expected events will occur and their timing and amount, and, inevitably, the uncertainty regarding the going concern assumption as previously described. |
PM GROUP
29
| • | Depreciation and amortization of non-current assets: the depreciation and amortization of non-current assets is a significant cost for the Group. The cost of property, plant and equipment is depreciated on a straight-line basis over the estimated useful lives of the related assets. Management determines the useful lives of the Group’s non-current assets when they are acquired. This is based on prior experience for similar assets, market conditions and any information on future events which could have an impact on useful life, including technological changes. Therefore, actual useful life might differ from estimated useful life. The Group periodically evaluates technological changes and changes regarding the industry in order to update estimated useful life. Such periodic updates might lead to a change of depreciation/amortization period and, therefore, to the depreciation/amortization charges for future reporting periods. |
| • | Deferred taxation: deferred tax assets are recognized based on taxable income expected in future periods. The valuation of expected taxable income for the purposes of recognition of deferred tax assets depends on factors which may vary over time and could have significant effects on the valuation of deferred tax assets. |
| • | Provisions for legal and tax risks: provisions made for legal and tax risks represent the risk of losing such disputes. The amount of any provision created for such risks represents Management’s best estimate at the reporting date. That estimate involves the making of assumptions which depend on factors that may change over time and which could, therefore, have effects on the current estimates made by management when preparing the Group consolidated financial statements. |
Moreover, details are provided below of important accounting estimates made by Management when preparing the financial statements, including those where Management involved independent experts (actuaries and financial advisors). Attention is drawn to the fact that any future changes to the conditions underlying the judgments, assumptions and estimates used could have an impact on the results for future reporting periods.
| • | Actuarial calculation of defined benefit pension plans: in order to calculate defined benefit plans in relation to post-employment benefits, the Group uses the support of an actuary. The demographic and economic/financial assumptions made by the actuary for the purposes of this calculation are shown in detail in Note 13 : |
Estimates made for purposes of impairment test of goodwill: see Note 2 for method adopted and results of test.
New accounting standards
The Group has adopted the following new accounting standard and amended standards from the fiscal year ended December 31, 2013:
| • | IAS 1 Presentation of Financial Statements. Description: revisions to the presentation of items in other comprehensive income. |
| • | IFRS 7 Financial Instruments: Disclosures. Description: disclosure related to offsetting of financial assets and liabilities. |
| • | IFRS 10 Consolidated Financial – Statements. Description: Amendments for definition of control, elements of control and basis of existence of control to be applied, regardless of the nature of the investee; |
| • | IFRS 11 Joint Arrangements. Description: regarding arrangements of which two or more parties have joint control, provide the classification of a joint arrangement based on legal form, contractual arrangement on assets or liabilities and other facts and conditions, not based on only legal form of the arrangement Provide accounting treatment for each classification. |
PM GROUP
30
| • | IFRS 12 Disclosure of Interests in Other Entities. Description: expansion of the scope of the disclosure of ownership of interests in other entities, including unconsolidated structured entities; |
| • | IFRS 13 Fair Value – Measurement. Description: guidance on fair value measurement to be applied by all standards and unification of the definition of fair value which was previously provided separately in each standard; |
| • | IAS 19 Employee Benefits. Description: revisions to recognition and presentation of actuarial gains and losses, past service cost, interest cost and others, and revision to disclosure of retirement benefits; |
| • | IAS 28 Investments in Associates and Joint Ventures. Description: amendments based on IFRS 10, IFRS 11 and IFRS 12; |
| • | IAS 36 Impairment of Assets. Description: amendments to recoverable amount disclosures for non-financial assets. |
The effect of the above standards on the consolidated financial statements is immaterial.
New Accounting Standards Not Yet Adopted by the Group
By the date of approval of the consolidated financial statements, new accounting standards, amended standards and new interpretations that have been issued, but have not been early adopted by the Group are as follows.
The implications from adoption of these standards and interpretations are assessed by the Group; however, we evaluate that none of them will have a material impact on our operating results and financial condition.
| IFRS |
Mandatory |
Description of new standards and amendments | ||
| IFRS 2 Share-based Payment |
July 1, 2014 | Amendments for the definition of vesting conditions | ||
| IFRS 3 Business Combinations |
July 1, 2014 | Amendments for accounting treatment for contingent consideration in a business combination | ||
| July 1, 2014 | Clarifying scope exceptions for joint arrangements under IFRS 3 | |||
| IFRS 8 Operating Segments |
July 1, 2014 | Adding disclosure requirements for aggregation of operating segments and clarifying rules relating to segment assets | ||
| IFRS 11 Joint Arrangements |
January 1, 2016 | Modifications of accounting for the acquisition of an interest in a joint operation in circumstances in which the activity of the joint operation constitutes a business as defined in IFRS 3 | ||
| IFRS 13 Fair Value Measurement |
July 1, 2014 | Clarifying a scope exception for measuring the fair value of a portfolio | ||
| IFRS 14 Regulatory Deferral Accounts |
January 1, 2016 | Issuance of requirements for accounting treatment for regulatory deferral accounts for rate-regulated activities | ||
PM GROUP
31
| IAS 16 Property, Plant and Equipment |
July 1, 2014 | Amendments for accounting treatment for revaluation model | ||||
| IAS 19 Employee Benefits |
July 1, 2014 | Clarifying accounting treatment for contributions from employees or third parties as required in the terms of defined benefit plans | ||||
| IAS 24 Related Party Disclosures |
July 1, 2014 | Clarifying that a management entity that provides key management personnel services to a reporting entity is deemed to be identified as a related party | ||||
| IAS 32 Financial Instruments: Presentation |
January 1, 2014 | Clarifying conditions on offset disclosure and adding guidelines | ||||
| IAS 38 Intangible Assets |
July 1, 2014 | Amendments to accounting treatment for revaluation mode | ||||
| l IAS 39 Financial Instruments: Recognition and Measurement |
January 1, 2014 | Requirements for continuation of hedge accounting in certain circumstances in which there is a change in counterparty to a hedging instrument | ||||
| IAS 40 Investment Property |
July 1, 2014 | Clarifying the interrelationship of IFRS 3 and IAS 40 when classifying property as investment property or owner-occupied property | ||||
| IFRIC 21 Levies |
January 1, 2014 | Clarifying the accounting for levies | ||||
| IFRS 10 |
January 1, 2014 | Accounting treatment for the investments held by investment entities(measure their investments at fair value through profit or loss instead of consolidating them) | ||||
| IAS 16 IAS 38 | Clarification of Acceptable Methods of Depreciation and Amortisation |
January 1, 2016 | Clarifying that a revenue-based method is not considered to be an acceptable method of depreciation and amortization in principle | |||
The implications from adoption of these standards have not yet evaluated by Group:
| IFRS 9 Financial Instruments |
To be determined | Amendments for hedge accounting | ||
| IFRS 15 Revenue from Contracts with Customers |
January 1, 2017 | Amendments for accounting treatment for recognizing revenue | ||
PM GROUP
32
Comments on items in the Statement of Financial Position
ASSETS
Note 1 - Tangible assets
The following table shows the opening balances, movements during 2013 and 2012 and the closing balances for tangible assets:
| (in Euro) |
01/01/13 | Exchange difference |
Reclass. Assets held for sale |
Additions | Disposals | Reclassification | Depreciation | Impairment | 31/12/13 | |||||||||||||||||||||||||||
| Cost |
||||||||||||||||||||||||||||||||||||
| 4,691,449 | -2,237 | 0 | 0 | 5,687 | 0 | 0 | 0 | 4,683,525 | ||||||||||||||||||||||||||||
| Buildings |
19,215,150 | -16,408 | -461,964 | 81,536 | 222,802 | 0 | 0 | 0 | 18,595,512 | |||||||||||||||||||||||||||
| Plant and machinery |
22,327,549 | -18,852 | -13,177,215 | 14,103 | 25,606 | 0 | 0 | 0 | 9,119,979 | |||||||||||||||||||||||||||
| Industrial and commercial equipment |
11,099,755 | -7,000 | -2,892,172 | 141,819 | 102,405 | 1,565 | 0 | 0 | 8,241,562 | |||||||||||||||||||||||||||
| Other assets |
5,624,084 | -53,622 | -1,452,164 | 222,907 | 116,102 | 0 | 0 | 0 | 4,225,103 | |||||||||||||||||||||||||||
| Assets under construction and payments on advance |
251,306 | -119 | -249,750 | 13,795 | 0 | -1,565 | 0 | 0 | 13,667 | |||||||||||||||||||||||||||
|
|
|
|
|
|
|
|
|
|
|
|
|
|
|
|
|
|
|
|||||||||||||||||||
| Total Cost of Tangible Assets |
63,209,293 | -98,238 | -18,233,265 | 474,160 | 472,602 | 0 | 0 | 0 | 44,879,348 | |||||||||||||||||||||||||||
|
|
|
|
|
|
|
|
|
|
|
|
|
|
|
|
|
|
|
|||||||||||||||||||
| (in Euro) |
01/01/13 | Exchange difference |
Reclass. Assets held for sale |
Additions | Disposals | Reclass. | Depreciation | Impairment | 31/12/13 | |||||||||||||||||||||||||||
| Accumulated depreciation and impairment |
||||||||||||||||||||||||||||||||||||
| Land |
0 | 0 | 0 | 0 | 0 | 0 | 0 | 0 | 0 | |||||||||||||||||||||||||||
| Buildings |
6,457,288 | -842 | -386,523 | 0 | 162,802 | 0 | 571,941 | 0 | 6,479,062 | |||||||||||||||||||||||||||
| Plant and machinery |
17,116,071 | -13,875 | -10,066,174 | 0 | 25,657 | 0 | 530,574 | 0 | 7,540,939 | |||||||||||||||||||||||||||
| Industrial and commercial equipment |
10,426,153 | -5,567 | -2,641,396 | 0 | 101,598 | 0 | 269,641 | 0 | 7,947,233 | |||||||||||||||||||||||||||
| Other assets |
4,479,710 | -18,305 | -1,144,136 | 0 | 87,507 | 0 | 261,058 | 165,089 | 3,655,909 | |||||||||||||||||||||||||||
|
|
|
|
|
|
|
|
|
|
|
|
|
|
|
|
|
|
|
|||||||||||||||||||
| Total accumulated depreciation and impairment of tangible asset |
38,479,222 | -38,589 | -14,238,229 | 0 | 377,564 | 0 | 1,633,214 | 165,089 | 25,623,143 | |||||||||||||||||||||||||||
|
|
|
|
|
|
|
|
|
|
|
|
|
|
|
|
|
|
|
|||||||||||||||||||
| Net Book Value |
24,730,071 | -59,649 | -3,995,036 | 474,160 | 95,038 | 0 | -1,633,214 | -165,089 | 19,256,205 | |||||||||||||||||||||||||||
|
|
|
|
|
|
|
|
|
|
|
|
|
|
|
|
|
|
|
|||||||||||||||||||
| (in Euro) |
01/01/12 | Exchange difference |
Additions | Disposals | Reclassification | Depreciation | 31/12/12 | |||||||||||||||||||||||||||||
| Cost |
||||||||||||||||||||||||||||||||||||
| Land |
4,702,338 | -10,890 | 0 | 0 | 0 | 0 | 4,691,448 | |||||||||||||||||||||||||||||
| Buildings |
19,067,693 | -49,172 | 402,733 | 203,131 | -2,972 | 0 | 19,215,151 | |||||||||||||||||||||||||||||
| Plant and machinery |
22,171,185 | -69,222 | 228,383 | 62,439 | 59,642 | 0 | 22,327,549 | |||||||||||||||||||||||||||||
| Industrial and commercial equipment |
10,771,197 | -18,753 | 341,366 | 1,546 | 7,491 | 0 | 11,099,755 | |||||||||||||||||||||||||||||
| Other assets |
5,472,386 | -16,251 | 371,038 | 195,554 | -7,535 | 0 | 5,624,084 | |||||||||||||||||||||||||||||
| Assets under construction and payments on advance |
39,698 | -1,076 | 281,831 | 3,960 | -65,187 | 0 | 251,306 | |||||||||||||||||||||||||||||
|
|
|
|
|
|
|
|
|
|
|
|
|
|
|
|||||||||||||||||||||||
| Total Cost of Tangible Assets |
62,224,497 | -165,364 | 1,625,351 | 466,630 | -8,561 | 0 | 63,209,293 | |||||||||||||||||||||||||||||
|
|
|
|
|
|
|
|
|
|
|
|
|
|
|
|||||||||||||||||||||||
| (in Euro) |
01/01/12 | Exchange difference |
Additions | Disposals | Reclass. | Depreciation* | 31/12/12 | |||||||||||||||||||||||||||||
| Accumulated depreciation and impairment |
||||||||||||||||||||||||||||||||||||
| Buildings |
6,021,730 | -1,212 | 0 | 203,131 | 325 | 639,576 | 6,457,288 | |||||||||||||||||||||||||||||
| Plant and machinery |
16,040,277 | -35,957 | 0 | 47,914 | -6,768 | 1,166,433 | 17,116,071 | |||||||||||||||||||||||||||||
| Industrial and commercial equipment |
9,923,635 | -9,770 | 0 | 1,546 | -938 | 514,772 | 10,426,153 | |||||||||||||||||||||||||||||
| Other assets |
4,241,441 | -7,390 | 0 | 119,364 | -1,180 | 366,203 | 4,479,710 | |||||||||||||||||||||||||||||
|
|
|
|
|
|
|
|
|
|
|
|
|
|
|
|||||||||||||||||||||||
| Total accumulated depreciation and impairment of tangible asset |
36,227,083 | -54,329 | 0 | 371,955 | -8,561 | 2,686,984 | 38,479,222 | |||||||||||||||||||||||||||||
|
|
|
|
|
|
|
|
|
|
|
|
|
|
|
|||||||||||||||||||||||
| Net Book Value |
25,997,414 | -111,035 | 1,625,351 | 94,675 | 0 | -2,686,984 | 24,730,071 | |||||||||||||||||||||||||||||
|
|
|
|
|
|
|
|
|
|
|
|
|
|
|
|||||||||||||||||||||||
| * | The caption differs on the same one reported in Statement Income for the BU Pilosio’s depreciation included in the caption “Profit/Loss from discontinued operations”. |
PM GROUP
33
The main capital expenditures during the reporting period is analyzed as follows:
| • | Euro 62 thousand for industrial equipment and tooling |
| • | Euro 33 thousand for replacing parts of existing plant and equipment. |
| • | Euro 32 thousand for purchases of hardware and electronic office equipment. |
| • | Euro 18 thousand for the building in Via Modenese, 4985, San Cesario sul Panaro (MO) and to the purchase of a lightweight canopy for the prototypes division. |
In 2013, 2012 and 2011, depreciation of tangible assets totaled € 1,633 thousand, € 1,753 thousand and € 1,892 thousand, respectively.
Note 2 - Goodwill
| (in Euro) |
2013 | 2012 | ||||||
| Beginning balance |
68,142,670 | 68,142,670 | ||||||
|
|
|
|
|
|||||
| Reclassification of Asset held for sale |
-20,078,655 | 0 | ||||||
| Impairment |
-14,871,056 | 0 | ||||||
|
|
|
|
|
|||||
| Ending balance |
33,192,959 | 68,142,670 | ||||||
|
|
|
|
|
|||||
Goodwill has been allocated for impairment testing purposes to the following cash-generating units:
| (in Euro) |
01/01/13 | Reclass. Ass. held for sale |
Impairment | 31/12/13 | ||||||||||||
| PM - cash generating unit |
33,192,959 | 0 | 0 | 33,192,959 | ||||||||||||
| Oil & Steel - cash generating unit |
14,871,056 | 0 | -14,871,056 | 0 | ||||||||||||
| Pilosio - cash generating unit |
20,078,655 | -20,078,655 | 0 | 0 | ||||||||||||
|
|
|
|
|
|
|
|
|
|||||||||
| Goodwill |
68,142,670 | -20,078,655 | -14,871,056 | 33,192,959 | ||||||||||||
|
|
|
|
|
|
|
|
|
|||||||||
PM cash-generating unit
The recoverable value of goodwill related to the CGU PM at December 31, 2013 was determined using value in use. The cash flows of the PM cash generating units as per the Business Plan 2014-2017, approved by the Board of Directors, were discounted. For impairment test purposes, cash flows for 2018 were also estimated applying a long term growth rate of 2%.
The discount rate used was the Weighted Average Cost of Capital of 11.06% (post tax)- which also takes account of the CGU’s particular situation of financial distress as described in the note on the Going Concern issue.
The main assumptions made for the Business Plan of the PM cash generating units are as follows:
| • | Increase in sales until sales revenue of Euro 73,016 thousand is reached in 2016 (CAGR 2013-16= 7.5%); |
| • | Increase in profitability until an EBITDA margin of 15.7% is achieved in 2016 through the following measures: |
| • | Improve distribution capacity on emerging non-EU markets: Russia and Central Asia, Middle East and Africa, Far East, North, Central and South America; |
PM GROUP
34
| • | Renewal of medium/large range and development of “super heavy” segment i.e. over 85 tonnes; |
| • | Increased profitability thanks to greater efficiency, standardization of components and new industrial investments. |
Oil & Steel cash-generating unit
The recoverable amount of goodwill related to the CGU Oil & Steel at December 31, 2013 was determined using value in use. The cash flows of the Oil & Steel cash generating units as per the Business Plan 2014-2017, approved by the Board of Directors, were discounted. For impairment test purposes, cash flows for 2018 were also estimated applying a long term growth rate of 2%.
The discount rate used was the Weighted Average Cost of Capital of 11.06% - which also takes account of the CGU’s particular situation of financial distress as described in the note on the Going Concern issue.
The main assumptions made for the Business Plan of the Oil & Steel cash generating units are as follows:
| • | Increase volumes to achieve sales revenue of Euro 24,463 thousand (CAGR 2013-16= 10.7%); |
| • | EBITDA margin of 5.8% in 2016 due to the following measures: |
| • | Improve distribution capacity on emerging non-EU markets, also due to synergies with PM network, and through shared resources; |
| • | Increased profit on sales due to commercial development of “KIT” product; |
| • | Cost reduction due to standardization / modularity of basic components and new industrial synergies with PM. |
The above assumptions are inherently uncertain given that they relate to forecasts of future events. Moreover, the uncertainty regarding the underlying assumptions for the Business Plan is increased by the ongoing difficult national and international economic environment and the difficult situation on the markets where the Group operates. The uncertainty regarding the going concern assumption must also be taken into account, as highlighted in the Note on the Going Concern issue.
The downwards adjustment of growth and future profit assumptions for the Oil & Steel cash-generating unit (compared to those made previously) led to lower forecasts of income and cash flows in the years covered by the Business Plan (compared to previous Business Plans). Consequently, it also led to the impairment of intangible assets and deferred tax assets relating to said cash-generating unit. Furthermore, the ongoing difficult economic environment and inability to fulfil financial obligations meant that the selling price less cost to sell negotiated for the Pilosio cash-generating unit was lower than the carrying amounts of its net assets in previous years; this selling price was supported by an independent expert appraisal of the cash-generating unit.
The results of the impairment test for the Oil & Steel BU led to the total impairment of goodwill by an amount of Euro 14,871 thousand and the total impairment of the Euro 2,327 thousand of R&D costs capitalized by the Oil & Steel BU.
Meanwhile, the value of the goodwill of the Pilosio cash-generating unit was impaired for Euro 13.104 thousand and brought into line with the selling price less cost to sell of that company, as established in the binding commitment signed in relation to the Debt Restructuring Operation described above, whose legal effect is subject to final approval of the PM Restructuring Agreement. This was the main reason for the loss of
PM GROUP
35
around Euro 14.4 million from discontinued operations. We note, however, that the selling price of Pilosio for Euro 1,000 thousand was analyzed by an independent expert, as Pilosio will be sold to a related entity, who concluded that it was reasonable. Consequently, the assets and liabilities of that cash-generating unit were reclassified to “Assets held for sale” and “Liabilities held for sale”.
With reference to the PM cash generating unit, it should be noted that, if all of the operating cash flows (2014 – 2018) used in the related impairment test were 2% lower than shown in the Business Plan, the result of the impairment test would show that discounted cash flows and carryng amount of the CGU broadly matched.
Finally, it is worth noting that the estimates and Business Plan figures to which the aforementioned parameters are applied are determined by Group management based on its past experience and on expectations regarding the future development of the markets on which the Group operates. Estimation of the recoverable amount of the cash generating units requires Management to use its discretion and market estimates. The Group cannot guarantee that the value of goodwill will not be impaired in future periods. In fact, various factors also including the evolution of the difficult market environment could require the value of goodwill to be reassessed. The circumstances and events that could require a further impairment test will be constantly monitored by the Group.
However, the Group cannot guarantee that the value of goodwill will not be further impaired in future periods. In fact, a number of factors also regarding the evolution of the difficult market environment could make it necessary to redetermine the value of goodwill. The circumstances and events that could require a further impairment test will be constantly monitored by the Group.
Note 3 – Other intangible assets
The following table shows the opening balances, movements during 2013 and 2012 and the closing balances for other intangible assets:
| (in Euro) |
01/01/13 | Exchange difference |
Reclass. Assets held for sale |
Additions | Reclassification | Impairment | Amortization | 31/12/13 | ||||||||||||||||||||||||
| Cost |
||||||||||||||||||||||||||||||||
| Development costs |
10,963,015 | -10 | -784,613 | 0 | 2,930,002 | 0 | 0 | 13,108,394 | ||||||||||||||||||||||||
| Patents and intellectual property rights |
2,599,033 | 0 | -1,039,262 | 8,705 | 364,494 | 0 | 0 | 1,932,970 | ||||||||||||||||||||||||
| Concessions, licences, trademarks and similar |
51,131 | -472 | 0 | 38,365 | 0 | 0 | 0 | 89,024 | ||||||||||||||||||||||||
| Assets in progress and payments on advance |
2,285,139 | 0 | -47,292 | 2,040,278 | -3,294,496 | 0 | 0 | 983,629 | ||||||||||||||||||||||||
| Other |
82,083 | 0 | -82,083 | 280 | 0 | 0 | 0 | 280 | ||||||||||||||||||||||||
|
|
|
|
|
|
|
|
|
|
|
|
|
|
|
|
|
|||||||||||||||||
| Total |
15,980,401 | -482 | -1,953,250 | 2,087,628 | 0 | 0 | 0 | 16,114,297 | ||||||||||||||||||||||||
|
|
|
|
|
|
|
|
|
|
|
|
|
|
|
|
|
|||||||||||||||||
| (in Euro) |
01/01/13 | Exchange difference |
Reclass. Assets held for sale |
Additions | Reclassification | Impairment | Amortization | 31/12/13 | ||||||||||||||||||||||||
| Accumulated amortisation and impairment |
||||||||||||||||||||||||||||||||
| Development costs |
7,176,944 | 1,993 | -524,966 | 0 | 0 | 2,373,043 | 1,204,465 | 10,231,479 | ||||||||||||||||||||||||
| Patents and intellectual property rights |
1,933,773 | 0 | -675,193 | 0 | 0 | 0 | 203,110 | 1,461,690 | ||||||||||||||||||||||||
| Concessions, licences, trademarks and similar |
49,513 | -114 | 0 | 0 | 0 | 0 | 7,695 | 57,094 | ||||||||||||||||||||||||
| Assets in progress and payments on advance |
0 | 0 | 0 | 0 | 0 | 648,052 | 0 | 648,052 | ||||||||||||||||||||||||
| Other |
79,579 | 0 | -79,579 | 0 | 0 | 0 | 56 | 56 | ||||||||||||||||||||||||
|
|
|
|
|
|
|
|
|
|
|
|
|
|
|
|
|
|||||||||||||||||
| Total |
9,239,809 | 1,879 | -1,279,738 | 0 | 0 | 3,021,095 | 1,415,326 | 12,398,371 | ||||||||||||||||||||||||
|
|
|
|
|
|
|
|
|
|
|
|
|
|
|
|
|
|||||||||||||||||
| Net Book Value |
6,740,592 | -2,361 | -673,512 | 2,087,628 | 0 | -3,021,095 | -1,415,326 | 3,715,926 | ||||||||||||||||||||||||
|
|
|
|
|
|
|
|
|
|
|
|
|
|
|
|
|
|||||||||||||||||
Capitalized development costs relate to new products, as described in Note 23 below.
PM GROUP
36
Assets in progress, at their completion, are amortized over five years, being it the estimated useful life of the Group’s new products without any significant restyling processes.
Impairment of Euro 3,021 thousand for the year ended December 31, 2013 refer to the development costs of which Euro 696 thousand relating to PM Group S.p.A. (following a review of future plans for certain projects in relation to which research and development costs were recorded) and Euro 2,325 thousand relating to Oil & Steel S.p.A. whose value has been impaired (based on the impairment test performed on this BU, as described in the previous paragraph (“Main estimates made by Management”).
Amortization of intangible assets totaled €1,415 thousand, €1,753 thousand and €1,537 thousand in 2013, 2012 and 2011, respectively.
| (in Euro) |
01/01/12 | Additions | Reclassification | Amortization | 31/12/12 | |||||||||||||||
| Cost |
||||||||||||||||||||
| Development costs |
8,940,381 | 195,654 | 1,826,980 | 0 | 10,963,015 | |||||||||||||||
| Patents and intellectual property rights |
2,215,819 | 322,308 | 200,898 | 0 | 2,739,025 | |||||||||||||||
| Concessions, licences, trademarks and similar |
50,851 | 280 | 0 | 0 | 51,131 | |||||||||||||||
| Assets in progress and payments on advance |
2,074,984 | 2,238,033 | -2,027,878 | 0 | 2,285,139 | |||||||||||||||
| Other |
80,333 | 1,750 | 0 | 0 | 82,083 | |||||||||||||||
|
|
|
|
|
|
|
|
|
|
|
|||||||||||
| Total |
13,362,368 | 2,758,025 | 0 | 0 | 16,120,393 | |||||||||||||||
|
|
|
|
|
|
|
|
|
|
|
|||||||||||
| (in Euro) |
01/01/12 | Additions | Reclassification | Amortization* | 31/12/12 | |||||||||||||||
| Accumulated amortisation and impairment |
||||||||||||||||||||
| Development costs |
5,432,352 | 0 | 0 | 1,744,593 | 7,176,945 | |||||||||||||||
| Patents and intellectual property rights |
1,779,554 | 0 | 0 | 294,209 | 2,073,763 | |||||||||||||||
| Concessions, licences, trademarks and similar |
40,617 | 0 | 0 | 8,897 | 49,514 | |||||||||||||||
| Other |
78,125 | 0 | 0 | 1,454 | 79,579 | |||||||||||||||
|
|
|
|
|
|
|
|
|
|
|
|||||||||||
| Total |
7,330,648 | 0 | 0 | 2,049,153 | 9,379,801 | |||||||||||||||
|
|
|
|
|
|
|
|
|
|
|
|||||||||||
| Net Book Value |
6,031,720 | 2,758,025 | 0 | -2,049,153 | 6,740,592 | |||||||||||||||
|
|
|
|
|
|
|
|
|
|
|
|||||||||||
| * | The caption differs from the same one reported in the Statement of Income because BU Pilosio’s amortization is included in the caption “Profit/Loss from discontinued operations”. |
Note 4 - Deferred tax assets
Deferred tax assets mainly include the deferred tax assets of PM Group S.p.A. (Euro 4,952 thousand at December 31, 2013, regarding the Imposta sul Reddito delle Società (“I.RE.S.”) and the Imposta Regionale sulle Attività Produttive (“I.R.A.P.”) effect calculated on taxed provisions – Euro 1,317 thousand on the amount not deductible for I.RE.S purposes, Euro 3,495 thousand in relation to interest and similar expenses and Euro 140 thousand on prior year tax losses). Management consider these deferred tax assets recoverable on the basis of the future profits contained in the Business Plan and also taking account of the expected reversal of part of the deferred tax liabilities recorded under non-current liabilities.
The deferred tax assets of subsidiary Oil & Steel S.p.A. have been written down in full given the uncertainty over their recoverability through the generation of taxable income in the near future.
PM GROUP
37
| (in Euro) |
1/1/2013 | Statement of Income |
Reclass. Assets held for sale |
Exch. Diff. and other changes |
31/12/2013 | |||||||||||||||
| Provisions for risks and charges |
306,824 | -142,558 | -28,304 | 0 | 135,962 | |||||||||||||||
| Inventory |
1,215,312 | -419,767 | -89,514 | 0 | 706,031 | |||||||||||||||
| Provision for bad debts |
861,741 | -197,368 | -391,019 | 0 | 273,354 | |||||||||||||||
| Provision for losses on derivatives |
863,516 | -231,228 | -56,265 | 0 | 576,023 | |||||||||||||||
| Tax losses |
698,916 | -86,916 | -102,466 | 0 | 509,534 | |||||||||||||||
| Interest expenses |
4,006,341 | -153,297 | -357,777 | 0 | 3,495,267 | |||||||||||||||
| Other |
102,529 | 17,942 | -55,698 | -57,451 | 7,322 | |||||||||||||||
|
|
|
|
|
|
|
|
|
|
|
|||||||||||
| Deferred tax assets |
8,055,179 | -1,213,192 | -1,081,043 | -57,451 | 5,703,493 | |||||||||||||||
|
|
|
|
|
|
|
|
|
|
|
|||||||||||
| (in Euro) |
1/1/2012 | Statement of Income |
31/12/2012 | |||||||||
| Provisions for risks and charges |
341,452 | -34,628 | 306,824 | |||||||||
| Inventory |
1,021,191 | 194,122 | 1,215,313 | |||||||||
| Provision for bad debts |
781,677 | 80,064 | 861,741 | |||||||||
| Provision for losses on derivatives |
622,303 | 241,213 | 863,516 | |||||||||
| Tax losses |
1,057,548 | -358,632 | 698,916 | |||||||||
| Interest expenses |
3,429,669 | 576,670 | 4,006,339 | |||||||||
| Other |
80,850 | 21,680 | 102,530 | |||||||||
|
|
|
|
|
|
|
|||||||
| Deferred tax assets |
7,334,690 | 720,489 | 8,055,179 | |||||||||
|
|
|
|
|
|
|
|||||||
Note 5 – Other non-current assets
Other non-current assets are analyzed as follows:
| (in Euro) |
31/12/2013 | 31/12/12 | ||||||
| Other receivables |
161,832 | 298,531 | ||||||
|
|
|
|
|
|||||
| Other non-current assets |
161,832 | 298,531 | ||||||
|
|
|
|
|
|||||
Current assets
Note 6 - Inventory
For details of changes in each inventory category, see the figures highlighted in the Income Statement.
PM GROUP
38
The following tables contain a breakdown of net inventory by category and movements on the inventory obsolescence provision (deducted directly from inventory):
| (in Euro) |
31/12/2013 | 31/12/12 | ||||||
| Raw, ancillary and consumable materials |
10,162,235 | 13,074,487 | ||||||
| Work in progress |
680,084 | 564,443 | ||||||
| Semi-finished goods |
744,358 | 2,161,957 | ||||||
| Finished goods |
4,862,442 | 17,114,399 | ||||||
| Inventory obsolescence provision |
-2,597,952 | -1,915,809 | ||||||
|
|
|
|
|
|||||
| Inventory |
13,851,167 | 30,999,477 | ||||||
|
|
|
|
|
|||||
Breakdown and movement on inventory obsolescence provision:
| (in Euro) |
01/01/12 | Addition | Utilised | Other movements |
31/12/12 | |||||||||||||||||||
| Inventory obsolescence provision |
1,938,304 | 345,176 | -367,575 | -96 | 1,915,809 | |||||||||||||||||||
|
|
|
|
|
|
|
|
|
|
|
|||||||||||||||
| (in Euro) |
01/01/13 | Reclass. Assets held for sale |
Addition | Utilised | Other movements |
31/12/13 | ||||||||||||||||||
| Inventory obsolescence provision |
1,915,809 | -243,392 | 1,008,637 | -78,953 | -4,149 | 2,597,952 | ||||||||||||||||||
|
|
|
|
|
|
|
|
|
|
|
|
|
|||||||||||||
The provision was utilized in relation to the scrapping of obsolete products during the period. The amount allocated was determined to take account of slow moving and obsolete inventory and to bring the value of inventory into line with estimated realizable value.
The amounts allocated to the Inventory provision were € 1,009 thousand, € 320 thousand and, € 880 thousand in 2013, 2012 and 2011, respectively.
Note 7 – Current trade receivables
Current trade receivables are analyzed as follows:
| (in Euro) |
31/12/13 | 31/12/12 | ||||||
| Current trade receivables |
30,924,832 | 36,391,684 | ||||||
| Payments on account |
0 | -45,009 | ||||||
| Other receivables |
118,950 | 0 | ||||||
| Allowance for bad debts |
-2,522,082 | -4,446,104 | ||||||
|
|
|
|
|
|||||
| Trade receivables |
28,521,700 | 31,900,571 | ||||||
|
|
|
|
|
|||||
Trade receivables are broken down by due date as follows:
| At 31 December 2013 | At 31 December 2012 | |||||||||||||||||||||||||
| Due within a year |
Overdue | Balance at 31/12/2013 |
Due within a year |
Overdue | Balance at 31/12/2012 |
|||||||||||||||||||||
| Trade receivables Gross |
19,161,295 | 11,882,487 | 31,043,782 | 19,379,981 | 16,966,694 | 36,346,675 | ||||||||||||||||||||
|
|
|
|
|
|
|
|
|
|
|
|
|
|||||||||||||||
| Allowance for bad debts |
0 | -2,522,082 | -2,522,082 | 0 | -4,446,104 | -4,446,104 | ||||||||||||||||||||
|
|
|
|
|
|
|
|
|
|
|
|
|
|||||||||||||||
| Trade receivables Net |
19,161,295 | 9,360,405 | 28,521,700 | 19,379,981 | 12,520,590 | 31,900,571 | ||||||||||||||||||||
|
|
|
|
|
|
|
|
|
|
|
|
|
|||||||||||||||
PM GROUP
39
The carrying amount of trade receivables is brought into line with estimated realizable value by means of a specific allowance for bad debt. Movements on the allowance for bad debts are shown in the following table
| (in Euro) |
01/01/13 | Reclass. Assets held for sale |
Increases | Amount written off during 2013 as uncollectible |
Exchange differences |
31/12/13 | ||||||||||||||||||
| Allowance for bad debts |
4,446,104 | -1,491,616 | 486,788 | 903,800 | -15,394 | 2,522,082 | ||||||||||||||||||
|
|
|
|
|
|
|
|
|
|
|
|
|
|||||||||||||
| (in Euro) |
01/01/12 | Increases | Amount written off during 2012 as uncollectible |
Exchange differences |
31/12/12 | |||||||||||||||
| Allowance for bad debts |
3,761,300 | 820,314 | 131,616 | -3,894 | 4,446,104 | |||||||||||||||
|
|
|
|
|
|
|
|
|
|
|
|||||||||||
The 2012 increase in allowance for bad debts differs from the amount reported as “Bad debt provision” in the Statement of Income as the increase includes also the bad debt provision for the BU Pilosio which has been reported among the caption “Profit/Loss from discontinued operations” in the Statement of Income.
The amounts allocated to the Bad debt provision were € 487 thousand, € 482 thousand and € 880 thousand in 2013, 2012 and 2011, respectively.
Allowance for bad debts is recognised against trade receivables that are past due at the end of the reporting period based on estimated irrecoverable amounts determined by reference to past default experience of the counterparty and an analysis of the counterparty’s current financial position, as per the aged analysis below. Trade receivables disclosed above include amounts that are past due at the end of the reporting period for which the Group has not recognised an allowance for bad debts because there has not been a significant change in credit quality and the amounts are still considered recoverable.
| At 31 December 2013 | ||||||||||||||||||||||||||||
| Not Overdue | Overdue 0-30 days |
Overdue 31-60 days |
Overdue 61-90 days |
Overdue 91-120 days |
Overdue past 120 days |
Balance at 31/12/2013 |
||||||||||||||||||||||
| Trade receivable Impaired |
0 | 746,383 | 317,240 | 42,696 | 36,043 | 2,808,660 | 3,951,022 | |||||||||||||||||||||
|
|
|
|
|
|
|
|
|
|
|
|
|
|
|
|||||||||||||||
| Trade receivable not Impaired |
19,161,295 | 5,145,359 | 1,166,386 | 566,467 | 169,109 | 884,144 | 27,092,760 | |||||||||||||||||||||
|
|
|
|
|
|
|
|
|
|
|
|
|
|
|
|||||||||||||||
| Total Trade Receivable Gross |
19,161,295 | 5,891,742 | 1,483,626 | 609,163 | 205,152 | 3,692,804 | 31,043,782 | |||||||||||||||||||||
|
|
|
|
|
|
|
|
|
|
|
|
|
|
|
|||||||||||||||
| At 31 December 2012 | ||||||||||||||||||||||||||||
| Not Overdue | Overdue 0-30 days |
Overdue 31-60 days |
Overdue 61-90 days |
Overdue 91-120 days | Overdue past 120 days |
Balance at 31/12/2013 |
||||||||||||||||||||||
| Trade receivable Impaired |
196,421 | 88,650 | 98,262 | 224,288 | 4,982,252 | 5,589,873 | ||||||||||||||||||||||
|
|
|
|
|
|
|
|
|
|
|
|
|
|
|
|||||||||||||||
| Trade receivable not Impaired |
19,379,981 | 8,323,006 | 966,458 | 249,673 | 834,160 | 1,003,524 | 30,756,802 | |||||||||||||||||||||
|
|
|
|
|
|
|
|
|
|
|
|
|
|
|
|||||||||||||||
| Total Trade Receivable Gross |
19,379,981 | 8,519,427 | 1,055,108 | 347,935 | 1,058,448 | 5,985,776 | 36,346,675 | |||||||||||||||||||||
|
|
|
|
|
|
|
|
|
|
|
|
|
|
|
|||||||||||||||
PM GROUP
40
Note 8 – Current tax receivables
Current tax receivables may be analyzed as follows:
| (in Euro) |
31/12/13 | 31/12/12 | ||||||
| VAT receivable |
655,730 | 1,415,379 | ||||||
| IRES, IRAP and other income tax receivables |
1,370,756 | 858,670 | ||||||
| Other |
40,356 | 195,051 | ||||||
|
|
|
|
|
|||||
| Current tax receivables |
2,066,842 | 2,469,100 | ||||||
|
|
|
|
|
|||||
Note 9 - Cash and cash equivalents
Cash and cash equivalents are analyzed as follows:
| (in Euro) |
31/12/13 | 31/12/12 | ||||||
| Cash on hand |
20,704 | 25,737 | ||||||
| Cheques |
5,857 | 204,639 | ||||||
| Bank and post office accounts |
2,193,638 | 1,986,981 | ||||||
|
|
|
|
|
|||||
| Cash and cash equivalents |
2,220,199 | 2,217,357 | ||||||
|
|
|
|
|
|||||
Note 10 – Other current assets
Other current assets are analyzed as follows:
| (in Euro) |
31/12/13 | 31/12/12 | ||||||
| Receivables from suppliers |
220,106 | 348,502 | ||||||
| Other receivables |
1,350,308 | 933,923 | ||||||
|
|
|
|
|
|||||
| Other current assets |
1,570,414 | 1,282,425 | ||||||
|
|
|
|
|
|||||
PM GROUP
41
LIABILITIES AND SHAREHOLDERS’ EQUITY
Note 11 – Shareholders’ Equity
Share capital
At December 31, 2013, the share capital of PM Group amounted to Euro 23,311,420 and was fully paid. Share capital consists of 101,312,500 ordinary shares, fully subscribed, with dividend rights and with no par value.
Following completion of the reverse merger between parent company Felicia Spa and subsidiary PM Group Spa (legally effective from July 4, 2008), all of the shareholders of PM Group spa signed a pledge in favor of the banks (B.P.E.R and Unicredit Banca d’Impresa SpA ) on all of the shares in PM, as security for the bank loan originally made to Felicia Spa.
Under the restructuring agreement signed by the Company, transactions involving the share capital are prohibited except for those provided for by Articles 2446 and 2447 of the Italian Civil Code; the distribution of dividends and/or reserves to the shareholders is also prohibited.
Translation reserve
This reserve, negative by Euro 17 thousand at December 31, 2013, includes the effects of the translation into Euro of seven sets of financial statements of foreign subsidiaries prepared in foreign currency (PM North America Llp – prepared in US Dollars; PM Oil & Steel UK Ltd – prepared in GB Pounds; Autogru PM RO – prepared in Romanian Lei; PM Argentina Sl – prepared in Argentinean Pesos; PM Chile – prepared in Chilean Pesos; PM Oil & Steel do Brasil – prepared in Brazilian Reals; PM Oil & Steel Mexico – prepared in Mexican Pesos).
IAS 19 Reserve
This is the negative reserve of Euro 18 thousand created in compliance with IAS 19 in relation to employee benefits (employee severance indemnity / Trattamento di Fine Rapporto or “TFR ).
Accumulated losses
This reserve showed accumulated losses of Euro 12,309 thousand at December 31, 2013. It includes the accumulated earnings and losses of the Company and the subsidiaries for 2012 and prior years, insofar as not allocated to other Holding Company reserves.
Capital and reserves pertaining to non-controlling interests
Capital and reserves pertaining to non-controlling interests, amounting to Euro 936 thousand at December 31, 2013, includes the portion of shareholders’ equity pertaining to the non-controlling shareholders of some subsidiaries (as indicated in the Group Organization Chart).
PM GROUP
42
Non-current liabilities
Note 12 – Non-current financial payables
Non-current financial payables are analyzed as follows:
| (in Euro) |
31/12/2013 | 31/12/12 | ||||||
| Non-current portion of loans payable |
802,451 | 16,916,456 | ||||||
|
|
|
|
|
|||||
| Payables to other lenders |
335,100 | 2,125,155 | ||||||
|
|
|
|
|
|||||
| Non-current financial payables |
1,137,551 | 19,041,611 | ||||||
|
|
|
|
|
|||||
Payables to other lenders due after more than a year, amounting to Euro 335 thousand at December 31, 2013, primarily relate to the Oil & Steel Business Unit (Euro 238 thousand) and include payables to Medioleasing (formerly Banca Marche) under the real estate finance lease entered into for the Oil & Steel factory in San Cesario sul Panaro (MO), Via Verdi 22.
Payables to other lenders are broken down by due date as follows:
| (in Euro) |
within a year | between one and five years |
after more than five years |
Balance 31/12/2013 |
within a year | between one and five years |
after more than five years |
Balance 31/12/2012 |
||||||||||||||||||||||||||
| Minimum payments due under finance leases |
535,253 | 344,729 | 0 | 879,981 | 1,018,108 | 2,274,710 | 0 | 3,292,818 | ||||||||||||||||||||||||||
| Interest element |
-27,481 | -9,629 | 0 | -37,110 | -122,788 | -149,555 | 0 | -272,344 | ||||||||||||||||||||||||||
|
|
|
|
|
|
|
|
|
|
|
|
|
|
|
|
|
|||||||||||||||||||
| Present value of minimum payments due under finance leases |
507,772 | 335,100 | 0 | 842,872 | 895,320 | 2,125,155 | 0 | 3,020,475 | ||||||||||||||||||||||||||
|
|
|
|
|
|
|
|
|
|
|
|
|
|
|
|
|
|||||||||||||||||||
The portion of these payables due within a year is classified under Current financial payables, as analyzed in Note 16.
Non current portion of loans payable are due within one and five years, as shown in the table below:
| (in Euro) |
31/12/2013 | 31/12/12 | ||||||
| Loans Payable due after between 1 and 5 years |
802,451 | 16,916,456 | ||||||
|
|
|
|
|
|||||
| Non-current portion of loans payable |
802,451 | 16,916,456 | ||||||
|
|
|
|
|
|||||
PM GROUP
43
A detailed breakdown of loans payable is shown in the following table:
| Bank |
Interest rate | Original Maturity |
Type | Loan amount €/1000 |
O/S Princ. 31/12/13 |
current | non- current |
security | ||||||||||||||||
| CARISBO |
Eur 3M + 2,50 | 12/31/2014 | unsecured loan | 1,000 | 259,338 | 259,338 | — | none | ||||||||||||||||
| BPER (ex B.ca CRV) |
Eur 3M + 2,50 | 12/31/2014 | unsecured loan | 1,000 | 923,105 | 923,105 | — | none | ||||||||||||||||
| BPER |
Eur 3M + 2,50 | 12/31/2014 | unsecured loan | 1,500 | 1,500,000 | 1,500,000 | — | none | ||||||||||||||||
| BNL |
Eur 3M + 2,50 | 12/31/2014 | unsecured loan | 600 | 600,000 | 600,000 | — | none | ||||||||||||||||
| MPS |
Eur 3M + 2,50 | 12/31/2014 | unsecured loan | 5,500 | 5,500,000 | 5,500,000 | — | none | ||||||||||||||||
| UNICREDIT |
Eur 3M + 2,50 | 12/31/2014 | unsecured loan | 2,000 | 2,000,000 | 2,000,000 | — | none | ||||||||||||||||
| BPER / UNICREDIT |
— | 12/31/2015 | deferred interest - Senior loan | 2,862 | 2,862,200 | 2,862,200 | — | none | ||||||||||||||||
| BPER / UNICREDIT |
Eur 6M + 2,36 | 1/30/2017 | Secured loan - Senior loan | 26,993 | 26,993,000 | 26,993,000 | — | mortgage + pledge on shares | ||||||||||||||||
| BPER / UNICREDIT |
Eur 6M + 2,86 | 1/30/2017 | Secured loan - Senior loan | 30,000 | 30,000,000 | 30,000,000 | — | mortgage + pledge on shares | ||||||||||||||||
| CARISBO |
Eur 3M + 2,50 | 12/31/2014 | unsecured loan | 500 | 129,354 | 129,354 | — | none | ||||||||||||||||
| BPER (ex B.ca CRV) |
Eur 3M + 2,51 | 12/31/2014 | unsecured loan | 750 | 692,329 | 692,329 | — | none | ||||||||||||||||
| BPER |
Eur 3M + 2,52 | 12/31/2014 | unsecured loan | 1,000 | 1,000,000 | 1,000,000 | — | none | ||||||||||||||||
| BNL |
Eur 3M + 2,53 | 12/31/2014 | unsecured loan | 300 | 300,000 | 300,000 | — | none | ||||||||||||||||
| MPS |
Eur 3M + 2,54 | 12/31/2014 | unsecured loan | 500 | 500,000 | 500,000 | — | none | ||||||||||||||||
| BPER / UNICREDIT |
— | 12/31/2015 | deferred interest - Senior loan | 270 | 269,977 | 269,977 | — | none | ||||||||||||||||
| BPER / UNICREDIT |
Eur 6M + 2,36 | 1/30/2017 | Secured loan - Senior loan | 5,807 | 5,807,000 | 5,807,000 | — | pledge on shares | ||||||||||||||||
| BANCA ITALO ROMENA |
Eur 3M + 5% | 6/30/2015 | Secured loan | 800 | 802,451 | 802,451 | mortgage | |||||||||||||||||
| DEBT ISSUANCE COSTS |
— | 415,601 | ||||||||||||||||||||||
|
|
|
|
|
|
|
|||||||||||||||||||
| TOTAL |
80,138,754 | 78,920,702 | 802,451 | |||||||||||||||||||||
|
|
|
|
|
|
|
|||||||||||||||||||
As disclosed in the note related to the Going Concern assumption, the Group was not in compliance with covenants set out by the loan agreements as of December 31, 2013. The Group failed to make principal repayments due on certain loans payable outstanding at December 31, 2013, and, starting in July 2013, failed to make payments on interest accruing on a certain senior loan payable. This resulted in the Group defaulting on its loans payable to the creditor banks totaling Euro 78,921 thousand at December 31, 2013. Consequently, the balance in default has been reclassified to current financial payables in the consolidated financial statements.
The mortgage refers to the Oil & Steel S.p.A. factory located in S. Cesario sul Panaro (MO) The pledge refers to the 100% Oil & Steel S.p.A. and Pilosio S.p.A. shares, held by PM Group S.p.A.
Note 13 – Employee benefits
Movements on the employee severance indemnity / TFR provision during the period, including the effects of the actuarial valuation of the TFR, were as follows:
| (in Euro) |
31/12/12 | Reclass. Assets held for sale |
Increases | Decreases | 31/12/13 | |||||||||||||||
| Employee severance indemnity / TFR |
2,640,541 | -1,049,830 | 664,047 | 841,200 | 1,413,558 | |||||||||||||||
The estimates, demographic and economic/financial assumptions made, with the support of an independent actuary, for the actuarial calculation used to determine the defined benefit plans in relation to post-employment benefits (Employee severance indemnity provision) can be detailed as follows:
| Annual discount rate |
Annual rate of inflation |
Annual increase rate |
Probability of employee leaving Group |
Probability of advance payment of TFR | ||||
| 2.5% | 2% | 3% | 10% frequency | 3% |
PM GROUP
44
The amounts allocated to the Employee severance indemnity provision in 2013, 2012 and 2011 were € 664 thousand, € 809 thousand and € 769 thousand, respectively
A reconciliation of the defined benefit obligation is set out below:
| 2013 |
2012 |
|||||||||||
| Past Service Liability at Beginning of the period |
2,640,541 | 2,483,706 | ||||||||||
| Interest Cost |
(included in Statement of Income) | 66,545 | (included in Statement of Income) | 84,553 | ||||||||
| Actuarial (Gain)/Loss |
(included in Other Comprehensive income) | 17,435 | (included in Statement of Income) | 98,127 | ||||||||
| Payments |
-298,516 | -25,845 | ||||||||||
| Reclassification Liabilities held for sales |
-1,012,447 | |||||||||||
|
|
|
|||||||||||
| Past Service Liability at the end of the period |
1,413,558 | 2,640,541 | ||||||||||
|
|
|
|
|
|||||||||
| Actuarial gains and losses arising from changes in financial assumptions |
30,961 | 176,493 | ||||||||||
| Actuarial gains and losses arising from experience adjustment |
-13,526 | -78,366 | ||||||||||
|
|
|
|
|
|||||||||
| Actuarial (Gain)/Loss |
17,435 | 98,127 | ||||||||||
|
|
|
|
|
|||||||||
Employees in Italy are entitled to Trattamento di Fine Rapporto (“TFR,” commonly referred to as an employee leaving indemnity), which represents deferred compensation for employees in the private sector. Under Italian law, an entity is obligated to accrue for TFR on an individual employee basis payable to each individual upon termination of employment (including both voluntary and involuntary dismissal). The annual accrual is approximately 7% of total pay, with no ceiling, and is revalued each year by applying a preestablished rate of return of 1.50%, plus 75% of the Consumer Price Index, and is recorded by a book reserve. TFR is a plan unfunded.
In October 2006, the Italian Government passed a law, effective January 1, 2007, which reformed the current TFR system, in which employees are given the ability to make choices as to the destination of the investment of the TFR compensation. In particular, the new change allowed the employee to direct the TFR funds to a chosen pension fund, such as an industry fund, an existing company pension plan, open funds, and individual insurance policies, subject to Company agreement. If no choice was made, the TFR allocations were made automatically to the default pension fund, which may be the industry wide fund, a specific employer-sponsored plan, or, absent of these alternatives, the employee’s contributions were invested into a “residual” pension fund managed by the National Social Insurance Institute (INPS). Each Employee had until June 30, 2007 to make a decision as to the destination of his TFR allocation.
Note 14 – Provisions for risks and charges
Movements on provisions for risks and charges in 2013 and 2012 were as follows:
| (in Euro) |
01/01/13 | Reclass. Ass. dest. for sale |
Increases | Decreases | 31/12/13 | |||||||||||||||
| Product warranty provision |
835,000 | 0 | 569,746 | 553,746 | 851,000 | |||||||||||||||
| Prov. for retirement benefits & similar obligations |
174,537 | -99,061 | 6,012 | 682 | 80,806 | |||||||||||||||
| Other provisions |
81,866 | -81,866 | 505,519 | 0 | 505,519 | |||||||||||||||
|
|
|
|
|
|
|
|
|
|
|
|||||||||||
| Provisions for risks and charges |
1,091,403 | -180,927 | 1,081,277 | 554,428 | 1,437,325 | |||||||||||||||
|
|
|
|
|
|
|
|
|
|
|
|||||||||||
| (in Euro) |
01/01/12 | Increases | Decreases | 31/12/12 | ||||||||||||||||
| Product warranty provision |
786,000 | 631,587 | 582,587 | 835,000 | ||||||||||||||||
| Prov. for retirement benefits & similar obligations |
160,092 | 14,449 | 5 | 174,536 | ||||||||||||||||
| Other provisions |
62,642 | 1,503,139 | 1,483,914 | 81,867 | ||||||||||||||||
|
|
|
|
|
|
|
|
|
|||||||||||||
| Provisions for risks and charges |
1,008,734 | 2,149,175 | 2,066,506 | 1,091,403 | ||||||||||||||||
|
|
|
|
|
|
|
|
|
|||||||||||||
PM GROUP
45
The “Provision for retirement benefits and similar obligations” represents the potential liability towards agents in the event that the agency relationship is terminated by the Group companies or if the agents retire.
The “Provision for product warranty risks” has been used to cover the cost of repairs and assistance under warranty and has been updated based on estimated requirements.
The increases in “Other provisions” mainly regard amounts allocated for several legal claims against Group companies (specifically Euro 20 thousand for PM Group S.p.A. and Euro 460 thousand for subsidiary Oil & Steel S.p.A.).
The amounts allocated to Provisions for risks and charges in 2013, 2012 and 2011 totaled € 1,081 thousand, € 639 thousand and € 746 thousand, respectively.
Note 15 – Provision for deferred taxes
| (in Euro) |
1/1/2012 | Statement of Income |
31/12/2012 | |||||||||||||
| Accelerated depreciation |
94,742 | -9,655 | 85,087 | |||||||||||||
| Goodwill |
1,272,122 | 212,020 | 1,484,142 | |||||||||||||
| Amortization from merger |
704,460 | 0 | 704,460 | |||||||||||||
| TFR under IAS |
83,828 | -11,109 | 72,719 | |||||||||||||
| Out of period income due to change of rate |
-228,888 | 0 | -228,888 | |||||||||||||
| Leasehold improvements |
140,683 | 0 | 140,683 | |||||||||||||
| Finance leases (IAS 17) |
545,138 | 8,706 | 553,844 | |||||||||||||
| Reversal of depreciation of land/building O&S |
57,999 | 0 | 57,999 | |||||||||||||
| Other |
9,822 | 3,177 | 12,999 | |||||||||||||
|
|
|
|
|
|
|
|||||||||||
| Total |
2,679,906 | 203,139 | 2,883,045 | |||||||||||||
|
|
|
|
|
|
|
|||||||||||
| (in Euro) |
1/1/2013 | Statement of Income |
Reclass. Liabilities held for sale |
31/12/2013 | ||||||||||||
| Accelerated depreciation |
85,087 | -1,823 | 0 | 83,264 | ||||||||||||
| Goodwill |
1,484,142 | 212,021 | 0 | 1,696,163 | ||||||||||||
| Amortization from merger |
704,460 | 0 | 0 | 704,460 | ||||||||||||
| TFR under IAS |
72,719 | 0 | -6,661 | 66,058 | ||||||||||||
| Out of period income due to change of rate |
-228,888 | 0 | 0 | -228,888 | ||||||||||||
| Leasehold improvements |
140,683 | 0 | 0 | 140,683 | ||||||||||||
| Finance leases (IAS 17) |
553,844 | 0 | -48,270 | 505,574 | ||||||||||||
| Reversal of depreciation of land/building O&S |
57,999 | 0 | 0 | 57,999 | ||||||||||||
| Other |
12,999 | 0 | 0 | 12,999 | ||||||||||||
|
|
|
|
|
|
|
|
|
|||||||||
| Total |
2,883,045 | 210,198 | -54,931 | 3,038,312 | ||||||||||||
|
|
|
|
|
|
|
|
|
|||||||||
The deferred tax provision (Euro 3,038 thousand at December 31, 2013) largely relates to the deferral of gains realized on disposal of tangible assets held for more than three years, accelerated depreciation charged for tax purposes only until 2007 and the tax effects of the transition to IAS/IFRS.
PM GROUP
46
Current liabilities
Note 16 – Current financial payables
| (in Euro) |
31/12/2013 | 31/12/2012 | ||||||
| Bank overdrafts, loans, advance on invoice and notes |
20,734,487 | 17,437,089 | ||||||
| Current portion of loans payable |
78,920,702 | 76,948,205 | ||||||
| Payables to other lenders |
507,772 | 465,307 | ||||||
|
|
|
|
|
|||||
| Current financial payables |
100,162,961 | 94,850,601 | ||||||
|
|
|
|
|
|||||
Payables to other lenders represent the amount due within a year and they mainly refer to the current portion of Euro 238 thousand payable to Medioleasing (formerly Banca Marche) under the real estate finance lease entered into for the Oil & Steel factory in San Cesario sul Panaro (MO), Via Verdi 22 at December 31, 2013.
As further described in Note 12, the Group defaulted on its loans payable to the creditor banks totaling Euro 78,921 thousand at December 31, 2013. Consequently, the balance in default has been reclassified to current financial liabilities in the financial statements
The fair value of the current portion of loans payable is assumed to be equal to Euro 37,454 thousand plus n. 860 thousand of Manitex shares. The fair value was determined to be the residual value of current portion of loans payable at December 31, 2013 (Euro 78,921 thousand) resulting from the restructuring of the financial indebtedness of the Group upon completion of the Operation. Please refer to the note related to the going concern assumption for more details on terms of the Operation.
Note 17 – Liabilities for financial instruments and derivatives
| (in Euro) |
31/12/2013 | 31/12/12 | ||||||
| Interest rate hedges |
2,141,069 | 3,140,057 | ||||||
|
|
|
|
|
|||||
| Liabilities for financial instruments and derivatives |
2,141,069 | 3,140,057 | ||||||
|
|
|
|
|
|||||
The Group uses financial instruments available on the market (including derivatives) solely in order to minimize its cost of borrowing and hedge the risk of interest rate and exchange rate fluctuation.
On January 30, 2009, when it received a loan of Euro 76,500 thousand from BPER and UCB, the Group entered into the following contracts in order to hedge the related interest rate risk:
| • | A contract, signed by PM Group, for an original notional amount of Euro 20,000 thousand (unchanged at December 31, 2013 and 2012), maturing on February 3, 2017 with interest payable every January 31 and July 31 each year; PM Group pays interest at a rate of 3.48% and receives from the counterparty interest at the Euribor rate for the period in question |
| • | A contract, signed by PM Group for an original notional amount of Euro 8,496 thousand (Euro 3,558 thousand at December 31, 2013 and Euro 4,970 thousand at December 31, 2012), by Oil & Steel for an original notional amount of Euro 2,904 thousand (Euro 1,216 thousand at December 31, 2013 and Euro 1,698 thousand at December 31, 2012) and by Pilosio for an original notional amount of Euro 6,850 thousand (Euro 2,870 thousand at December 31, 2013 and Euro 4,007 thousand at December 31, 2012), maturing on December 31, 2016. Interest is payable every January 31 and July 31 each year. The Group companies pay interest at a rate of 2.99% and receive from the counterparty interest at the Euribor rate for the period in question. |
In accordance with IAS 32, IAS 39 and IFRS 7, these contracts have been recorded under “Liabilities for financial instruments and derivatives” (with a contra-entry to the Income Statement) in the amount of Euro 2,141 thousand which represents the fair value of the contracts at the reporting date. The change in fair value of these contracts is recorded in the financial income/expenses and exchange gains/losses captions of the Consolidated Statement of Income.
PM GROUP
47
At December 31, 2013, there were no transactions for the forward sale or purchase of currency.
Note 18 – Current tax payables
Current tax payables may be broken down as follows:
| (in Euro) |
31/12/2013 | 31/12/12 | ||||||
| IRAP/IRES and other taxes on income (net of payments on account) |
842,764 | 1,238,386 | ||||||
| VAT payable |
118,775 | 39,820 | ||||||
| Personal income tax of employees & consultants |
659,395 | 781,863 | ||||||
| Other current tax payables |
3,103 | 42,712 | ||||||
|
|
|
|
|
|||||
| Current tax payables |
1,624,037 | 2,102,781 | ||||||
|
|
|
|
|
|||||
Note 19 – Current trade payables
Current trade payables (including invoices to be received from suppliers) are analyzed as follows:
| (in Euro) |
31/12/2013 | 31/12/12 | ||||||
| Trade payables |
22,131,036 | 25,238,003 | ||||||
|
|
|
|
|
|||||
| Current trade payables |
22,131,036 | 25,238,003 | ||||||
|
|
|
|
|
|||||
Note 20 – Other current liabilities
Other current liabilities are analyzed as follows:
| (in Euro) |
31/12/2013 | 31/12/12 | ||||||
| Social security and pension conts payable |
644,655 | 1,140,485 | ||||||
| Payables to INAIL and other welfare entities |
25,107 | 58,402 | ||||||
| Payables to employees for accrued holiday pay |
253,416 | 424,950 | ||||||
| Customer bonuses |
37,740 | 37,740 | ||||||
| Payables to employees |
7,484 | 22,205 | ||||||
| Salaries payable |
1,772,560 | 1,112,919 | ||||||
| Payables to directors and statutory auditors |
160,498 | 249,705 | ||||||
| Employee bonuses |
50,000 | 148,750 | ||||||
| Payables to agents |
78,045 | 790,780 | ||||||
| Other current payables |
1,469,481 | 2,437,569 | ||||||
|
|
|
|
|
|||||
| Other current liabilities |
4,498,986 | 6,427,047 | ||||||
|
|
|
|
|
|||||
PM GROUP
48
“Other current payable” mainly includes liabilities towards customers for advances and deposits received, payables to insurance companies and remuneration payable under project based consulting contracts. INAIL is the public agency “Istituto Nazionale per l’Assicurazione degli Infortuni sul Lavoro”.
Sureties and guarantees
Information on sureties issued and guarantees at December 31, 2013 is provided below:
PM Business Unit:
Sureties issued by third parties in favor of third parties
These are guarantees issued in favor of third parties:
| • | Surety of Euro 220 thousand issued by B.N.L. in favor of a supplier in relation to the rental contract for the property in Via dell’Industria 8. |
| • | Sureties totaling Euro 495 thousand issued by BPER in favor of third parties in relation to proper fulfilment of contractual obligations. |
Oil & Steel Business Unit:
Sureties issued by third parties in favor of third parties
| • | Surety for a maximum amount of Euro 2,600 thousand issued by the Company’s banks in favor of Nissan Italia as a guarantee of due payment of purchases made by Oil & Steel from said company. At the reporting date, the Company had utilized the available guarantee facility in the amount of Euro 1,049 thousand. |
Operating leases
The following table contains details of the minimum operating lease payments due at December 31, 2013 and December 31, 2012. These contracts mainly relate to property and industrial equipment rental and to company car hire/rental.
| At 31 December 2013 | At 31 December 2012 | |||||||||||||||||||||||||||||||||
| (in Euro) |
within a year | between one and five years |
after more than five years |
31/12/2013 | within a year | between one and five years |
after more than five years |
31/12/2012 | ||||||||||||||||||||||||||
| Future minimum payments due under operating leases |
736,257 | 614,470 | 0 | 1,350,727 | 1,928,788 | 4,869,010 | 1,230,091 | 8,027,889 | ||||||||||||||||||||||||||
|
|
|
|
|
|
|
|
|
|
|
|
|
|
|
|
|
|||||||||||||||||||
| Total Operating lease commitments |
736,257 | 614,470 | 0 | 1,350,727 | 1,928,788 | 4,869,010 | 1,230,091 | 8,027,889 | ||||||||||||||||||||||||||
|
|
|
|
|
|
|
|
|
|
|
|
|
|
|
|
|
|||||||||||||||||||
PM GROUP
49
Comments on main Income Statement items
Note 21 – Revenue from operating activities
Revenue from operating activities is analyzed below:
| (in Euro) |
2013 | 2012 | 2011 | |||||||||
| Revenue from products |
75,715,695 | 81,736,949 | 74,228,796 | |||||||||
| Revenue from services |
2,574,312 | 7,332,856 | 2,633,145 | |||||||||
| Rental income |
145,939 | 121,117 | 246,587 | |||||||||
| Other revenue from operating activities |
163,445 | 308,653 | 348,376 | |||||||||
|
|
|
|
|
|
|
|||||||
| Revenue from operating activities |
78,599,391 | 89,499,575 | 77,456,904 | |||||||||
|
|
|
|
|
|
|
|||||||
The following table provides a breakdown of consolidated revenue from operating activities between sales in Italy and sales in Other countries:
| (in thousands of Euro) |
Balance at 31.12.13 |
Balance at 31.12.12 |
Balance at 31.12.11 |
Diff 2013 vs 2012 |
Diff 2012 vs 2011 |
|||||||||||||||||||||||||||||||||||
| Italy |
21,189 | 27 | % | 14,788 | 16.5 | % | 29,148 | 37.6 | % | 6,401 | 43.3 | % | -14,360 | -49.3 | % | |||||||||||||||||||||||||
| Other countries |
57,409 | 73 | % | 74,711 | 83.5 | % | 48,309 | 62.4 | % | -17,302 | -23.2 | % | 26,402 | 54.7 | % | |||||||||||||||||||||||||
|
|
|
|
|
|
|
|
|
|
|
|
|
|
|
|||||||||||||||||||||||||||
| Total Group |
78,599 | 89,500 | 77,457 | -10,900 | -12.2 | % | 12,044 | 15.5 | % | |||||||||||||||||||||||||||||||
|
|
|
|
|
|
|
|
|
|
|
|
|
|
|
|||||||||||||||||||||||||||
Note 22 – Other revenue and income
Other revenue and income are analyzed as follows:
| (in Euro) |
2013 | 2012 | 2011 | |||||||||
| Compensation for damages |
11,773 | 22,600 | 60,253 | |||||||||
| Gains on disposal |
17,562 | 15,108 | 62,767 | |||||||||
| Freight services |
1,099,065 | 1,346,257 | 801,292 | |||||||||
| Other |
685,281 | 705,869 | 747,870 | |||||||||
|
|
|
|
|
|
|
|||||||
| Other revenue and income |
1,813,681 | 2,089,834 | 1,672,182 | |||||||||
|
|
|
|
|
|
|
|||||||
“Freight Services” mainly includes revenues related to organization of freight service to customers. “Other” primarily includes sundry charges to customers.
Note 23 – Increases in non-current assets due to capitalization of internal costs
This caption regards the capitalization of materials, services and labor costs incurred for the internal construction of equipment and the development of new products, as shown in the following table:
| (in Euro) |
2013 | 2012 | 2011 | |||||||||
| Increases in industrial equipment |
26,929 | 133,490 | 155,479 | |||||||||
| Increases in development costs |
2,001,979 | 2,154,980 | 1,967,723 | |||||||||
|
|
|
|
|
|
|
|||||||
| Increases in non-current assets due to capitalisation of internal costs |
2,028,908 | 2,288,470 | 2,123,202 | |||||||||
|
|
|
|
|
|
|
|||||||
PM GROUP
50
2013
PM’s research and development activities focus on the introduction into the range and into production of a new series of high performance medium size cranes with lifting capacity of between 25 and 40 tonnes; these cranes represent a significant portion of the Company’s product range.
Some of the most significant activities have included completion of the design and development of a new high performance truck-mounted crane, the PM 150, which is PM’s top of the range model.
In 2013, Oil & Steel continued to develop and manufacture new platform models which were launched on the market during the year, as follows:
Snake 2612, a small-sized articulated telescopic platform installed on a 3.5 tonne vehicle, designed to meet specific high performance requirements combined with limited size and weight.
Octopus 23, a self-propelled tracked platform with high performance levels.
2012
PM’s research and development activities focused on the global preview at SAIE 2012 in October of the new high performance range of medium sized cranes with lifting capacity from 25 to 40 tonnes/m, which represent a very important segment in the Company’s product range.
Production and shipment on the market commenced in the first quarter of 2013 with volumes showing strong growth.
The Company completed all of the new range of fly-jibs with six hydraulic pistons, offering excellent lifting performance and which are now fitted on all models of crane from 100 tonne/m downwards.
Development of the new generation of electronic limiters was completed. These optimize performance of all models and make the work of operators more efficient and safer.
In 2012, Oil & Steel continued to develop and manufacture new platform models which were launched on the market during the year, as follows:
| - | The Snake 2312 Compact, a small-sized articulated telescopic platform installed on a 3.5 tonne vehicle, designed to meet specific high performance requirements combined with limited size. |
| - | The Snake 147, a highly compact articulated platform for installation on very light vehicles. |
Also, during 2012, two new aerial platform models were previewed at SAIE 2012 trade fair – they are respectively truck mounted and on caterpillar tracks and are for work at 26m and 23m.
2011
PM’s research and development activities focused on starting production and launching on the market the new high performance crane with lifting capacity of 100 tonnes/m. This enabled PM to enter a new market segment with a highly innovative product.
A new series of fly-jib models with six hydraulic pistons, offering excellent lifting performance, was introduced into the range to be fitted on all models of crane from 100 tonne/m downwards.
The new generation of electronic limiters has gradually been reduced on all products in the PM range. These optimize the performance of all models and render the work of operators more efficient and safer.
PM GROUP
51
In 2011, Oil & Steel continued to develop and manufacture new platform models which were launched on the market during the year, as follows:
| - | The Snake 2311 Compact, a small-sized articulated telescopic platform installed on a 3.5 tonne vehicle, designed to meet specific high performance requirements combined with limited size. |
| - | The Snake 2010 REL, an articulated telescopic platform with electrical/hydraulic controls, automatic stabilization and a home function. |
During the year, two important projects got underway to develop two new aerial platform models - respectively truck mounted and on caterpillar tracks and for work at 26m and 23m. They will be presented at the SAIE 2012 trade fair.
Note 24 - Cost of raw materials
Purchases of raw materials are analyzed as follows:
| (in Euro) |
2013 | 2012 | 2011 | |||||||||
| Finished goods |
6.712.683 | 10.185.411 | 14.893.576 | |||||||||
| Raw materials |
30.833.182 | 28.666.885 | 31.097.793 | |||||||||
| Packaging and consumable materials |
522.692 | 524.461 | 507.190 | |||||||||
| Change in inventory of raw materials and goods |
1.256.419 | 7.029.800 | -7.545.340 | |||||||||
|
|
|
|
|
|
|
|||||||
| Total Costs of raw material |
39.324.976 | 46.406.557 | 38.953.219 | |||||||||
|
|
|
|
|
|
|
|||||||
Most of the Group’s costs are incurred in Euro. Therefore, a breakdown of purchases of goods and other income statement expenses in foreign currency is not provided as it would not be significant.
Note 25 – Costs for services
Costs for services are analyzed as follows:
| (in Euro) |
2013 | 2012 | 2011 | |||||||||
| Outsourced production |
4,145,506 | 8,293,662 | 9,257,235 | |||||||||
| Transport/freight |
1,979,322 | 2,111,201 | 1,949,708 | |||||||||
| Agents’ commission |
495,553 | 1,324,890 | 973,176 | |||||||||
| Legal and consulting costs |
1,968,699 | 2,252,102 | 2,274,852 | |||||||||
| Utilities and other industrial services |
866,069 | 807,227 | 749,180 | |||||||||
| Insurance |
467,266 | 481,834 | 418,809 | |||||||||
| Repairs and maintenance |
260,259 | 255,447 | 310,508 | |||||||||
| Marketing, trade fairs and advertising |
715,758 | 689,598 | 667,074 | |||||||||
| Board of Statutory Auditors’ fees |
91,582 | 98,567 | 99,688 | |||||||||
| Other costs for services |
1,906,791 | 2,102,005 | 2,029,664 | |||||||||
| Technical assistance |
-34,002 | 154,218 | 82,654 | |||||||||
|
|
|
|
|
|
|
|||||||
| Costs for services |
12,862,803 | 18,570,751 | 18,812,548 | |||||||||
|
|
|
|
|
|
|
|||||||
PM GROUP
52
Note 26 – Personnel costs
| (in Euro) |
2013 | 2012 | 2011 | |||||||||
| Wages and salaries |
12,885,008 | 11,451,207 | 11,018,246 | |||||||||
| Directors’ remuneration and benefits |
278,335 | 251,647 | 320,225 | |||||||||
| Social contributions |
3,593,876 | 3,419,864 | 3,395,025 | |||||||||
| TFR, retirement benefits and similar |
664,047 | 809,302 | 768,960 | |||||||||
| Other costs |
499,939 | 565,411 | 558,953 | |||||||||
|
|
|
|
|
|
|
|||||||
| Personnel costs |
17,921,205 | 16,497,431 | 16,061,409 | |||||||||
|
|
|
|
|
|
|
|||||||
The Group’s average headcount, by employee category, is shown in the following table:
| 2013 | 2012 | 2011 | ||||||||||
| Managers |
12 | 12 | 14 | |||||||||
| Staff |
564 | 555 | 547 | |||||||||
|
|
|
|
|
|
|
|||||||
| Total |
576 | 567 | 561 | |||||||||
|
|
|
|
|
|
|
|||||||
Figures for the Pilosio BU are included for the sake of completeness. The related costs are included in the operating expenses detailed in Note 31.
Note 27 – Other operating expenses
Other operating expenses are analyzed as follows:
| (in Euro) |
2013 | 2012 | 2011 | |||||||||
| Rental of industrial and office buildings |
717,345 | 817,791 | 706,124 | |||||||||
| Operating leases |
411,289 | 421,367 | 344,358 | |||||||||
| Losses on disposals |
0 | 3,375 | 75,873 | |||||||||
| Taxes other than income taxes |
429,570 | 744,610 | 389,834 | |||||||||
| Bad debts |
-6,946 | 3,396 | 31,692 | |||||||||
| Other operating expenses |
981,656 | 808,771 | 1,170,197 | |||||||||
|
|
|
|
|
|
|
|||||||
| Other operating expenses |
2,532,914 | 2,799,310 | 2,718,078 | |||||||||
|
|
|
|
|
|
|
|||||||
Note 28 – Depreciation, amortization and impairment of non-current assets
| (in Euro) |
2013 | 2012 | 2011 | |||||||||
| Amortization of intangible assets |
1,415,326 | 1,753,123 | 1,536,844 | |||||||||
| Depreciation of tangible assets |
1,633,214 | 1,752,742 | 1,892,210 | |||||||||
| Impairment of tangible assets |
165,089 | 0 | 0 | |||||||||
| Impairment of development costs |
3,021,095 | 0 | 0 | |||||||||
| Impairment of goodwill |
14,871,056 | 0 | 0 | |||||||||
|
|
|
|
|
|
|
|||||||
| Depreciation, amortization and impairment of non-current assets |
21,105,780 | 3,505,865 | 3,429,054 | |||||||||
|
|
|
|
|
|
|
|||||||
PM GROUP
53
Reference should be made to Notes 2 and 3, respectively, for the impairment of development costs and goodwill.
Note 29 – Provisions
These may be analyzed as follows:
| (in Euro) |
2013 | 2012 | 2011 | |||||||||
| Increase of provision for bad debts |
486,788 | 481,614 | 880,221 | |||||||||
| Provisions for risks |
569,746 | 631,587 | 740,462 | |||||||||
| Other provisions |
511,041 | 7,075 | 6,004 | |||||||||
|
|
|
|
|
|
|
|||||||
| Total |
1,567,575 | 1,120,276 | 1,626,687 | |||||||||
|
|
|
|
|
|
|
|||||||
“Provisions for risks” essentially relate to amounts allocated to the product warranty provision (Euro 433 thousand for PM Group and Euro 137 thousand for Oil & Steel). “Other provisions” includes the amount allocated to the agents’ supplementary leaving indemnity provision (Euro 5 thousand by Oil&Steel SpA, Euro 1 thousand by PM Group) and amounts provided for several legal claims against Group companies (Euro 20 thousand by PM Group S.p.A., Euro 460 thousand by subsidiary Oil & Steel S.p.A. and Euro 25 thousand by subsidiary PM Oil & Steel France).
Note 30 – Financial income and expenses
| (in Euro) |
2013 | 2012 | 2011 | |||||||||
| Interest income on bank accounts |
4,632 | 13,032 | 8,489 | |||||||||
| Interest income from customers |
2,438 | 5,100 | 43,773 | |||||||||
| Income from derivatives |
794,388 | 0 | 0 | |||||||||
| Other financial income |
18,329 | 18,435 | 17,124 | |||||||||
|
|
|
|
|
|
|
|||||||
| Financial income |
819,787 | 36,567 | 69,386 | |||||||||
|
|
|
|
|
|
|
|||||||
| Financial expenses on loans and finance leases |
2,213,213 | 2,821,066 | 3,143,698 | |||||||||
| Financial expenses on current liabilities |
724,307 | 895,903 | 709,163 | |||||||||
| Financial expenses on derivatives |
767,617 | 1,313,004 | 1,364,745 | |||||||||
| Other interest and expenses |
104,642 | 704,572 | 158,493 | |||||||||
| Bank charges |
575,347 | 449,611 | 583,863 | |||||||||
|
|
|
|
|
|
|
|||||||
| Financial expenses |
4,385,126 | 6,184,156 | 5,959,962 | |||||||||
|
|
|
|
|
|
|
|||||||
| Exchange gains - realized |
378,876 | 538,229 | 469,101 | |||||||||
| Exchange gains - unrealized |
525,501 | 596,589 | 203,187 | |||||||||
| Exchange losses - realized |
1,258,200 | 1,755,723 | 488,489 | |||||||||
| Exchange losses - unrealized |
990,715 | 263,894 | 842,349 | |||||||||
|
|
|
|
|
|
|
|||||||
| Net exchange losses |
-1,344,538 | -884,799 | -658,550 | |||||||||
|
|
|
|
|
|
|
|||||||
| Financial income and expenses |
-4,909,877 | -7,032,388 | -6,549,126 | |||||||||
|
|
|
|
|
|
|
|||||||
PM GROUP
54
Note 31 – Taxes on income
Taxes on income are analyzed as follows:
| (in Euro) |
2013 | 2012 | 2011 | |||||||||
| Current IRAP |
271,770 | 957,555 | 401,526 | |||||||||
| Current IRES |
-714,989 | 262,423 | -187,843 | |||||||||
| Current foreign income taxes |
687 | 24,209 | 70,554 | |||||||||
|
|
|
|
|
|
|
|||||||
| Current taxes |
-442,532 | 1,244,187 | 284,237 | |||||||||
|
|
|
|
|
|
|
|||||||
| Deferred IRAP |
26,139 | 25,134 | 27,720 | |||||||||
| Deferred IRES |
184,059 | 180,408 | 194,171 | |||||||||
| Deferred taxes - foreign countries |
0 | 0 | 0 | |||||||||
|
|
|
|
|
|
|
|||||||
| Deferred taxes expense |
210,198 | 205,542 | 221,891 | |||||||||
|
|
|
|
|
|
|
|||||||
| Deferred tax income - IRAP |
-58,207 | 27,010 | 22,689 | |||||||||
| Deferred tax income - IRES |
-1,246,524 | 615,281 | 803,425 | |||||||||
| Deferred tax income - foreign countries |
91,539 | 281,273 | 0 | |||||||||
|
|
|
|
|
|
|
|||||||
| Deferred tax income |
-1,213,192 | 923,564 | 826,114 | |||||||||
|
|
|
|
|
|
|
|||||||
| Taxation |
980,858 | 526,165 | -319,986 | |||||||||
|
|
|
|
|
|
|
|||||||
Current taxes (I.RE.S. and I.R.A.P. for the Italian Group companies and equivalent taxes on income for foreign subsidiaries) refer to the tax charge calculated on the respective taxable income.
Deferred tax expenses have mainly been recognized in relation to accelerated depreciation and deferred gains on disposal.
Deferred tax income mainly relates to amounts allocated to taxed provisions and prior year tax losses.
The following table contains a reconciliation between the theoretical tax charge determined based on tax rates applicable in Italy for IRES (27.5%) and the effective tax charge:
| (in Euro) |
31/12/2013 | 31/12/2012 | 31/12/2011 | |||||||||
| Theoretical taxes on income |
-5,915,873 | -823,451 | -1,710,205 | |||||||||
| Tax effect of permanent differences and prior year taxes |
6,540,585 | 393,937 | 716,564 | |||||||||
|
|
|
|
|
|
|
|||||||
| Taxes on income (current and deferred) recorded in financial statements excluding IRAP (A) |
624,712 | -429,514 | -993,641 | |||||||||
|
|
|
|
|
|
|
|||||||
| IRAP (B) |
356,146 | 955,679 | 673,656 | |||||||||
|
|
|
|
|
|
|
|||||||
| Taxes on income recorded in financial statements (current and deferred) (A+B) |
980,858 | 526,165 | -319,985 | |||||||||
|
|
|
|
|
|
|
|||||||
IRAP has not been reconciled as its tax base is different than profit before taxation.
PM GROUP
55
In 2013, the difference between the effective rate of 5% and the theoretical rate was mainly due to the impairment adjustments of goodwill recorded in the Income Statement which were not deductible for income tax purposes because no tax charge was recorded upon recognition of the goodwill in question.
Tax effect of permanent differences and prior year taxes are analyzed as follows:
| (in Euro) |
2013 | 2012 | 2011 | |||||||||
| Impairment of Goodwill |
4,089,525 | 0 | 0 | |||||||||
| Impairment of Development Costs |
564,025 | 0 | 0 | |||||||||
| Inventory obsolescence |
208,450 | 0 | 0 | |||||||||
| Financial expenses not deductible |
148,225 | 0 | 0 | |||||||||
| Impairment of Deferred Tax Asset |
326,425 | 0 | 0 | |||||||||
| Taxes of previous year |
0 | 127,875 | 0 | |||||||||
| Net exchange losses |
0 | 0 | 90,750 | |||||||||
| Amortization not deductible |
0 | 0 | 65,725 | |||||||||
| Other |
1,203,935 | 266,062 | 560,089 | |||||||||
|
|
|
|
|
|
|
|||||||
| Total |
6,540,585 | 393,937 | 716,564 | |||||||||
|
|
|
|
|
|
|
|||||||
At December 31 2013 the Group has tax losses totaling Euro 2.900 thousand, for which it has not recognized any deferred tax assets.
Note 32 – Assets and liabilities held for sale. Profit/Loss from discontinued operations
The Group Consolidated Financial Statements, include the assets and liabilities of Pilosio S.p.A. and its subsidiaries. At December 31, 2013, a binding purchase commitment has been received from Columna in connection with the Operation, as previously described in the note related to the going concern assumption. The fulfilment of the purchase commitment is subject, among other things, to the definitive approval of the Agreement by the Court in Modena. The disposal price of Euro 1,000 thousand was based on management’s assessment, considering advice from an independent expert advisor and used to help determine the fair value of the assets held for sale included in the consolidated financial statements at December 31, 2013.
As a result of the above, the Consolidated Statement of Income includes “Profit/Loss from discontinued operations” related to the Pilosio BU, representing the after tax effect of the loss recorded upon the fair value measurement described in more detail in Note 2, partially offset by the profits of the discontinued operations, net of tax effects.
In accordance with IFRS 5, we provide below details of (i) the assets held for sale and the related liabilities at December 31, 2013, (ii) the items forming part of the discontinued operations/activities for the years ended December 31, 2013, 2012 and 2011, and (iii) the cash flow statement related to the discontinued operations for the years 2013, 2012 and 2011.
PM GROUP
56
ASSETS HELD FOR SALE
| (in thousands of Euro) | 2013 | 2012 | 2011 | |||||||||
| Revenue from operating activities |
46,044 | 36,363 | 27,959 | |||||||||
| Other revenue |
2,935 | 1,365 | 2,157 | |||||||||
| Operating expenses |
-45,245 | -33,505 | -26,562 | |||||||||
| Depreciation, amortization and writedowns |
-15,426 | -1,636 | -1,635 | |||||||||
| Financial income and expenses |
-1,901 | -1,150 | -1,123 | |||||||||
| Taxes in income |
-875 | -506 | -484 | |||||||||
| PROFIT/LOSS FROM DISCONTINUED OPERATIONS |
-14,468 | 931 | 312 | |||||||||
| (in thousands of Euro) |
31.12.2013 | 31.12.2012 | 31.12.2011 | |||||||||
| Cash flows generated by operating activities |
||||||||||||
| Loss for period before non-controlling interests |
(14,468 | ) | 931 | 312 | ||||||||
| Adjustments made in order to reconciile net loss with the cash flows generated by operating activities |
14,241 | 1,446 | 1,036 | |||||||||
| Operating profit (loss) before changes in working capital |
(227 | ) | 2,377 | 1,348 | ||||||||
| Effect of changes in assets and liabilities in net working capital |
1,681 | (2,577 | ) | (318 | ) | |||||||
|
|
|
|
|
|
|
|||||||
| Change in cash generated (absorbed) by operating activities (A) |
1,454 | (200 | ) | 1,030 | ||||||||
|
|
|
|
|
|
|
|||||||
| Cash flows generated (absorbed) by investing activities (B) |
(1,174 | ) | (1,056 | ) | (673 | ) | ||||||
|
|
|
|
|
|
|
|||||||
| Cash flows generated (absorbed) by operating activities after cash flows absorbed by investing activities (A-B) |
280 | (1,256 | ) | 357 | ||||||||
|
|
|
|
|
|
|
|||||||
| Cash flows (absorbed) generated by financing activities |
(815 | ) | 759 | (491 | ) | |||||||
|
|
|
|
|
|
|
|||||||
| Increase (decrease) in cash and cash equivalents |
(535 | ) | (497 | ) | (134 | ) | ||||||
|
|
|
|
|
|
|
|||||||
| Cash and cash equivalents at start of period |
604 | 1,101 | 1,235 | |||||||||
|
|
|
|
|
|
|
|||||||
| Cash and cash equivalents at end of period |
69 | 604 | 1,101 | |||||||||
|
|
|
|
|
|
|
|||||||
Note 33 – Fair Value measurement
IFRS 13 establishes a fair value hierarchy which classifies on three levels the inputs of the valuation techniques adopted to measure fair value. The fair value hierarchy gives highest priority to the quoted prices (unadjusted) on active markets for identical assets or liabilities (Level 1 inputs) and lowest priority to unobservable inputs (Level 3 inputs). In some cases, the inputs used to measure the fair value of an asset or liability could be classified on several levels of the fair value hierarchy. In such cases, the fair value measurement is classified entirely on the same hierarchy level where the lowest level input is classified, taking account of its importance for the valuation.
PM GROUP
57
The levels used in the hierarchy are:
| • | Level 1 inputs are quoted prices (unadjusted) on active markets for identical assets or liabilities that the entity can access at the measurement date; |
| • | Level 2 inputs are inputs other than quoted prices included within Level 1 that are observable for the asset or liability, either directly or indirectly; |
| • | Level 3 inputs are unobservable inputs for the asset or liability. |
The following table shows the fair value hierarchy of Assets and Liabilities measured at fair value at December 31, 2013:
| (in Euro) |
Level 1 | Level 2 | Level 3 | Total 31/12/2013 |
||||||||||||
| Liabilities for derivative financial instruments |
0 | -2,141,069 | 0 | -2,141,069 | ||||||||||||
| Assets held for sale |
0 | 0 | 44,640,884 | 44,640,884 | ||||||||||||
| Liabilities held for sale |
0 | 0 | -42,705,167 | -42,705,167 | ||||||||||||
|
|
|
|
|
|
|
|
|
|||||||||
| Total |
0 | -2,141,069 | 1,935,717 | -205,352 | ||||||||||||
|
|
|
|
|
|
|
|
|
|||||||||
For more details of the valuation of Liabilities for derivative financial instruments, see Note 17. Meanwhile, for Assets held for sale, reference should be made to the section on the main estimates made by Management. Liabilities for derivative financial instruments did not change fair value hierarchy between December 31, 2012 and December 31, 2013. There were no assets held for sale at December 31, 2012.
The fair value of Liabilities for derivative financial Instruments is included in Level 2 of the fair value hierarchy and has been estimated with discounted cash flows models. The main inputs used are forward interest rates (from observable yield curves at the end of the reporting period), and contract interest rates, discounted at a rate that reflects the credit risk of various counterparties.
The fair value of Assets and Liabilities held for sale is included in Level 3 of the fair value hierarchy and has been estimated with reference of the fixed price set for the sale of Pilosio S.p.A. and its subsidiary Electroelsa S.p.A., as disclosed in the note related to the Going Concern assumption.
For financial instruments represented by short-term receivables, payables, and financial payables for which the present value of future cash flows does not differ significantly from carrying value, the carrying value is a reasonable approximation of the fair value. In particular, the carrying amount of Current receivables, Other current assets and of Trade payables and Other current liabilities, approximates their fair value and as such are classified as Level 1 in the fair value hierarchy. The fair value of the financial payables has been disclosed in the Note 16.
For other Statement of Financial Position items valued based on the criteria set out in the Valuation Criteria section, the carrying amount represents a reasonable approximation of fair value at December 31, 2013.
PM GROUP
58
Note 34 – Management of financial risks
Interest rate risk
The interest rate risk is the risk of an uncontrolled increase in expenses resulting from payment of variable rates of interest on the Group’s medium/long-term borrowing.
The objective of interest rate risk management is to limit and stabilize the flow of interest paid on such borrowing.
Hedging is arranged whenever considered useful in relation to loans arranged. It is done by entering into Interest Rate Swaps. The time period of the hedge cannot go beyond the expiry date of the loan.
Any interest rate fluctuation could have significant effects in terms of increases or decreases in borrowing costs.
The risk regards financial instruments subject to variable rates of interest, as recorded in the Statement of Financial Position. All of the Company’s borrowing is at variable rates of interest so it is exposed to the risk of interest rate fluctuation.
In 2009, the Group entered into contracts to manage the interest rate risk.
The Group has also estimated the impact of a +/- 0.50% change in interest rates, assuming all other variables remain constant, based on the following criteria, as applied to the consolidated six-monthly average balance:
| • | The remuneration of liquidity which generates interest income depending in interbank rates was varied by +/- 0.50%; |
| • | Interest expenses on short and medium/term variable rate loans and on finance leases that include a clause index-linking the interest element of instalments were varied by +/- 0.50%; |
| • | The effects of fluctuation on derivatives used to manage the interest rate risk were not considered. In fact, increases or decreases in interest rates have a positive or negative impact on the mark to market value of the derivative instrument ( the portion hedged by IRA amounts to Euro 33.7 million); |
| • | The debt situation used for the purposes of the sensitivity analysis was at December 31, 2013. |
Based on the above assumptions, interest rate fluctuation would have a positive or negative effect on the Statement of Income of Euro 632 thousand (Euro 613 thousand on 2012 financial statements).
Exchange rate risk
The exchange rate risk is the risk that exchange rates might fluctuate negatively in the period between when the target exchange rate is defined – or when a commitment is made to collect or pay amounts in foreign currency on a future date – and the moment when such commitments are transformed first into orders and, then, into purchases or sales. As there are no transactions to hedge the exchange rate risk in relation to specific commercial transactions, hedge accounting is not used.
As the Group operates on international markets, it is exposed to the risk of exchange rate fluctuation.
Sales revenue is generally generated in Euro – or, at least, index linked to the Euro – except on the UK market and the US market where it is generated in GB Pounds (GBP) and US Dollars (USD), respectively. Sales on the South American market are also made in Chilean Pesos (CLP) and Argentinean Pesos (ARS).
Credit risk
Receivables are reported after the bad debt provision which is calculated based on the risk of default by debtors, as determined considering available information on the debtor’s ability to pay and taking historical data into account.
PM GROUP
59
The credit risk is the possibility that a debtor might cause an economic and financial loss by failing to fulfil a payment obligation.
Each PM Group company manages directly the credit risk in relation to its own customers.
There are no significant concentrations of credit risk within the Group.
Liquidity risk
The liquidity risk is the possibility that the Group might be incapable of raising the financial resources needed to guarantee its current operations and fulfil its obligations as they fall due.
Consequently, the PM Group
| • | periodically tests its forecast funding requirements based on operational requirements, in order to take prompt action to raise any additional resources needed, |
| • | performs all actions necessary to raise such resources, |
| • | manages an appropriate portfolio of credit facilities in terms of maturity, nature and level of availability. |
Note 12 contains a breakdown of payables by due date.
As highlighted in the earlier “Going Concern” section, at the date of preparation of the Group consolidated financial statements, the Group found itself in a situation where it was defaulting on its borrowing. In terms of Article 1456 of the Italian Civil Code, this would entitle the banks to terminate its loan agreements. The “Going Concern” section contains a description of the measures taken by the Group to deal with this situation. If said measures do not have a positive outcome, the Group would no longer be capable of meeting its debt repayment obligations.
San Cesario sul Panaro, December 1, 2014
| FOR THE BOARD OF DIRECTORS |
| THE PRESIDENT (Giuliano Asperti) |
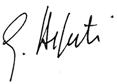
|
PM GROUP
60
Exhibit 99.2
UNAUDITED CONDENSED GROUP CONSOLIDATED FINANCIAL
STATEMENTS AS OF AND FOR THE NINE-MONTH ENDED
SEPTEMBER 30, 2014 AND 2013
PM GROUP
3
Condensed Consolidated Statement of Financial Position (unaudited)
| (in Euro) |
30/09/2014 | 31/12/2013 | ||||||||||
| NON-CURRENT ASSETS |
||||||||||||
| Tangible assets |
(1 | ) | 18,614,976 | 19,256,205 | ||||||||
| Goodwill |
(2 | ) | 33,192,959 | 33,192,959 | ||||||||
| Other intangible assets |
(3 | ) | 3,825,746 | 3,715,926 | ||||||||
| Investments in other entities |
1,560 | 1,560 | ||||||||||
| Deferred tax assets |
(4 | ) | 5,988,051 | 5,703,493 | ||||||||
| Other non-current assets |
140,870 | 161,832 | ||||||||||
|
|
|
|
|
|||||||||
| Total non-current assets |
61,764,162 | 62,031,975 | ||||||||||
|
|
|
|
|
|||||||||
| CURRENT ASSETS |
||||||||||||
| Inventory |
(5 | ) | 19,809,268 | 13,851,167 | ||||||||
| Trade receivables |
(6 | ) | 20,277,192 | 28,521,700 | ||||||||
| Current tax receivables |
3,059,867 | 2,066,842 | ||||||||||
| Dividends receivable |
300,000 | 300,000 | ||||||||||
| Cash and cash equivalents |
(7 | ) | 1,683,500 | 2,220,199 | ||||||||
| Other current assets |
1,720,205 | 1,570,414 | ||||||||||
|
|
|
|
|
|||||||||
| Total current assets |
46,850,032 | 48,530,322 | ||||||||||
|
|
|
|
|
|||||||||
| Assets held for sale |
(26 | ) | 46,798,757 | 44,640,884 | ||||||||
|
|
|
|
|
|||||||||
| TOTAL ASSETS |
155,412,950 | 155,203,181 | ||||||||||
|
|
|
|
|
|||||||||
| LIABILITIES AND SHAREHOLDERS’ EQUITY |
||||||||||||
| Share capital |
23,311,420 | 23,311,420 | ||||||||||
| Reserves |
-15,467 | -34,324 | ||||||||||
| Accumulated deficit |
-50,760,044 | -49,299,634 | ||||||||||
|
|
|
|
|
|||||||||
| Shareholders’ equity—Group |
-27,464,091 | -26,022,538 | ||||||||||
|
|
|
|
|
|||||||||
| Capital and reserves of non-controlling interests |
935,717 | 905,756 | ||||||||||
| Net profit (loss) attributable to non-controlling interests |
-131,310 | 29,961 | ||||||||||
| Shareholders’ equity attributable to non-controlling interests |
804,407 | 935,717 | ||||||||||
|
|
|
|
|
|||||||||
| TOTAL SHAREHOLDERS’ EQUITY |
-26,659,684 | -25,086,821 | ||||||||||
|
|
|
|
|
|||||||||
| NON-CURRENT LIABILITIES |
||||||||||||
| Non-current financial payables |
(8 | ) | 717,700 | 1,137,551 | ||||||||
| Employee benefits |
(9 | ) | 1,352,744 | 1,413,558 | ||||||||
| Provisions for risks and charges |
(10 | ) | 1,427,880 | 1,437,325 | ||||||||
| Deferred tax liabilities |
(11 | ) | 3,197,327 | 3,038,312 | ||||||||
|
|
|
|
|
|||||||||
| Total non-current liabilities |
6,695,651 | 7,026,746 | ||||||||||
|
|
|
|
|
|||||||||
| CURRENT LIABILITIES |
||||||||||||
| Current financial payables |
(12 | ) | 99,853,416 | 100,162,961 | ||||||||
| Liabilities for financial instruments and derivatives |
(13 | ) | 1,728,343 | 2,141,069 | ||||||||
| Current tax payables |
1,859,592 | 1,624,037 | ||||||||||
| Current trade payables |
(14 | ) | 23,046,403 | 22,131,036 | ||||||||
| Other current liabilities |
3,665,980 | 4,498,986 | ||||||||||
|
|
|
|
|
|||||||||
| Total current liabilities |
130,153,734 | 130,558,089 | ||||||||||
|
|
|
|
|
|||||||||
| Liabilities held for sale |
(26 | ) | 45,223,248 | 42,705,167 | ||||||||
|
|
|
|
|
|||||||||
| TOTAL LIABILITIES AND SHAREHOLDERS’ EQUITY |
155,412,950 | 155,203,181 | ||||||||||
|
|
|
|
|
|||||||||
PM GROUP
4
Condensed Consolidated Statement of income for the nine-month period ended September 30, 2014 and 2013 (unaudited)
| (in Euro) |
9 M 2014 | 9 M 2013 | ||||||||||
| Revenue from operating activities |
(15 | ) | 53,541,589 | 50,775,349 | ||||||||
| Other revenue and income |
(16 | ) | 1,470,589 | 1,243,245 | ||||||||
| Change in inventories or finished goods and work in progress |
2,249,274 | -590,896 | ||||||||||
| Increase in non-current assets due to capitalisation of internal costs |
(17 | ) | 886,388 | 1,557,402 | ||||||||
| Costs of raw material |
(18 | ) | -30,206,923 | -25,718,000 | ||||||||
| Services |
(19 | ) | -9,649,637 | -10,176,099 | ||||||||
| Personnel |
(20 | ) | -12,402,311 | -13,384,012 | ||||||||
| Other operating expenses |
(21 | ) | -1,452,021 | -1,968,510 | ||||||||
| Depreciation and amortisation |
(22 | ) | -1,943,126 | -2,526,532 | ||||||||
| Impairment of tangible assets |
(22 | ) | 0 | -158,024 | ||||||||
| Provisions |
(23 | ) | -45,374 | -49,452 | ||||||||
|
|
|
|
|
|||||||||
| Operating profit /(loss) |
2,448,447 | -995,531 | ||||||||||
|
|
|
|
|
|||||||||
| Financial income and exchange gains |
(24 | ) | 1,466,332 | 1,429,092 | ||||||||
| Financial expenses and exchange losses |
(24 | ) | -4,376,074 | -4,816,147 | ||||||||
|
|
|
|
|
|||||||||
| Loss before taxation |
-461,295 | -4,382,586 | ||||||||||
|
|
|
|
|
|||||||||
| Taxes on income |
(25 | ) | -770,222 | 468,422 | ||||||||
|
|
|
|
|
|||||||||
| Net Loss from continuing operations |
-1,231,516 | -3,914,164 | ||||||||||
|
|
|
|
|
|||||||||
| Profit (Loss) from discontinued operations |
(26 | ) | -360,204 | 364,152 | ||||||||
|
|
|
|
|
|||||||||
| Net Loss for the period |
-1,591,720 | -3,550,012 | ||||||||||
|
|
|
|
|
|||||||||
| Profit (Loss) attributable to non-controlling interests |
-131,310 | 43,978 | ||||||||||
|
|
|
|
|
|||||||||
| Net Loss attributable to the Group |
-1,460,410 | -3,593,990 | ||||||||||
|
|
|
|
|
|||||||||
PM GROUP
5
Condensed Consolidated statement of comprehensive income for the nine-month period ended September 30, 2014 and 2013 (unaudited)
| (in Euro) |
30/09/2014 | 30/09/2013 | ||||||
| Net Loss for the period (A) |
(1,591,720 | ) | (3,550,012 | ) | ||||
|
|
|
|
|
|||||
| Gains/(losses) from translation into Euro of financial statements of foreign entities |
18,857 | (4,286 | ) | |||||
|
|
|
|
|
|||||
| Total other items of comprehensive income that will be recycled through the income statement, net of tax effect (b1) |
18,857 | (4,286 | ) | |||||
|
|
|
|
|
|||||
| Actuarial gains/(losses) from defined benefit plans |
0 | 0 | ||||||
|
|
|
|
|
|||||
| Total other items of comprehensive income that will not subsequently be recycled through the income statement, net of tax effect (b2) |
0 | 0 | ||||||
|
|
|
|
|
|||||
| Total other items of comprehensive income, net of tax effect (b1) + (b2) = (B) |
18,857 | (4,286 | ) | |||||
|
|
|
|
|
|||||
| Total comprehensive (loss) for the period (A)+(B) |
(1,572,863 | ) | (3,554,298 | ) | ||||
|
|
|
|
|
|||||
| Total comprehensive income (loss) attributable to non-controlling interests |
(131,310 | ) | 43,978 | |||||
|
|
|
|
|
|||||
| TOTAL COMPREHENSIVE (LOSS) ATTRIBUTABLE TO THE GROUP |
(1,441,553 | ) | (3,598,276 | ) | ||||
|
|
|
|
|
|||||
PM GROUP
6
Condensed Consolidated Statement of changes in equity (unaudited)
| (in Euro) |
Share capital |
Translation reserve |
Reserve under IAS 19 |
Total reserves |
Accumulated Deficit |
Shareholders’ equity - Group |
Capital and reserves of non-controlling interests |
Accumulated Profit/(Loss) attributable to non-controlling interests |
Shareholders’ equity of non-controlling interests |
TOTAL SHAREHOLDERS’ EQUITY |
||||||||||||||||||||||||||||||
| Shareholders’ equity at 01/01/2013 |
23,311,420 | (185,689 | ) | 0 | (185,689 | ) | (12,360,008 | ) | 10,765,723 | 983,204 | (56,954 | ) | 926,250 | 11,691,973 | ||||||||||||||||||||||||||
| Movement on translation reserve |
0 | (4,286 | ) | 0 | (4,286 | ) | 0 | (4,286 | ) | 1,891 | 0 | 1,891 | (2,395 | ) | ||||||||||||||||||||||||||
| Effect of Acquisition of 41% of Air Service |
0 | 0 | 0 | 0 | 0 | 0 | (13,494 | ) | 0 | (13,494 | ) | (13,494 | ) | |||||||||||||||||||||||||||
| Loss for period ended September 30, 2013 |
0 | 0 | 0 | 0 | (3,593,990 | ) | (3,593,990 | ) | 0 | 43,978 | 43,978 | (3,550,012 | ) | |||||||||||||||||||||||||||
|
|
|
|
|
|
|
|
|
|
|
|
|
|
|
|
|
|
|
|
|
|||||||||||||||||||||
| Shareholders’ equity at 30/09/2013 |
23,311,420 | (189,975 | ) | 0 | (189,975 | ) | (15,953,998 | ) | 7,167,447 | 971,601 | (12,976 | ) | 958,625 | 8,126,072 | ||||||||||||||||||||||||||
|
|
|
|
|
|
|
|
|
|
|
|
|
|
|
|
|
|
|
|
|
|||||||||||||||||||||
| Shareholders’ equity at 01/01/2014 |
23,311,420 | (16,889 | ) | (17,435 | ) | (34,324 | ) | (49,299,634 | ) | (26,022,538 | ) | 962,710 | (26,993 | ) | 935,717 | (25,086,821 | ) | |||||||||||||||||||||||
|
|
|
|
|
|
|
|
|
|
|
|
|
|
|
|
|
|
|
|
|
|||||||||||||||||||||
| Movement on translation reserve |
0 | 18,857 | 0 | 18,857 | 0 | 18,857 | 0 | 0 | 0 | 18,857 | ||||||||||||||||||||||||||||||
| Loss for period ended September 30, 2014 |
0 | 0 | 0 | 0 | (1,460,410 | ) | (1,460,410 | ) | 0 | (131,310 | ) | (131,310 | ) | (1,591,720 | ) | |||||||||||||||||||||||||
|
|
|
|
|
|
|
|
|
|
|
|
|
|
|
|
|
|
|
|
|
|||||||||||||||||||||
| Shareholders’ equity at 30/09/2014 |
23,311,420 | 1,968 | (17,435 | ) | (15,467 | ) | (50,760,044 | ) | (27,464,091 | ) | 962,710 | (158,303 | ) | 804,407 | (26,659,684 | ) | ||||||||||||||||||||||||
|
|
|
|
|
|
|
|
|
|
|
|
|
|
|
|
|
|
|
|
|
|||||||||||||||||||||
PM GROUP
7
Condensed Consolidated Statement of cash flows for the nine-month period ended September 30, 2014 and 2013 (unaudited)
| (in Euro) |
9 M 2014 | 9 M 2013 | ||||||
| Cash flows generated by operating activities |
| |||||||
| Net Loss for period |
(1,591,720 | ) | (3,550,012 | ) | ||||
| Adjustments made in order to reconciile net loss with the cash flows generated by operating activities |
||||||||
| - Depreciation and amortization |
2,801,958 | 3,425,856 | ||||||
| - Impairment |
0 | 158,024 | ||||||
| - Deferred tax/Deferred tax income |
(261,454 | ) | (659,167 | ) | ||||
| - Expenses on derivatives |
(471,609 | ) | (968,618 | ) | ||||
| - Financial income recognized in Statement of Income |
(235,625 | ) | (399,484 | ) | ||||
| - Finance costs recognised in Statement of Income |
4,376,442 | 5,529,618 | ||||||
| - Change in Employee Severance Indemnity Provision and other employee benefits |
(55,083 | ) | (85,068 | ) | ||||
| Operating profit before changes in working capital |
4,562,909 | 3,451,149 | ||||||
| Effect of changes in assets and liabilities in net working capital |
||||||||
| - Trade receivables |
5,946,029 | (4,544,166 | ) | |||||
| - Inventory |
(6,230,700 | ) | (3,435,372 | ) | ||||
| - Other current assets |
(146,726 | ) | 269,889 | |||||
| - Trade payables |
1,805,405 | 7,932,634 | ||||||
| - Other current liabilities |
(59,976 | ) | 638,771 | |||||
| - Tax receivables |
(374,417 | ) | (965,155 | ) | ||||
| - Tax payables |
321,645 | 527,432 | ||||||
| - Taxes paid during the period |
(420,171 | ) | (230,892 | ) | ||||
| - Other non current assets |
5,673 | 10,851 | ||||||
| - Provisions for risks and charges |
418,624 | (19,168 | ) | |||||
|
|
|
|
|
|||||
| Cash generated by operating activities (A) |
5,828,295 | 3,635,973 | ||||||
|
|
|
|
|
|||||
| Cash flows generated (absorbed) by investing activities |
||||||||
| - Payments for property, plant and equipment |
(622,801 | ) | (749,127 | ) | ||||
| - Proceeds from disposal of property, plant and equipment |
57,501 | 393,948 | ||||||
| - Payments for intangible assets |
(1,379,740 | ) | (1,869,195 | ) | ||||
| - Interest received |
6,657 | 3,054 | ||||||
|
|
|
|
|
|||||
| Change in cash absorbed by investing activities (B) |
(1,938,383 | ) | (2,221,320 | ) | ||||
|
|
|
|
|
|||||
| Cash flows generated by operating activities after cash flows absorbed by investing activities (A-B) |
3,889,912 | 1,414,653 | ||||||
|
|
|
|
|
|||||
| Cash flows (absorbed) generated by financing activities |
||||||||
| Short term financial payables and derivatives arranged (repaid) |
(2,202,430 | ) | 3,003,998 | |||||
| Medium/long term financial payables and derivatives arranged (repaid) |
(936,884 | ) | (438,481 | ) | ||||
| Interest paid |
(1,281,699 | ) | (3,842,894 | ) | ||||
| Share capital increase and reserves paid in cash |
0 | (13,494 | ) | |||||
|
|
|
|
|
|||||
| Change in cash absorbed by financing activities |
(4,421,013 | ) | (1,290,871 | ) | ||||
|
|
|
|
|
|||||
| Movement on translation reserve |
18,857 | (2,395 | ) | |||||
| Increase (decrease) in cash and cash equivalents |
(512,244 | ) | 121,387 | |||||
|
|
|
|
|
|||||
| Cash and cash equivalents at start of period |
2,220,199 | 2,217,357 | ||||||
|
|
|
|
|
|||||
| Cash and cash equivalents classified as assets held for sale at beginning of the period |
69,668 | |||||||
| Cash and cash equivalents classified as assets held for sale at end of the period |
94,123 | |||||||
|
|
|
|
|
|||||
| Cash and cash equivalents at end of period |
1,683,500 | 2,338,744 | ||||||
|
|
|
|
|
|||||
PM GROUP
8
EXPLANATORY NOTES
General information
PM Group S.p.A. (the “Parent Company” or “Company” or “PM”) is a company which is subject to the laws of the Italian Republic. PM Group S.p.A. and its subsidiaries (“PM Group” or “Group”) operate primarily in Italy, France, Spain, Chile, Romania, Argentina and the United States of America. The Group manufactures: (i) truck mounted hydraulic knuckle boom cranes (“Business Unit PM”), (ii) truck mounted aerial platforms (“Business Unit Oil & Steel”) and (iii) structure, like scaffolding, formworks for walls and slabs (“Business Unit Pilosio”).
Structure and content of the condensed consolidated financial statements
The unaudited interim group condensed consolidated financial statements to which these explanatory notes relate (hereinafter: the “Interim Group Condensed Consolidated Financial Statements”) include: (i) the statements of income, comprehensive income, changes in equity and cash flows for the period ended September 30, 2014 and 2013 and (ii) the statements of financial position as of September 30, 2014 and December 31, 2013. The Interim Group Condensed Consolidated Financial Statements have been prepared in accordance with International Accounting Standard (“IAS”) 34 “Interim Financial Reporting”, as issued by the International Accounting Standard Board (“IASB”). The financial statements were authorized and approved on February 13, 2014 by Board of Directors. This basis of preparation was considered best to represent the balance sheet, income statement and financial situation of the Company and the Group:
| • | Statement of financial position prepared with current assets/liabilities classified separately from non-current assets/liabilities; |
| • | Statement of income costs classified based on their nature; |
| • | Statement of cash flows prepared under the indirect method. |
PM GROUP
9
Group organizational structure
The chart below shows the Group’s organizational structure as at September 30, 2014:
Significant Accounting Policies
Basis of preparation
Our interim Condensed Consolidated Financial Statements are unaudited. In the opinion of Group management, the financial statements include all known adjustments (which consist primarily of normal, recurring accruals, estimates and assumptions that impact the financial statements) necessary to present fairly the financial position at the balance sheet dates and the results of operations for the nine-month period then ended. The Condensed Consolidated Balance Sheet at December 31, 2013, presented herein, has been derived from our audited balance sheet included in our Group Consolidated Financial Statements for the fiscal year ended December 31, 2013, but does not include all disclosures required by IFRS. These financial statements should be read in conjunction with the Group consolidated financial statements and the related notes at December 31, 2013, which have been prepared in accordance with International Financial Reporting Standards (“IFRS”) as issued by the International Accounting Standards Board (“IASB”). The designation “IFRS” also includes all valid International Accounting Standards (“IAS”), as well as all interpretations of the IFRS Interpretation Committee, previously known as the International Financial Reporting Interpretations Committee (“IFRIC”), and before that the Standing Interpretations Committee (“SIC”). The results of operations for the nine-months ended September 30, 2014 are not necessarily indicative of operating results for the full year.
PM GROUP
10
These condensed consolidated financial statements have been presented in Euro which is the main currency in the countries where the PM Group companies conduct their business. A summary of the Group’s significant accounting policies is identified in the explanatory notes to the Group Consolidated Financial Statements at December 31, 2013. There have been no changes to the Group’s significant accounting policiies in the nine-month period ended September 30, 2014.
Foreign currencies
Financial statements expressed in currencies other than the Euro are translated into Euro. The exchange rates applied for 2014 and 2013 are shown below:
| 30/09/2014 |
||||||||
| Currency | Closing | Average | ||||||
| US Dollar |
1.26 | 1.36 | ||||||
| Romanian Lei |
4.41 | 4.45 | ||||||
| GB Pound |
0.78 | 0.81 | ||||||
| Chilean Peso |
755.46 | 760.32 | ||||||
| Argentinean Peso |
10.65 | 10.82 | ||||||
| Brazilian Real |
3.08 | 3.10 | ||||||
| Mexican Peso |
17.00 | 17.78 | ||||||
| 30/09/2013 |
||||||||
| Currency | Closing | Average | ||||||
| US Dollar |
1.35 | 1.32 | ||||||
| Romanian Lei |
4.46 | 4.41 | ||||||
| GB Pound |
0.84 | 0.85 | ||||||
| Chilean Peso |
682.17 | 643.17 | ||||||
| Argentinean Peso |
7.82 | 6.95 | ||||||
| Brazilian Real |
3.04 | 2.79 | ||||||
A full list of the investments included in the scope of consolidation at September 30, 2014 with details of shareholders’ equity and profit/loss for the period calculated in accordance with the applicable accounting standards is shown in the following table:
PM GROUP
11
Consolidated companies:
| Name |
Location |
Country | Share Capital (local currency/000) |
Shareholders’ equity (Euro/000) |
Including profit (loss) for 2013 (Euro/000) |
% interest held | ||||||||||
| 1 | PM Group | San Cesario sul Panaro | Italy | EUR | 23,311 | (25,921) | 557 | |||||||||
| 2 | Autogru PM RO | Arad | Romania | RON | 8,482 | 2,194 | 1 | 100.00% | ||||||||
| 3 | PM North America | Rolling Meadows, Ill | USA | USD | 25 | 112 | (1) | 100.00% | ||||||||
| 4 | PM France | Chassieu | France | EUR | 150 | (374) | (6) | 100.00% | ||||||||
| 5 | PM Argentina | Buenos Aires | Argentina | ARS | 60 | 238 | 25 | 100.00% | ||||||||
| 6 | PM Deutschland | Ulm | Germany | EUR | 25 | 34 | 1 | 100.00% | ||||||||
| 7 | PM Chile | Santiago | Chile | CLP | 19,742 | (749) | (603) | 100.00% | ||||||||
| 8 | Oil & Steel | San Cesario sul Panaro | Italy | EUR | 362 | (6,529) | (917) | 100.00% | ||||||||
| 9 | PM Oil & Steel UK | London | UK | GBP | 300 | (9) | 2 | 100.00% | ||||||||
| 10 | PM Oil & Steel France | Chassieu | France | EUR | 35 | (193) | (80) | 100.00% | ||||||||
| 11 | PM Oil & Steel Iberica | Valencia | Spain | EUR | 200 | 61 | (42) | 100.00% | ||||||||
| 12 | Air Service | Modena | Italy | EUR | 115 | 31 | (46) | 100.00% | ||||||||
| 13 | Pilosio | Feletto Umberto | Italy | EUR | 5,000 | 1,154 | (32) | 100.00% | ||||||||
| 14 | Electroelsa | Poggibonsi | Italy | EUR | 400 | 2,011 | (328) | 60.00% | ||||||||
| 15 | PM Oil & Steel do Brasil | Sao Paulo | Brazil | BRL | 600 | 183 | (5) | 100.00% | ||||||||
| 16 | PM Oil & Steel Mexico | Mexico City | Mexico | MXN | 350 | (51) | (63) | 100.00% | ||||||||
All Group companies are consolidated on a line-by-line basis.
At September 30, 2014, there were no changes to the scope of consolidation or to the percentage interests held in subsidiaries at December 31, 2013.
Going Concern
As disclosed in the Group Consolidated Financial Statements at December 31, 2013, in 2014, Management finalized an operation (the “Operation”) intended to restructure the financial indebtedness of the Group and restore the equity level. The Operation was to be implemented in accordance with Article 182 bis of the Bankruptcy Act and finalized on July 2014.
The main terms of the Operation have been included in Commitment Letters signed by Columna and Manitex, as well as in the PM Group and Oil & Steel Debt Restructuring Agreement signed by the creditor banks (collectively the “Agreement”). On November 18, 2014, the Courts in Modena approved the Agreement.
On January 15, 2015 Manitex completed the acquisition of PM Group and made a capital contribution of Euro 44.5 million in accordance with the terms of the Operation. On January 15, 2015, the sale of Pilosio was completed.
In view of the expected impact of the Operation and taking into account the difficult conditions in some of its main markets, the Group has prepared a new Business Plan for the period 2014 – 2017, which was approved by the holding company Board of Directors on June 10, 2014. The new Business Plan forecasts sufficient cash flows to meet the Group’s remaining obligations following the completion of the Operation.
After having evaluated the uncertainty regarding the economic environment, and the resulting uncertainty which inevitably affects the forecasts reflected in the Business Plan in relation to the Group’s future operating performance (in terms of both revenue and profitability), given the progress of the Operation, Management considers it probable that the Group’s economics and financial situation will be improved. For these reasons, Management reasonably believes that the Group has sufficient resources to continue to operate in the near future and, therefore, have prepared these condensed consolidated financial statements on a going concern basis.
PM GROUP
12
Recently Adopted Accounting Standards and Amendments
The Group has adopted the new standards and amendments, that are applicable from January 1, 2014, in the preparation of its unaudited interim condensed consolidated financial statements; their application did not have any effect on the unaudited interim condensed consolidated financial statements.
Comments on items in the Statement of Financial Position
ASSETS
Note 1—Tangible assets
The following tables show the opening balances, movements during the period ended September 30, 2014 and the closing balances for tangible assets:
| (in Euro) |
01/01/14 | Exchange difference |
Additions | Disposals | Reclassification | Depreciation | 30/09/14 | |||||||||||||||||||||
| Cost |
||||||||||||||||||||||||||||
| Land |
4,683,525 | 5,246 | 0 | 0 | 0 | 0 | 4,688,771 | |||||||||||||||||||||
| Buildings |
18,595,512 | 21,771 | 24,835 | 0 | 0 | 0 | 18,642,118 | |||||||||||||||||||||
| Plant and machinery |
9,119,979 | 36,433 | 155,700 | 47,336 | 3,257 | 0 | 9,268,033 | |||||||||||||||||||||
| Industrial and commercial equipment |
8,241,562 | 11,515 | 129,463 | 84,031 | 10,388 | 0 | 8,308,897 | |||||||||||||||||||||
| Other assets |
4,225,103 | -14,672 | 92,055 | 472,352 | -1,124 | 0 | 3,829,010 | |||||||||||||||||||||
| Assets under construction and payments on advance |
13,667 | 203 | 59,462 | 0 | -13,645 | 0 | 59,687 | |||||||||||||||||||||
|
|
|
|
|
|
|
|
|
|
|
|
|
|
|
|||||||||||||||
| Total Cost of Tangible Assets |
44,879,348 | 60,496 | 461,515 | 603,719 | -1,124 | 0 | 44,796,516 | |||||||||||||||||||||
|
|
|
|
|
|
|
|
|
|
|
|
|
|
|
|||||||||||||||
| (in Euro) |
01/01/14 | Exchange difference |
Additions | Disposals | Reclass. | Depreciation | 30/09/14 | |||||||||||||||||||||
| Accumulated depreciation and impairment |
||||||||||||||||||||||||||||
| Land |
0 | 0 | 0 | 0 | 0 | 0 | 0 | |||||||||||||||||||||
| Buildings |
6,479,062 | 38 | 0 | 0 | 0 | 447,653 | 6,926,753 | |||||||||||||||||||||
| Plant and machinery |
7,540,939 | 25,940 | 0 | 45,029 | 0 | 312,582 | 7,834,432 | |||||||||||||||||||||
| Industrial and commercial equipment |
7,947,233 | 9,292 | 0 | 84,031 | 0 | 149,606 | 8,022,100 | |||||||||||||||||||||
| Other assets |
3,655,909 | -1,106 | 0 | 444,452 | -1,124 | 189,028 | 3,398,255 | |||||||||||||||||||||
|
|
|
|
|
|
|
|
|
|
|
|
|
|
|
|||||||||||||||
| Total accumulated depreciation and impairment of tangible asset |
25,623,143 | 34,164 | 0 | 573,512 | -1,124 | 1,098,869 | 26,181,540 | |||||||||||||||||||||
|
|
|
|
|
|
|
|
|
|
|
|
|
|
|
|||||||||||||||
| Net Book Value |
19,256,205 | 26,332 | 461,515 | 30,207 | 0 | -1,098,869 | 18,614,976 | |||||||||||||||||||||
|
|
|
|
|
|
|
|
|
|
|
|
|
|
|
|||||||||||||||
PM GROUP
13
Note 2—Goodwill
| (in Euro) |
30/09/14 | 31/12/13 | ||||
| Beginning balance |
33,192,959 | 68,142,670 | ||||
|
|
|
|
||||
| Reclassification of Asset held for sale |
0 | -20,078,655 | ||||
| Impairment |
0 | -14,871,056 | ||||
|
|
|
|
||||
| Ending balance |
33,192,959 | 33,192,959 | ||||
|
|
|
|
||||
As there were no indicators of a possible loss in value at September 30, 2014, compared with the previous evaluation, it was not necessary to carry out a new impairment test.
Note 3—Other intangible assets
The following tables show the opening balances, movements during the period ended September 30, 2014 and the closing balances for other intangible assets:
| (in Euro) |
01/01/14 | Exchange difference |
Additions | Reclassification | Amortization | 30/09/14 | ||||||||||||||||||
| Cost |
||||||||||||||||||||||||
| Development costs |
13,108,394 | 20 | 0 | 89,147 | 0 | 13,197,561 | ||||||||||||||||||
| Patents and intellectual property rights |
1,932,970 | 1 | 78,893 | 0 | 0 | 2,011,864 | ||||||||||||||||||
| Concessions, licences, trademarks and similar |
89,024 | 611 | 465 | 0 | 0 | 90,100 | ||||||||||||||||||
| Assets in progress and payments on advance |
983,629 | 0 | 874,213 | -89,147 | 0 | 1,768,695 | ||||||||||||||||||
| Other |
280 | 0 | 90 | 0 | 0 | 370 | ||||||||||||||||||
|
|
|
|
|
|
|
|
|
|
|
|
|
|||||||||||||
| Total |
16,114,297 | 632 | 953,661 | 0 | 0 | 17,068,590 | ||||||||||||||||||
|
|
|
|
|
|
|
|
|
|
|
|
|
|||||||||||||
| (in Euro) |
01/01/14 | Exchange difference |
Additions | Reclassification | Amortization | 30/09/14 | ||||||||||||||||||
| Accumulated amortisation and impairment |
||||||||||||||||||||||||
| Development costs |
10,231,479 | 21 | 0 | 0 | 713,525 | 10,945,025 | ||||||||||||||||||
| Patents and intellectual property rights |
1,461,690 | 0 | 0 | 0 | 129,560 | 1,591,250 | ||||||||||||||||||
| Concessions, licences, trademarks and similar |
57,094 | 195 | 0 | 0 | 1,116 | 58,405 | ||||||||||||||||||
| Assets in progress and payments on advance |
648,052 | 0 | 0 | 0 | 0 | 648,052 | ||||||||||||||||||
| Other |
56 | 0 | 0 | 0 | 56 | 112 | ||||||||||||||||||
|
|
|
|
|
|
|
|
|
|
|
|
|
|||||||||||||
| Total |
12,398,371 | 216 | 0 | 0 | 844,257 | 13,242,844 | ||||||||||||||||||
|
|
|
|
|
|
|
|
|
|
|
|
|
|||||||||||||
| Net Book Value |
3,715,926 | 416 | 953,661 | 0 | -844,257 | 3,825,746 | ||||||||||||||||||
|
|
|
|
|
|
|
|
|
|
|
|
|
|||||||||||||
Capitalized development costs relate to new products, as described in Note 17 below.
Assets in progress, at their completion, are amortized over five years, being the estimated useful life of the Group’s new products without any significant restyling processes.
PM GROUP
14
Note 4—Deferred tax assets
Management consider these deferred tax assets recoverable on the basis of the future profits contained in the Business Plan.
| (in Euro) |
31/12/2013 | Statement of Income |
30/09/2014 | |||||||||
| Provisions for risks and charges |
135,962 | 5,047 | 141,009 | |||||||||
| Inventory |
706,031 | 68,338 | 774,369 | |||||||||
| Provision for bad debts |
273,354 | 4,400 | 277,754 | |||||||||
| Provision for losses on derivatives |
576,023 | -106,424 | 469,599 | |||||||||
| Tax losses |
509,534 | 80,069 | 589,603 | |||||||||
| Interest expenses |
3,495,267 | 228,028 | 3,723,295 | |||||||||
| Other |
7,322 | 5,100 | 12,422 | |||||||||
|
|
|
|
|
|
|
|||||||
| Deferred tax assets |
5,703,493 | 284,558 | 5,988,051 | |||||||||
|
|
|
|
|
|
|
|||||||
Note 5—Inventory
For details of changes in each inventory category, see the figures highlighted in the Income Statement.
The following tables contain a breakdown of net inventory by category and movements on the inventory obsolescence provision (deducted directly from inventory):
| (in Euro) |
30/09/2014 | 31/12/2013 | ||||||
| Raw, ancillary and consumable materials |
14,067,616 | 10,162,235 | ||||||
| Work in progress |
635,845 | 680,084 | ||||||
| Semi-finished goods |
816,443 | 744,358 | ||||||
| Finished goods |
6,711,446 | 4,862,442 | ||||||
| Inventory obsolescence provision |
-2,422,084 | -2,597,952 | ||||||
|
|
|
|
|
|||||
| Inventory |
19,809,268 | 13,851,167 | ||||||
|
|
|
|
|
|||||
Note 6—Current trade receivables
Current trade receivables are analyzed as follows:
| (in Euro) |
30/09/14 | 31/12/13 | ||||||
| Current trade receivables |
22,493,251 | 30,924,832 | ||||||
| Other receivables |
182,293 | 118,950 | ||||||
| Provision for bad debts |
-2,398,353 | -2,522,082 | ||||||
|
|
|
|
|
|||||
| Trade receivables |
20,277,192 | 28,521,700 | ||||||
|
|
|
|
|
|||||
PM GROUP
15
Note 7—Cash and cash equivalents
Cash and cash equivalents are analyzed as follows:
| (in Euro) |
30/09/14 | 31/12/13 | ||||||
| Cash on hand |
16,442 | 20,704 | ||||||
| Cheques |
163,000 | 5,857 | ||||||
| Bank and post office accounts |
1,504,057 | 2,193,638 | ||||||
|
|
|
|
|
|||||
| Cash and cash equivalents |
1,683,500 | 2,220,199 | ||||||
|
|
|
|
|
|||||
LIABILITIES
Note 8—Non-current financial payables
Non-current financial payables are analyzed as follows:
| (in Euro) |
30/09/2014 | 31/12/2013 | ||||||
| Non-current portion of loans payable |
676,784 | 802,451 | ||||||
| Payables to other lenders |
40,916 | 335,100 | ||||||
|
|
|
|
|
|||||
| Non-current financial payables |
717,700 | 1,137,551 | ||||||
|
|
|
|
|
|||||
Payables to other lenders are broken down by due date as follows:
| (in Euro) |
within a year |
between one and five years |
Balance 30/09/2014 |
within a year |
between one and five years |
Balance 31/12/2013 |
||||||||||||||||||
| Minimum payments due under finance leases |
411,035 | 43,462 | 454,497 | 535,253 | 344,729 | 879,981 | ||||||||||||||||||
| Interest element |
-10,669 | -2,547 | -13,216 | -27,481 | -9,629 | -37,110 | ||||||||||||||||||
|
|
|
|
|
|
|
|
|
|
|
|
|
|||||||||||||
| Present value of minimum payments due under finance leases |
400,366 | 40,916 | 441,282 | 507,772 | 335,100 | 842,872 | ||||||||||||||||||
|
|
|
|
|
|
|
|
|
|
|
|
|
|||||||||||||
The portion of these payables due within a year is classified under Current financial payables, as analyzed in Note 12.
Non current portion of loans payable are due within one and five years, as shown in the table below:
| (in Euro) |
30/09/2014 | 31/12/13 | ||||||
| Loans Payable due after between 1 and 5 years |
676,784 | 802,451 | ||||||
|
|
|
|
|
|||||
| Non-current portion of loans payable |
676,784 | 802,451 | ||||||
|
|
|
|
|
|||||
PM GROUP
16
A detailed breakdown of loans payable is shown in the following table:
| Bank |
Interest rate |
Original Maturity |
Type |
Loan amount €/1000 |
O/S Princ. 30/09/14 |
current | non- current |
security | ||||||||||||||||||
| CARISBO |
Eur 3M + 2,50 | 12/31/2014 | unsecured loan | 1,000 | 259,338 | 259,338 | — | none | ||||||||||||||||||
| BPER (ex B.ca CRV) |
Eur 3M + 2,50 | 12/31/2014 | unsecured loan | 1,000 | 923,105 | 923,105 | — | none | ||||||||||||||||||
| BPER |
Eur 3M + 2,50 | 12/31/2014 | unsecured loan | 1,500 | 1,500,000 | 1,500,000 | — | none | ||||||||||||||||||
| BNL |
Eur 3M + 2,50 | 12/31/2014 | unsecured loan | 600 | 600,000 | 600,000 | — | none | ||||||||||||||||||
| MPS |
Eur 3M + 2,50 | 12/31/2014 | unsecured loan | 5,500 | 5,500,000 | 5,500,000 | — | none | ||||||||||||||||||
| UNICREDIT |
Eur 3M + 2,50 | 12/31/2014 | unsecured loan | 2,000 | 2,000,000 | 2,000,000 | — | none | ||||||||||||||||||
| BPER / UNICREDIT |
- | 12/31/2015 | deferred interest—Senior loan | 2,862 | 2,862,200 | 2,862,200 | — | none | ||||||||||||||||||
| BPER / UNICREDIT |
Eur 6M + 2,36 | 1/30/2017 | Secured loan—Senior loan | 26,993 | 26,993,000 | 26,993,000 | — | mortgage + pledge on shares | ||||||||||||||||||
| BPER / UNICREDIT |
Eur 6M + 2,86 | 1/30/2017 | Secured loan—Senior loan | 30,000 | 30,000,000 | 30,000,000 | — | mortgage + pledge on shares | ||||||||||||||||||
| CARISBO |
Eur 3M + 2,50 | 12/31/2014 | unsecured loan | 500 | 129,354 | 129,354 | — | none | ||||||||||||||||||
| BPER (ex B.ca CRV) |
Eur 3M + 2,51 | 12/31/2014 | unsecured loan | 750 | 692,329 | 692,329 | — | none | ||||||||||||||||||
| BPER |
Eur 3M + 2,52 | 12/31/2014 | unsecured loan | 1,000 | 1,000,000 | 1,000,000 | — | none | ||||||||||||||||||
| BNL |
Eur 3M + 2,53 | 12/31/2014 | unsecured loan | 300 | 300,000 | 300,000 | — | none | ||||||||||||||||||
| MPS |
Eur 3M + 2,54 | 12/31/2014 | unsecured loan | 500 | 500,000 | 500,000 | — | none | ||||||||||||||||||
| BPER / UNICREDIT |
- | 12/31/2015 | deferred interest—Senior loan | 270 | 269,977 | 269,977 | — | none | ||||||||||||||||||
| BPER / UNICREDIT |
Eur 6M + 2,36 | 1/30/2017 | Secured loan—Senior loan | 5,807 | 5,807,000 | 5,807,000 | — | pledge on shares | ||||||||||||||||||
| BANCA ITALO ROMENA |
Eur 3M + 5% | 6/30/2015 | Secured loan | 800 | 680,185 | 680,185 | mortgage | |||||||||||||||||||
| DEBT ISSUANCE COSTS |
-339,346 | |||||||||||||||||||||||||
|
|
|
|
|
|
|
|||||||||||||||||||||
| TOTAL |
80,016,488 | 78,996,957 | 680,185 | |||||||||||||||||||||||
|
|
|
|
|
|
|
|||||||||||||||||||||
At September 30, 2014, the Group was not in compliance with covenants set out by the loan agreements, and resulted in the Group defaulting on its loans payable to the creditor banks totaling Euro 78,997 thousand. Consequently, the balance in default has been reclassified to current financial payables in the consolidated financial statements.
The mortgage refers to the Oil & Steel S.p.A. factory located in S. Cesario sul Panaro (MO). The pledge refers to the 100% Oil & Steel S.p.A. and Pilosio S.p.A. shares, held by PM Group S.p.A.
Note 9—Employee benefits
Movements on the employee severance indemnity / TFR provision during the period, including the effects of the actuarial valuation of the TFR, were as follows:
| (in Euro) |
31/12/13 | Increases | Decreases | 30/09/14 | ||||||||||||
| Employee severance indemnity / TFR |
1,413,558 | 459,227 | 520,041 | 1,352,744 | ||||||||||||
Note 10—Provisions for risks and charges
Movements on provisions for risks and charges in 2014 were as follows:
| (in Euro) |
31/12/13 | Increases | Decreases | 30/09/14 | ||||||||||||
| Product warranty provision |
851,000 | 16,074 | 0 | 867,074 | ||||||||||||
| Prov. for retirement benefits & similar obligations |
80,806 | 0 | 0 | 80,806 | ||||||||||||
| Other provisions |
505,519 | 0 | 25,519 | 480,000 | ||||||||||||
|
|
|
|
|
|
|
|
|
|||||||||
| Provisions for risks and charges |
1,437,325 | 16,074 | 25,519 | 1,427,880 | ||||||||||||
|
|
|
|
|
|
|
|
|
|||||||||
PM GROUP
17
The “Provision for retirement benefits and similar obligations” represents the potential liability towards agents in the event that the agency relationship is terminated by the Group companies or if the agents retire.
The “Provision for product warranty risks” has been updated based on estimated requirements.
Note 11—Provision for deferred taxes
| (in Euro) |
31/12/2013 | Statement of Income |
30/09/2014 | |||||||||
| Accelerated depreciation |
83,264 | 0 | 83,264 | |||||||||
| Goodwill |
1,696,163 | 159,015 | 1,855,178 | |||||||||
| Amortization from merger |
704,460 | 0 | 704,460 | |||||||||
| TFR under IAS |
66,058 | 0 | 66,058 | |||||||||
| Out of period income due to change of rate |
-228,888 | 0 | -228,888 | |||||||||
| Leasehold improvements |
140,683 | 0 | 140,683 | |||||||||
| Finance leases (IAS 17) |
505,574 | 0 | 505,574 | |||||||||
| Reversal of depreciation of land/building O&S |
57,999 | 0 | 57,999 | |||||||||
| Other |
12,999 | 0 | 12,999 | |||||||||
|
|
|
|
|
|
|
|||||||
| Total |
3,038,312 | 159,015 | 3,197,327 | |||||||||
|
|
|
|
|
|
|
|||||||
The deferred tax provision (Euro 3,197 thousand at September 30, 2014) largely relates to the deferral of gains realized on disposal of tangible assets held for more than three years, accelerated depreciation charged for tax purposes only until 2007 and the tax effects of the transition to IAS/IFRS.
Note 12—Current financial payables
| (in Euro) |
30/09/2014 | 31/12/2013 | ||||||
| Bank overdrafts, loans, advance on invoice and notes |
20,456,093 | 20,734,487 | ||||||
| Current portion of loans payable |
78,996,957 | 78,920,702 | ||||||
| Payables to other lenders |
400,366 | 507,772 | ||||||
|
|
|
|
|
|||||
| Current financial payables |
99,853,416 | 100,162,961 | ||||||
|
|
|
|
|
|||||
Payables to other lenders represents the amount due within a year and mainly relates to the current portion of Euro 349 thousand payable to Medioleasing (formerly Banca Marche) under the real estate finance lease entered into for the Oil & Steel factory in San Cesario sul Panaro (MO), Via Verdi 22 at September 30, 2014. As further described in Note 8, the Group defaulted on its loans payable to the creditor banks totaling Euro 78,997 thousand at September 30, 2014. Consequently, the balance in default has been reclassified to current financial liabilities in the financial statements.
PM GROUP
18
The fair value of the current portion of loans payable is assumed to be equal to Euro 40,420 thousand plus 860 thousand of Manitex shares. The fair value was determined to be the residual value of current portion of loans payable at September 30, 2014 (Euro 78,997 thousand) resulting from the restructuring of the financial indebtedness of the Group upon completion of the Operation. Please refer to the note related to the going concern assumption for more details on terms of the Operation.
Note 13—Liabilities for financial instruments and derivatives
| (in Euro) |
30/09/2014 | 31/12/2013 | ||||||
| Interest rate hedges |
1,728,343 | 2,141,069 | ||||||
|
|
|
|
|
|||||
| Liabilities for financial instruments and derivatives |
1,728,343 | 2,141,069 | ||||||
|
|
|
|
|
|||||
The Group uses financial instruments available on the market (including derivatives) solely in order to minimize its cost of borrowing and hedge the risk of interest rate and exchange rate fluctuations.
In accordance with IAS 32, IAS 39 and IFRS 7, these contracts have been recorded under “Liabilities for financial instruments and derivatives” (with a contra-entry to the Income Statement) in the amount of Euro 1,728 thousand which represents the fair value of the contracts at the reporting date. The change in fair value of these contracts is recorded in the financial income/expenses and exchange gains/losses captions of the Interim Condensed Consolidated Statement of Income.
At September 30, 2014, there were no transactions for the forward sale or purchase of currency.
Note 14—Current trade payables
Current trade payables (including invoices to be received from suppliers) are analyzed as follows:
| (in Euro) |
30/09/2014 | 31/12/2013 | ||||||
| Trade payables |
23,046,403 | 22,131,036 | ||||||
|
|
|
|
|
|||||
| Current trade payables |
23,046,403 | 22,131,036 | ||||||
|
|
|
|
|
|||||
PM GROUP
19
Comments on main Income Statement items
Note 15—Revenue from operating activities
Revenue from operating activities is analyzed below:
| (in Euro) |
9M 2014 | 9M 2013 | ||||||
| Revenue from operating activities |
52,137,327 | 49,039,645 | ||||||
| Revenue from services |
1,167,565 | 1,471,649 | ||||||
| Rental income |
101,193 | 114,702 | ||||||
| Other revenue from operating activities |
135,505 | 149,353 | ||||||
|
|
|
|
|
|||||
| Revenue from operating activities |
53,541,589 | 50,775,349 | ||||||
|
|
|
|
|
|||||
Note 16—Other revenue and income
Other revenue and income are analyzed as follows:
| (in Euro) |
9M 2014 | 9M 2013 | ||||||
| Compensation for damages |
58,014 | 2,080 | ||||||
| Gains on disposal |
7,656 | 16,088 | ||||||
| Freight services |
789,820 | 870,841 | ||||||
| Other |
615,099 | 354,236 | ||||||
|
|
|
|
|
|||||
| Other revenue and income |
1,470,589 | 1,243,245 | ||||||
|
|
|
|
|
|||||
“Freight Services” mainly includes revenues related to organization of freight service to customers. “Other” primarily includes sundry charges to customers.
Note 17—Increases in non-current assets due to capitalization of internal costs
This caption regards the capitalization of materials, services and labor costs incurred for the internal construction of equipment and the development of new products, as shown in the following table:
| (in Euro) |
9M 2014 | 9M 2013 | ||||||
| Increases in industrial equipment |
12,174 | 23,850 | ||||||
| Increases in development costs |
874,213 | 1,533,552 | ||||||
|
|
|
|
|
|||||
| Increases in non-current assets due to capitalisation of internal costs |
886,388 | 1,557,402 | ||||||
|
|
|
|
|
|||||
PM’s research and development activities focus on the introduction into the product range new series of light weight high performance cranes.
PM GROUP
20
Note 18—Costs of raw materials
Costs of raw materials are analyzed as follows:
| (in Euro) |
9M 2014 | 9M 2013 | ||||||
| Finished goods |
4,637,379 | 3,600,513 | ||||||
| Raw materials |
28,975,463 | 22,551,672 | ||||||
| Packaging and consumable materials |
372,720 | 406,504 | ||||||
| Change in inventory of raw materials and goods |
-3,778,640 | -840,688 | ||||||
|
|
|
|
|
|||||
| Total Costs of raw material |
30,206,923 | 25,718,000 | ||||||
|
|
|
|
|
|||||
Note 19—Costs for services
Costs for services are analyzed as follows:
| (in Euro) |
9M 2014 | 9M 2013 | ||||||
| Outsourced production |
3,037,617 | 3,088,466 | ||||||
| Transport/freight |
1,439,896 | 1,507,329 | ||||||
| Agents’ commission |
376,282 | 343,002 | ||||||
| Legal and consulting costs |
1,387,357 | 1,505,860 | ||||||
| Utilities and other industrial services |
617,734 | 648,891 | ||||||
| Insurance |
353,670 | 358,440 | ||||||
| Repairs and maintenance |
196,389 | 194,888 | ||||||
| Marketing, trade fairs and advertising |
358,127 | 597,455 | ||||||
| Board of Statutory Auditors’ fees |
68,687 | 73,932 | ||||||
| Other costs for services |
1,432,911 | 1,462,712 | ||||||
| Technical assistance |
380,967 | 395,123 | ||||||
|
|
|
|
|
|||||
| Costs for services |
9,649,637 | 10,176,099 | ||||||
|
|
|
|
|
|||||
Note 20—Personnel costs
| (in Euro) |
9M 2014 | 9M 2013 | ||||||
| Wages and salaries |
8,659,470 | 9,681,131 | ||||||
| Directors’ remuneration and benefits |
215,062 | 196,101 | ||||||
| Social contributions |
2,640,837 | 2,653,973 | ||||||
| TFR, retirement benefits and similar |
459,227 | 503,983 | ||||||
| Other costs |
427,714 | 348,824 | ||||||
|
|
|
|
|
|||||
| Personnel costs |
12,402,311 | 13,384,012 | ||||||
|
|
|
|
|
|||||
PM GROUP
21
The Group’s average headcount, by employee category, is shown in the following table:
| 9M 2014 | 9M 2013 | |||||||
| Managers |
13 | 12 | ||||||
| Staff |
552 | 566 | ||||||
|
|
|
|
|
|||||
| Total |
565 | 578 | ||||||
|
|
|
|
|
|||||
Figures for the Pilosio BU are included for the sake of completeness. The related costs are included in the operating expenses detailed in Note 26.
Note 21—Other operating expenses
Other operating expenses are analyzed as follows:
| (in Euro) |
9M 2014 | 9M 2013 | ||||||
| Rental of industrial and office buildings |
523,636 | 540,479 | ||||||
| Operating leases |
238,656 | 337,396 | ||||||
| Losses on disposals |
238 | 0 | ||||||
| Taxes other than income taxes |
334,619 | 287,651 | ||||||
| Bad debts |
16,910 | -6,350 | ||||||
| Other operating expenses |
337,964 | 809,334 | ||||||
|
|
|
|
|
|||||
| Other operating expenses |
1,452,021 | 1,968,510 | ||||||
|
|
|
|
|
|||||
Note 22—Depreciation, amortization and impairment of non-current assets
| (in Euro) |
9M 2014 | 9M 2013 | ||||||
| Amortization of intangible assets |
844,257 | 1,306,094 | ||||||
| Depreciation of tangible assets |
1,098,869 | 1,220,438 | ||||||
| Impairment of tangible assets |
0 | 158,024 | ||||||
|
|
|
|
|
|||||
| Depreciation, amortization and impairment of non-current assets |
1,943,126 | 2,684,556 | ||||||
|
|
|
|
|
|||||
Certain tangible assets have been impaired as the related fair value resulting from their sale was lower that their carrying amount.
Note 23—Provisions
These may be analyzed as follows:
| (in Euro) |
9M 2014 | 9M 2013 | ||||||
| Provision for bad debts |
54,818 | 45,490 | ||||||
| Provions for risks |
16,074 | 0 | ||||||
| Other provisions |
-25,519 | 3,962 | ||||||
|
|
|
|
|
|||||
| Total |
45,374 | 49,452 | ||||||
|
|
|
|
|
|||||
PM GROUP
22
“Provisions for risks” primarily relate to amounts allocated to the product warranty provision. “Other provisions” relate to favorable adjustments to provisions accrued in previous periods settled by the Group during 2014 amounting to approximately Euro 20 thousand. Amounts were recorded in “Other operating expenses”.
Note 24—Financial income and expenses
| (in Euro) |
9M 2014 | 9M 2013 | ||||||
| Interest income on bank accounts |
2,829 | 4,150 | ||||||
| Interest income from customers |
5,832 | 2,438 | ||||||
| Income from derivatives |
412,932 | 878,094 | ||||||
| Other financial income |
10,204 | 14,312 | ||||||
| Financial income |
431,797 | 898,993 | ||||||
| Financial expenses on loans and finance leases |
1,630,853 | 1,686,483 | ||||||
| Financial expenses on current liabilities |
489,364 | 490,700 | ||||||
| Financial expenses on derivatives |
552,766 | 609,493 | ||||||
| Other interest and expenses |
68,390 | 68,865 | ||||||
| Bank charges |
377,499 | 471,573 | ||||||
| Financial expenses |
3,118,872 | 3,327,114 | ||||||
| Exchange gains—realized |
359,943 | 256,052 | ||||||
| Exchange gains—unrealized |
674,592 | 274,047 | ||||||
| Exchange losses—realized |
635,852 | 429,795 | ||||||
| Exchange losses—unrealized |
621,350 | 1,059,238 | ||||||
| Net exchange losses |
-222,667 | -958,934 | ||||||
|
|
|
|
|
|||||
| Financial income and expenses |
-2,909,742 | -3,387,056 | ||||||
|
|
|
|
|
|||||
Note 25—Taxes on income
Tax for the nine month period is charged on the base of the best estimate of the average annual effective tax rate expected for the full year, applied to the pre-tax loss of the nine month period.
Note 26—Assets and liabilities held for sale. Profit/Loss from discontinued operations
The Interim Condensed Consolidated Financial Statements, include the assets and liabilities of Pilosio S.p.A. and its subsidiaries. On January 15, 2015 Pilosio was sold to a company owned by Columna at a price of Euro 1,000 thousand as previously described in the Group Consolidated Financial Statements at December 31, 2013.
As a result of the above, the Condesed Consolidated Statement of Income includes “Profit/Loss from discontinued operations” related to Pilosio, representing the loss of the discontinued operations, net of tax effects.
In accordance with IFRS 5, we provide below details of (i) the assets held for sale and the related liabilities at September 30, 2014, (ii) the items forming part of the discontinued operations/activities for the period ended September 30, 2014, and September 30, 2013, and (iii) cash flow information related to the discontinued operations for the period ended September 30, 2014 and 2013.
PM GROUP
23
Note 27—Fair Value measurement
IFRS 13 establishes a fair value hierarchy which classifies on three levels the inputs of the valuation techniques adopted to measure fair value. The fair value hierarchy gives highest priority to the quoted prices (unadjusted) on active markets for identical assets or liabilities (Level 1 inputs) and lowest priority to unobservable inputs (Level 3 inputs). In some cases, the inputs used to measure the fair value of an asset or liability could be classified on several levels of the fair value hierarchy. In such cases, the fair value measurement is classified entirely on the same hierarchy level where the lowest level input that has a significant impact o the valuation.
PM GROUP
24
The levels used in the hierarchy are:
| • | Level 1 inputs are quoted prices (unadjusted) on active markets for identical assets or liabilities that the entity can access at the measurement date; |
| • | Level 2 inputs are inputs other than quoted prices included within Level 1 that are observable for the asset or liability, either directly or indirectly; |
| • | Level 3 inputs are unobservable inputs for the asset or liability. |
The following table shows the fair value hierarchy of Assets and Liabilities measured at fair value at September 30, 2014:
| (in Euro) |
Level 1 | Level 2 | Level 3 | Total 30/09/2014 |
||||||||||||
| Liabilities for derivative financial instruments |
0 | -1.728.343 | 0 | -1.728.343 | ||||||||||||
|
|
|
|
|
|
|
|
|
|||||||||
| Total |
0 | -1.728.343 | 0 | -1.728.343 | ||||||||||||
|
|
|
|
|
|
|
|
|
|||||||||
Liabilities for derivative financial instruments did not change fair value hierarchy between December 31, 2013 and September 30, 2014.
The fair value of Liabilities for derivative financial Instruments is included in Level 2 of the fair value hierarchy and has been estimated with discounted cash flows models. The main inputs used are forward interest rates (from observable yield curves at the end of the reporting period), and contract interest rates, discounted at a rate that reflects the credit risk of various counterparties.
At December 31, 2013 assets and liabilities held for sale, related to the Business Unit Pilosio, were valued at fair value and disclosed in Level 3 of the fair value hierarchy. At September 30, 2014 assets and liabilities held for sale are no longer valued at fair value because at that date, as consequence of the loss incurred by Pilosio during the first nine month of 2014, their carrying amounts are lower of their fair value less costs to sell.
For financial instruments represented by short-term receivables, payables, and financial payables for which the present value of future cash flows does not differ significantly from carrying value, the carrying value is a reasonable approximation of the fair value. In particular, the carrying amount of Current receivables, Other current assets, Trade payables and Other current liabilities, approximates their fair value. The fair value of the financial payables has been disclosed in Note 12.
For other Statement of Financial Position items the carrying amount represents a reasonable approximation of fair value at September 30, 2014.
San Cesario sul Panaro, February 13, 2015
| FOR THE BOARD OF DIRECTORS |
| THE PRESIDENT |
| David J. Langevin |
PM GROUP
25
Exhibit 99.3
UNAUDITED PRO FORMA CONDENSED CONSOLIDATED FINANCIAL INFORMATION
Manitex International, Inc.
Unaudited Pro Forma Condensed Consolidated Financial Information
On January 21, 2015, Manitex International, Inc. (“Manitex” or the “Company”), a Michigan corporation, announced that the PM Group (“PM”) acquisition closed on January 15, 2015. As a condition of the PM acquisition, PM concurrently disposed of its assets and liabilities held for sale.
The acquisition has been accounted for using acquisition accounting in accordance with Financial Accounting Standard Codification “(ASC”) Section 805. The following Unaudited Pro Forma Condensed Consolidated Financial Information includes the Unaudited Pro Forma Condensed Consolidated Balance Sheet as of September 30, 2014, the Unaudited Pro Forma Condensed Consolidated Statement of Income for the nine months ended September 30, 2014 and the Unaudited Pro Forma Condensed Consolidated Statement of Income for the fiscal year ended December 31, 2013.
The following Unaudited Pro Forma Condensed Consolidated Statements of Income for the nine months ended September 30, 2014 and fiscal year ended December 31, 2013 give effect to the Company’s purchase of PM, assuming that the acquisition was consummated on January 1, 2013. The Pro Forma Condensed Consolidated Balance Sheet presents the financial position of the Company as if the acquisition of PM occurred on September 30, 2014. The pro forma adjustments, which are based on available information and are directly attributable to the acquisition, are factually supportable and are expected to have a continuing impact, have been applied to the historical financial statements of the Company and PM. The pro forma allocation of the purchase price to the acquired assets and liabilities is based in part on an independent appraisal and other studies completed subsequent to the PM acquisition. The purchase price allocation is preliminary and is subject to revision, as the Company has not received all the information necessary to complete the purchase price allocation.
The historical financial statements of PM are prepared in accordance with International Financial Reporting Standards as issued by the International Accounting Standards Board (“IFRS”) and are presented in Euros. Adjustments have been made to adjust PM’s IFRS financial information to the Company’s accounting policies under generally accepted accounting principles in the United States of America (“US GAAP”) and Euro amounts have been translated into US dollars using the following exchange rages:
| USD/€ | ||||||
| Nine months ended September 30, 2014 |
Average Rate | 1.36 | ||||
| Year ended December 31, 2013 |
Average Rate | 1.32 | ||||
| As of September 30, 2014 |
Spot Rate | 1.26 | ||||
The Pro Forma Condensed Consolidated Financial Information, which has been prepared in accordance with rules prescribed by Article 11 of Regulation S-X, is provided for informational purposes only and is not necessarily indicative of the past or future results of operations or financial position of the Company.
This information should be read in conjunction with the Company’s previously filed Current Report on Form 8-K, dated January 21, 2015, the Company’s previously filed Annual Report on Form 10-K for the fiscal year ended December 31, 2014, and the historical financial statements and accompanying notes of PM included in this Current Report on Form 8-K/A.
The unaudited Pro Forma Condensed Consolidated Financial Information does not reflect any changes in the business of the Company or PM or any other changes arising from other transactions since September 30, 2014.
Manitex International, Inc.
Unaudited Pro forma Condensed Consolidated Balance Sheet
(In thousands)
| Manitex September 30, 2014 |
PM Group September 30, 2014 |
PM Group September 30, 2014 |
Pro forma Adjustments |
PM Group As Adjusted September 30, 2014 |
Pro forma Adjustments |
Pro forma September 30, 2014 |
||||||||||||||||||||||
| Unaudited | Unaudited | Unaudited | Unaudited | Unaudited | Unaudited | Unaudited | ||||||||||||||||||||||
| ASSETS | Euros | |||||||||||||||||||||||||||
| Current assets |
||||||||||||||||||||||||||||
| Cash |
$ | 4,934 | 1,684 | $ | 2,127 | $ | 3,834 | B | 5,961 | $ | 5,406 | I | $ | 16,301 | ||||||||||||||
| Trade receivables (net) |
44,860 | 20,277 | 25,606 | 25,606 | 70,466 | |||||||||||||||||||||||
| Accounts receivable finance |
— | — | — | — | ||||||||||||||||||||||||
| Other receivables |
692 | 300 | 379 | 379 | 1,071 | |||||||||||||||||||||||
| Inventory (net) |
81,085 | 19,809 | 25,015 | 1,072 | C | 26,087 | 107,172 | |||||||||||||||||||||
| Deferred tax asset |
1,272 | — | — | — | 1,272 | |||||||||||||||||||||||
| Prepaid expense and other |
1,908 | 4,780 | 6,036 | 6,036 | 7,944 | |||||||||||||||||||||||
|
|
|
|
|
|
|
|
|
|
|
|
|
|
|
|||||||||||||||
| Total current assets |
134,751 | 46,850 | 59,163 | 4,906 | 64,069 | 5,406 | 204,226 | |||||||||||||||||||||
|
|
|
|
|
|
|
|
|
|
|
|
|
|
|
|||||||||||||||
| Total fixed assets (net) |
10,097 | 18,614 | 23,506 | (2,484 | ) D | 21,022 | 31,119 | |||||||||||||||||||||
| Investment in Subs |
— | — | ||||||||||||||||||||||||||
| Intangible assets (net) |
21,783 | 3,826 | 4,831 | 20,869 | E | 25,700 | 47,483 | |||||||||||||||||||||
| Deferred tax asset |
1,936 | 5,988 | 7,562 | 7,562 | 9,498 | |||||||||||||||||||||||
| Goodwill |
22,213 | 33,193 | 41,916 | (17,579 | ) E | 24,337 | 46,550 | |||||||||||||||||||||
| Other long-term assets |
1,019 | 141 | 178 | 178 | 1,143 | L | 2,340 | |||||||||||||||||||||
| Non—marketable equity investments |
2 | 3 | 3 | 3 | ||||||||||||||||||||||||
| Assets of held for sale |
— | 46,799 | 59,098 | (59,098 | ) H | — | — | |||||||||||||||||||||
|
|
|
|
|
|
|
|
|
|
|
|
|
|
|
|||||||||||||||
| Total assets |
$ | 191,799 | 155,413 | $ | 196,257 | $ | (53,386 | ) | 142,871 | $ | 6,549 | $ | 341,219 | |||||||||||||||
|
|
|
|
|
|
|
|
|
|
|
|
|
|
|
|||||||||||||||
| LIABILITIES AND SHAREHOLDERS’ EQUITY | ||||||||||||||||||||||||||||
| Current liabilities |
||||||||||||||||||||||||||||
| Notes payable—short term |
$ | 7,393 | 99,854 | 126,096 | $ | (107,234 | ) F | 18,862 | $ | 1,500 | J | $ | 27,755 | |||||||||||||||
| Revolving credit facilities |
2,676 | — | — | 200 | L | 2,876 | ||||||||||||||||||||||
| Current portion of capital lease obligations |
1,693 | — | — | 1,693 | ||||||||||||||||||||||||
| Accounts payable |
27,263 | 23,046 | 29,102 | 29,102 | 56,365 | |||||||||||||||||||||||
| Accounts payable related parties |
1,230 | — | — | 1,230 | ||||||||||||||||||||||||
| Accrued expenses |
8,508 | 3,588 | 4,533 | 1,701 | G | 6,233 | 14,742 | |||||||||||||||||||||
| Other current liabilities |
1,883 | 3,666 | 4,629 | 4,629 | 6,512 | |||||||||||||||||||||||
|
|
|
|
|
|
|
|
|
|
|
|
|
|
|
|||||||||||||||
| Total current liabilities |
50,646 | 130,154 | 164,360 | (105,533 | ) | 58,826 | 1,700 | 111,173 | ||||||||||||||||||||
|
|
|
|
|
|
|
|
|
|
|
|
|
|
|
|||||||||||||||
| Long-term liabilities |
||||||||||||||||||||||||||||
| Revolving term credit facilities |
37,819 | — | — | 37,819 | ||||||||||||||||||||||||
| Deferred tax liability |
4,077 | 3,197 | 4,037 | 4,037 | 247 | K | 8,361 | |||||||||||||||||||||
| Notes payable |
2,130 | 718 | 907 | 43,628 | F | 44,535 | 12,500 | J | 59,165 | |||||||||||||||||||
| Capital lease obligations |
2,992 | — | — | 2,992 | ||||||||||||||||||||||||
| Convertible debt |
— | — | 14,286 | K | 14,286 | |||||||||||||||||||||||
| Deferred gain on sale of building |
1,363 | — | — | 1,363 | ||||||||||||||||||||||||
| Other long-term liabilities |
1,065 | 2,781 | 3,512 | (431 | ) G | 3,081 | 4,146 | |||||||||||||||||||||
| Liabilities held for sale |
45,223 | 57,108 | (57,108 | ) H | — | — | ||||||||||||||||||||||
|
|
|
|
|
|
|
|
|
|
|
|
|
|
|
|||||||||||||||
| Total long-term liabilities |
49,446 | 51,919 | 65,564 | (13,911 | ) | 51,653 | 27,033 | 128,132 | ||||||||||||||||||||
|
|
|
|
|
|
|
|
|
|
|
|
|
|
|
|||||||||||||||
| Total liabilities |
100,092 | 182,073 | 229,924 | (119,444 | ) | 110,479 | 28,733 | 239,305 | ||||||||||||||||||||
|
|
|
|
|
|
|
|
|
|
|
|
|
|
|
|||||||||||||||
| Commitments and contingencies |
||||||||||||||||||||||||||||
| Shareholders’ equity |
||||||||||||||||||||||||||||
| Preferred Stock |
— | — | — | — | ||||||||||||||||||||||||
| Common Stock |
68,894 | 23,296 | 29,418 | (29,418 | ) | — | 10,124 | A.1 | 79,018 | |||||||||||||||||||
| Paid in capital |
1,751 | — | 32,391 | 32,391 | (31,924 | ) K, M | 2,218 | |||||||||||||||||||||
| Retained earnings |
21,488 | (50,760 | ) | (64,100 | ) | 64,100 | — | (384 | ) N | 21,104 | ||||||||||||||||||
| Accumulated other comprehensive (loss) income |
(426 | ) | — | — | (426 | ) | ||||||||||||||||||||||
|
|
|
|
|
|
|
|
|
|
|
|
|
|
|
|||||||||||||||
| Equity attributed to shareholders of Manitex International, Inc. |
91,707 | (27,464 | ) | (34,682 | ) | 67,073 | 32,391 | (22,184 | ) | 101,914 | ||||||||||||||||||
|
|
|
|
|
|
|
|
|
|
|
|
|
|
|
|||||||||||||||
| Equity attributed to noncontrolling interest |
— | 804 | 1,015 | (1,015 | ) | — | — | — | ||||||||||||||||||||
|
|
|
|
|
|
|
|
|
|
|
|
|
|
|
|||||||||||||||
| Total equity |
91,707 | (26,660 | ) | (33,667 | ) | 66,058 | 32,391 | (22,184 | ) | 101,914 | ||||||||||||||||||
|
|
|
|
|
|
|
|
|
|
|
|
|
|
|
|||||||||||||||
| Total liabilities and shareholders’ equity |
$ | 191,799 | 155,413 | $ | 196,257 | $ | (53,386 | ) | 142,871 | $ | 6,549 | $ | 341,219 | |||||||||||||||
|
|
|
|
|
|
|
|
|
|
|
|
|
|
|
|||||||||||||||
Manitex International, Inc.
Unaudited Pro forma Condensed Consolidated Statement of Income
(In thousands, except per share data)
| Manitex Nine Months Ended September 30, 2014 |
PM Group Nine Months Ended September 30, 2014 |
PM Group Nine Months Ended September 30, 2014 |
PM Pro forma Adjustments |
Manitex Pro forma Adjustments |
Pro forma Nine Months Ended September 30, 2014 |
|||||||||||||||||||
| Unaudited | Unaudited | Unaudited | Unaudited | Unaudited | Unaudited | |||||||||||||||||||
| Euros | ||||||||||||||||||||||||
| Net revenues |
$ | 197,172 | 53,542 | $ | 72,582 | $ | — | $ | — | $ | 269,754 | |||||||||||||
| Cost of sales |
161,509 | — | 48,627 | O, Q | — | 210,136 | ||||||||||||||||||
|
|
|
|
|
|
|
|
|
|
|
|
|
|||||||||||||
| Gross profit |
35,663 | 53,542 | 72,582 | (48,627 | ) | — | 59,618 | |||||||||||||||||
| Operating expenses |
||||||||||||||||||||||||
| Research and development costs |
1,909 | — | — | 1,185 | O, P | — | 3,094 | |||||||||||||||||
| Selling, general and administrative expenses |
21,554 | — | — | 22,619 | O, R | (34 | ) U | 44,139 | ||||||||||||||||
| Operating expenses |
— | 52,565 | 71,257 | (71,257 | ) O | — | ||||||||||||||||||
|
|
|
|
|
|
|
|
|
|
|
|
|
|||||||||||||
| Total operating expenses |
23,463 | 52,565 | 71,257 | (47,453 | ) | (34 | ) | 47,233 | ||||||||||||||||
| Operating income |
12,200 | 977 | 1,325 | (1,174 | ) | 34 | 12,385 | |||||||||||||||||
| Other income (expense) |
||||||||||||||||||||||||
| Interest expense |
(2,192 | ) | (2,910 | ) | (3,945 | ) | 1,325 | S, T | (1,376 | ) V | (6,188 | ) | ||||||||||||
| Foreign currency transaction losses |
(27 | ) | — | — | (303 | ) S | — | (330 | ) | |||||||||||||||
| Other income (loss) |
(67 | ) | 1,471 | 1,994 | 26 | S | — | 1,953 | ||||||||||||||||
|
|
|
|
|
|
|
|
|
|
|
|
|
|||||||||||||
| Total other expense |
(2,286 | ) | (1,439 | ) | (1,951 | ) | 1,048 | (1,376 | ) | (4,565 | ) | |||||||||||||
| Income before income taxes |
9,914 | (462 | ) | (626 | ) | (126 | ) | (1,342 | ) | 7,820 | ||||||||||||||
| Income tax |
3,283 | 770 | 1,044 | (81 | ) W | (464 | ) W | 3,782 | ||||||||||||||||
|
|
|
|
|
|
|
|
|
|
|
|
|
|||||||||||||
| Net income (loss) |
$ | 6,631 | (1,232 | ) | $ | (1,670 | ) | $ | (45 | ) | $ | (878 | ) | $ | 4,038 | |||||||||
|
|
|
|
|
|
|
|
|
|
|
|
|
|||||||||||||
| Earnings Per Share |
||||||||||||||||||||||||
| Basic |
$ | 0.48 | $ | 0.27 | ||||||||||||||||||||
| Diluted |
$ | 0.48 | $ | 0.27 | ||||||||||||||||||||
| Weighted average common shares outstanding |
||||||||||||||||||||||||
| Basic |
13,817,538 | 994,483 | X | 14,812,021 | ||||||||||||||||||||
| Diluted |
13,862,651 | 994,483 | X | 14,857,134 | ||||||||||||||||||||
Manitex International, Inc.
Unaudited Pro forma Condensed Consolidated Statement of Income
(In thousands, except per share data)
| Manitex Year Ended December 31, 2013 |
PM Group Year Ended December 31, 2013 |
PM Group Year Ended December 31, 2013 |
PM Pro forma Adjustments |
Manitex Pro forma Adjustments |
Pro forma Year Ended December 31, 2013 |
|||||||||||||||||||
| Unaudited | Unaudited | Unaudited | Unaudited | Unaudited | Unaudited | |||||||||||||||||||
| Euros | ||||||||||||||||||||||||
| Net revenues |
$ | 245,072 | 78,599 | $ | 103,806 | $ | — | $ | — | $ | 348,878 | |||||||||||||
| Cost of sales |
198,596 | — | — | 71,268 | Y, AA, AB | — | 269,864 | |||||||||||||||||
|
|
|
|
|
|
|
|
|
|
|
|
|
|||||||||||||
| Gross profit |
46,476 | 78,599 | 103,806 | (71,268 | ) | — | 79,014 | |||||||||||||||||
| Operating expenses |
||||||||||||||||||||||||
| Research and development costs |
2,912 | — | — | 2,644 | Y,Z | — | 5,556 | |||||||||||||||||
| Selling, general and administrative expenses |
26,026 | — | — | 53,277 | Y, AC (Note 1) | 34 | AF | 77,337 | ||||||||||||||||
| Total operating expenses |
— | 97,015 | 128,128 | (128,128 | ) Y | — | ||||||||||||||||||
|
|
|
|
|
|
|
|
|
|
|
|
|
|||||||||||||
| Total operating expenses |
28,938 | 97,015 | 128,128 | (72,207 | ) | 34 | 84,893 | |||||||||||||||||
| Operating income |
17,538 | (18,416 | ) | (24,322 | ) | 939 | (34 | ) | (5,879 | ) | ||||||||||||||
| Other income (expense) |
||||||||||||||||||||||||
| Interest expense |
(2,946 | ) | (4,910 | ) | (6,485 | ) | 3,104 | AD, AE | (1,900 | ) AG | (8,227 | ) | ||||||||||||
| Foreign currency transaction losses |
(95 | ) | — | — | (1,776 | ) AD, AE | — | (1,871 | ) | |||||||||||||||
| Other income (loss) |
(50 | ) | 1,814 | 2,396 | 33 | AD | — | 2,379 | ||||||||||||||||
|
|
|
|
|
|
|
|
|
|
|
|
|
|||||||||||||
| Total other expense |
(3,091 | ) | (3,096 | ) | (4,089 | ) | 1,361 | (1,900 | ) | (7,719 | ) | |||||||||||||
| Income before income taxes |
14,447 | (21,512 | ) | (28,411 | ) | 2,300 | (1,934 | ) | (13,589 | ) | ||||||||||||||
| Income tax |
4,269 | 981 | 1,296 | 669 | AH | (571 | ) AH | 5,663 | ||||||||||||||||
|
|
|
|
|
|
|
|
|
|
|
|
|
|||||||||||||
| Net income (loss) |
$ | 10,178 | (22,493 | ) | $ | (29,707 | ) | $ | 1,631 | $ | (1,363 | ) | $ | (19,261 | ) | |||||||||
|
|
|
|
|
|
|
|
|
|
|
|
|
|||||||||||||
| Earnings Per Share |
||||||||||||||||||||||||
| Basic |
$ | 0.80 | $ | (1.41 | ) | |||||||||||||||||||
| Diluted |
$ | 0.80 | $ | (1.41 | ) | |||||||||||||||||||
| Weighted average common shares outstanding |
||||||||||||||||||||||||
| Basic |
12,671,205 | 994,483 | X | 13,665,688 | ||||||||||||||||||||
| Diluted |
12,717,575 | 994,483 | X | 13,665,688 | ||||||||||||||||||||
| Note 1. | Includes impairment charges of $20,496 that were recognized durrng 2013 that are .principally related to an impairment of Oil & Steel’s goodwill (a subsidiary of PM). |
Manitex International, Inc. and Subsidiaries
Notes to Unaudited Pro Forma Condensed Consolidated Financial Information
In thousands except for share and per share data
Balance sheet
Pro forma adjustment to give effect to the purchase of PM for $32,392 along with the assumption of debt of $63,397 as if the acquisition occurred on September 30, 2014 for the balance sheet presented and on January 1, 2013 for the income statements presented.
| A.1 Consideration exchanged |
||||
| Cash |
$ | 22,268 | ||
| Manitex Stock (994,483 common shares at the closing price on January 15, 2015 of $10.18) |
10,124 | |||
|
|
|
|||
| Total consideration |
$ | 32,392 | ||
|
|
|
|||
| A.2 Purchase price allocation |
||||
| Amounts assigned to intangible assets: |
||||
| Trade names and trademarks |
$ | 6,800 | ||
| Customer relationships |
10,000 | |||
| Patented and unpatented technology |
8,900 | |||
| Cash |
5,961 | |||
| Trade and other receivables |
25,985 | |||
| Inventory |
26,087 | |||
| Prepaid expense and other |
6,036 | |||
| Total fixed asset |
21,022 | |||
| Deferred net tax assets |
3,525 | |||
| Other long-term assets |
181 | |||
| Accounts payable and accruals |
(35,335 | ) | ||
| Other current liabilities |
(4,629 | ) | ||
| Other long-term liabilities |
(3,081 | ) | ||
| Assumed debt |
(63,397 | ) | ||
|
|
|
|||
| 8,055 | ||||
| Goodwill |
24,337 | |||
|
|
|
|||
| $ | 32,392 | |||
|
|
|
| (1) | PM debt is solely a PM obligation and is secured solely by PM assets and lenders have no recourse to Manitex International, Inc. or any subsidiary other than PM. |
In accordance with ASC 350 goodwill which is an indefinite lived asset is not amortized. Customer relationships and patented and unpatented technology are being amortized over 10 years. Trade names and trademarks have been determined to be indefinite lived assets and are not being amortized
| B. | Pro forma adjustment made to increase cash by $3,834 of which $2,571 was cash contribution to PM by Manitex (cash portion of the purchase price retained by PM) and $1,263 represent proceeds from the completion of the disposition of assets and liabilities held for sale. |
| C. | Pro forma adjustment for $1,072 was made which represents the fair market adjustment to inventory. |
| D. | Pro forma adjustment of $2,484 was made to reduce the historic value of fixed assets to their fair value. |
| E. | Pro forma adjustments of $4,831 and $41,916 were made to eliminate historic intangible assets and goodwill, respectively. Additionally, adjustments of $25,700 were made to record intangible assets acquired as part of the PM acquisition and $24,337 to recognize the residual as goodwill. |
| F. | Pro forma adjustments were made to reduce notes payable current by $61,887 which represents $54,073 of debt that was forgiven in connection with this transaction and an additional $7,814 of debt that was repaid at the time of transaction. Additionally, a pro forma adjustment of $1,719 to record the debt discount related to non-interest bearing debt assumed was made. |
Another pro forma entry was made to reduce notes payable current and increase notes payable long-term by $43,628 to properly classify debt payable between short-term and long-term. As part of the transaction PM’s outstanding debt was restructured. This entry is being made to classify debt between short and long-term debt so that it conforms to the terms of current agreements.
| G. | Pro forma adjustment of $1,701 was made to increase accrued expense and to decrease other long-term liabilities by an equal amount. This was done to properly classify the reserve for warranty and certain other liabilities as current liabilities in conformity with Manitex’s accounting policies. |
A pro forma adjustment of $1,270 increasing other long-term liabilities was made. The amount reflects the fair market value of an earn out that one of the banks was given in connection with the PM acquisition.
| H. | Pro forma adjustments were made to eliminate assets and liabilities held for sale as they were not acquired in this transaction. |
| I. | Pro forma adjustment was made to increase cash by $5,406 which represents the difference between the net proceeds received from the term loan and the convertible note less amount of cash used to acquire PM. |
| J. | Pro forma adjustments were made to increase notes payable short-term and notes payable long-term by $1,500 and $12,500, respectively to record a $14,000 term loan taken out in connection with transaction. |
| K. | Pro forma adjustments were made to increase convertible debt by $14,286, paid in capital by $467 and deferred tax by $247 to record a $15,000 convertible note that was issued in connection with the transaction. |
| L. | Pro forma adjustment of $1,143 was made to record deferred bank fees and expense incurred or paid in connection with the issuance of the term loan and the convertible debt. Except for $200 that was prepaid, the fees and expenses were deducted from the loan proceeds. Pro forma adjustment to increase revolving credit facility by $200 to reflect a bank fee that was paid in November 2014 that related to the term loan. |
| M. | Pro forma adjustments of $32,391 were made to eliminate PM’s paid in capital. |
| N. | A pro forma adjustment was made to reduce retained earnings by $384 to recognize acquisition costs incurred after September 30, 2014. |
Income Statement
| O. | Pro forma adjustments were made to split total operating expense between cost of sales, selling, general and administrative expenses and research and development costs. The result was to increase cost of sales, selling, general and administrative expenses and research and development costs by $48,934, $21,355 and $968, respectively and to reduce unclassified operating expenses by $71,257. |
| P. | Pro forma adjustment to increase research and development costs by $217 which represents the net effect of expensing research and development costs that were capitalized in the period and eliminating the amortization of research and development expenses capitalized in prior periods. This adjustment was made to align the accounting for research and development costs to be consistent with Manitex’s accounting policies. |
| Q. | Pro forma adjustment to account for the difference between historical depreciation and depreciation calculated using the fair market value of assets, and their current useful lives subsequent to the PM acquisition. The net effect was to reduce cost of sales by $307. |
| R. | Pro forma adjustment to account for the difference between historical amortization and amortization calculated using the fair market value of intangible assets, excluding goodwill, and the current useful lives subsequent to the PM acquisition. The net effect was to increase selling, general and administrative expenses by $1,264. |
| S. | Pro forma adjustments were made to reclassify foreign currency gains and loss and other income that were included in interest expense. The effect of the entries was to reduce interest expense by $277, to show a loss on foreign currency transaction of $303 and to reflect other income of $26. This adjustment was made to align the expense classification with the accounting policies of Manitex. |
| T. | Pro forma adjustments were made that reduce interest expense by $1,048. This includes a reduction of interest for $1,432 related to debt forgiven or converted to non-interest bearing debt offset by amortization of $384 of debt discount related to the non-interest bearing debt. |
| U. | Pro forma adjustment of $34 was made to reduce selling, general and administrative expense. This amount represents acquisition expenses which were incurred prior to September 30, 2014. |
| V. | Pro forma adjustments of $1,376 were made to record interest expense for the term loan and the convertible debt issued in connection with the transaction. The term loan has a variable interest rate. It is expected that the actual interest rates that will apply to the term loan may differ from the rates set out herein due to changes in LIBOR. The effect of a change of 12.5 bps in the interest rates would result in an increase or decrease in interest expense of $43 for the nine months ended September 30, 2014. |
| W. | Pro forma adjustments were made to tax effect the above pro forma adjustments. The PM pro forma adjustments were tax effected using the Italian statutory income tax rates. The Manitex pro forma adjustments were tax effected using the Company’s effective rate. |
| X. | Pro forma adjustment to record 994,483 shares of common stock issued in connection with this transaction. |
| Y. | Pro forma adjustments were made to split total operating expense between cost of sales, selling, general and administrative expenses and research and development costs. The result was to increase cost of sales, selling, general and administrative expenses and research and development costs by $70,802, $51,746 and $5,580, respectively and to reduce unclassified operating expenses by $128,128. . This adjustment was made to align the expense classification with the accounting policies of Manitex. |
| Z. | Pro forma adjustment to decrease research and development costs by $2,936 which represent the net effect of expensing research and development costs that were capitalized in the period, eliminating the amortization of research and development expenses capitalized in prior periods and eliminating an impairment charge recorded in 2013 related to capitalized research and development costs. This adjustment was made to align the accounting for research and development cost so as to be consistent with Manitex’s accounting policies. |
| AA. | Pro forma adjustment of $1,072 to expense the fair market value inventory adjustment (step up) as all inventory associated with inventory step up is assumed to have been sold at December 31, 2013. |
| AB. | Pro forma adjustment to account for the difference between historical depreciation and depreciation calculated using the fair market value of assets, and their current useful lives subsequent to the PM acquisition. The net effect was to reduce cost of sales by $606. |
| AC. | Pro forma adjustment to account for the difference between historical amortization and amortization calculated using the fair market value of intangible assets, excluding goodwill, and the current useful lives subsequent to the PM acquisition. The net effect was to increase selling, general and administrative expenses by $1,531. |
| AD. | Pro forma adjustments were made to reclassify foreign currency gains and loss and other income that were included in interest expense. The effect of the entries was to reduce interest expense by $1,743, to show a loss on foreign currency transaction of $1,776 and to reflect other income of $33. This adjustment was made to align the expense classification with the accounting policies of Manitex. |
| AE. | Pro forma adjustments were made that reduce interest expense by $1,361. This includes a reduction of interest for $1,943 related to debt forgiven or converted to non-interest bearing debt offset by amortization of $582 of debt discount related to the non-interest bearing debt. |
| AF. | Pro forma adjustment of $34 was made to transfer expenses from the nine months ended September 30, 2014 into 2013 the assumed year of acquisition. |
| AG. | Pro forma adjustments of $1,900 were made to record interest expense for the term loan and the convertible debt issued in connection with the transaction. The term loan has a variable interest rate. It is expected that the actual interest rates that will apply to the term loan may differ from the rates set out herein due to changes in LIBOR. The effect of a change of 12.5 bps in the interest rates would result in an increase or decrease in interest expense of $67 for the year ended December 31, 2013. |
| AH. | Pro forma adjustments were made to tax effect the above pro forma adjustments. The PM pro forma adjustments were tax effected using the Italian statutory income tax rates. The Manitex pro forma adjustments were tax effected using the Company’s effective rate. |
Serious News for Serious Traders! Try StreetInsider.com Premium Free!
You May Also Be Interested In
- Suzano Ventures invests up to US$5 million into Bioform Technologies to further develop bio-based plastic alternatives
- HANDSHAKE SPEAKEASY IN MEXICO CITY NAMED AS THE BEST BAR IN NORTH AMERICA AS RANKING OF NORTH AMERICA'S 50 BEST BARS IS REVEALED AT THIRD ANNUAL AWARDS CEREMONY
- Alvotech Announces Topline Results from a Confirmatory Clinical Study for AVT05, a Proposed Biosimilar for Simponi® (golimumab)
Create E-mail Alert Related Categories
SEC FilingsSign up for StreetInsider Free!
Receive full access to all new and archived articles, unlimited portfolio tracking, e-mail alerts, custom newswires and RSS feeds - and more!
