

Form 8-K/A MACERICH CO For: Aug 01
 Tweet
Tweet Share
ShareQuickLinks -- Click here to rapidly navigate through this document
UNITED STATES
SECURITIES AND EXCHANGE COMMISSION
WASHINGTON, DC 20549
FORM 8-K/A
AMENDMENT NO. 1
TO
CURRENT REPORT
Pursuant to Section 13 or 15(d) of the
Securities Exchange Act of 1934
Date of report (Date of earliest event reported) August 1, 2016
THE MACERICH COMPANY
(Exact Name of Registrant as Specified in Charter)
| MARYLAND (State or Other Jurisdiction of Incorporation) |
1-12504 (Commission File Number) |
95-4448705 (IRS Employer Identification No.) |
401 Wilshire Boulevard, Suite 700, Santa Monica, California 90401
(Address of Principal Executive Offices)
(Zip Code)
Registrant's telephone number, including area code (310) 394-6000
N/A
(Former Name or Former Address, if Changed Since Last report)
Check the appropriate box below if the Form 8-K filing is intended to simultaneously satisfy the filing obligation of the registrant under any of the following provisions (see General Instruction A.2. below):
- o
- Written
communications pursuant to Rule 425 under the Securities Act (17 CFR 230.425)
- o
- Soliciting
material pursuant to Rule 14a-12 under the Exchange Act (17 CFR 240.14a-12)
- o
- Pre-commencement
communications pursuant to Rule 14d-2(b) under the Exchange Act (17 CFR 240.14d-2(b))
- o
- Pre-commencement communications pursuant to Rule 13e-4(c) under the Exchange Act (17 CFR 240.13e-4(c))
This Form 8-K/A amends our Form 8-K, filed on August 1, 2016, to furnish a press release as Exhibit 99.1 that includes financial schedules which were inadvertently omitted from the original Form 8-K.
ITEM 2.02 RESULTS OF OPERATIONS AND FINANCIAL CONDITION.
The Company issued a press release on August 1, 2016 announcing results of operations for the Company for the quarter ended June 30, 2016 and such press release is furnished as Exhibit 99.1 hereto.
The press release included as an exhibit with this report is being furnished pursuant to Item 2.02 and Item 7.01 of Form 8-K and shall not be deemed to be "filed" with the SEC or incorporated by reference into any other filing with the SEC.
ITEM 7.01 REGULATION FD DISCLOSURE.
On August 1, 2016, the Company made available on its website a financial supplement containing financial and operating information of the Company ("Supplemental Financial Information") for the three and six months ended June 30, 2016 and such Supplemental Financial Information is furnished as Exhibit 99.2 hereto.
The Supplemental Financial Information included as an exhibit with this report is being furnished pursuant to Item 7.01 of Form 8-K and shall not be deemed to be "filed" with the SEC or incorporated by reference into any other filing with the SEC.
ITEM 9.01 FINANCIAL STATEMENTS AND EXHIBITS.
Listed below are the financial statements, pro forma financial information and exhibits furnished as part of this report:
(a), (b) and (c) Not applicable.
(d) Exhibits.
Exhibit Index attached hereto and incorporated herein by reference.
2
Pursuant to the requirements of the Securities Exchange Act of 1934, The Macerich Company has duly caused this report to be signed on its behalf by the undersigned hereunto duly authorized.
| THE MACERICH COMPANY | ||
By: THOMAS E. O'HERN |
||
August 1, 2016 Date |
/s/ THOMAS E. O'HERN Senior Executive Vice President, Chief Financial Officer and Treasurer |
3
EXHIBIT NUMBER |
NAME
|
||
|---|---|---|---|
| 99.1 | Press Release dated August 1, 2016 | ||
99.2 |
Supplemental Financial Information for the three and six months ended June 30, 2016 |
||
4
Explanatory Note
-
ITEM 2.02 RESULTS OF OPERATIONS AND FINANCIAL CONDITION.
ITEM 7.01 REGULATION FD DISCLOSURE.
ITEM 9.01 FINANCIAL STATEMENTS AND EXHIBITS.
EXHIBIT INDEX
QuickLinks -- Click here to rapidly navigate through this document
| PRESS RELEASE | ||||
For: |
THE MACERICH COMPANY |
|||
MACERICH ANNOUNCES STRONG QUARTERLY RESULTS |
||||
SANTA MONICA, CA, August 1, 2016—The Macerich Company (NYSE Symbol: MAC) today announced results of operations for the quarter ended June 30, 2016, which included net income attributable to the Company of $45.2 million or $.31 per share-diluted for the quarter ended June 30, 2016 compared to net income attributable to the Company for the quarter ended June 30, 2015 of $14.4 million or $.09 per share-diluted. For the quarter, funds from operations ("FFO") diluted was $160.3 million or $1.02 per share-diluted compared to $151.0 million or $.89 per share-diluted for the quarter ended June 30, 2015. A description and reconciliation of EPS per share-diluted to FFO-diluted is included in the financial tables accompanying this press release.
Results and Capital Highlights
- •
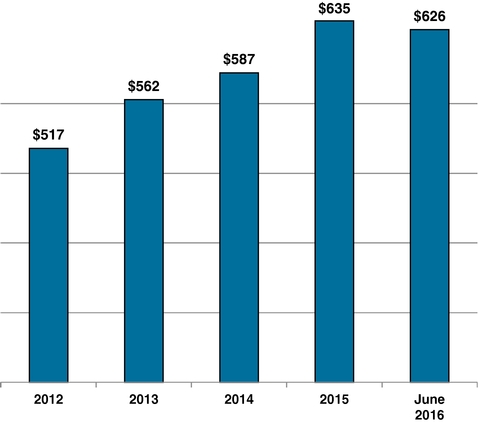
- Mall tenant annual sales per square foot for the portfolio were $626 for the year ended June 30, 2016 compared to $623 for the
year ended June 30, 2015. On a same center basis sales per square foot were $644 for the year ended June 30, 2016 compared to $629 for the year ended June 30, 2015.
- •
- The releasing spreads for the year ended June 30, 2016 were up 16.1%.
- •
- Mall portfolio occupancy was 95.0% at June 30, 2016 compared to 95.5% at June 30, 2015.
- •
- On July 11, 2016, the Company completed an accelerated share repurchase ("ASR") program resulting in the retirement of 5.1 million shares of the Company at an average cost of $78.91.
"During the second quarter we continued to improve our operating margins and to deliver strong releasing spreads. These were the key drivers to our positive earnings and FFO increases and exceptional same center net operating growth of 6.5% during the quarter." said Arthur Coppola, chairman and chief executive officer of Macerich.
Share Repurchase Program
The Company has used a portion of the proceeds from joint ventures that were completed in October 2015 and January 2016 to complete a total of $1.2 billion of share repurchases under the Company's authorized share repurchase program. During a period from November 13, 2015 to January 19, 2016, the Company repurchased 5.11 million shares of Macerich common stock at an average share price of $78.26. From the period of February 18, 2016 to April 19, 2016, the Company retired 5.08 million shares at an average price of $78.69. The Company's third $400 million ASR program was completed on July 11, 2016 and retired 5.07 million shares at an average price of $78.91. The total shares repurchased under all three ASR programs was 15.3 million shares at an average price of $78.62.
Financing Activity
The Company closed on a $375 million loan on The Shops at North Bridge on May 27, 2016. The loan is a 12 year fixed rate loan with an interest rate of 3.68% and a portion of the proceeds were used to pay off the prior loan of $189 million that had an interest rate of 7.50%.
In addition, the Company has arranged for a $225 million loan at The Village at Corte Madera. The term is 12 years and the fixed interest rate is 3.50%. Closing is expected in August 2016.
On July 6, 2016, the Company amended and extended its $1.5 billion line of credit. The new maturity of the facility is July 2020, extendable to July 2021 at the Company's election. The facility is expandable to $2.0 billion. At the Company's current leverage level the borrowing rate is LIBOR plus 1.33%.
2016 Earnings Guidance
Management is revising its previous EPS guidance and is reaffirming its previous estimate of diluted FFO per share guidance for 2016. A reconciliation of estimated EPS to FFO per share-diluted follows:
| |
2016 range | |||
|---|---|---|---|---|
Diluted EPS |
| $3.83 - $3.93 | ||
Plus: real estate depreciation and amortization |
3.07 - 3.07 | |||
Less: gain on sale of dispositions |
| 2.85 - 2.85 | ||
| | | | | |
Diluted FFO per share |
$4.05 - $4.15 | |||
| | | | | |
| | | | | |
| | | | | |
Details of the guidance assumptions are included in the Company's Form 8-K supplemental financial information.
Macerich, an S&P 500 company, is a fully integrated self-managed and self-administered real estate investment trust, which focuses on the acquisition, leasing, management, development and redevelopment of regional malls throughout the United States.
Macerich currently owns 55 million square feet of real estate consisting primarily of interests in 50 regional shopping centers. Macerich specializes in successful retail properties in many of the country's most attractive, densely populated markets with significant presence in the Pacific Rim, Arizona, Chicago, and the New York Metro area to Washington DC corridor. Additional information about Macerich can be obtained from the Company's website at www.macerich.com.
Investor Conference Call
The Company will provide an online Web simulcast and rebroadcast of its quarterly earnings conference call. The call will be available on The Macerich Company's website at www.macerich.com (Investors Section). The call begins August 1, 2016 at 11:00 AM Pacific Time. To listen to the call, please go to the website at least 15 minutes prior to the call in order to register and download audio software if needed. An online replay at www.macerich.com (Investors Section) will be available for one year after the call.
The Company will publish a supplemental financial information package which will be available at www.macerich.com in the Investors Section. It will also be furnished to the SEC as part of a Current Report on Form 8-K.
Note: This release contains statements that constitute forward-looking statements which can be identified by the use of words, such as "expects," "anticipates," "assumes," "projects," "estimated" and "scheduled" and similar expressions that do not relate to historical matters. Stockholders are cautioned that any such forward-looking statements are not guarantees of future performance and involve risks, uncertainties and other factors that may cause actual results, performance or achievements of the Company to vary materially from those anticipated, expected or projected. Such factors include, among others, general industry, as well as national, regional and local economic and business conditions, which will, among other things, affect demand for retail space or retail goods, availability and creditworthiness of current and prospective tenants, anchor or tenant bankruptcies, closures, mergers or consolidations, lease rates, terms and payments, interest rate fluctuations, availability, terms and cost of financing and operating expenses; adverse changes in the real estate markets including, among other things, competition from other companies, retail formats and technology, risks of real estate development and redevelopment, acquisitions and dispositions; the liquidity of real estate investments, governmental
actions and initiatives (including legislative and regulatory changes); environmental and safety requirements; and terrorist activities or other acts of violence which could adversely affect all of the above factors. The reader is directed to the Company's various filings with the Securities and Exchange Commission, including the Annual Report on Form 10-K for the year ended December 31, 2015, for a discussion of such risks and uncertainties, which discussion is incorporated herein by reference. The Company does not intend, and undertakes no obligation, to update any forward-looking information to reflect events or circumstances after the date of this release or to reflect the occurrence of unanticipated events unless required by law to do so.
(See
attached tables)
##
THE MACERICH COMPANY
FINANCIAL HIGHLIGHTS
(IN THOUSANDS, EXCEPT PER SHARE AMOUNTS)
|
|
|||||||||||||
|---|---|---|---|---|---|---|---|---|---|---|---|---|---|
| |
For the Three Months Ended June 30, |
For the Six Months Ended June 30, |
|||||||||||
| |
Unaudited | Unaudited | |||||||||||
| |
2016 | 2015 | 2016 | 2015 | |||||||||
Results of Operations: |
|||||||||||||
Revenues: |
|||||||||||||
Minimum rents |
$ | 152,448 | $ | 193,131 | $ | 303,496 | $ | 383,892 | |||||
Percentage rents |
2,394 | 2,576 | 5,408 | 5,824 | |||||||||
Tenant recoveries |
75,948 | 105,592 | 156,121 | 211,290 | |||||||||
Other income |
17,789 | 15,321 | 30,937 | 28,324 | |||||||||
Management Companies' revenues |
11,325 | 6,174 | 19,942 | 11,799 | |||||||||
| | | | | | | | | | | | | | |
Total revenues |
259,904 | 322,794 | 515,904 | 641,129 | |||||||||
| | | | | | | | | | | | | | |
Expenses: |
|||||||||||||
Shopping center and operating expenses |
73,910 | 93,877 | 153,234 | 195,541 | |||||||||
Management Companies' operating expenses |
24,299 | 20,239 | 52,199 | 46,707 | |||||||||
REIT general and administrative expenses |
7,681 | 7,550 | 16,310 | 15,972 | |||||||||
Costs related to unsolicited takeover offer |
— | 11,423 | — | 24,995 | |||||||||
Depreciation and amortization |
85,190 | 119,333 | 172,121 | 239,951 | |||||||||
Interest expense |
41,195 | 54,896 | 80,971 | 108,182 | |||||||||
Loss (gain) on extinguishment of debt, net |
— | 1,609 | 3,575 | (636 | ) | ||||||||
| | | | | | | | | | | | | | |
Total expenses |
232,275 | 308,927 | 478,410 | 630,712 | |||||||||
| | | | | | | | | | | | | | |
Equity in income of unconsolidated joint ventures |
14,616 | 9,094 | 26,276 | 17,368 | |||||||||
Co-venture expense(a) |
(3,212 | ) | (2,813 | ) | (6,501 | ) | (4,943 | ) | |||||
Income tax (expense) benefit |
(514 | ) | 283 | (1,831 | ) | 1,218 | |||||||
Gain (loss) on sale or write down of assets, net |
10,915 | (4,671 | ) | 445,371 | (3,736 | ) | |||||||
(Loss) gain on remeasurement of assets |
— | (14 | ) | — | 22,089 | ||||||||
| | | | | | | | | | | | | | |
Net income |
49,434 | 15,746 | 500,809 | 42,413 | |||||||||
Less net income attributable to noncontrolling interests |
4,212 | 1,351 | 34,672 | 3,407 | |||||||||
| | | | | | | | | | | | | | |
Net income attributable to the Company |
$ | 45,222 | $ | 14,395 | $ | 466,137 | $ | 39,006 | |||||
| | | | | | | | | | | | | | |
| | | | | | | | | | | | | | |
| | | | | | | | | | | | | | |
Average number of shares outstanding—basic |
146,644 | 158,501 | 149,314 | 158,419 | |||||||||
Average shares outstanding, assuming full conversion of OP Units(b) |
157,477 | 169,079 | 160,141 | 168,966 | |||||||||
Average shares outstanding—Funds From Operations ("FFO")—diluted(b) |
157,602 | 169,211 | 160,286 | 169,134 | |||||||||
Net income per share—basic |
$ | 0.31 | $ | 0.09 | $ | 3.12 | $ | 0.24 | |||||
Net income per share—diluted |
$ | 0.31 | $ | 0.09 | $ | 3.12 | $ | 0.24 | |||||
Dividend declared per share |
$ | 0.68 | $ | 0.65 | $ | 1.36 | $ | 1.30 | |||||
FFO—basic(b)(c) |
$ | 160,348 | $ | 150,993 | $ | 301,377 | $ | 284,527 | |||||
FFO—diluted(b)(c) |
$ | 160,348 | $ | 150,993 | $ | 301,377 | $ | 284,527 | |||||
FFO—diluted, excluding extinguishment of debt and costs related to unsolicited takeover offer(b)(c) |
$ | 160,348 | $ | 164,025 | $ | 304,952 | $ | 308,886 | |||||
FFO per share—basic(b)(c) |
$ | 1.02 | $ | 0.89 | $ | 1.88 | $ | 1.68 | |||||
FFO per share—diluted(b)(c) |
$ | 1.02 | $ | 0.89 | $ | 1.88 | $ | 1.68 | |||||
FFO per share—diluted, excluding extinguishment of debt and costs related to unsolicited takeover offer(b)(c) |
$ | 1.02 | $ | 0.97 | $ | 1.90 | $ | 1.83 | |||||
1
THE MACERICH COMPANY
FINANCIAL HIGHLIGHTS
(IN THOUSANDS, EXCEPT PER SHARE AMOUNTS)
- (a)
- This
represents the outside partners' allocation of net income in the Chandler Fashion Center/Freehold Raceway Mall joint venture.
- (b)
- The
Macerich Partnership, L.P. (the "Operating Partnership" or the "OP") has operating partnership units ("OP units"). OP units can be converted into
shares of Company common stock. Conversion of the OP units not owned by the Company has been assumed for purposes of calculating FFO per share and the weighted average number of shares outstanding.
The computation of average shares for FFO—diluted includes the effect of share and unit-based compensation plans, stock warrants and convertible senior notes using the treasury stock
method. It also assumes conversion of MACWH, LP preferred and common units to the extent they are dilutive to the calculation.
- (c)
- The
Company uses FFO in addition to net income to report its operating and financial results and considers FFO and FFO-diluted as supplemental measures for
the real estate industry and a supplement to Generally Accepted Accounting Principles ("GAAP") measures. The National Association of Real Estate Investment Trusts ("NAREIT") defines FFO as net income
(loss) (computed in accordance with GAAP), excluding gains (or losses) from extraordinary items and sales of depreciated operating properties, plus real estate related depreciation and amortization,
impairment write-downs of real estate and write-downs of investments in an affiliate where the write-downs have been driven by a decrease in the value of real estate held by the affiliate and after
adjustments for unconsolidated joint ventures. Adjustments for unconsolidated joint ventures are calculated to reflect FFO on the same basis.
FFO and FFO on a diluted basis are useful to investors in comparing operating and financial results between periods. This is especially true since FFO excludes real estate depreciation and amortization, as the Company believes real estate values fluctuate based on market conditions rather than depreciating in value ratably on a straight-line basis over time. The Company believes that such a presentation also provides investors with a more meaningful measure of its operating results in comparison to the operating results of other real estate investment trusts ("REITs"). The Company believes that FFO on a diluted basis is a measure investors find most useful in measuring the dilutive impact of outstanding convertible securities. The Company further believes that FFO does not represent cash flow from operations as defined by GAAP, should not be considered as an alternative to net income (loss) as defined by GAAP, and is not indicative of cash available to fund all cash flow needs. The Company also cautions that FFO as presented, may not be comparable to similarly titled measures reported by other REITs.
2
THE MACERICH COMPANY
FINANCIAL HIGHLIGHTS
(IN THOUSANDS, EXCEPT PER SHARE AMOUNTS)
| |
For the Three Months Ended June 30, |
For the Six Months Ended June 30, |
|||||||||||
|---|---|---|---|---|---|---|---|---|---|---|---|---|---|
| |
Unaudited | Unaudited | |||||||||||
|
|
2016 | 2015 | 2016 | 2015 | |||||||||
Reconciliation of Net income attributable to the Company to FFO(c): |
|||||||||||||
Net income attributable to the Company |
$ |
45,222 |
$ |
14,395 |
$ |
466,137 |
$ |
39,006 |
|||||
Adjustments to reconcile net income attributable to the Company to FFO—basic and diluted: |
|||||||||||||
Noncontrolling interests in OP |
3,810 | 961 | 33,795 | 2,596 | |||||||||
(Gain) loss on sale or write down of consolidated assets, net |
(10,915 | ) | 4,671 | (445,371 | ) | 3,736 | |||||||
Loss (gain) on remeasurement of consolidated assets |
— | 14 | — | (22,089 | ) | ||||||||
plus gain on undepreciated asset sales—consolidated assets |
225 | — | 2,637 | 944 | |||||||||
plus non-controlling interests share of gain on sale or write down of consolidated joint ventures, net |
— | — | — | 112 | |||||||||
(Gain) loss on sale or write down of assets from unconsolidated joint ventures (pro rata), net |
(2 | ) | (139 | ) | 2 | (139 | ) | ||||||
plus gain (loss) on undepreciated asset sales—unconsolidated joint ventures (pro rata) |
2 | 142 | (2 | ) | 142 | ||||||||
Depreciation and amortization on consolidated assets |
85,190 | 119,333 | 172,121 | 239,951 | |||||||||
Less depreciation and amortization allocable to noncontrolling interests on consolidated joint ventures |
(3,731 | ) | (3,745 | ) | (7,425 | ) | (7,536 | ) | |||||
Depreciation and amortization on unconsolidated joint ventures (pro rata) |
43,640 | 18,658 | 85,516 | 34,269 | |||||||||
Less: depreciation on personal property |
(3,093 | ) | (3,297 | ) | (6,033 | ) | (6,465 | ) | |||||
| | | | | | | | | | | | | | |
Total FFO—basic and diluted |
160,348 | 150,993 | 301,377 | 284,527 | |||||||||
Loss (gain) on extinguishment of debt, net—consolidated assets |
— | 1,609 | 3,575 | (636 | ) | ||||||||
| | | | | | | | | | | | | | |
Total FFO—diluted, excluding extinguishment of debt |
160,348 | 152,602 | 304,952 | 283,891 | |||||||||
Add: Costs related to unsolicited takeover offer |
— | 11,423 | — | 24,995 | |||||||||
| | | | | | | | | | | | | | |
Total FFO—diluted, excluding extinguishment of debt and costs related to unsolicited takeover offer |
$ | 160,348 | $ | 164,025 | $ | 304,952 | $ | 308,886 | |||||
| | | | | | | | | | | | | | |
| | | | | | | | | | | | | | |
| | | | | | | | | | | | | | |
| |
For the Three Months Ended June 30, |
For the Six Months Ended June 30, |
|||||||||||
|---|---|---|---|---|---|---|---|---|---|---|---|---|---|
| |
Unaudited | Unaudited | |||||||||||
|
|
2016 | 2015 | 2016 | 2015 | |||||||||
Reconciliation of EPS to FFO per diluted share(c): |
|||||||||||||
Earnings per share—diluted |
$ |
0.31 |
$ |
0.09 |
$ |
3.12 |
$ |
0.24 |
|||||
Per share impact of depreciation and amortization of real estate |
0.78 | 0.77 | 1.52 | 1.53 | |||||||||
Per share impact of (gain) loss on remeasurement, sale or write down of assets, net |
(0.07 | ) | 0.03 | (2.76 | ) | (0.09 | ) | ||||||
| | | | | | | | | | | | | | |
FFO per share—diluted |
$ | 1.02 | $ | 0.89 | $ | 1.88 | $ | 1.68 | |||||
Per share impact of loss on extinguishment of debt, net |
— | 0.01 | 0.02 | — | |||||||||
Per share impact of costs related to unsolicited takeover offer |
— | 0.07 | 0.00 | 0.15 | |||||||||
| | | | | | | | | | | | | | |
FFO per share—diluted, excluding extinguishment of debt and costs related to unsolicited takeover offer |
$ | 1.02 | $ | 0.97 | $ | 1.90 | $ | 1.83 | |||||
| | | | | | | | | | | | | | |
| | | | | | | | | | | | | | |
| | | | | | | | | | | | | | |
3
THE MACERICH COMPANY
FINANCIAL HIGHLIGHTS
(IN THOUSANDS, EXCEPT PER SHARE AMOUNTS)
|
|
|||||||||||||
|---|---|---|---|---|---|---|---|---|---|---|---|---|---|
| |
For the Three Months Ended June 30, |
For the Six Months Ended June 30, |
|||||||||||
| |
Unaudited | Unaudited | |||||||||||
| |
2016 | 2015 | 2016 | 2015 | |||||||||
Reconciliation of Net income attributable to the Company to EBITDA: |
|||||||||||||
Net income attributable to the Company |
$ | 45,222 | $ | 14,395 | $ | 466,137 | $ | 39,006 | |||||
Interest expense—consolidated assets |
41,195 |
54,896 |
80,971 |
108,182 |
|||||||||
Interest expense—unconsolidated joint ventures (pro rata) |
24,170 | 8,771 | 46,664 | 17,350 | |||||||||
Depreciation and amortization—consolidated assets |
85,190 | 119,333 | 172,121 | 239,951 | |||||||||
Depreciation and amortization—unconsolidated joint ventures (pro rata) |
43,640 | 18,658 | 85,516 | 34,269 | |||||||||
Noncontrolling interests in OP |
3,810 | 961 | 33,795 | 2,596 | |||||||||
Less: Interest expense and depreciation and amortization allocable to noncontrolling interests on consolidated joint ventures |
(6,057 | ) | (6,099 | ) | (12,100 | ) | (12,278 | ) | |||||
Loss (gain) on extinguishment of debt, net—consolidated assets |
— | 1,609 | 3,575 | (636 | ) | ||||||||
(Gain) loss on sale or write down of assets—consolidated assets, net |
(10,915 | ) | 4,671 | (445,371 | ) | 3,736 | |||||||
Loss (gain) on remeasurement of assets—consolidated assets |
— | 14 | — | (22,089 | ) | ||||||||
(Gain) loss on sale or write down of assets—unconsolidated joint ventures (pro rata), net |
(2 | ) | (139 | ) | 2 | (139 | ) | ||||||
Add: Non-controlling interests share of gain on sale of consolidated assets, net |
— | — | — | 112 | |||||||||
Income tax expense (benefit) |
514 | (283 | ) | 1,831 | (1,218 | ) | |||||||
Distributions on preferred units |
143 | 138 | 286 | 276 | |||||||||
| | | | | | | | | | | | | | |
EBITDA(d) |
$ | 226,910 | $ | 216,925 | $ | 433,427 | $ | 409,118 | |||||
| | | | | | | | | | | | | | |
| | | | | | | | | | | | | | |
| | | | | | | | | | | | | | |
|
|
|||||||||||||
|---|---|---|---|---|---|---|---|---|---|---|---|---|---|
| |
For the Three Months Ended June 30, |
For the Six Months Ended June 30, |
|||||||||||
| |
Unaudited | Unaudited | |||||||||||
| |
2016 | 2015 | 2016 | 2015 | |||||||||
Reconciliation of EBITDA to Net Operating Income ("NOI") and to NOI—Same Centers: |
|||||||||||||
EBITDA(d) |
$ | 226,910 | $ | 216,925 | $ | 433,427 | $ | 409,118 | |||||
Add: REIT general and administrative expenses |
7,681 |
7,550 |
16,310 |
15,972 |
|||||||||
Costs related to unsolicited takeover offer |
— | 11,423 | — | 24,995 | |||||||||
Management Companies' revenues |
(11,325 | ) | (6,174 | ) | (19,942 | ) | (11,799 | ) | |||||
Management Companies' operating expenses |
24,299 | 20,239 | 52,199 | 46,707 | |||||||||
Straight-line and above/below market adjustments |
(8,702 | ) | (7,270 | ) | (15,114 | ) | (13,243 | ) | |||||
| | | | | | | | | | | | | | |
NOI—All Centers |
238,863 | 242,693 | 466,880 | 471,750 | |||||||||
NOI of non-comparable centers |
(26,040 | ) | (42,900 | ) | (46,936 | ) | (79,337 | ) | |||||
| | | | | | | | | | | | | | |
NOI—Same Centers(e) |
$ | 212,823 | $ | 199,793 | $ | 419,944 | $ | 392,413 | |||||
| | | | | | | | | | | | | | |
| | | | | | | | | | | | | | |
| | | | | | | | | | | | | | |
- (d)
- EBITDA
represents earnings before interest, income taxes, depreciation, amortization, noncontrolling interests, extraordinary items, loss (gain) on
remeasurement, sale or write down of assets, loss (gain) on extinguishment of debt and preferred dividends and includes joint ventures at their pro rata share. Management considers EBITDA to be an
appropriate supplemental measure to net income because it helps investors understand the ability of the Company to incur and service debt and make capital expenditures. The Company believes that
EBITDA should not be construed as an alternative to operating income as an indicator of the Company's operating performance, or to cash flows from operating activities (as determined in accordance
with GAAP) or as a measure of liquidity. The Company also cautions that EBITDA, as presented, may not be comparable to similarly titled measurements reported by other companies.
- (e)
- The Company presents same center NOI because the Company believes it is useful for investors to evaluate the operating performance of comparable centers. Same center NOI is calculated using total EBITDA and subtracting out EBITDA from non-comparable centers and eliminating the management companies and the Company's general and administrative expenses and costs related to unsolicited takeover offer. Same center NOI excludes the impact of straight-line and above/below market adjustments to minimum rents.
4
THE MACERICH COMPANY FINANCIAL HIGHLIGHTS (IN THOUSANDS, EXCEPT PER SHARE AMOUNTS)
THE MACERICH COMPANY FINANCIAL HIGHLIGHTS (IN THOUSANDS, EXCEPT PER SHARE AMOUNTS)
THE MACERICH COMPANY FINANCIAL HIGHLIGHTS (IN THOUSANDS, EXCEPT PER SHARE AMOUNTS)
Use these links to rapidly review the document
TABLE OF CONTENTS

Supplemental Financial Information
For the three and six months ended June 30, 2016
The Macerich Company
Supplemental Financial and Operating Information
Table of Contents
All information included in this supplemental financial package is unaudited, unless otherwise indicated.
This Supplemental Financial Information should be read in connection with the Company's second quarter 2016 earnings announcement (included as Exhibit 99.1 of the Company's Current Report on 8-K, event date August 1, 2016) as certain disclosures, definitions and reconciliations in such announcement have not been included in this Supplemental Financial Information.
The Macerich Company
Supplemental Financial and Operating Information
Overview
The Macerich Company (the "Company") is involved in the acquisition, ownership, development, redevelopment, management and leasing of regional and community/power shopping centers located throughout the United States. The Company is the sole general partner of, and owns a majority of the ownership interests in, The Macerich Partnership, L.P., a Delaware limited partnership (the "Operating Partnership").
As of June 30, 2016, the Operating Partnership owned or had an ownership interest in 51 regional shopping centers and seven community/power shopping centers aggregating approximately 55 million square feet of gross leasable area ("GLA").
On July 15, 2016, the Company conveyed Flagstaff Mall to the mortgage lender by a deed-in-lieu of foreclosure and was discharged from the non-recourse mortgage note payable. Consequently, Flagstaff Mall has been excluded from all Non-GAAP operating data for the periods ended June 30, 2016 and December 31, 2015, including Sales per square foot, Occupancy, Average Base Rent per square foot and Cost of Occupancy as well as the Property Listing.
Excluding Flagstaff Mall, the Company currently owns 50 regional shopping centers and 7 community/power centers aggregating approximately 55 million square feet. These 57 centers (which include any related office space) are referred to hereinafter as the "Centers", unless the context requires otherwise.
The Company is a self-administered and self-managed real estate investment trust ("REIT") and conducts all of its operations through the Operating Partnership and the Company's management companies (collectively, the "Management Companies").
All references to the Company in this Exhibit include the Company, those entities owned or controlled by the Company and predecessors of the Company, unless the context indicates otherwise.
This document contains information constituting forward-looking statements and includes expectations regarding the Company's future operational results as well as development, redevelopment and expansion activities. Stockholders are cautioned that any such forward-looking statements are not guarantees of future performance and involve risks, uncertainties and other factors that may cause actual results, performance or achievements of the Company to vary materially from those anticipated, expected or projected. Such factors include, among others, general industry, economic and business conditions, which will, among other things, affect demand for retail space or retail goods, availability and creditworthiness of current and prospective tenants, anchor or tenant bankruptcies, closures, mergers or consolidations, lease rates, terms and payments, interest rate fluctuations, availability, terms and cost of financing, operating expenses, and competition; adverse changes in the real estate markets, including the liquidity of real estate investments; and risks of real estate development, redevelopment, and expansion, including availability, terms and cost of financing, construction delays, environmental and safety requirements, budget overruns, sunk costs and lease-up; the inability to obtain, or delays in obtaining, all necessary zoning, land-use, building, and occupancy and other required governmental permits and authorizations; and governmental actions and initiatives (including legislative and regulatory changes) as well as terrorist activities or other acts of violence which could adversely affect all of the above factors. Furthermore, occupancy rates and rents at a newly completed property may not be sufficient to make the property profitable. The reader is directed to the Company's various filings with the Securities and Exchange Commission, including the Annual Report on Form 10-K for the year ended December 31, 2015, for a discussion of such risks and uncertainties, which discussion is incorporated herein by reference. The Company does not intend, and undertakes no obligation, to update any forward-looking information to reflect events or circumstances after the date of this document or to reflect the occurrence of unanticipated events unless required by law to do so.
1
The Macerich Company
Supplemental Financial and Operating Information (unaudited)
Capital Information and Market Capitalization
| |
Period Ended | |||||||||
|---|---|---|---|---|---|---|---|---|---|---|
| |
6/30/2016 | 12/31/2015 | 12/31/2014 | |||||||
| |
dollars in thousands, except per share data |
|||||||||
Closing common stock price per share |
$ | 85.39 | $ | 80.69 | $ | 83.41 | ||||
52 week high |
$ | 86.29 | $ | 95.93 | $ | 85.55 | ||||
52 week low |
$ | 71.82 | $ | 71.98 | $ | 55.21 | ||||
Shares outstanding at end of period |
||||||||||
Class A non-participating convertible preferred units |
138,759 | 138,759 | 145,839 | |||||||
Common shares and partnership units |
155,509,918 | 165,260,655 | 168,721,053 | |||||||
| | | | | | | | | | | |
Total common and equivalent shares/units outstanding |
155,648,677 | 165,399,414 | 168,866,892 | |||||||
| | | | | | | | | | | |
| | | | | | | | | | | |
| | | | | | | | | | | |
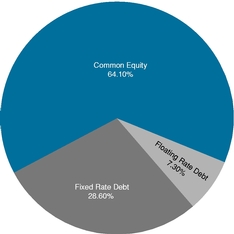
Portfolio capitalization data |
||||||||||
Total portfolio debt, including joint ventures at pro rata |
$ | 7,430,517 | $ | 7,010,306 | $ | 7,050,437 | ||||
Equity market capitalization |
13,290,840 | 13,346,079 | 14,085,187 | |||||||
| | | | | | | | | | | |
Total market capitalization |
$ | 20,721,357 | $ | 20,356,385 | $ | 21,135,624 | ||||
| | | | | | | | | | | |
| | | | | | | | | | | |
| | | | | | | | | | | |
Leverage ratio(a) |
35.9 | % | 34.4 | % | 33.4 | % | ||||
- (a)
- Debt as a percentage of total market capitalization.
Portfolio Capitalization at June 30, 2016
2
The Macerich Company
Supplemental Financial and Operating Information (unaudited)
Changes in Total Common and Equivalent Shares/Units
|
|
|||||||||||||
|---|---|---|---|---|---|---|---|---|---|---|---|---|---|
| |
Partnership Units |
Company Common Shares |
Class A Non-Participating Convertible Preferred Units |
Total Common and Equivalent Shares/ Units |
|||||||||
Balance as of December 31, 2015 |
10,855,669 | 154,404,986 | 138,759 | 165,399,414 | |||||||||
| | | | | | | | | | | | | | |
| | | | | | | | | | | | | | |
| | | | | | | | | | | | | | |
Conversion of partnership units to cash |
(377 | ) | — | — | (377 | ) | |||||||
Conversion of partnership units to common shares |
(157,529 | ) | 157,529 | — | — | ||||||||
Issuance of stock/partnership units from restricted stock issuance or other share or unit-based plans |
154,686 | 86,202 | — | 240,888 | |||||||||
Repurchase of common shares under the Accelerated Stock Purchase Plan |
— | (5,192,802 | ) | — | (5,192,802 | ) | |||||||
| | | | | | | | | | | | | | |
Balance as of March 31, 2016 |
10,852,449 | 149,455,915 | 138,759 | 160,447,123 | |||||||||
| | | | | | | | | | | | | | |
| | | | | | | | | | | | | | |
| | | | | | | | | | | | | | |
Conversion of partnership units to common shares |
(20,614 | ) | 20,614 | — | — | ||||||||
Issuance of stock/partnership units from restricted stock issuance or other share or unit-based plans |
— | 27,601 | — | 27,601 | |||||||||
Repurchase of common shares under the Accelerated Stock Purchase Plan |
— | (4,826,047 | ) | — | (4,826,047 | ) | |||||||
| | | | | | | | | | | | | | |
Balance as of June 30, 2016 |
10,831,835 | 144,678,083 | 138,759 | 155,648,677 | |||||||||
| | | | | | | | | | | | | | |
| | | | | | | | | | | | | | |
| | | | | | | | | | | | | | |
3
On the following pages, the Company presents its unaudited pro rata statement of operations and unaudited pro rata balance sheet reflecting the Company's proportionate ownership of each asset in its portfolio. The Company also reconciles net income attributable to the Company to funds from operations ("FFO") and FFO-diluted for the three and six months ended June 30, 2016.
4
UNAUDITED PRO RATA STATEMENT OF OPERATIONS
(Dollars in thousands)
| |
For the Three Months Ended June 30, 2016 | |||||||||||||||
|---|---|---|---|---|---|---|---|---|---|---|---|---|---|---|---|---|
|
|
Consolidated | Non- Controlling Interests(1) |
Company's Consolidated Share |
Company's Share of Joint Ventures(2) |
Company's Total Share |
|||||||||||
Revenues: |
||||||||||||||||
Minimum rents |
$ | 152,448 | $ | (8,295 | ) | $ | 144,153 | $ | 78,551 | $ | 222,704 | |||||
Percentage rents |
2,394 | (25 | ) | 2,369 | 1,477 | 3,846 | ||||||||||
Tenant recoveries |
75,948 | (4,685 | ) | 71,263 | 30,496 | 101,759 | ||||||||||
Other income |
17,789 | (467 | ) | 17,322 | 6,789 | 24,111 | ||||||||||
Management Companies' revenues |
11,325 | — | 11,325 | — | 11,325 | |||||||||||
| | | | | | | | | | | | | | | | | |
Total revenues |
259,904 | (13,472 | ) | 246,432 | 117,313 | 363,745 | ||||||||||
| | | | | | | | | | | | | | | | | |
Expenses: |
||||||||||||||||
Shopping center and operating expenses |
73,910 | (3,801 | ) | 70,109 | 34,889 | 104,998 | ||||||||||
Management Companies' operating expenses |
24,299 | — | 24,299 | — | 24,299 | |||||||||||
REIT general and administrative expenses |
7,681 | — | 7,681 | — | 7,681 | |||||||||||
Depreciation and amortization |
85,190 | (3,731 | ) | 81,459 | 43,640 | 125,099 | ||||||||||
Interest expense |
41,195 | (2,326 | ) | 38,869 | 24,170 | 63,039 | ||||||||||
| | | | | | | | | | | | | | | | | |
Total expenses |
232,275 | (9,858 | ) | 222,417 | 102,699 | 325,116 | ||||||||||
Equity in income of unconsolidated joint ventures |
14,616 | — | 14,616 | (14,616 | ) | — | ||||||||||
Co-venture expense |
(3,212 | ) | 3,212 | — | — | — | ||||||||||
Income tax expense |
(514 | ) | — | (514 | ) | — | (514 | ) | ||||||||
Gain on sale or write down of assets, net |
10,915 | — | 10,915 | 2 | 10,917 | |||||||||||
| | | | | | | | | | | | | | | | | |
Net income |
49,434 | (402 | ) | 49,032 | — | 49,032 | ||||||||||
Less net income attributable to noncontrolling interests |
4,212 | (402 | ) | 3,810 | — | 3,810 | ||||||||||
| | | | | | | | | | | | | | | | | |
Net income attributable to the Company |
$ | 45,222 | $ | — | $ | 45,222 | $ | — | $ | 45,222 | ||||||
| | | | | | | | | | | | | | | | | |
| | | | | | | | | | | | | | | | | |
| | | | | | | | | | | | | | | | | |
Reconciliation of net income attributable to the Company to FFO(3): |
||||||||||||||||
Net income attributable to the Company |
$ |
45,222 |
$ |
— |
$ |
45,222 |
||||||||||
Equity in income of unconsolidated joint ventures |
(14,616 | ) | 14,616 | — | ||||||||||||
Adjustments to reconcile net income to FFO—basic and diluted: |
||||||||||||||||
Noncontrolling interests in the Operating Partnership |
3,810 | — | 3,810 | |||||||||||||
Gain on sale or write down of assets, net |
(10,915 | ) | (2 | ) | (10,917 | ) | ||||||||||
Gain on sale of undepreciated assets, net |
225 | 2 | 227 | |||||||||||||
Depreciation and amortization of all property |
81,459 | 43,640 | 125,099 | |||||||||||||
Depreciation on personal property |
(2,544 | ) | (549 | ) | (3,093 | ) | ||||||||||
| | | | | | | | | | | | | | | | | |
Total FFO—Basic and diluted |
$ | 102,641 | $ | 57,707 | $ | 160,348 | ||||||||||
| | | | | | | | | | | | | | | | | |
| | | | | | | | | | | | | | | | | |
| | | | | | | | | | | | | | | | | |
5
THE MACERICH COMPANY
UNAUDITED PRO RATA STATEMENT OF OPERATIONS
(Dollars in thousands)
| |
For the Six Months Ended June 30, 2016 | |||||||||||||||
|---|---|---|---|---|---|---|---|---|---|---|---|---|---|---|---|---|
|
|
Consolidated | Non- Controlling Interests(1) |
Company's Consolidated Share |
Company's Share of Joint Ventures(2) |
Company's Total Share |
|||||||||||
Revenues: |
||||||||||||||||
Minimum rents |
$ | 303,496 | $ | (16,610 | ) | $ | 286,886 | $ | 149,743 | $ | 436,629 | |||||
Percentage rents |
5,408 | (101 | ) | 5,307 | 2,787 | 8,094 | ||||||||||
Tenant recoveries |
156,121 | (9,425 | ) | 146,696 | 59,369 | 206,065 | ||||||||||
Other income |
30,937 | (1,029 | ) | 29,908 | 13,632 | 43,540 | ||||||||||
Management Companies' revenues |
19,942 | — | 19,942 | — | 19,942 | |||||||||||
| | | | | | | | | | | | | | | | | |
Total revenues |
515,904 | (27,165 | ) | 488,739 | 225,531 | 714,270 | ||||||||||
| | | | | | | | | | | | | | | | | |
Expenses: |
||||||||||||||||
Shopping center and operating expenses |
153,234 | (7,687 | ) | 145,547 | 67,073 | 212,620 | ||||||||||
Management Companies' operating expenses |
52,199 | — | 52,199 | — | 52,199 | |||||||||||
REIT general and administrative expenses |
16,310 | — | 16,310 | — | 16,310 | |||||||||||
Depreciation and amortization |
172,121 | (7,425 | ) | 164,696 | 85,516 | 250,212 | ||||||||||
Interest expense |
80,971 | (4,675 | ) | 76,296 | 46,664 | 122,960 | ||||||||||
Loss on extinguishment of debt, net |
3,575 | — | 3,575 | — | 3,575 | |||||||||||
| | | | | | | | | | | | | | | | | |
Total expenses |
478,410 | (19,787 | ) | 458,623 | 199,253 | 657,876 | ||||||||||
Equity in income of unconsolidated joint ventures |
26,276 | — | 26,276 | (26,276 | ) | — | ||||||||||
Co-venture expense |
(6,501 | ) | 6,501 | — | — | — | ||||||||||
Income tax expense |
(1,831 | ) | — | (1,831 | ) | — | (1,831 | ) | ||||||||
Gain (loss) on sale or write down of assets, net |
445,371 | — | 445,371 | (2 | ) | 445,369 | ||||||||||
| | | | | | | | | | | | | | | | | |
Net income |
500,809 | (877 | ) | 499,932 | — | 499,932 | ||||||||||
Less net income attributable to noncontrolling interests |
34,672 | (877 | ) | 33,795 | — | 33,795 | ||||||||||
| | | | | | | | | | | | | | | | | |
Net income attributable to the Company |
$ | 466,137 | $ | — | $ | 466,137 | $ | — | $ | 466,137 | ||||||
| | | | | | | | | | | | | | | | | |
| | | | | | | | | | | | | | | | | |
| | | | | | | | | | | | | | | | | |
Reconciliation of net income attributable to the Company to FFO(3): |
||||||||||||||||
Net income attributable to the Company |
$ |
466,137 |
$ |
— |
$ |
466,137 |
||||||||||
Equity in income of unconsolidated joint ventures |
(26,276 | ) | 26,276 | — | ||||||||||||
Adjustments to reconcile net income to FFO—basic and diluted: |
||||||||||||||||
Noncontrolling interests in the Operating Partnership |
33,795 | — | 33,795 | |||||||||||||
(Gain) loss on sale or write down of assets, net |
(445,371 | ) | 2 | (445,369 | ) | |||||||||||
Gain (loss) on sale of undepreciated assets, net |
2,637 | (2 | ) | 2,635 | ||||||||||||
Depreciation and amortization of all property |
164,696 | 85,516 | 250,212 | |||||||||||||
Depreciation on personal property |
(4,995 | ) | (1,038 | ) | (6,033 | ) | ||||||||||
| | | | | | | | | | | | | | | | | |
Total FFO—Basic and diluted |
190,623 | 110,754 | 301,377 | |||||||||||||
Loss on extinguishment of debt, net |
3,575 | — | 3,575 | |||||||||||||
| | | | | | | | | | | | | | | | | |
Total FFO—diluted, excluding extinguishment of debt |
$ | 194,198 | $ | 110,754 | $ | 304,952 | ||||||||||
| | | | | | | | | | | | | | | | | |
| | | | | | | | | | | | | | | | | |
| | | | | | | | | | | | | | | | | |
6
Notes to Unaudited Pro Rata Statement of Operations
- (1)
- This
represents the non-owned portion of consolidated joint ventures.
- (2)
- This
represents the Company's pro rata share of unconsolidated joint ventures.
- (3)
- The Company uses FFO in addition to net income to report its operating and financial results and considers FFO and FFO-diluted as supplemental measures for the real estate industry and a supplement to Generally Accepted Accounting Principles ("GAAP") measures. The National Association of Real Estate Investment Trusts ("NAREIT") defines FFO as net income (loss) (computed in accordance with GAAP), excluding gains (or losses) from extraordinary items and sales of depreciated operating properties, plus real estate related depreciation and amortization, impairment write-downs of real estate and write-downs of investments in an affiliate where the write-downs have been driven by a decrease in the value of real estate held by the affiliate and after adjustments for unconsolidated joint ventures. Adjustments for unconsolidated joint ventures are calculated to reflect FFO on the same basis.
FFO and FFO on a diluted basis are useful to investors in comparing operating and financial results between periods. This is especially true since FFO excludes real estate depreciation and amortization, as the Company believes real estate values fluctuate based on market conditions rather than depreciating in value ratably on a straight-line basis over time. The Company believes that such a presentation also provides investors with a more meaningful measure of its operating results in comparison to the operating results of other REITs. The Company believes that FFO on a diluted basis is a measure investors find most useful in measuring the dilutive impact of outstanding convertible securities. The Company further believes that FFO does not represent cash flow from operations as defined by GAAP, should not be considered as an alternative to net income (loss) as defined by GAAP, and is not indicative of cash available to fund all cash flow needs. The Company also cautions that FFO, as presented, may not be comparable to similarly titled measures reported by other REITs.
Management compensates for the limitations of FFO by providing investors with financial statements prepared according to GAAP, along with a detailed discussion of FFO and a reconciliation of FFO and FFO-diluted to net income attributable to the Company. Management believes that to further understand the Company's performance, FFO should be compared with the Company's reported net income and considered in addition to cash flows in accordance with GAAP, as presented in the Company's consolidated financial statements.
7
UNAUDITED PRO RATA BALANCE SHEET
(All Dollars in thousands)
| |
As of June 30, 2016 | |||||||||||||||
|---|---|---|---|---|---|---|---|---|---|---|---|---|---|---|---|---|
|
|
Consolidated | Non- Controlling Interests(1) |
Company's Consolidated Share |
Company's Share of Joint Ventures(2) |
Company's Total Share |
|||||||||||
ASSETS: |
||||||||||||||||
Property, net(3) |
$ | 7,442,988 | $ | (313,015 | ) | $ | 7,129,973 | $ | 4,404,955 | $ | 11,534,928 | |||||
Cash and cash equivalents |
73,138 | (6,408 | ) | 66,730 | 83,150 | 149,880 | ||||||||||
Restricted cash |
44,997 | — | 44,997 | 4,558 | 49,555 | |||||||||||
Tenant and other receivables, net |
110,670 | (18,546 | ) | 92,124 | 45,842 | 137,966 | ||||||||||
Deferred charges and other assets, net |
488,941 | (5,557 | ) | 483,384 | 190,130 | 673,514 | ||||||||||
Due from affiliates |
70,615 | 299 | 70,914 | 2,375 | 73,289 | |||||||||||
Investments in unconsolidated joint ventures |
1,766,330 | — | 1,766,330 | (1,766,330 | ) | — | ||||||||||
| | | | | | | | | | | | | | | | | |
Total assets |
$ | 9,997,679 | $ | (343,227 | ) | $ | 9,654,452 | $ | 2,964,680 | $ | 12,619,132 | |||||
| | | | | | | | | | | | | | | | | |
| | | | | | | | | | | | | | | | | |
| | | | | | | | | | | | | | | | | |
LIABILITIES AND EQUITY: |
||||||||||||||||
Mortgage notes payable |
$ | 3,897,189 | $ | (230,382 | ) | $ | 3,666,807 | $ | 2,691,390 | $ | 6,358,197 | |||||
Bank and other notes payable |
1,015,323 | (3,003 | ) | 1,012,320 | 60,000 | 1,072,320 | ||||||||||
Accounts payable and accrued expenses |
52,836 | (2,267 | ) | 50,569 | 38,089 | 88,658 | ||||||||||
Other accrued liabilities |
372,954 | (22,974 | ) | 349,980 | 196,422 | 546,402 | ||||||||||
Distributions in excess of investment in unconsolidated joint ventures |
21,221 | — | 21,221 | (21,221 | ) | — | ||||||||||
Co-venture obligation |
61,055 | (61,055 | ) | — | — | — | ||||||||||
| | | | | | | | | | | | | | | | | |
Total liabilities |
5,420,578 | (319,681 | ) | 5,100,897 | 2,964,680 | 8,065,577 | ||||||||||
| | | | | | | | | | | | | | | | | |
Commitments and contingencies |
||||||||||||||||
Equity: |
||||||||||||||||
Stockholders' equity: |
||||||||||||||||
Common stock |
1,447 | — | 1,447 | — | 1,447 | |||||||||||
Additional paid-in capital |
4,613,114 | — | 4,613,114 | — | 4,613,114 | |||||||||||
Accumulated deficit |
(378,389 | ) | — | (378,389 | ) | — | (378,389 | ) | ||||||||
| | | | | | | | | | | | | | | | | |
Total stockholders' equity |
4,236,172 | — | 4,236,172 | — | 4,236,172 | |||||||||||
Noncontrolling interests |
340,929 | (23,546 | ) | 317,383 | — | 317,383 | ||||||||||
| | | | | | | | | | | | | | | | | |
Total equity |
4,577,101 | (23,546 | ) | 4,553,555 | — | 4,553,555 | ||||||||||
| | | | | | | | | | | | | | | | | |
Total liabilities and equity |
$ | 9,997,679 | $ | (343,227 | ) | $ | 9,654,452 | $ | 2,964,680 | $ | 12,619,132 | |||||
| | | | | | | | | | | | | | | | | |
| | | | | | | | | | | | | | | | | |
| | | | | | | | | | | | | | | | | |
- (1)
- This
represents the non-owned portion of the consolidated joint ventures.
- (2)
- This
represents the Company's pro rata share of unconsolidated joint ventures.
- (3)
- Includes construction in progress of $286,194 from the Company's consolidated share and $128,345 from its pro rata share of unconsolidated joint ventures.
8
2016 Guidance Range (Unaudited)
Management is revising its EPS guidance and is reaffirming its previous estimate of FFO per share guidance for 2016. A reconciliation of estimated EPS to FFO per share-diluted follows:
|
|
Year 2016 Guidance |
|
||
|---|---|---|---|---|
Earnings Expectations: |
||||
Earnings per share—diluted |
$3.83 - $3.93 |
|
||
Plus: real estate depreciation and amortization |
$3.07 - $3.07 | |||
Less: gain on sale of depreciated assets |
($2.85) - ($2.85) |
|||
| | | | | |
FFO per share—diluted |
$4.05 - $4.15 | |||
| | | | | |
| | | | | |
| | | | | |
Underlying Assumptions to 2016 Guidance |
|
|
||
Cash Same Center Net Operating Income ("NOI") Growth(a) |
4.50% - 5.00% | |||
Assumed acquisitions(b) |
$330 million |
|
||
Assumed dispositions(c) |
$1.15 billion |
|
|
|
Year 2016 FFO / Share Impact |
|||
|---|---|---|---|---|---|
Lease termination income |
$15 million | $0.10 | |||
Capitalized interest |
$16 million | $0.10 | |||
Bad debt expense |
($5 million) | ($0.03 | ) | ||
Loss on early extinguishment of debt(d) |
($3.5 million) | ($0.02 | ) | ||
Dilutive impact on 2016 of assets sold in 2015 and 2016(e) |
($75 million) | ($0.48 | ) | ||
Share repurchase program(f) |
$800 million | $0.17 |
- (a)
- Excludes
non cash items of straight-line and above/below market adjustments to minimum rents. Includes lease termination income.
- (b)
- On
March 1, 2016, the Company purchased Country Club Plaza located in Kansas City, Missouri in a 50/50 joint venture. The amount reflected on the above
table represents the Company's share of the gross purchase price. The projected pro rata FFO from this Center is included in the 2016 Guidance Range above.
- (c)
- The
Company contributed an interest in four properties to joint ventures in January 2016. Subsequent to the contributions, the Company retained a 60.0%
interest in Arrowhead Towne Center and a 51.0% interest in Deptford Mall, FlatIron Crossing and Twenty Ninth Street. On April 13, 2016, the Company sold Capitola Mall for $93 million.
The amount listed above represents the gross sales proceeds before debt from these transactions.
- (d)
- This
represents the loss on early extinguishment of the debt encumbering Arrowhead Towne Center in January 2016.
- (e)
- Includes
approximately $0.08 dilutive impact of special dividends paid in December 2015 and January 2016 and includes approximately $0.10 dilutive impact of
the difference in debt premium amortization between 2015 and 2016.
- (f)
- This assumes an additional $800M buy-back program during the first half of 2016 at an average share price of $80.
9
The Macerich Company
Supplemental Financial and Operating Information (unaudited)
Supplemental FFO Information(a)
| |
As of June 30, | ||||||
|---|---|---|---|---|---|---|---|
| |
2016 | 2015 | |||||
| |
dollars in millions |
||||||
Straight-line rent receivable |
$ | 76.2 | $ | 74.8 | |||
| |
For the Three Months Ended June 30, |
For the Six Months Ended June 30, |
|||||||||||
|---|---|---|---|---|---|---|---|---|---|---|---|---|---|
| |
2016 | 2015 | 2016 | 2015 | |||||||||
| |
dollars in millions |
||||||||||||
Lease termination income |
$ | 5.9 | $ | 2.8 | $ | 9.4 | $ | 5.4 | |||||
Straight-line rental income |
$ | 3.7 | $ | 2.5 | $ | 5.9 | $ | 4.0 | |||||
Gain on sales of undepreciated assets |
$ | 0.2 | $ | 0.1 | $ | 2.6 | $ | 1.1 | |||||
Amortization of acquired above and below-market leases |
$ | 5.1 | $ | 4.8 | $ | 9.3 | $ | 9.2 | |||||
Amortization of debt premiums |
$ | 1.0 | $ | 5.5 | $ | 2.0 | $ | 12.4 | |||||
Interest capitalized |
$ | 4.6 | $ | 5.2 | $ | 8.7 | $ | 9.9 | |||||
- (a)
- All joint venture amounts included at pro rata.
10
The Macerich Company
Supplemental Financial and Operating Information (unaudited)
Capital Expenditures
| |
For the Six Months Ended | |
|
||||||||||
|---|---|---|---|---|---|---|---|---|---|---|---|---|---|
| |
Year Ended 12/31/15 |
Year Ended 12/31/14 |
|||||||||||
| |
6/30/16 | 6/30/15 | |||||||||||
| |
dollars in millions |
||||||||||||
Consolidated Centers |
| | | | |||||||||
Acquisitions of property and equipment |
$ | 14.3 | $ | 43.4 | $ | 79.8 | $ | 97.9 | |||||
Development, redevelopment, expansions and renovations of Centers |
| 72.8 | | 79.0 | | 218.7 | | 197.9 | |||||
Tenant allowances |
7.8 | 14.2 | 30.4 | 30.5 | |||||||||
Deferred leasing charges |
| 12.8 | | 16.9 | | 26.8 | | 26.6 | |||||
| | | | | | | | | | | | | | |
Total |
$ | 107.7 | $ | 153.5 | $ | 355.7 | $ | 352.9 | |||||
| | | | | | | | | | | | | | |
| | | | | | | | | | | | | | |
| | | | | | | | | | | | | | |
Unconsolidated Joint Venture Centers(a) |
| | | | |||||||||
Acquisitions of property and equipment |
$ | 332.0 | $ | 151.7 | $ | 160.0 | $ | 158.8 | |||||
Development, redevelopment, expansions and renovations of Centers |
| 52.3 | | 66.7 | | 132.9 | | 201.8 | |||||
Tenant allowances |
4.7 | 1.1 | 6.3 | 4.8 | |||||||||
Deferred leasing charges |
| 3.9 | | 1.4 | | 3.3 | | 3.0 | |||||
| | | | | | | | | | | | | | |
Total |
$ | 392.9 | $ | 220.9 | $ | 302.5 | $ | 368.4 | |||||
| | | | | | | | | | | | | | |
| | | | | | | | | | | | | | |
| | | | | | | | | | | | | | |
- (a)
- All joint venture amounts at pro rata.
11
The Macerich Company
Supplemental Financial and Operating Information (unaudited)
Regional Shopping Center Portfolio
Sales Per Square Foot(a)
| |
Consolidated Centers |
Unconsolidated Joint Venture Centers |
Total Centers |
|||
|---|---|---|---|---|---|---|
06/30/2016(b) |
$567 | $711 | $626 | |||
06/30/2015 |
$586 | $800 | $623 | |||
12/31/2015(b) |
$579 | $763 | $635 | |||
12/31/2014(c) |
$556 | $724 | $587 | |||
12/31/2013(d) |
$488 | $717 | $562 | |||
12/31/2012 |
$463 | $629 | $517 |
- (a)
- Sales
are based on reports by retailers leasing mall and freestanding stores for the trailing 12 months for tenants which have occupied such stores
for a minimum of 12 months. Sales per square foot are based on tenants 10,000 square feet and under for regional shopping centers. Sales per square foot exclude Centers under development and
redevelopment.
- (b)
- On
July 15, 2016, the Company conveyed Flagstaff Mall to the mortgage lender by a deed-in-lieu of foreclosure. Consequently, Flagstaff Mall is
excluded from sales per square foot as of June 30, 2016 and December 31, 2015.
- (c)
- On
June 30, 2015, the Company conveyed Great Northern Mall to the mortgage lender by a deed-in-lieu of foreclosure. Consequently, Great Northern Mall
is excluded from Sales per square foot as of December 31, 2014.
- (d)
- Rotterdam Square, sold January 15, 2014, is excluded at December 31, 2013.
12
The Macerich Company
Sales Per Square Foot by Property Ranking (Unaudited)
| |
|
|
|
|
|
|
|
% of Portfolio 2016 Forecast Pro Rata Real Estate NOI (d) |
|||||||||||||||||
|---|---|---|---|---|---|---|---|---|---|---|---|---|---|---|---|---|---|---|---|---|---|---|---|---|---|
| |
Sales Per Square Foot | Occupancy | Cost of Occupancy for the Trailing 12 Months Ended 6/30/2016 (c) |
||||||||||||||||||||||
| Properties | 6/30/2016 (a) |
12/31/2015 (a) |
6/30/2015 (a) |
6/30/2016 (b) |
12/31/2015 (b) |
6/30/2015 (b) |
|||||||||||||||||||
| Group 1: Top 10 | | | | | | | | | |||||||||||||||||
Corte Madera, Village at |
$ | 1,498 | $ | 1,475 | $ | 1,316 | 89.1 | % | 97.9 | % | 97.3 | % | |||||||||||||
Queens Center |
$ | 1,334 | $ | 1,134 | $ | 1,142 | | 97.5 | % | | 98.2 | % | | 96.2 | % | | | | | ||||||
Washington Square |
$ | 1,004 | $ | 1,125 | $ | 1,118 | 99.2 | % | 98.4 | % | 97.7 | % | |||||||||||||
North Bridge, The Shops at |
$ | 910 | $ | 856 | $ | 851 | | 99.5 | % | | 99.8 | % | | 100.0 | % | | | | | ||||||
Tysons Corner Center |
$ | 863 | $ | 851 | $ | 856 | 98.8 | % | 98.9 | % | 98.2 | % | |||||||||||||
Los Cerritos Center |
$ | 872 | $ | 843 | $ | 764 | | 95.6 | % | | 97.2 | % | | 98.5 | % | | | | | ||||||
Biltmore Fashion Park |
$ | 824 | $ | 835 | $ | 864 | 97.8 | % | 99.0 | % | 97.0 | % | |||||||||||||
Santa Monica Place |
$ | 782 | $ | 786 | $ | 809 | | 84.7 | % | | 90.5 | % | | 92.2 | % | | | | | ||||||
Tucson La Encantada |
$ | 777 | $ | 767 | $ | 763 | 94.9 | % | 94.8 | % | 92.0 | % | |||||||||||||
Broadway Plaza(e) |
| n/a | | n/a | | n/a | | n/a | | n/a | | n/a | | | | | |||||||||
| | | | | | | | | | | | | | | | | | | | | | | | | | |
| Total Top 10: | $ | 978 | $ | 957 | $ | 939 | 96.4 | % | 97.7 | % | 97.2 | % | 13.7 | % | 28.2 | % | |||||||||
| | | | | | | | | | | | | | | | | | | | | | | | | | |
| Group 2: Top 11-20 | | | | | | | | | | | |||||||||||||||
Scottsdale Fashion Square |
$ | 722 | $ | 745 | $ | 748 | 96.3 | % | 97.8 | % | 96.8 | % | |||||||||||||
Arrowhead Towne Center |
$ | 755 | $ | 741 | $ | 710 | | 95.3 | % | | 95.4 | % | | 96.5 | % | | | | | ||||||
Fashion Outlets of Chicago |
$ | 750 | $ | 734 | $ | 719 | 96.4 | % | 97.9 | % | 93.8 | % | |||||||||||||
Kings Plaza Shopping Center |
$ | 720 | $ | 720 | $ | 690 | | 94.5 | % | | 92.3 | % | | 92.9 | % | | | | | ||||||
Vintage Faire Mall |
$ | 696 | $ | 677 | $ | 661 | 94.5 | % | 96.7 | % | 96.4 | % | |||||||||||||
Kierland Commons |
$ | 662 | $ | 670 | $ | 687 | | 98.7 | % | | 98.3 | % | | 97.0 | % | | | | | ||||||
Chandler Fashion Center |
$ | 656 | $ | 649 | $ | 627 | 96.4 | % | 96.9 | % | 96.6 | % | |||||||||||||
Green Acres Mall |
$ | 636 | $ | 643 | $ | 616 | | 93.5 | % | | 93.2 | % | | 92.3 | % | | | | | ||||||
Fresno Fashion Fair |
$ | 675 | $ | 642 | $ | 617 | 94.5 | % | 98.1 | % | 98.1 | % | |||||||||||||
Country Club Plaza(f) |
| n/a | | n/a | | n/a | | n/a | | n/a | | n/a | | | | | |||||||||
| | | | | | | | | | | | | | | | | | | | | | | | | | |
| Total Top 11-20: | $ | 689 | $ | 696 | $ | 680 | 94.9 | % | 96.3 | % | 95.5 | % | 13.1 | % | 28.4 | % | |||||||||
| | | | | | | | | | | | | | | | | | | | | | | | | | |
13
The Macerich Company
Sales Per Square Foot by Property Ranking (Unaudited)
| |
|
|
|
|
|
|
|
% of Portfolio 2016 Forecast Pro Rata Real Estate NOI (d) |
|||||||||||||||||
|---|---|---|---|---|---|---|---|---|---|---|---|---|---|---|---|---|---|---|---|---|---|---|---|---|---|
| |
Sales Per Square Foot | Occupancy | Cost of Occupancy for the Trailing 12 Months Ended 6/30/2016 (c) |
||||||||||||||||||||||
| Properties | 6/30/2016 (a) |
12/31/2015 (a) |
6/30/2015 (a) |
6/30/2016 (b) |
12/31/2015 (b) |
6/30/2015 (b) |
|||||||||||||||||||
| Group 3: Top 21-30 | | | | | | | | | | | | ||||||||||||||
Danbury Fair Mall |
$ | 645 | $ | 633 | $ | 645 | 97.0 | % | 97.4 | % | 99.2 | % | |||||||||||||
Twenty Ninth Street |
$ | 626 | $ | 626 | $ | 620 | | 98.7 | % | | 99.3 | % | | 99.3 | % | | | | | ||||||
Freehold Raceway Mall |
$ | 603 | $ | 610 | $ | 616 | 97.2 | % | 98.7 | % | 98.0 | % | |||||||||||||
Deptford Mall |
$ | 575 | $ | 580 | $ | 595 | | 97.4 | % | | 95.3 | % | | 93.6 | % | | | | | ||||||
Oaks, The |
$ | 545 | $ | 580 | $ | 568 | 96.0 | % | 97.6 | % | 97.8 | % | |||||||||||||
FlatIron Crossing |
$ | 556 | $ | 551 | $ | 545 | | 94.5 | % | | 93.7 | % | | 92.5 | % | | | | | ||||||
Stonewood Center |
$ | 565 | $ | 544 | $ | 549 | 93.6 | % | 98.5 | % | 97.8 | % | |||||||||||||
SanTan Village Regional Center |
$ | 536 | $ | 525 | $ | 521 | | 97.5 | % | | 96.5 | % | | 97.7 | % | | | | | ||||||
Victor Valley, Mall of |
$ | 545 | $ | 520 | $ | 525 | 96.8 | % | 97.9 | % | 98.1 | % | |||||||||||||
Inland Center |
$ | 507 | $ | 510 | $ | 483 | | 95.4 | % | | 99.0 | % | | 97.3 | % | | | | | ||||||
| | | | | | | | | | | | | | | | | | | | | | | | | | |
| Total Top 21-30: | $ | 576 | $ | 575 | $ | 575 | 96.5 | % | 97.2 | % | 97.1 | % | 13.5 | % | 19.7 | % | |||||||||
| | | | | | | | | | | | | | | | | | | | | | | | | | |
| Group 4: Top 31-40 | | | | | | | | | | | | ||||||||||||||
West Acres |
$ | 504 | $ | 501 | $ | 512 | 98.9 | % | 99.8 | % | 99.7 | % | |||||||||||||
Lakewood Center |
$ | 473 | $ | 467 | $ | 456 | | 97.1 | % | | 96.3 | % | | 96.6 | % | | | | | ||||||
Valley River Center |
$ | 470 | $ | 465 | $ | 474 | 97.2 | % | 97.4 | % | 95.7 | % | |||||||||||||
Northgate Mall |
$ | 433 | $ | 454 | $ | 431 | | 94.9 | % | | 95.3 | % | | 96.4 | % | | | | | ||||||
South Plains Mall |
$ | 432 | $ | 452 | $ | 460 | 90.1 | % | 93.5 | % | 93.2 | % | |||||||||||||
Pacific View |
$ | 456 | $ | 448 | $ | 420 | | 91.5 | % | | 95.0 | % | | 95.5 | % | | | | | ||||||
La Cumbre Plaza |
$ | 450 | $ | 431 | $ | 427 | 86.7 | % | 93.1 | % | 94.7 | % | |||||||||||||
Superstition Springs Center |
$ | 368 | $ | 369 | $ | 366 | | 94.7 | % | | 94.1 | % | | 93.1 | % | | | | | ||||||
Eastland Mall |
$ | 377 | $ | 364 | $ | 370 | 95.9 | % | 96.8 | % | 92.8 | % | |||||||||||||
Fashion Outlets of Niagara Falls USA |
$ | 341 | | n/a | | n/a | | 92.2 | % | | n/a | | n/a | | | | | ||||||||
| | | | | | | | | | | | | | | | | | | | | | | | | | |
| Total Top 31-40: | $ | 426 | $ | 443 | $ | 440 | 94.5 | % | 95.9 | % | 95.3 | % | 13.7 | % | 14.4 | % | |||||||||
| | | | | | | | | | | | | | | | | | | | | | | | | | |
| Total Top 40: | $ | 654 | $ | 664 | $ | 654 | | 95.5 | % | | 96.8 | % | | 96.3 | % | | 13.5 | % | | 90.7 | % | ||||
| | | | | | | | | | | | | | | | | | | | | | | | | | |
14
The Macerich Company
Sales Per Square Foot by Property Ranking (Unaudited)
| |
|
|
|
|
|
|
|
% of Portfolio 2016 Forecast Pro Rata Real Estate NOI (d) |
|||||||||||||||||
|---|---|---|---|---|---|---|---|---|---|---|---|---|---|---|---|---|---|---|---|---|---|---|---|---|---|
| |
Sales Per Square Foot | Occupancy | Cost of Occupancy for the Trailing 12 Months Ended 6/30/2016 (c) |
||||||||||||||||||||||
| Properties | 6/30/2016 (a) |
12/31/2015 (a) |
6/30/2015 (a) |
6/30/2016 (b) |
12/31/2015 (b) |
6/30/2015 (b) |
|||||||||||||||||||
| Group 5: 41-49 | | | | | | | | | | | | ||||||||||||||
Westside Pavilion(e) |
|||||||||||||||||||||||||
Towne Mall |
| | | | | | | | | | | | | | | | |||||||||
Cascade Mall |
|||||||||||||||||||||||||
Desert Sky Mall |
| | | | | | | | | | | | | | | | |||||||||
Valley Mall |
|||||||||||||||||||||||||
NorthPark Mall |
| | | | | | | | | | | | | | | | |||||||||
Wilton Mall |
|||||||||||||||||||||||||
SouthPark Mall |
| | | | | | | | | | | | | | | | |||||||||
Paradise Valley Mall(e) |
|||||||||||||||||||||||||
| | | | | | | | | | | | | | | | | | | | | | | | | | |
| Total 41-49: | $ | 307 | $ | 325 | $ | 318 | | 89.9 | % | | 90.0 | % | | 91.0 | % | | 13.6 | % | | 6.9 | % | ||||
| | | | | | | | | | | | | | | | | | | | | | | | | | |
| Subtotal—Regional Shopping Centers(g) | $ | 626 | $ | 639 | $ | 629 | 95.0 | % | 96.1 | % | 95.8 | % | 13.5 | % | 97.6 | % | |||||||||
| Other Properties: | | | | | | | | | |||||||||||||||||
Fashion Outlets of Philadelphia(e)(h) |
n/a | n/a | n/a | n/a | n/a | n/a | |||||||||||||||||||
| Community / Power Centers | | | | | | | | | | | | ||||||||||||||
| Other Non-mall Assets | |||||||||||||||||||||||||
| Subtotal—Other Properties | | | | | | | | | | | | | | | | 2.4 | % | ||||||||
| | | | | | | | | | | | | | | | | | | | | | | | | | |
| TOTAL ALL PROPERTIES | 13.5 | % | 100.0 | % | |||||||||||||||||||||
| | | | | | | | | | | | | | | | | | | | | | | | | | |
| | | | | | | | | | | | | | | | | | | | | | | | | | |
| | | | | | | | | | | | | | | | | | | | | | | | | | |
15
The Macerich Company
Notes to Sales Per Square Foot by Property Ranking (unaudited)
| Footnotes | ||
| (a) | Sales are based on reports by retailers leasing mall and freestanding stores for the trailing 12 months for tenants which have occupied such stores for a minimum of 12 months. Sales per square foot are based on tenants 10,000 square feet and under. Properties are ranked by Sales per square foot as of December 31, 2015. On July 15, 2016, the Company conveyed Flagstaff Mall to the mortgage lender by a deed-in-lieu of foreclosure. Consequently, Sales per square foot are excluded for Flagstaff Mall. | |
| (b) | Occupancy is the percentage of mall and freestanding GLA leased as of the last day of the reporting period. Occupancy excludes Centers under development and redevelopment. Occupancy excludes Flagstaff Mall as explained in footnote (a). | |
| (c) | Cost of Occupancy represents "Tenant Occupancy Costs" divided by "Tenant Sales". Tenant Occupancy Costs in this calculation are the amounts paid to the Company, including minimum rents, percentage rents and recoverable expenditures, which consist primarily of property operating expenses, real estate taxes and repair and maintenance expenditures. | |
| (d) | The percentage of Portfolio 2016 Forecast Pro Rata Real Estate NOI is based on guidance provided on August 1, 2016, see page 9. Real Estate NOI excludes straight-line and above/below market adjustments to minimum rents. Real Estate NOI also does not reflect REIT expenses and Management Company revenues and expenses. See the Company's forward-looking statements disclosure on page 1 for factors that may affect the information provided in this column. | |
| (e) | These assets are under redevelopment including demolition and reconfiguration of the Centers and tenant spaces, accordingly the Sales per square foot and Occupancy during the periods of redevelopment are not included. | |
| (f) | On March 1, 2016, the Company purchased Country Club Plaza located in Kansas City, Missouri in a 50/50 joint venture. The pro rata NOI from this Center is included in the 2016 Guidance Range presented on page 9 and in the percentage of Portfolio 2016 Forecast Pro Rata Real Estate NOI in the table above. | |
| (g) | Properties sold prior to June 30, 2016 are excluded in both current and prior periods above. | |
| (h) | On July 30, 2014, the Company formed a joint venture to redevelop and rebrand The Gallery in Philadelphia, Pennsylvania as Fashion Outlets of Philadelphia. | |
16
The Macerich Company
Supplemental Financial and Operating Information (unaudited)
Occupancy(a)
Regional Shopping Centers: Period Ended |
Consolidated Centers |
Unconsolidated Joint Venture Centers |
Total Centers |
|||||||
|---|---|---|---|---|---|---|---|---|---|---|
06/30/2016(b) |
|
94.1% |
|
96.2% |
| 95.0% | ||||
06/30/2015(c) |
95.0% | 98.0% | 95.5% | |||||||
12/31/2015(b) |
|
95.3% |
|
97.8% |
| 96.1% | ||||
12/31/2014(c) |
95.3% | 97.9% | 95.8% |
|||||||
- (a)
- Occupancy
is the percentage of mall and freestanding GLA leased as of the last day of the reporting period. Occupancy excludes Centers under development and
redevelopment.
- (b)
- On
July 15, 2016, the Company conveyed Flagstaff Mall to the mortgage lender by a deed-in-lieu of foreclosure. Consequently, Flagstaff Mall is
excluded from Occupancy as of June 30, 2016 and December 31, 2015.
- (c)
- On June 30, 2015, the Company conveyed Great Northern Mall to the mortgage lender by a deed-in-lieu of foreclosure. Consequently, Great Northern Mall is excluded from Occupancy as of June 30, 2015 and December 31, 2014.
17
The Macerich Company
Supplemental Financial and Operating Information (unaudited)
Average Base Rent Per Square Foot(a)
| |
Average Base Rent PSF(b) |
Average Base Rent PSF on Leases Executed during the trailing twelve months ended(c) |
Average Base Rent PSF on Leases Expiring(d) |
|||||||
|---|---|---|---|---|---|---|---|---|---|---|
Consolidated Centers |
| | | |||||||
06/30/2016(e) |
$ | 52.36 | $ | 52.43 | $ | 47.07 | ||||
06/30/2015(f) |
$ | 52.11 | $ | 52.79 | $ | 45.50 | ||||
12/31/2015(e) |
$ | 52.64 | $ | 53.99 | $ | 49.02 | ||||
12/31/2014(f) |
$ | 49.68 | $ | 49.55 | $ | 41.20 | ||||
Unconsolidated Joint Venture Centers |
||||||||||
06/30/2016 |
$ | 57.83 | $ | 74.88 | $ | 59.28 | ||||
06/30/2015 |
$ | 66.85 | $ | 79.94 | $ | 62.76 | ||||
12/31/2015 |
$ | 60.74 | $ | 80.18 | $ | 60.85 | ||||
12/31/2014 |
$ | 63.78 | $ | 82.47 | $ | 64.59 | ||||
All Regional Shopping Centers |
|
|
|
|||||||
06/30/2016(e) |
$ | 54.00 | $ | 57.31 | $ | 49.38 | ||||
06/30/2015(f) |
$ | 53.62 | $ | 55.68 | $ | 47.38 | ||||
12/31/2015(e) |
$ | 54.32 | $ | 57.41 | $ | 50.29 | ||||
12/31/2014(f) |
$ | 51.15 | $ | 54.48 | $ | 44.66 | ||||
- (a)
- Average
base rent per square foot is based on spaces 10,000 square feet and under. All joint venture amounts are included at pro rata. Centers under
development and redevelopment are excluded.
- (b)
- Average
base rent per square foot gives effect to the terms of each lease in effect, as of the applicable date, including any concessions, abatements and
other adjustments or allowances that have been granted to the tenants.
- (c)
- The
average base rent per square foot on leases executed during the period represents the actual rent to be paid during the first twelve months.
- (d)
- The
average base rent per square foot on leases expiring during the period represents the final year minimum rent on a cash basis.
- (e)
- On
July 15, 2016, the Company conveyed Flagstaff Mall to the mortgage lender by a deed-in-lieu of foreclosure. Consequently, Flagstaff Mall is
excluded from the table above as of June 30, 2016 and December 31, 2015.
- (f)
- On June 30, 2015, the Company conveyed Great Northern Mall to the mortgage lender by a deed-in-lieu of foreclosure. Great Northern Mall is excluded from the table above as of June 30, 2015 and December 31, 2014.
18
The Macerich Company
Supplemental Financial and Operating Information (unaudited)
Cost of Occupancy
| |
For the trailing twelve months ended June 30, 2016(a) |
|
|
|||||||
|---|---|---|---|---|---|---|---|---|---|---|
| |
For Years Ended December 31, | |||||||||
| |
2015(a) | 2014(b) | ||||||||
Consolidated Centers |
| | | |||||||
Minimum rents |
9.2 | % | 9.0 | % | 8.7 | % | ||||
Percentage rents |
| 0.4 | % | | 0.4 | % | | 0.4 | % | |
Expense recoveries(c) |
4.5 | % | 4.5 | % | 4.3 | % | ||||
| | | | | | | | | | | |
Total |
| 14.1 | % | | 13.9 | % | | 13.4 | % | |
| | | | | | | | | | | |
| | | | | | | | | | | |
| | | | | | | | | | | |
| |
For the trailing twelve months ended June 30, 2016 |
|
|
|||||||
|---|---|---|---|---|---|---|---|---|---|---|
| |
For Years Ended December 31, | |||||||||
| |
2015 | 2014 | ||||||||
Unconsolidated Joint Venture Centers |
| | | |||||||
Minimum rents |
8.3 | % | 8.1 | % | 8.7 | % | ||||
Percentage rents |
| 0.4 | % | | 0.4 | % | | 0.4 | % | |
Expense recoveries(c) |
4.0 | % | 4.0 | % | 4.5 | % | ||||
| | | | | | | | | | | |
Total |
| 12.7 | % | | 12.5 | % | | 13.6 | % | |
| | | | | | | | | | | |
| | | | | | | | | | | |
| | | | | | | | | | | |
| |
For the trailing twelve months ended June 30, 2016(a) |
|
|
|||||||
|---|---|---|---|---|---|---|---|---|---|---|
| |
For Years Ended December 31, | |||||||||
| |
2015(a) | 2014(b) | ||||||||
All Centers |
| | | |||||||
Minimum rents |
8.8 | % | 8.7 | % | 8.7 | % | ||||
Percentage rents |
| 0.4 | % | | 0.4 | % | | 0.4 | % | |
Expense recoveries(c) |
4.3 | % | 4.3 | % | 4.3 | % | ||||
| | | | | | | | | | | |
Total |
| 13.5 | % | | 13.4 | % | | 13.4 | % | |
| | | | | | | | | | | |
| | | | | | | | | | | |
| | | | | | | | | | | |
- (a)
- On
July 15, 2016, the Company conveyed Flagstaff Mall to the mortgage lender by a deed-in-lieu of foreclosure. Consequently, Flagstaff Mall is
excluded from the table above as of June 30, 2016 and December 31, 2015.
- (b)
- On
June 30, 2015, the Company conveyed Great Northern Mall to the mortgage lender by a deed-in-lieu of foreclosure. Consequently, Great Northern Mall
is excluded from the table above for the year ended December 31, 2014.
- (c)
- Represents real estate tax and common area maintenance charges.
19
The Macerich Company
Supplemental Financial and Operating Information (unaudited)
Percentage of Net Operating Income by State
Capitola Mall, sold April 13, 2016, is excluded from the table below. On July 15, 2016, the Company conveyed Flagstaff Mall to the mortgage lender by a deed-in-lieu of foreclosure. Consequently, Flagstaff Mall is also excluded from the table below.
| |
|
|||
|---|---|---|---|---|
State
|
% of Portfolio 2016 Forecast Real Estate Pro Rata NOI(a) |
|||
California |
27.6 | % | ||
New York |
21.2 | % | ||
Arizona |
16.7 | % | ||
Colorado, Illinois & Missouri(b) |
9.6 | % | ||
Pennsylvania & Virginia |
7.7 | % | ||
New Jersey & Connecticut |
7.5 | % | ||
Oregon & Washington |
4.6 | % | ||
Other(c) |
5.1 | % | ||
| | | | | |
Total |
100.0 | % | ||
| | | | | |
| | | | | |
| | | | | |
- (a)
- The
percentage of Portfolio 2016 Forecast Pro Rata Real Estate NOI is based on guidance provided on August 1, 2016, see page 9. Real Estate
NOI excludes straight-line and above/below market adjustments to minimum rents. Real Estate NOI also does not reflect REIT expenses and Management Company revenues and expenses. See the Company's
forward-looking statements disclosure on page 1 for factors that may affect the information provided in this column.
- (b)
- On
March 1, 2016, the Company purchased Country Club Plaza located in Kansas City, Missouri in a 50/50 joint venture. The pro rata NOI from this
Center is included in the 2016 Guidance Range presented on page 9 and in the percentage of Portfolio 2016 Forecast Pro Rata Real Estate NOI in the table above.
- (c)
- "Other" includes Indiana, Iowa, Kentucky, North Dakota and Texas.
20
The Macerich Company
Property Listing
June 30, 2016
The following table sets forth certain information regarding the Centers and other locations that are wholly owned or partly owned by the Company. On July 15, 2016, the Company conveyed Flagstaff Mall to the mortgage lender by a deed-in-lieu of foreclosure. Consequently, Flagstaff Mall is excluded from the table below.
Count
|
Company's Ownership(a) |
Name of Center/Location |
Year of Original Construction/ Acquisition |
Year of Most Recent Expansion/ Renovation |
Total GLA(b) |
||||||||||
|---|---|---|---|---|---|---|---|---|---|---|---|---|---|---|---|
|
CONSOLIDATED CENTERS: |
||||||||||||||
1 |
100% |
Cascade Mall |
1989/1999 | 1998 | 589,000 | ||||||||||
2 |
50.1% |
Chandler Fashion Center |
2001/2002 | — | 1,319,000 | ||||||||||
3 |
100% |
Danbury Fair Mall |
1986/2005 | 2010 | 1,270,000 | ||||||||||
4 |
100% |
Desert Sky Mall |
1981/2002 | 2007 | 890,000 | ||||||||||
5 |
100% |
Eastland Mall(d) |
1978/1998 | 1996 | 1,044,000 | ||||||||||
6 |
100% |
Fashion Outlets of Chicago |
2013/— | — | 538,000 | ||||||||||
7 |
100% |
Fashion Outlets of Niagara Falls USA |
1982/2011 | 2014 | 686,000 | ||||||||||
8 |
50.1% |
Freehold Raceway Mall |
1990/2005 | 2007 | 1,670,000 | ||||||||||
9 |
100% |
Fresno Fashion Fair |
1970/1996 | 2006 | 963,000 | ||||||||||
10 |
100% |
Green Acres Mall(d) |
1956/2013 | 2007 | 1,799,000 | ||||||||||
11 |
100% |
Inland Center(d) |
1966/2004 | 2004 | 867,000 | ||||||||||
12 |
100% |
Kings Plaza Shopping Center(d) |
1971/2012 | 2002 | 1,190,000 | ||||||||||
13 |
100% |
La Cumbre Plaza(d) |
1967/2004 | 1989 | 493,000 | ||||||||||
14 |
100% |
Northgate Mall |
1964/1986 | 2010 | 750,000 | ||||||||||
15 |
100% |
NorthPark Mall |
1973/1998 | 2001 | 1,051,000 | ||||||||||
16 |
100% |
Oaks, The |
1978/2002 | 2009 | 1,190,000 | ||||||||||
17 |
100% |
Pacific View |
1965/1996 | 2001 | 1,021,000 | ||||||||||
18 |
100% |
Queens Center(d) |
1973/1995 | 2004 | 964,000 | ||||||||||
19 |
100% |
Santa Monica Place |
1980/1999 | 2015 | 517,000 | ||||||||||
20 |
84.9% |
SanTan Village Regional Center |
2007/— | 2009 | 1,047,000 | ||||||||||
21 |
100% |
SouthPark Mall |
1974/1998 | 2014 | 856,000 | ||||||||||
22 |
100% |
Stonewood Center(d) |
1953/1997 | 1991 | 932,000 | ||||||||||
23 |
100% |
Superstition Springs Center |
1990/2002 | 2002 | 1,040,000 | ||||||||||
21
The Macerich Company
Property Listing
June 30, 2016
Count
|
Company's Ownership(a) |
Name of Center/Location |
Year of Original Construction/ Acquisition |
Year of Most Recent Expansion/ Renovation |
Total GLA(b) |
||||||||||
|---|---|---|---|---|---|---|---|---|---|---|---|---|---|---|---|
24 |
100% |
Towne Mall |
1985/2005 | 1989 | 350,000 | ||||||||||
25 |
100% |
Tucson La Encantada |
2002/2002 | 2005 | 243,000 | ||||||||||
26 |
100% |
Valley Mall |
1978/1998 | 1992 | 506,000 | ||||||||||
27 |
100% |
Valley River Center |
1969/2006 | 2007 | 921,000 | ||||||||||
28 |
100% |
Victor Valley, Mall of |
1986/2004 | 2012 | 577,000 | ||||||||||
29 |
100% |
Vintage Faire Mall |
1977/1996 | 2008 | 1,141,000 | ||||||||||
30 |
100% |
Wilton Mall |
1990/2005 | 1998 | 737,000 | ||||||||||
| | | | | | | | | | | | | | | | |
|
|
Total Consolidated Centers |
27,161,000 | ||||||||||||
| | | | | | | | | | | | | | | | |
UNCONSOLIDATED JOINT VENTURE CENTERS: |
|||||||||||||||
31 |
60% |
Arrowhead Towne Center(c) |
1993/2002 | 2004 | 1,197,000 | ||||||||||
32 |
50% |
Biltmore Fashion Park |
1963/2003 | 2006 | 516,000 | ||||||||||
33 |
50.1% |
Corte Madera, Village at |
1985/1998 | 2005 | 460,000 | ||||||||||
34 |
50% |
Country Club Plaza |
1922/2016 | 2015 | 983,000 | ||||||||||
35 |
51% |
Deptford Mall(c) |
1975/2006 | 1990 | 1,040,000 | ||||||||||
36 |
51% |
FlatIron Crossing(c) |
2000/2002 | 2009 | 1,432,000 | ||||||||||
37 |
50% |
Kierland Commons |
1999/2005 | 2003 | 438,000 | ||||||||||
38 |
60% |
Lakewood Center |
1953/1975 | 2008 | 2,075,000 | ||||||||||
39 |
60% |
Los Cerritos Center(d) |
1971/1999 | 2016 | 1,294,000 | ||||||||||
40 |
50% |
North Bridge, The Shops at(d) |
1998/2008 | — | 660,000 | ||||||||||
41 |
50% |
Scottsdale Fashion Square |
1961/2002 | 2015 | 1,812,000 | ||||||||||
42 |
60% |
South Plains Mall |
1972/1998 | 2016 | 1,127,000 | ||||||||||
43 |
51% |
Twenty Ninth Street(c)(d) |
1963/1979 | 2007 | 853,000 | ||||||||||
44 |
50% |
Tysons Corner Center |
1968/2005 | 2005 | 1,971,000 | ||||||||||
45 |
60% |
Washington Square |
1974/1999 | 2005 | 1,442,000 | ||||||||||
46 |
19% |
West Acres |
1972/1986 | 2001 | 971,000 | ||||||||||
| | | | | | | | | | | | | | | | |
|
|
Total Unconsolidated Joint Venture Centers |
18,271,000 | ||||||||||||
| | | | | | | | | | | | | | | | |
22
The Macerich Company
Property Listing
June 30, 2016
Count
|
Company's Ownership(a) |
Name of Center/Location |
Year of Original Construction/ Acquisition |
Year of Most Recent Expansion/ Renovation |
Total GLA(b) |
||||||||||
|---|---|---|---|---|---|---|---|---|---|---|---|---|---|---|---|
REGIONAL SHOPPING CENTERS UNDER REDEVELOPMENT: |
|||||||||||||||
47 |
50% |
Broadway Plaza(d)(e) |
1951/1985 | 1994 | 921,000 | ||||||||||
48 |
50% |
Fashion Outlets of Philadelphia(d)(e) |
1977/2014 | 1990 | 850,000 | ||||||||||
49 |
100% |
Paradise Valley Mall(f) |
1979/2002 | 2009 | 1,150,000 | ||||||||||
50 |
100% |
Westside Pavilion(f) |
1985/1998 | 2007 | 755,000 | ||||||||||
| | | | | | | | | | | | | | | | |
|
|
Total Regional Shopping Centers |
49,108,000 | ||||||||||||
| | | | | | | | | | | | | | | | |
COMMUNITY / POWER CENTERS: |
|||||||||||||||
1 |
50% |
Atlas Park, The Shops at(e) |
2006/2011 | 2013 | 371,000 | ||||||||||
2 |
50% |
Boulevard Shops(e) |
2001/2002 | 2004 | 185,000 | ||||||||||
3 |
40.1% |
Estrella Falls, The Market at(e) |
2009/— | 2009 | 225,000 | ||||||||||
4 |
89.4% |
Promenade at Casa Grande(f) |
2007/— | 2009 | 761,000 | ||||||||||
5 |
100% |
Southridge Center(f) |
1975/1998 | 2013 | 823,000 | ||||||||||
6 |
100% |
Superstition Springs Power Center(f) |
1990/2002 | — | 206,000 | ||||||||||
7 |
100% |
The Marketplace at Flagstaff Mall(d)(f) |
2007/— | — | 268,000 | ||||||||||
| | | | | | | | | | | | | | | | |
|
|
Total Community / Power Centers |
2,839,000 | ||||||||||||
| | | | | | | | | | | | | | | | |
OTHER ASSETS: |
|||||||||||||||
|
100% |
Various(f)(g) |
401,000 | ||||||||||||
|
100% |
500 North Michigan Avenue(f) |
326,000 | ||||||||||||
|
50% |
Valencia Place at Country Club Plaza(e) |
263,000 | ||||||||||||
|
50% |
Fashion Outlets of Philadelphia-Offices(d)(e) |
526,000 | ||||||||||||
|
100% |
Paradise Village Ground Leases(f) |
53,000 | ||||||||||||
|
100% |
Paradise Village Office Park II(f) |
46,000 | ||||||||||||
|
50% |
Scottsdale Fashion Square-Office(e) |
122,000 | ||||||||||||
|
50% |
Tysons Corner Center-Office(e) |
175,000 | ||||||||||||
|
50% |
Hyatt Regency Tysons Corner Center(e) |
290,000 | ||||||||||||
|
50% |
VITA Tysons Corner Center(e) |
510,000 | ||||||||||||
|
50% |
Tysons Tower(e) |
528,000 | ||||||||||||
| | | | | | | | | | | | | | | | |
|
|
Total Other Assets |
3,240,000 | ||||||||||||
| | | | | | | | | | | | | | | | |
|
|
Grand Total at June 30, 2016 |
55,187,000 | ||||||||||||
| | | | | | | | | | | | | | | | |
| | | | | | | | | | | | | | | | |
| | | | | | | | | | | | | | | | |
23
The Macerich Company
Property Listing
June 30, 2016
- (a)
- The
Company's ownership interest in this table reflects its legal ownership interest. See footnotes (a) and (b) on page 25 regarding the legal
versus economic ownership of joint venture entities.
- (b)
- Includes
GLA attributable to anchors (whether owned or non-owned) and mall and freestanding stores as of June 30, 2016.
- (c)
- The
Company contributed an interest in these four properties to joint ventures in January 2016. Subsequent to the contribution, the Company retained a 60.0%
interest in Arrowhead Towne Center and a 51.0% interest in Deptford Mall, FlatIron Crossing and Twenty Ninth Street.
- (d)
- Portions
of the land on which the Center is situated are subject to one or more long-term ground leases. With respect to 44 Centers, the underlying land
controlled by the Company is owned in fee entirely by the Company, or, in the case of jointly-owned Centers, by the joint venture property partnership or limited liability company.
- (e)
- Included
in Unconsolidated Joint Venture Centers.
- (f)
- Included
in Consolidated Centers.
- (g)
- The Company owns seven stores located at shopping centers not owned by the Company. Of these seven stores, two are leased to Forever 21, one is leased to Kohl's, one is vacant and three have been leased for non-Anchor uses. With respect to four of the seven stores, the underlying land is owned in fee entirely by the Company. With respect to the remaining three stores, the underlying land is owned by third parties and leased to the Company pursuant to long-term building or ground leases.
24
Joint Venture List
The following table sets forth certain information regarding the Centers and other operating properties that are not wholly-owned by the Company. This list of properties includes unconsolidated joint ventures, consolidated joint ventures, and co-venture arrangements. The percentages shown are the effective legal ownership and economic ownership interests of the Company as of June 30, 2016.
Properties
|
6/30/2016 Legal Ownership(a) |
6/30/2016 Economic Ownership(b) |
Joint Venture | 6/30/2016 Total GLA(c) |
||||||||
|---|---|---|---|---|---|---|---|---|---|---|---|---|
Arrowhead Towne Center |
60% | 60% | New River Associates LLC | 1,197,000 | ||||||||
Atlas Park, The Shops at |
50% | 50% | WMAP, L.L.C. | 371,000 | ||||||||
Biltmore Fashion Park |
50% | 50% | Biltmore Shopping Center Partners LLC | 516,000 | ||||||||
Boulevard Shops |
50% | 50% | Propcor II Associates, LLC | 185,000 | ||||||||
Broadway Plaza |
50% | 50% | Macerich Northwestern Associates | 921,000 | ||||||||
Chandler Fashion Center(d) |
50.1% | 50.1% | Freehold Chandler Holdings LP | 1,319,000 | ||||||||
Corte Madera, Village at |
50.1% | 50.1% | Corte Madera Village, LLC | 460,000 | ||||||||
Country Club Plaza |
50% | 50% | Country Club Plaza KC Partners LLC | 983,000 | ||||||||
Deptford Mall |
51% | 51% | Macerich HHF Centers LLC | 1,040,000 | ||||||||
Estrella Falls, The Market at(e) |
40.1% | 40.1% | The Market at Estrella Falls LLC | 225,000 | ||||||||
FlatIron Crossing |
51% | 51% | Macerich HHF Centers LLC | 1,432,000 | ||||||||
Freehold Raceway Mall(d) |
50.1% | 50.1% | Freehold Chandler Holdings LP | 1,670,000 | ||||||||
Fashion Outlets of Philadelphia |
50% | 50% | Various Entities | 850,000 | ||||||||
Fashion Outlets of Philadelphia-Offices |
50% | 50% | Various Entities | 526,000 | ||||||||
Hyatt Regency Tysons Corner Center |
50% | 50% | Tysons Corner Hotel I LLC | 290,000 | ||||||||
Kierland Commons |
50% | 50% | Kierland Commons Investment LLC | 438,000 | ||||||||
Lakewood Center |
60% | 60% | Pacific Premier Retail LLC | 2,075,000 | ||||||||
Los Cerritos Center |
60% | 60% | Pacific Premier Retail LLC | 1,294,000 | ||||||||
North Bridge, The Shops at |
50% | 50% | North Bridge Chicago LLC | 660,000 | ||||||||
Promenade at Casa Grande(f) |
89.4% | 89.4% | WP Casa Grande Retail LLC | 761,000 | ||||||||
SanTan Village Regional Center |
84.9% | 84.9% | Westcor SanTan Village LLC | 1,047,000 | ||||||||
Scottsdale Fashion Square |
50% | 50% | Scottsdale Fashion Square Partnership | 1,812,000 | ||||||||
Scottsdale Fashion Square-Office |
50% | 50% | Scottsdale Fashion Square Partnership | 122,000 | ||||||||
Sears Stores(g) |
50% | 50% | MS Portfolio LLC | 1,550,000 | ||||||||
South Plains Mall |
60% | 60% | Pacific Premier Retail LLC | 1,127,000 | ||||||||
Twenty Ninth Street |
51% | 51% | Macerich HHF Centers LLC | 853,000 | ||||||||
Tysons Corner Center |
50% | 50% | Tysons Corner LLC | 1,971,000 | ||||||||
Tysons Corner Center-Office |
50% | 50% | Tysons Corner Property LLC | 175,000 | ||||||||
Tysons Tower |
50% | 50% | Tysons Corner Property LLC | 528,000 | ||||||||
Valencia Place at Country Club Plaza |
50% | 50% | TM TRS Holding Company LLC | 263,000 | ||||||||
VITA Tysons Corner Center |
50% | 50% | Tysons Corner Property LLC | 510,000 | ||||||||
Washington Square |
60% | 60% | Pacific Premier Retail LLC | 1,442,000 | ||||||||
West Acres |
19% | 19% | West Acres Development, LLP | 971,000 | ||||||||
- (a)
- This
column reflects the Company's legal ownership in the listed properties as of June 30, 2016. Legal ownership may, at times, not equal the
Company's economic interest in the listed properties because of various provisions in certain joint venture agreements regarding distributions of cash flow based on capital account balances,
allocations of profits and losses and payments of preferred returns. As a result, the Company's actual economic interest (as distinct from its legal ownership interest) in certain of the properties
could fluctuate from time to time and may not wholly align with its legal ownership interests. Substantially all of the Company's joint venture agreements contain rights of first refusal, buy-sell
provisions, exit rights, default dilution remedies and/or other break up provisions or remedies which are customary in real estate joint venture agreements and which may, positively or negatively,
affect the ultimate realization of cash flow and/or capital or liquidation proceeds.
- (b)
- Economic ownership represents the allocation of cash flow to the Company as of June 30, 2016, except as noted below. In cases where the Company receives a current cash distribution greater than its legal ownership percentage
25
The Macerich Company
Joint Venture List
due to a capital account greater than its legal ownership percentage, only the legal ownership percentage is shown in this column. The Company's economic ownership of these properties may fluctuate based on a number of factors, including mortgage refinancings, partnership capital contributions and distributions, and proceeds and gains or losses from asset sales, and the matters set forth in the preceding paragraph.
- (c)
- Includes
GLA attributable to anchors (whether owned or non-owned) and mall and freestanding stores as of June 30, 2016.
- (d)
- The
joint venture entity was formed in September 2009. Upon liquidation of the partnership, distributions are made in the following order: to the
third-party partner until it receives a 13% internal rate of return on and of its aggregate unreturned capital contributions; to the Company until it receives a 13% internal rate of return on and of
its aggregate unreturned capital contributions; and, thereafter, pro rata 35% to the third-party partner and 65% to the Company.
- (e)
- Columns
1 and 2 reflect the Company's indirect ownership interest in the property owner. The Company and a third-party partner are each members of a joint
venture (the "MW Joint Venture") which, in turn, is a member in the joint venture that owns the property. Cash flow distributions for the MW Joint Venture are made in accordance with the
members' relative capital accounts until the members have received distributions equal to their capital accounts, and thereafter in accordance with the members' relative legal ownership percentages.
In addition, the Company has executed a joint and several guaranty of the mortgage for the property with its third-party partner. The Company may incur liabilities under such guaranty greater than its
legal ownership percentage.
- (f)
- Columns
1 and 2 reflect the Company's total direct and indirect ownership interest in the property owner. The Company and a third-party partner are each
members of a joint venture (the "MW Joint Venture") which, in turn, is a member in the joint venture with the Company that owns the property. Cash flow distributions for the MW Joint
Venture are made in accordance with the members' relative capital accounts until the members have received distributions equal to their capital accounts, and thereafter in accordance with the members'
relative legal ownership percentages.
- (g)
- On April 30, 2015 Sears Holdings Corporation ("Sears") and the Company announced that they had formed a joint venture, MS Portfolio LLC. Sears contributed nine stores (located at Arrowhead Towne Center, Chandler Fashion Center, Danbury Fair Mall, Deptford Mall, Freehold Raceway Mall, Los Cerritos Center, South Plains Mall, Vintage Faire Mall and Washington Square) to the joint venture and the Company contributed $150 million in cash to the joint venture. The lease arrangements between Sears and the joint venture provide the ability to create additional value through recapturing certain space leased to Sears in these properties and re-leasing that space to third-party tenants. For example, Primark has leased space in portions of the Sears stores at Danbury Fair Mall and Freehold Raceway Mall. On July 7, 2015, Sears assigned its ownership interest in MS Portfolio LLC to Seritage MS Holdings LLC.
26
The Macerich Company
Supplemental Financial and Operating Information (unaudited)
Debt Summary (at Company's pro rata share)
| |
|
|||||||||
|---|---|---|---|---|---|---|---|---|---|---|
| |
As of June 30, 2016 | |||||||||
| |
Fixed Rate | Floating Rate | Total | |||||||
| |
dollars in thousands |
|||||||||
Consolidated debt |
$ | 3,339,769 | $ | 1,339,358 | $ | 4,679,127 | ||||
Unconsolidated debt |
2,582,554 | 168,836 | 2,751,390 | |||||||
| | | | | | | | | | | |
Total debt |
$ | 5,922,323 | $ | 1,508,194 | $ | 7,430,517 | ||||
Weighted average interest rate |
3.86 |
% |
2.20 |
% |
3.52 |
% |
||||
Weighted average maturity (years) |
6.0 | |||||||||
27
The Macerich Company
Supplemental Financial and Operating Information (Unaudited)
Outstanding Debt by Maturity Date
| |
As of June 30, 2016 | |||||||||||||||
|---|---|---|---|---|---|---|---|---|---|---|---|---|---|---|---|---|
Center/Entity (dollars in thousands)
|
Maturity Date | Effective Interest Rate(a) |
Fixed | Floating | Total Debt Balance(a) |
|||||||||||
I. Consolidated Assets: |
||||||||||||||||
Flagstaff Mall(b) |
11/01/15 | 8.97 | % | $ | 37,000 | $ | — | $ | 37,000 | |||||||
Stonewood Center |
11/01/17 | 1.80 | % | 102,543 | — | 102,543 | ||||||||||
Freehold Raceway Mall(c) |
01/01/18 | 4.20 | % | 111,604 | — | 111,604 | ||||||||||
Santa Monica Place |
01/03/18 | 2.99 | % | 222,209 | — | 222,209 | ||||||||||
SanTan Village Regional Center(d) |
06/01/19 | 3.14 | % | 109,671 | — | 109,671 | ||||||||||
Chandler Fashion Center(c) |
07/01/19 | 3.77 | % | 100,100 | — | 100,100 | ||||||||||
Kings Plaza Shopping Center |
12/03/19 | 3.67 | % | 461,659 | — | 461,659 | ||||||||||
Danbury Fair Mall |
10/01/20 | 5.53 | % | 219,050 | — | 219,050 | ||||||||||
Fashion Outlets of Niagara Falls USA |
10/06/20 | 4.89 | % | 117,203 | — | 117,203 | ||||||||||
Green Acres Mall |
02/03/21 | 3.61 | % | 300,909 | — | 300,909 | ||||||||||
Prasada(e) |
05/30/21 | 5.25 | % | 3,004 | — | 3,004 | ||||||||||
Tucson La Encantada |
03/01/22 | 4.23 | % | 69,260 | — | 69,260 | ||||||||||
Pacific View |
04/01/22 | 4.08 | % | 128,723 | — | 128,723 | ||||||||||
Oaks, The |
06/05/22 | 4.14 | % | 203,418 | — | 203,418 | ||||||||||
Westside Pavilion |
10/01/22 | 4.49 | % | 145,275 | — | 145,275 | ||||||||||
Towne Mall |
11/01/22 | 4.48 | % | 21,765 | — | 21,765 | ||||||||||
Victor Valley, Mall of |
09/01/24 | 4.00 | % | 114,529 | — | 114,529 | ||||||||||
Queens Center |
01/01/25 | 3.49 | % | 600,000 | — | 600,000 | ||||||||||
Vintage Faire |
03/06/26 | 3.55 | % | 271,847 | — | 271,847 | ||||||||||
| | | | | | | | | | | | | | | | | |
Total Fixed Rate Debt for Consolidated Assets |
3.86 | % | $ | 3,339,769 | $ | — | $ | 3,339,769 | ||||||||
| | | | | | | | | | | | | | | | | |
Superstition Springs Center |
10/28/16 | 2.27 | % | $ | — | $ | 67,599 | $ | 67,599 | |||||||
Northgate Mall |
03/01/17 | 3.35 | % | — | 63,662 | 63,662 | ||||||||||
The Macerich Partnership, L.P.—Line of Credit(f) |
08/06/18 | 2.13 | % | — | 1,009,316 | 1,009,316 | ||||||||||
Fashion Outlets of Chicago |
03/31/20 | 2.10 | % | — | 198,781 | 198,781 | ||||||||||
| | | | | | | | | | | | | | | | | |
Total Floating Rate Debt for Consolidated Assets |
2.19 | % | $ | — | $ | 1,339,358 | $ | 1,339,358 | ||||||||
| | | | | | | | | | | | | | | | | |
Total Debt for Consolidated Assets |
3.38 | % | $ | 3,339,769 | $ | 1,339,358 | $ | 4,679,127 | ||||||||
| | | | | | | | | | | | | | | | | |
28
The Macerich Company
Supplemental Financial and Operating Information (Unaudited)
Outstanding Debt by Maturity Date
| |
As of June 30, 2016 | |||||||||||||||
|---|---|---|---|---|---|---|---|---|---|---|---|---|---|---|---|---|
Center/Entity (dollars in thousands)
|
Maturity Date | Effective Interest Rate(a) |
Fixed | Floating | Total Debt Balance(a) |
|||||||||||
II. Unconsolidated Assets (At Company's pro rata share): |
||||||||||||||||
West Acres (19%) |
10/01/16 | 6.41 | % | $ | 10,416 | $ | — | $ | 10,416 | |||||||
Corte Madera, The Village at (50.1%)(g) |
11/01/16 | 7.27 | % | 36,893 | — | 36,893 | ||||||||||
FlatIron Crossing (51%) |
01/05/21 | 2.81 | % | 133,798 | — | 133,798 | ||||||||||
Washington Square Mall (60%) |
11/01/22 | 3.65 | % | 330,000 | — | 330,000 | ||||||||||
Deptford Mall (51%) |
04/03/23 | 3.55 | % | 98,892 | — | 98,892 | ||||||||||
Scottsdale Fashion Square (50%) |
04/03/23 | 3.02 | % | 244,468 | — | 244,468 | ||||||||||
Tysons Corner Center (50%) |
01/01/24 | 4.13 | % | 402,785 | — | 402,785 | ||||||||||
South Plains Mall (60%) |
11/06/25 | 4.22 | % | 120,000 | — | 120,000 | ||||||||||
Twenty Ninth Street (51%) |
02/06/26 | 4.10 | % | 76,500 | — | 76,500 | ||||||||||
Country Club Plaza (50%) |
04/01/26 | 3.88 | % | 159,537 | — | 159,537 | ||||||||||
Lakewood Center (60%) |
06/01/26 | 4.15 | % | 227,324 | — | 227,324 | ||||||||||
Los Cerritos Center (60%) |
11/01/27 | 4.00 | % | 315,000 | — | 315,000 | ||||||||||
Arrowhead Towne Center (60%) |
02/01/28 | 4.05 | % | 240,000 | — | 240,000 | ||||||||||
North Bridge, The Shops at (50%) |
06/01/28 | 3.71 | % | 186,941 | — | 186,941 | ||||||||||
| | | | | | | | | | | | | | | | | |
Total Fixed Rate Debt for Unconsolidated Assets |
3.86 | % | $ | 2,582,554 | $ | — | $ | 2,582,554 | ||||||||
| | | | | | | | | | | | | | | | | |
Kierland Commons (50%)(h) |
01/02/18 | 2.53 | % | $ | — | $ | 65,706 | $ | 65,706 | |||||||
Boulevard Shops (50%)(h) |
12/16/18 | 2.34 | % | — | 9,662 | 9,662 | ||||||||||
Estrella Falls, The Market at (40.1%)(h) |
02/05/20 | 2.47 | % | — | 10,303 | 10,303 | ||||||||||
Atlas Park (50%)(h) |
10/28/20 | 2.78 | % | — | 23,165 | 23,165 | ||||||||||
Pacific Premier Retail LLC (60%) |
10/31/22 | 1.66 | % | — | 60,000 | 60,000 | ||||||||||
| | | | | | | | | | | | | | | | | |
Total Floating Rate Debt for Unconsolidated Assets |
2.24 | % | $ | — | $ | 168,836 | $ | 168,836 | ||||||||
| | | | | | | | | | | | | | | | | |
Total Debt for Unconsolidated Assets |
3.76 | % | $ | 2,582,554 | $ | 168,836 | $ | 2,751,390 | ||||||||
| | | | | | | | | | | | | | | | | |
Total Debt |
3.52 | % | $ | 5,922,323 | $ | 1,508,194 | $ | 7,430,517 | ||||||||
| | | | | | | | | | | | | | | | | |
| | | | | | | | | | | | | | | | | |
| | | | | | | | | | | | | | | | | |
Percentage to Total |
79.70 | % | 20.30 | % | 100.00 | % | ||||||||||
- (a)
- The debt balances include the unamortized debt premiums/discounts and loan finance costs. Debt premiums/discounts represent the excess of the fair value of debt over the principal value of debt assumed in various acquisitions. Debt premiums/discounts and loan finance costs are amortized into interest expense over the remaining term of the related debt in a manner that approximates the effective interest method. The annual interest rate in the table represents the effective interest rate, including the debt premiums/discounts and loan finance costs.
- (b)
- On July 15, 2016, the Company conveyed Flagstaff Mall to the mortgage lender by a deed-in-lieu of foreclosure and was discharged from the non-recourse mortgage note payable.
- (c)
- This property is owned by a consolidated joint venture. The above debt balance represents the Company's pro rata share of 50.1%.
- (d)
- This property is owned by a consolidated joint venture. The above debt balance represents the Company's pro rata share of 84.9%.
- (e)
- This property is owned by a consolidated joint venture. The above debt balance represents the Company's pro rata share of 50.0%.
- (f)
- On July 6, 2016, the Company amended and restated its $1.5 billion line of credit. The new revolving $1.5 billion facility bears interest at LIBOR plus a spread of 1.30% to 1.90%, depending on the Company's overall leverage levels, and matures on July 6, 2020, with a one-year extension option. The interest rate in effect at closing was LIBOR plus 1.33%. The facility may be increased up to an additional $500 million, subject to the receipt of lender commitments and other conditions.
- (g)
- The Company's joint venture has entered into a commitment for a $225 million refinance at a fixed rate of 3.50% for twelve years.The Company's 50.1% share of the commitment is $112.7 million.
- (h)
- The maturity date assumes that all available extension options are fully exercised and that the Company and/or its affiliates do not opt to refinance the debt prior to these dates.
29
The Macerich Company
Supplemental Financial and Operating Information (Unaudited)
Development Pipeline Forecast
(Dollars in millions)
as of June 30, 2016
In-Process Developments and Redevelopments:
Property
|
Project Type | Total Cost(a)(b) at 100% |
Ownership % |
Total Cost(a)(b) Pro Rata |
Pro Rata Capitalized Costs(b) 6/30/2016 |
Expected Delivery(a) |
Stabilized Yield(a)(b)(c) |
||||||||
|---|---|---|---|---|---|---|---|---|---|---|---|---|---|---|---|
Broadway Plaza |
Expansion of existing open air center adding 235,000 sf (net) of new shop space to existing 774,000 sf center which is currently anchored by Nordstrom, Neiman Marcus and Macy's. New space created by construction of a more efficient parking structure and the consolidation of stand-alone Macy's Men's Store into a single larger Macy's box. Phase I encompasses demolition of 80,000 sf of existing retail space and construction of 240,000 sf of new retail space for a net increase of 160,000 sf. Phase 2 involves demolition of the existing Macy's Men's building and construction of 75,000 sf of new retail space for a total increase of 235,000 sf of small stores. |
* Phase 1 : $265 * Phase 2 : $40 |
| 50 | % |
* Phase 1 : $133 * Phase 2 : $20 |
* Phase 1 : $109 * Phase 2 : $6 |
* 25% 4Q15 * 50% 2Q16 * 25% 2Q17/2Q18 |
8% | ||||||
| | | | | | | | | | | | | | | | |
|
Total: $305 | | Total: $153 | Total: $115 | |||||||||||
Green Acres Commons |
335,000 sf two-story retail center anchored by Dicks Sporting Goods, and comprised of box retail stores and outparcels adjacent to Green Acres Mall | $110 | 100 | % | $110 | $86 | 4Q16 | 11% | |||||||
Fashion Outlets of Philadelphia |
Redevelopment of The Gallery in downtown Philadelphia | $305 - $365(d)(e) | | 50 | % | $153 - $183(d)(e) | $37 | 2018 | 8%(e) | ||||||
Kings Plaza Shopping Center |
250,000 sf redevelopment of existing Sears store, anchored by Primark | $95 - $100 | 100 | % | $95 - $100 | $3 | 2018 | 4%(f) | |||||||
| | | | | | | | | | | | | | | | |
Total In-Process |
| $815 - $880 | | | $511 - $546 | $241 | | | |||||||
| | | | | | | | | | | | | | | | |
| | | | | | | | | | | | | | | | |
| | | | | | | | | | | | | | | | |
30
The Macerich Company
Supplemental Financial and Operating Information (Unaudited)
Development Pipeline Forecast
(Dollars in millions)
as of June 30, 2016
Shadow Pipeline of Developments and Redevelopments(g):
Property
|
Project Type | Total Cost(a)(b) at 100% |
Ownership % |
Total Cost(a)(b) Pro Rata |
Pro Rata Capitalized Costs(b) 6/30/2016 |
Expected Delivery(a) |
Stabilized Yield(a)(b)(c) |
|||||||||||||
|---|---|---|---|---|---|---|---|---|---|---|---|---|---|---|---|---|---|---|---|---|
Fashion Outlets of San Francisco |
A 500,000 sf outlet center on the historic site of Candlestick Park | $ | 350 | | 50.1 | % | $ | 175 | $ | 2 | | 2018 - 2019 | 7% - 9% | |||||||
Paradise Valley Mall |
Redevelopment (size TBD) including a theater | TBD | 100 | % | TBD | $ | 1 | TBD | TBD | |||||||||||
Scottsdale Fashion Square |
Office / Residential / Retail Mixed-use development on 7.5 Acres (former Days Inn) | $ | 250 | | 50 | % | $ | 125 | $ | 1 | | 2018 - 2019 | 8% | |||||||
Tysons Corner Center |
Mixed-use Development, Residential Tower with retail ground floor. | $ | 165 | 50 | % | $ | 83 | $ | 1 | 2018 - 2019 | 7% - 8% | |||||||||
Westside Pavilion |
Redevelopment of an existing 755,000 sf Center | | TBD | | 100 | % | | TBD | $ | 1 | | TBD | TBD | |||||||
| | | | | | | | | | | | | | | | | | | | | |
Total Shadow Pipeline |
$ | 765 | $ | 383 | $ | 6 | ||||||||||||||
| | | | | | | | | | | | | | | | | | | | | |
| | | | | | | | | | | | | | | | | | | | | |
| | | | | | | | | | | | | | | | | | | | | |
- (a)
- Much of this information is estimated and may change from time to time. See the Company's forward-looking disclosure on page 1
for factors that may affect the information provided in this table.
- (b)
- This excludes GAAP allocations of non cash and indirect costs.
- (c)
- Stabilized Yield is calculated based on stabilized income after development divided by project direct costs excluding GAAP
allocations of non cash and indirect costs.
- (d)
- This reflects incremental project costs and income subsequent to the Company's $106.8 million investment in July 2014.
- (e)
- Total Costs are net of $15 million of approved public financing grants that will be a reduction of costs, but do not include
additional pending grants totaling $30 million, which if received will further reduce Total Costs to $275 Million to $335 Million.
- (f)
- The Sears lease has been terminated. The 4% yield represents an incremental return over Sears former annual rent. The yield would
increase to 8% without including any offsetting rent impact from Sears.
- (g)
- This section includes potential developments or redevelopments that the Company is considering. The scope of these projects may change. Average returns are expected to be 7% to 9%. There is no certainty that the Company will develop or redevelop any or all of these potential projects.
31
The Macerich Company
Corporate Information
Stock Exchange Listing
New
York Stock Exchange
Symbol: MAC
The following table shows high and low sales prices per share of common stock during each quarter in 2016, 2015 and 2014 and dividends per share of common stock declared and paid by quarter:
| |
Market Quotation per Share |
Dividends | ||||||||
|---|---|---|---|---|---|---|---|---|---|---|
Quarter Ended:
|
High | Low | Declared and Paid |
|||||||
March 31, 2014 |
$ | 62.41 | $ | 55.21 | $ | 0.62 | ||||
June 30, 2014 |
$ | 68.28 | $ | 61.66 | $ | 0.62 | ||||
September 30, 2014 |
$ | 68.81 | $ | 62.62 | $ | 0.62 | ||||
December 31, 2014 |
$ | 85.55 | $ | 63.25 | $ | 0.65 | ||||
March 31, 2015 |
$ | 95.93 | $ | 81.61 | $ | 0.65 | ||||
June 30, 2015 |
$ | 86.31 | $ | 74.51 | $ | 0.65 | ||||
September 30, 2015 |
$ | 81.52 | $ | 71.98 | $ | 0.65 | ||||
December 31, 2015 |
$ | 86.29 | $ | 74.55 | $ | 2.68 | (a) | |||
March 31, 2016 |
$ | 82.88 | $ | 72.99 | $ | 2.68 | (a) | |||
June 30, 2016 |
$ | 85.39 | $ | 71.82 | $ | 0.68 | ||||
- (a)
- Includes a special dividend of $2.00 per common share paid on December 8, 2015. Separately, the Company also paid a special dividend of $2.00 per common share on January 6, 2016.
Dividend Reinvestment Plan
Stockholders may automatically reinvest their dividends in additional common stock of the Company through the Direct Investment Program, which also provides for purchase by voluntary cash contributions. For additional information, please contact Computershare Trust Company, N.A. at 800-567-0169.
| |
|
|
||
|---|---|---|---|---|
| Corporate Headquarters The Macerich Company 401 Wilshire Boulevard, Suite 700 Santa Monica, California 90401 310-394-6000 www.macerich.com |
Transfer Agent Computershare P.O. Box 30170 College Station, TX 77842-3170 800-567-0169 www.computershare.com |
Macerich Website
For an electronic version of our annual report, our SEC filings and documents relating to Corporate Governance, please visit www.macerich.com.
Investor Relations
| Jean Wood Vice President, Investor Relations Phone: 424-229-3366 [email protected] |
John Perry Senior Vice President, Investor Relations Phone: 424-229-3345 [email protected] |
32
Serious News for Serious Traders! Try StreetInsider.com Premium Free!
You May Also Be Interested In
- Perk Labs Inc. Provides Update on Status of MCTO
- Hepsor AS 2023 audited annual report
- PitchBook Launches Global VC Ecosystem Dashboard to Rank World’s Top Startup Cities
Create E-mail Alert Related Categories
SEC FilingsSign up for StreetInsider Free!
Receive full access to all new and archived articles, unlimited portfolio tracking, e-mail alerts, custom newswires and RSS feeds - and more!
