Form 8-K WILLIAM LYON HOMES For: Sep 22
UNITED STATES
SECURITIES AND EXCHANGE COMMISSION
WASHINGTON, D.C. 20549
FORM 8-K
CURRENT REPORT
PURSUANT TO SECTION 13 OR 15(d)
OF THE SECURITIES EXCHANGE ACT OF 1934
Date of report (Date of earliest event reported): September 22, 2016
WILLIAM LYON HOMES
(Exact name of registrant as specified in its charter)
| Delaware | 001-31625 | 33-0864902 | ||
| (State or other jurisdiction of incorporation or organization) |
(Commission file number) |
(I.R.S. Employer Identification No.) |
4695 MacArthur Court, 8th Floor
Newport Beach, California 92660
(Address of principal executive offices) (Zip Code)
(949) 833-3600
(Registrant’s telephone number, including area code)
Not Applicable
(Former name and former address if changed since last report)
Check the appropriate box below if the Form 8-K filing is intended to simultaneously satisfy the filing obligation of the registrant under any of the following provisions:
| ¨ | Written communications pursuant to Rule 425 under the Securities Act (17 CFR 230.425) |
| ¨ | Written communications pursuant to Rule 425 under the Securities Act (17 CFR 230.425) |
| ¨ | Soliciting material pursuant to Rule 14a-12 under the Exchange Act (17 CFR 240.14a-12) |
| ¨ | Pre-commencement communications pursuant to Rule 14d-2(b) under the Exchange Act (17 CFR 240.14d-2(b)) |
| Item 7.01. | Regulation FD Disclosure. |
Senior management of the Company will reference the materials included in Exhibit 99.1 to this report (the “Investor Presentation”) at an investor conference and meetings held beginning on September 22, 2016. A copy of the Investor Presentation is furnished as Exhibit 99.1 to this report.
In accordance with General Instruction B.2 of Form 8-K, the information in this Item 7.01, including the Investor Presentation attached to this report as Exhibit 99.1, shall not be deemed to be “filed” for purposes of Section 18 of the Securities Exchange Act of 1934, as amended (the “Exchange Act”), or otherwise subject to the liability of that section, and shall not be incorporated by reference into any registration statement or other document filed under the Securities Act of 1933, as amended, or the Exchange Act, except as shall be expressly set forth by specific reference in such filing. The furnishing of the information in this report is not intended to, and does not, constitute a determination or admission by the Company that the information in this report or the attached Investor Presentation is material or complete, or that investors should consider this information before making an investment decision with respect to any security of the Company. In addition, the Investor Presentation furnished as an exhibit to this report includes “forward-looking statements” within the meaning of the Private Securities Litigation Reform Act of 1995.
| Item 9.01. | Financial Statements and Exhibits. |
(d) Exhibits:
| Exhibit No. |
Description | |
| 99.1 | Investor Presentation. | |
SIGNATURES
Pursuant to the requirements of the Securities Exchange Act of 1934, as amended, the registrant has duly caused this report to be signed on its behalf by the undersigned hereunto duly authorized.
Date: September 22, 2016
| WILLIAM LYON HOMES | ||
| By: | /s/ Jason R. Liljestrom | |
| Name: | Jason R. Liljestrom | |
| Its: | Vice President, General Counsel and Corporate Secretary | |
EXHIBIT INDEX
| Exhibit No. |
Description | |
| 99.1 | Investor Presentation. | |

Zelman 2016 Housing Summit September 22 & 23, 2016 Exhibit 99.1
Forward Looking Statements Certain statements contained in this presentation that are not historical information may constitute “forward-looking statements” as defined by the Private Securities Litigation Reform Act of 1995, including, but not limited to, forward-looking statements related to: community count growth, market and industry trends, operating and financial results, balance sheet optimization, land supply and execution of our strategies. The forward-looking statements involve risks and uncertainties and actual results may differ materially from those projected or implied. The Company makes no commitment, and disclaims any duty, to update or revise any forward-looking statements to reflect future events or changes in these expectations. Further, certain forward-looking statements are based on assumptions of future events which may not prove to be accurate. Factors that may impact such forward-looking statements include, among others: the availability of labor and homebuilding materials and increased construction cycle times; adverse weather conditions, including but not limited to the continued drought in California and the Southwest; our financial leverage and level of indebtedness and any inability to comply with financial and other covenants under our debt instruments; continued volatility and worsening in general economic conditions either internationally, nationally or in regions in which we operate; changes in governmental laws, regulations and decisions and increased costs, fees and delays associated therewith; uncertainties regarding the U.S. presidential election; worsening in markets for residential housing; the impact of construction defect, product liability and home warranty claims, including the adequacy of self-insurance accruals, and the applicability and sufficiency of our insurance coverage; decline in real estate values resulting in impairment of our real estate assets; volatility in the banking industry and credit markets; uncertainties in the capital and securities markets; terrorism or other hostilities involving the United States; building moratorium or “slow-growth” or “no-growth” initiatives that could be implemented in states in which we operate; changes in mortgage and other interest rates; conditions in the capital, credit and financial markets, including mortgage lending standards and the availability of mortgage financing; changes in generally accepted accounting principles or interpretations of those principles; changes in prices of homebuilding materials; competition for home sales from other sellers of new and resale homes; cancellations and our ability to realize our backlog; the occurrence of events such as landslides, soil subsidence and earthquakes that are uninsurable, not economically insurable or not subject to effective indemnification agreements; whether we are able to pay off or refinance the outstanding balances of our debt obligations at their maturity; limitations on our ability to utilize our tax attributes; whether an ownership change occurred that could, under certain circumstances, have resulted in the limitation of our ability to offset prior years’ taxable income with net operating losses; the timing of receipt of regulatory approvals and the opening of projects; the availability and cost of land for future development; and additional factors discussed under the sections captioned “Risk Factors” included in our annual and quarterly reports filed with the Securities and Exchange Commission. The foregoing list is not exhaustive. New risk factors may emerge from time to time and it is not possible for management to predict all such risk factors or to assess the impact of such risk factors on our business. A copy of the press release reporting the Company’s financial results for the three and six months ended June 30, 2016 is available on the Company's website at www.lyonhomes.com.
Management Presenters Matthew R. Zaist President and Chief Executive Officer
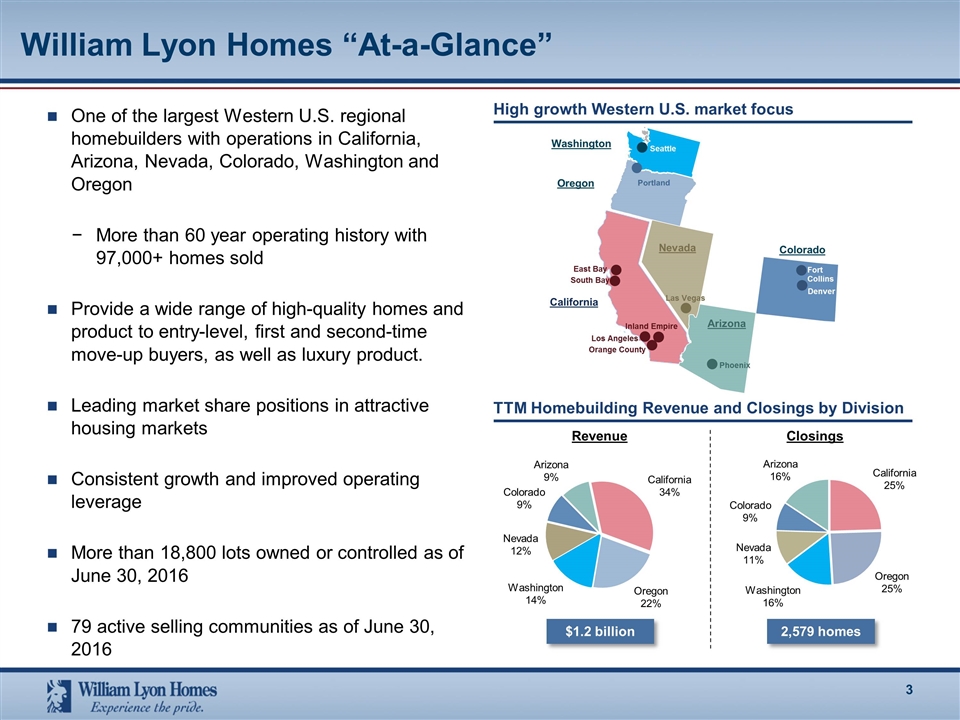
William Lyon Homes “At-a-Glance” One of the largest Western U.S. regional homebuilders with operations in California, Arizona, Nevada, Colorado, Washington and Oregon More than 60 year operating history with 97,000+ homes sold Provide a wide range of high-quality homes and product to entry-level, first and second-time move-up buyers, as well as luxury product. Leading market share positions in attractive housing markets Consistent growth and improved operating leverage More than 18,800 lots owned or controlled as of June 30, 2016 79 active selling communities as of June 30, 2016 High growth Western U.S. market focus TTM Homebuilding Revenue and Closings by Division Revenue Closings $1.2 billion 2,579 homes Seattle Washington East Bay California Nevada Phoenix Las Vegas Arizona Los Angeles South Bay Orange County Colorado Fort Collins Denver Portland Oregon Inland Empire
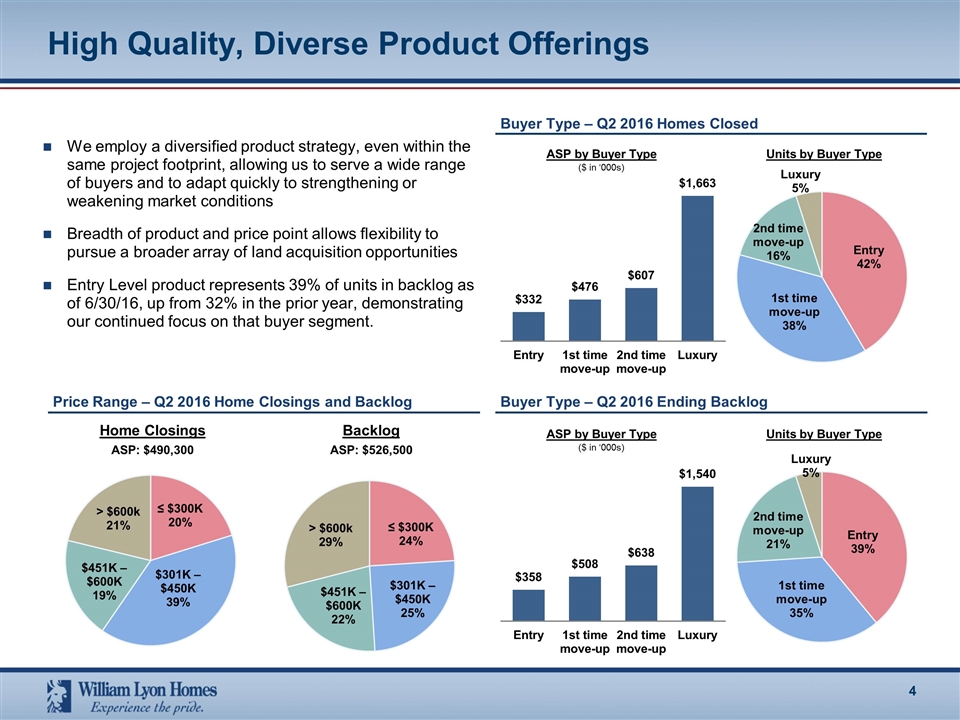
We employ a diversified product strategy, even within the same project footprint, allowing us to serve a wide range of buyers and to adapt quickly to strengthening or weakening market conditions Breadth of product and price point allows flexibility to pursue a broader array of land acquisition opportunities Entry Level product represents 39% of units in backlog as of 6/30/16, up from 32% in the prior year, demonstrating our continued focus on that buyer segment. ASP by Buyer Type ($ in ‘000s) Units by Buyer Type High Quality, Diverse Product Offerings Buyer Type – Q2 2016 Homes Closed Price Range – Q2 2016 Home Closings and Backlog Home Closings Backlog ASP: $490,300 ASP: $526,500 Buyer Type – Q2 2016 Ending Backlog ASP by Buyer Type ($ in ‘000s) Units by Buyer Type > $600k 21% $451K – $600K 19% ≤ $300K 20% $301K – $450K 39% > $600k 29% $451K – $600K 22% ≤ $300K 24% $301K – $450K 25% 2nd time move-up 16% 2nd time move-up 21% 1st time move-up 38% 1st time move-up 35% Entry 42% Entry 39% Luxury 5% Luxury 5%
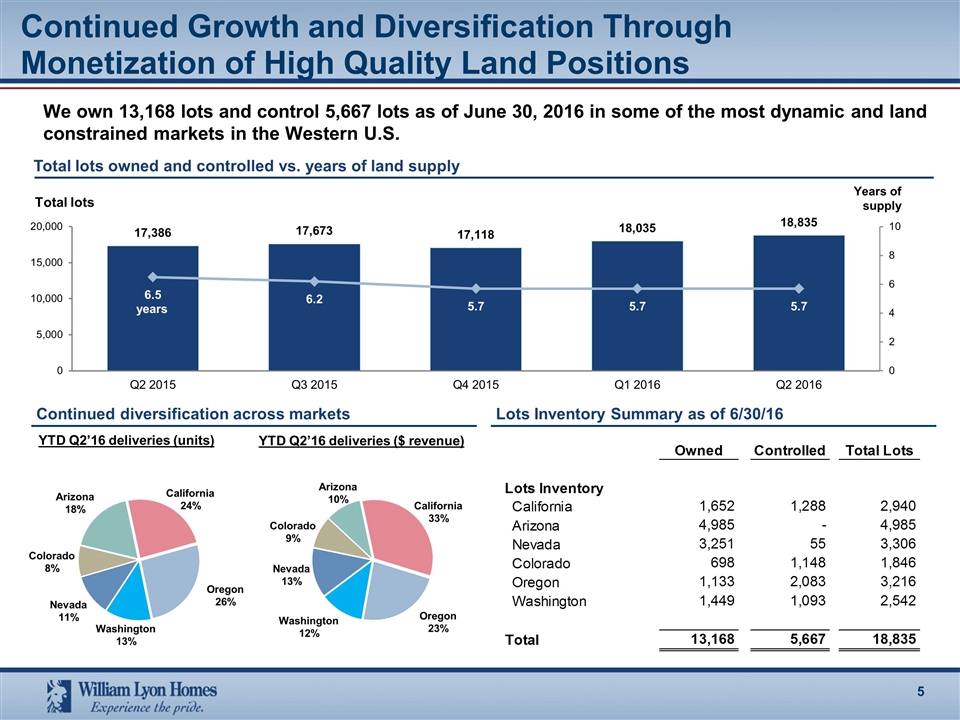
Continued Growth and Diversification Through Monetization of High Quality Land Positions Total lots owned and controlled vs. years of land supply YTD Q2’16 deliveries (units) Continued diversification across markets Lots Inventory Summary as of 6/30/16 We own 13,168 lots and control 5,667 lots as of June 30, 2016 in some of the most dynamic and land constrained markets in the Western U.S. YTD Q2’16 deliveries ($ revenue)
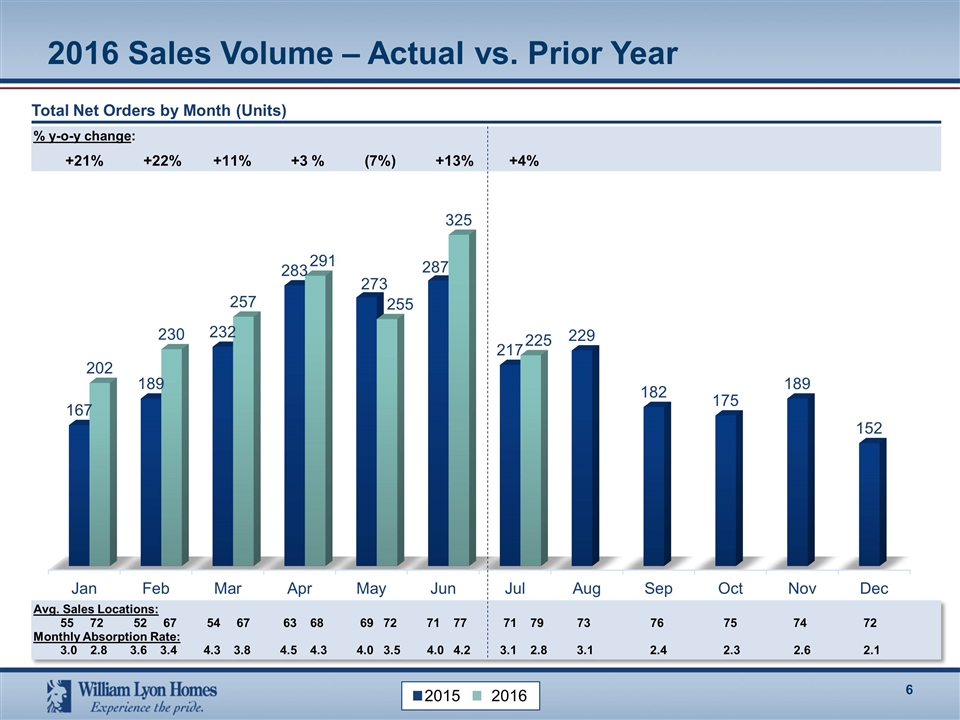
2016 Sales Volume – Actual vs. Prior Year Total Net Orders by Month (Units) % y-o-y change: +21% +22% +11% +3 % (7%) +13% +4% 2015 2016 Avg. Sales Locations: 55 72 52 67 54 67 63 68 69 72 71 77 71 79 73 76 75 74 72 Monthly Absorption Rate: 3.0 2.8 3.6 3.4 4.3 3.8 4.5 4.3 4.0 3.5 4.0 4.2 3.1 2.8 3.1 2.4 2.3 2.6 2.1
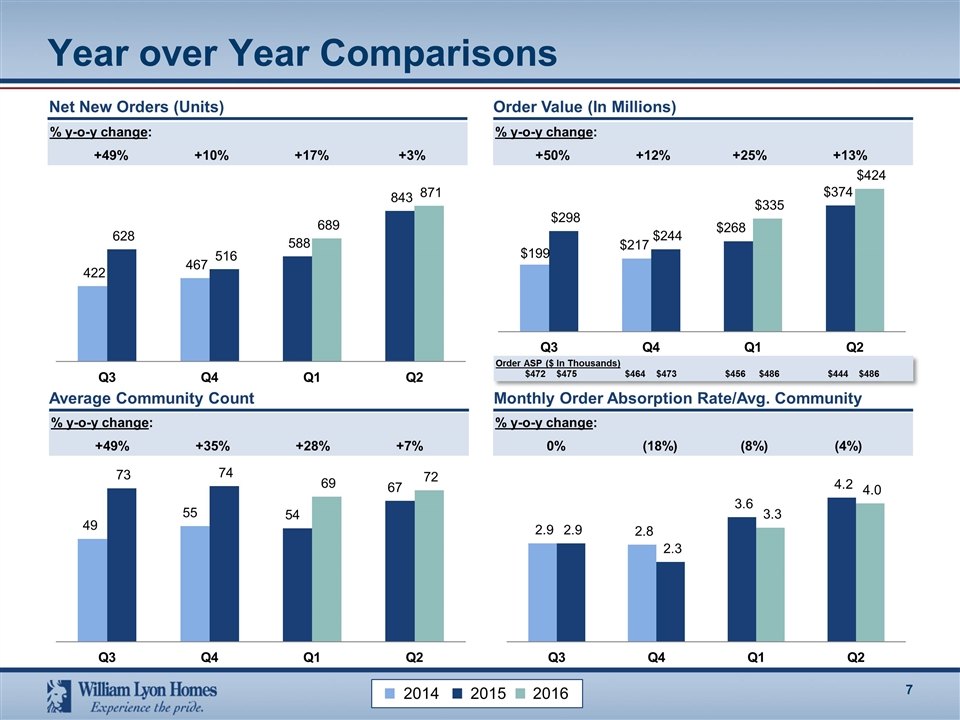
Year over Year Comparisons % y-o-y change: +49% +10% +17% +3% % y-o-y change: +49% +35% +28% +7% % y-o-y change: 0% (18%) (8%) (4%) Net New Orders (Units) Order Value (In Millions) Average Community Count Monthly Order Absorption Rate/Avg. Community % y-o-y change: +50% +12% +25% +13% Order ASP ($ In Thousands) $472 $475 $464 $473 $456 $486 $444 $486 2014 2015 2016
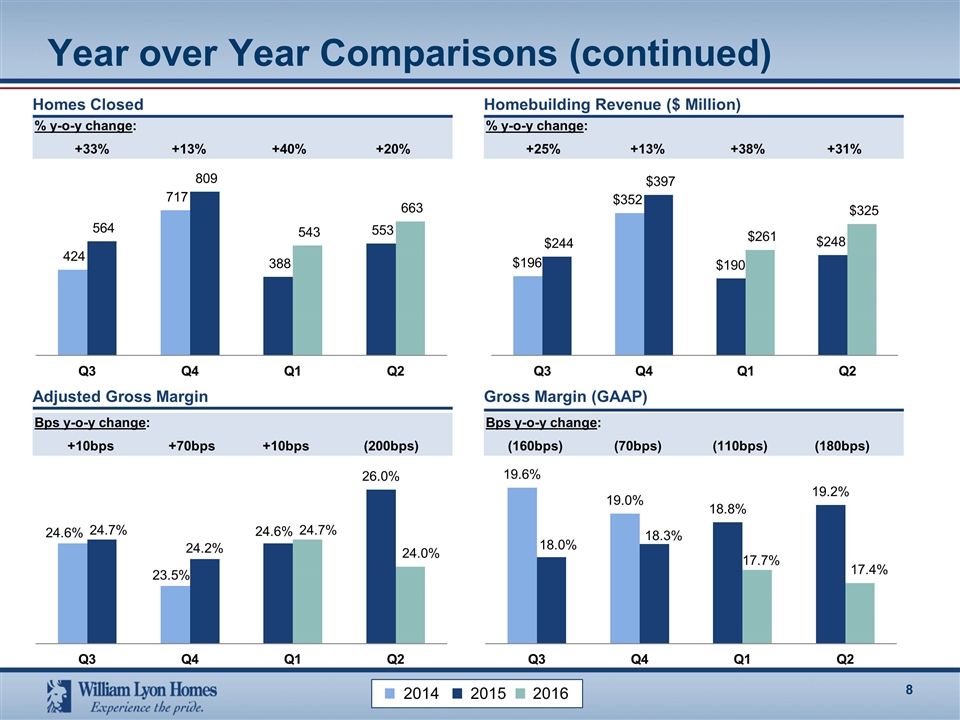
% y-o-y change: +25% +13% +38% +31% Year over Year Comparisons (continued) % y-o-y change: +33% +13% +40% +20% Homes Closed Homebuilding Revenue ($ Million) Bps y-o-y change: +10bps +70bps +10bps (200bps) Bps y-o-y change: (160bps) (70bps) (110bps) (180bps) Adjusted Gross Margin Gross Margin (GAAP) 2014 2015 2016
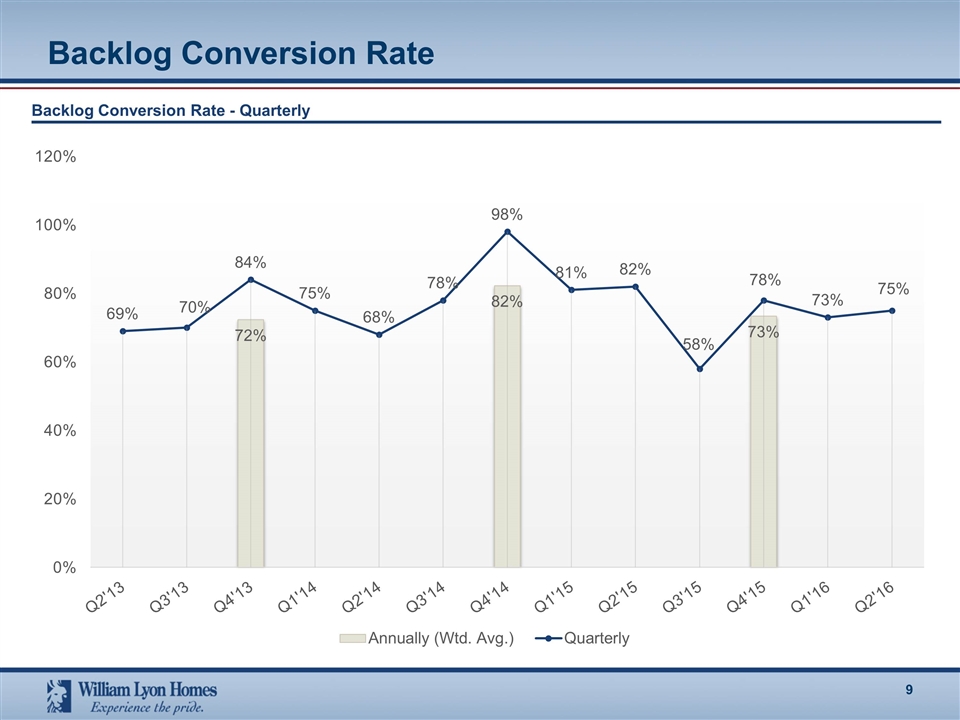
Backlog Conversion Rate Backlog Conversion Rate - Quarterly
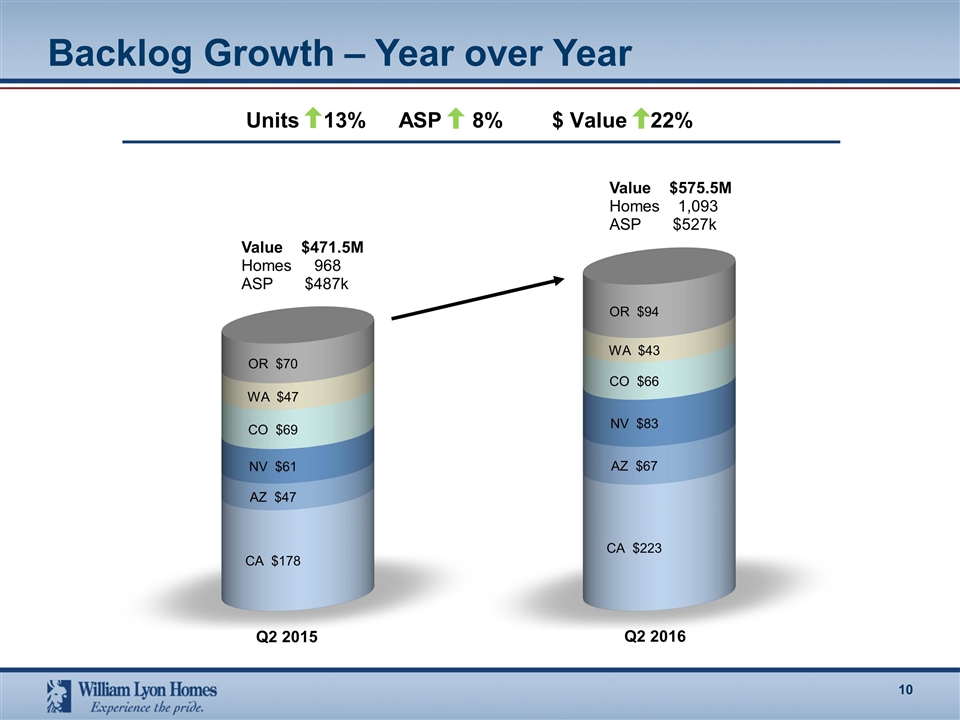
Backlog Growth – Year over Year Value $471.5M Homes 968 ASP $487k Q2 2015 Q2 2016 Value $575.5M Homes 1,093 ASP $527k Units 13%ASP 8%$ Value 22%
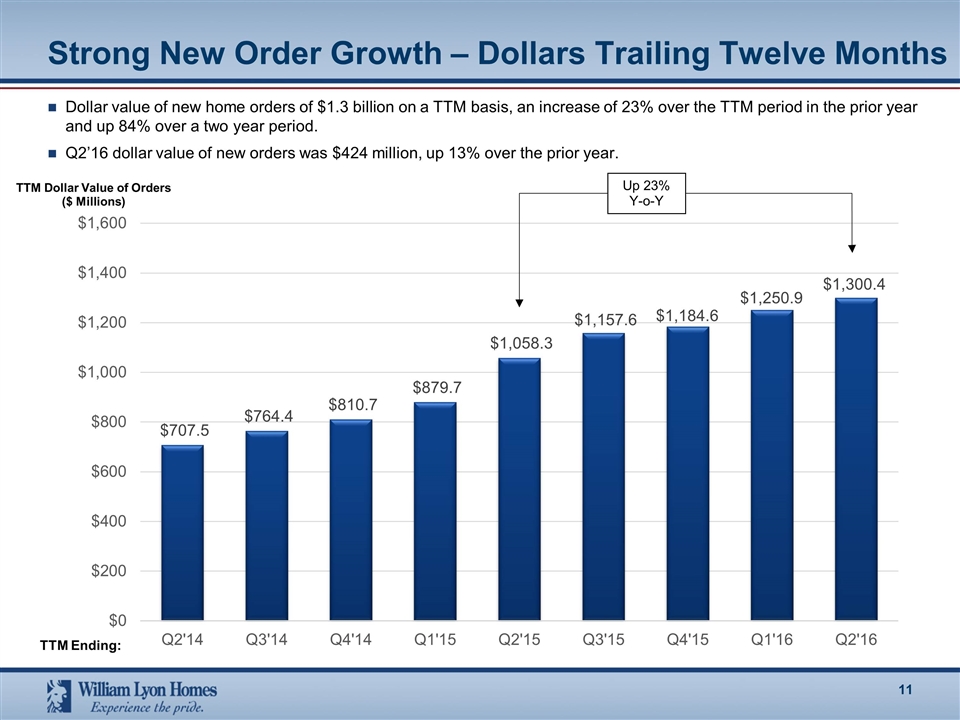
Strong New Order Growth – Dollars Trailing Twelve Months Dollar value of new home orders of $1.3 billion on a TTM basis, an increase of 23% over the TTM period in the prior year and up 84% over a two year period. Q2’16 dollar value of new orders was $424 million, up 13% over the prior year. TTM Dollar Value of Orders ($ Millions) TTM Ending: Up 23% Y-o-Y
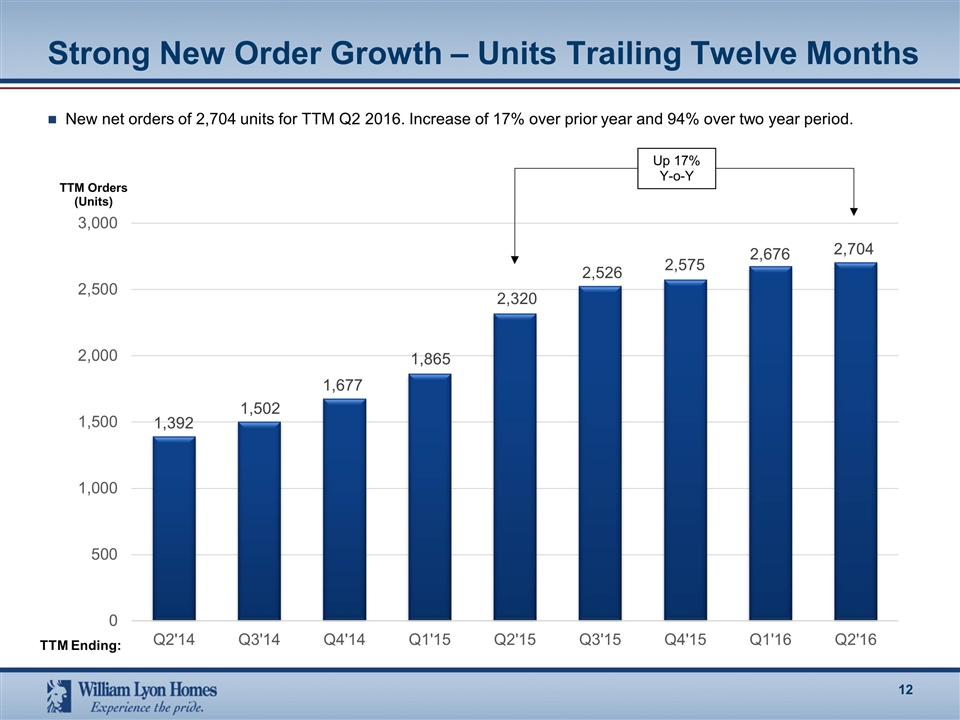
Strong New Order Growth – Units Trailing Twelve Months New net orders of 2,704 units for TTM Q2 2016. Increase of 17% over prior year and 94% over two year period. TTM Orders (Units) TTM Ending: Up 17% Y-o-Y
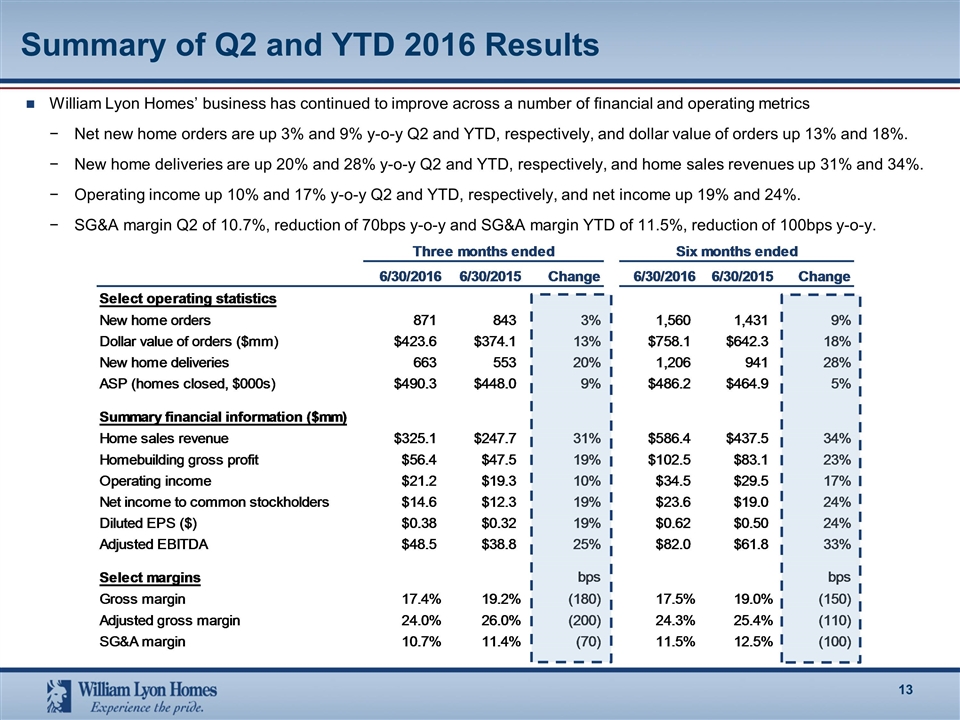
Summary of Q2 and YTD 2016 Results William Lyon Homes’ business has continued to improve across a number of financial and operating metrics Net new home orders are up 3% and 9% y-o-y Q2 and YTD, respectively, and dollar value of orders up 13% and 18%. New home deliveries are up 20% and 28% y-o-y Q2 and YTD, respectively, and home sales revenues up 31% and 34%. Operating income up 10% and 17% y-o-y Q2 and YTD, respectively, and net income up 19% and 24%. SG&A margin Q2 of 10.7%, reduction of 70bps y-o-y and SG&A margin YTD of 11.5%, reduction of 100bps y-o-y.
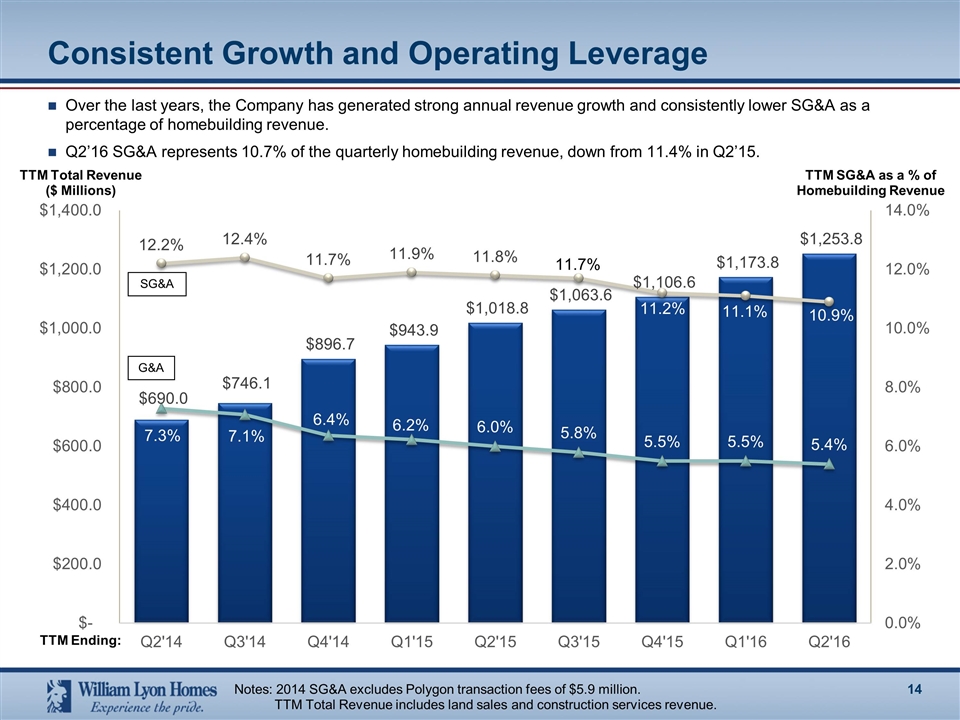
Consistent Growth and Operating Leverage Over the last years, the Company has generated strong annual revenue growth and consistently lower SG&A as a percentage of homebuilding revenue. Q2’16 SG&A represents 10.7% of the quarterly homebuilding revenue, down from 11.4% in Q2’15. TTM Total Revenue ($ Millions) TTM Ending: TTM SG&A as a % of Homebuilding Revenue Notes: 2014 SG&A excludes Polygon transaction fees of $5.9 million. TTM Total Revenue includes land sales and construction services revenue. SG&A G&A
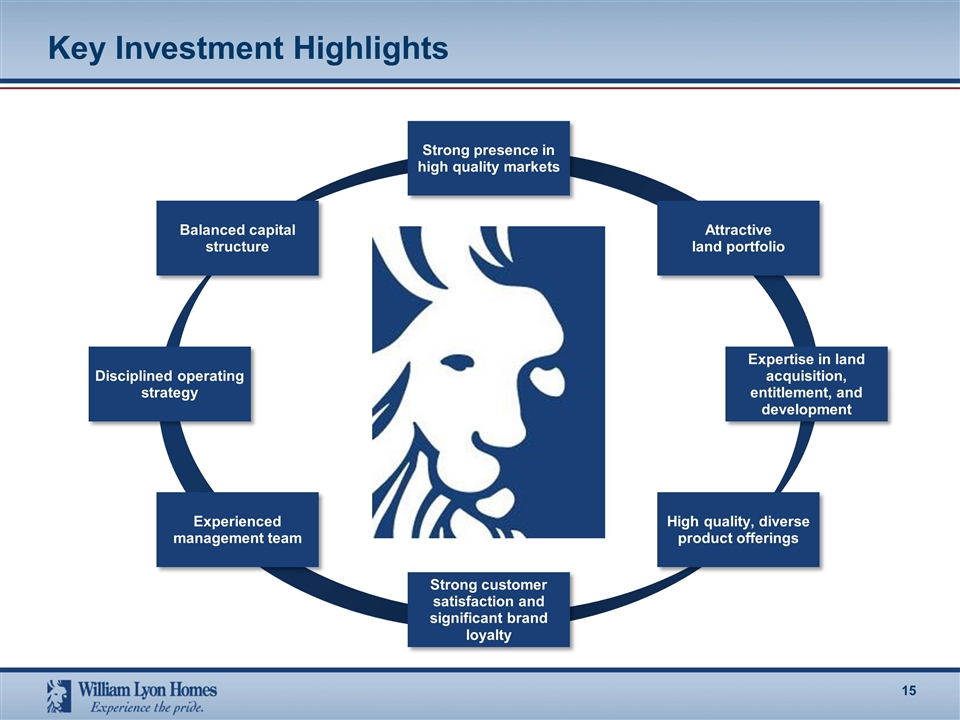
Key Investment Highlights Strong presence in high quality markets Attractive land portfolio High quality, diverse product offerings Balanced capital structure Expertise in land acquisition, entitlement, and development Disciplined operating strategy Strong customer satisfaction and significant brand loyalty Experienced management team
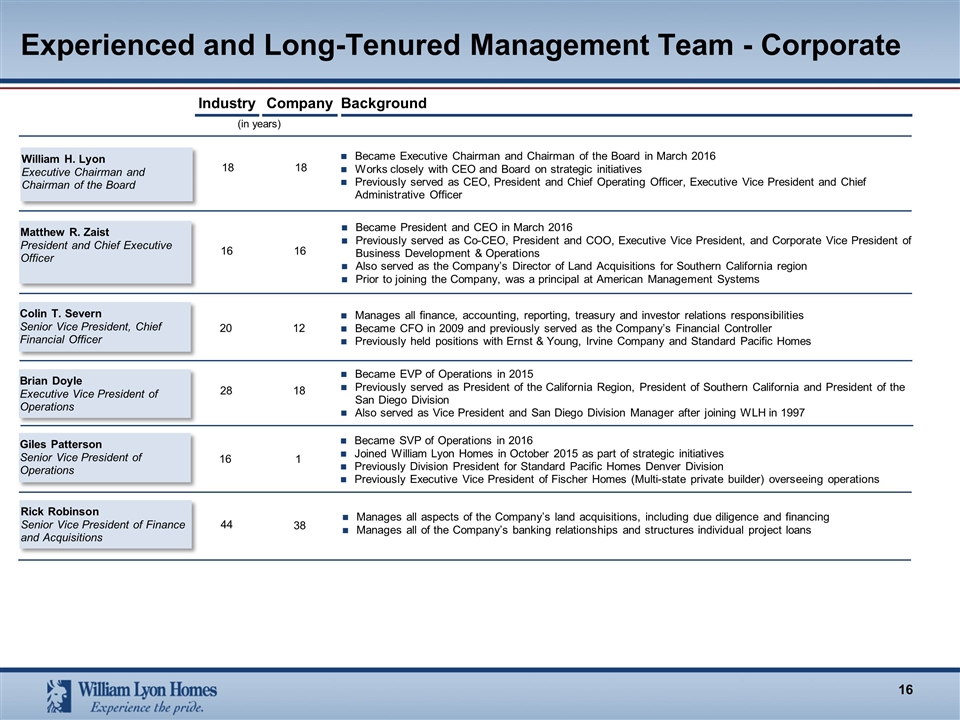
Experienced and Long-Tenured Management Team - Corporate William H. Lyon Executive Chairman and Chairman of the Board Matthew R. Zaist President and Chief Executive Officer Brian Doyle Executive Vice President of Operations 18 18 Became Executive Chairman and Chairman of the Board in March 2016 Works closely with CEO and Board on strategic initiatives Previously served as CEO, President and Chief Operating Officer, Executive Vice President and Chief Administrative Officer 16 16 Became President and CEO in March 2016 Previously served as Co-CEO, President and COO, Executive Vice President, and Corporate Vice President of Business Development & Operations Also served as the Company’s Director of Land Acquisitions for Southern California region Prior to joining the Company, was a principal at American Management Systems 28 18 Became EVP of Operations in 2015 Previously served as President of the California Region, President of Southern California and President of the San Diego Division Also served as Vice President and San Diego Division Manager after joining WLH in 1997 Colin T. Severn Senior Vice President, Chief Financial Officer 20 12 Manages all finance, accounting, reporting, treasury and investor relations responsibilities Became CFO in 2009 and previously served as the Company’s Financial Controller Previously held positions with Ernst & Young, Irvine Company and Standard Pacific Homes 44 38 Background Company Industry (in years) Giles Patterson Senior Vice President of Operations Became SVP of Operations in 2016 Joined William Lyon Homes in October 2015 as part of strategic initiatives Previously Division President for Standard Pacific Homes Denver Division Previously Executive Vice President of Fischer Homes (Multi-state private builder) overseeing operations Rick Robinson Senior Vice President of Finance and Acquisitions 16 1 Manages all aspects of the Company’s land acquisitions, including due diligence and financing Manages all of the Company’s banking relationships and structures individual project loans
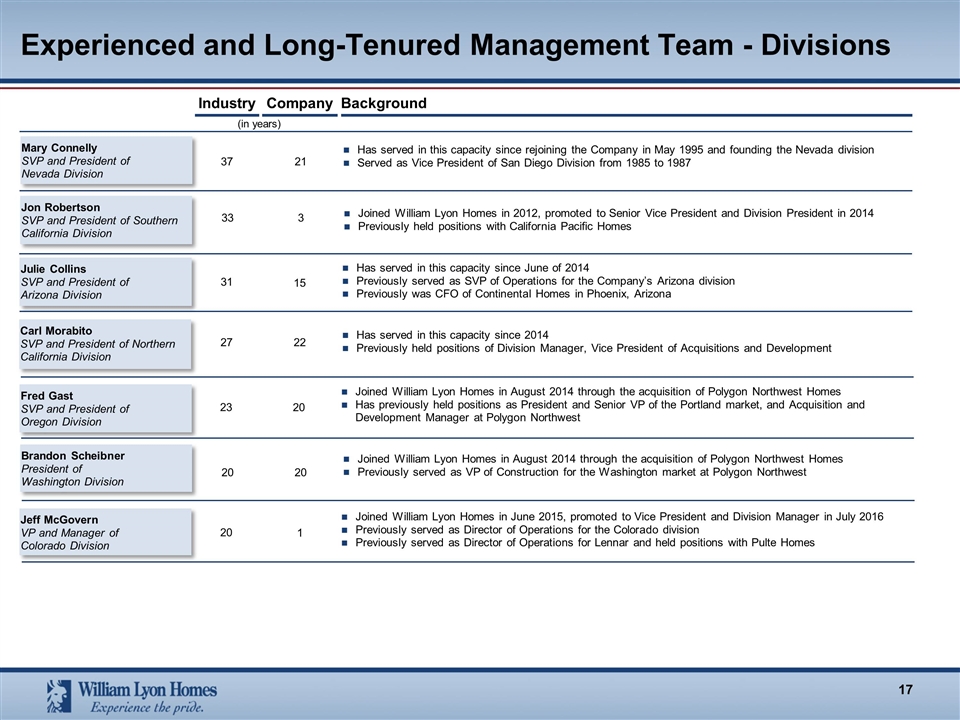
Experienced and Long-Tenured Management Team - Divisions Jeff McGovern VP and Manager of Colorado Division Mary Connelly SVP and President of Nevada Division 31 15 Background Company Industry 37 21 (in years) Brandon Scheibner President of Washington Division 20 20 Joined William Lyon Homes in August 2014 through the acquisition of Polygon Northwest Homes Previously served as VP of Construction for the Washington market at Polygon Northwest Fred Gast SVP and President of Oregon Division Joined William Lyon Homes in August 2014 through the acquisition of Polygon Northwest Homes Has previously held positions as President and Senior VP of the Portland market, and Acquisition and Development Manager at Polygon Northwest Julie Collins SVP and President of Arizona Division 23 20 Has served in this capacity since June of 2014 Previously served as SVP of Operations for the Company’s Arizona division Previously was CFO of Continental Homes in Phoenix, Arizona Has served in this capacity since rejoining the Company in May 1995 and founding the Nevada division Served as Vice President of San Diego Division from 1985 to 1987 Carl Morabito SVP and President of Northern California Division 27 22 Has served in this capacity since 2014 Previously held positions of Division Manager, Vice President of Acquisitions and Development Jon Robertson SVP and President of Southern California Division 33 3 Joined William Lyon Homes in 2012, promoted to Senior Vice President and Division President in 2014 Previously held positions with California Pacific Homes 20 1 Joined William Lyon Homes in June 2015, promoted to Vice President and Division Manager in July 2016 Previously served as Director of Operations for the Colorado division Previously served as Director of Operations for Lennar and held positions with Pulte Homes

Drive revenue growth and profitability through community count growth and monetization of existing land supply We own or control all of our expected 2016 and 2017 selling communities, and a substantial portion of 2018. Community count expected to grow from 72 at December 31, 2015 to a range of 78 to 82 through the end of 2016. Remain disciplined in land acquisitions to support future growth Utilize long-standing local relationships with land sellers, master planned community developers and other builders Employ land strategy that is dynamic, nimble and responsive to prevailing and projected future market conditions Enhance our leading positions in current high growth Western U.S. markets Maximize our long-term and strong reputation for superior quality and customer service Maintain strict operating discipline focused on earnings and cash flow Decentralized management approach allows for detailed knowledge of local market conditions Optimize balance between opportunistic price increases and cost controls Prudent focus on investor returns and balance sheet optimization Substantial cash flow and earnings growth to reduce net leverage Continued Execution of Our Tested Strategy
Divisional Market Summaries
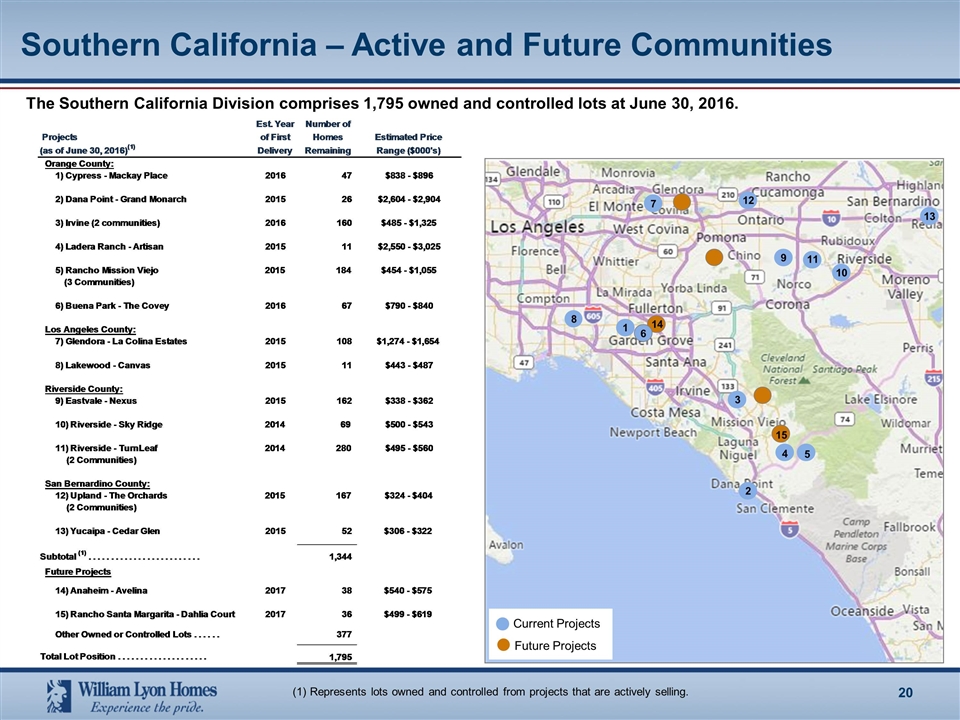
Southern California – Active and Future Communities The Southern California Division comprises 1,795 owned and controlled lots at June 30, 2016. (1) Represents lots owned and controlled from projects that are actively selling. 7 12 9 11 10 13 3 4 5 2 1 14 6 8 15 Current Projects Future Projects
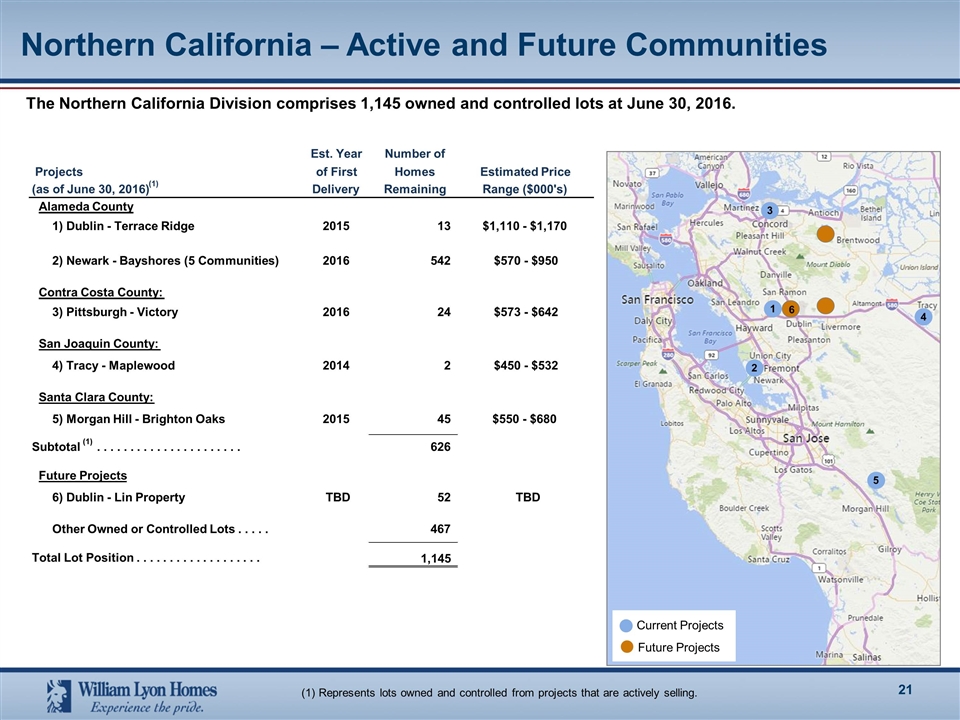
Northern California – Active and Future Communities The Northern California Division comprises 1,145 owned and controlled lots at June 30, 2016. Current Projects Future Projects 5 1 4 3 (1) Represents lots owned and controlled from projects that are actively selling. 6 2 Est. Year Number of Projects of First Homes Estimated Price (as of June 30, 2016) (1) Delivery Remaining Range ($000's) Alameda County 1) Dublin - Terrace Ridge 2015 13 $1,110 - $1,170 2) Newark - Bayshores (5 Communities) 2016 542 $570 - $950 Contra Costa County: 3) Pittsburgh - Victory 2016 24 $573 - $642 San Joaquin County: 4) Tracy - Maplewood 2014 2 $450 - $532 Santa Clara County: 5) Morgan Hill - Brighton Oaks 2015 45 $550 - $680 Subtotal (1) . . . . . . . . . . . . . . . . . . . . . . 626 Future Projects 6) Dublin - Lin Property TBD 52 TBD Other Owned or Controlled Lots . . . . . 467 Total Lot Position . . . . . . . . . . . . . . . . . . . 1,145
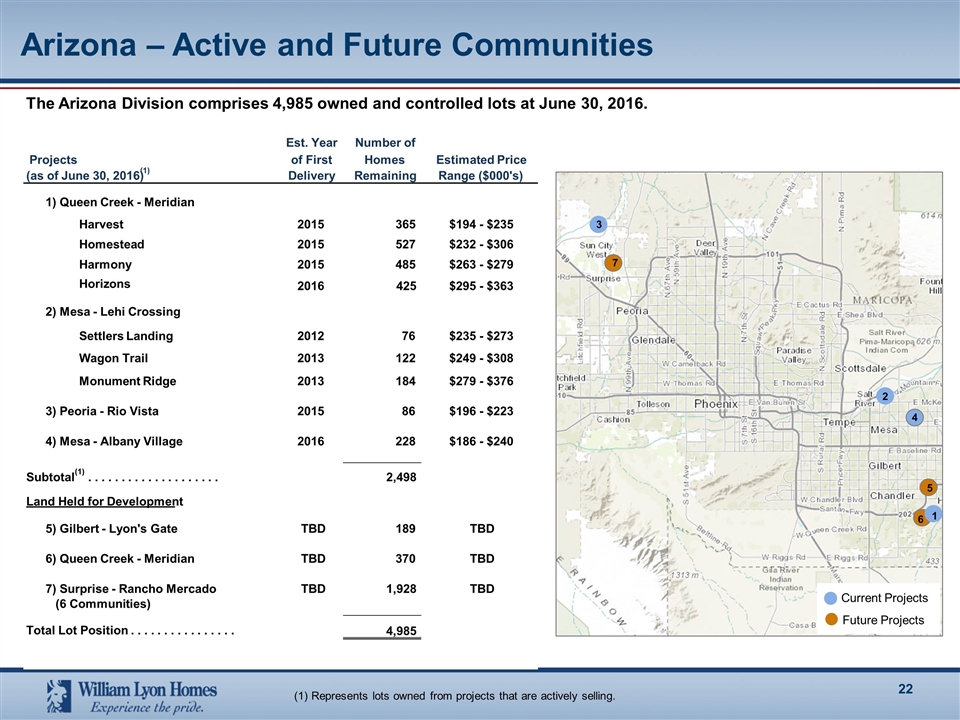
Arizona – Active and Future Communities The Arizona Division comprises 4,985 owned and controlled lots at June 30, 2016. 7 1 4 2 3 5 6 (1) Represents lots owned from projects that are actively selling. Current Projects Future Projects Est. Year Number of Projects of First Homes Estimated Price (as of June 30, 2016) (1) Delivery Remaining Range ($000's) 1) Queen Creek - Meridian Harvest 2015 365 $194 - $235 Homestead 2015 527 $232 - $306 Harmony 2015 485 $263 - $279 Horizons 2016 425 $295 - $363 2) Mesa - Lehi Crossing Settlers Landing 2012 76 $235 - $273 Wagon Trail 2013 122 $249 - $308 Monument Ridge 2013 184 $279 - $376 3) Peoria - Rio Vista 2015 86 $196 - $223 4) Mesa - Albany Village 2016 228 $186 - $240 Subtotal (1) . . . . . . . . . . . . . . . . . .. . . 2,498 Land Held for Development 5) Gilbert - Lyon's Gate TBD 189 TBD 6) Queen Creek - Meridian TBD 370 TBD 7) Surprise - Rancho Mercado TBD 1,928 TBD (6 Communities) Total Lot Position . . . . . . . . . . . . . . . . 4,985
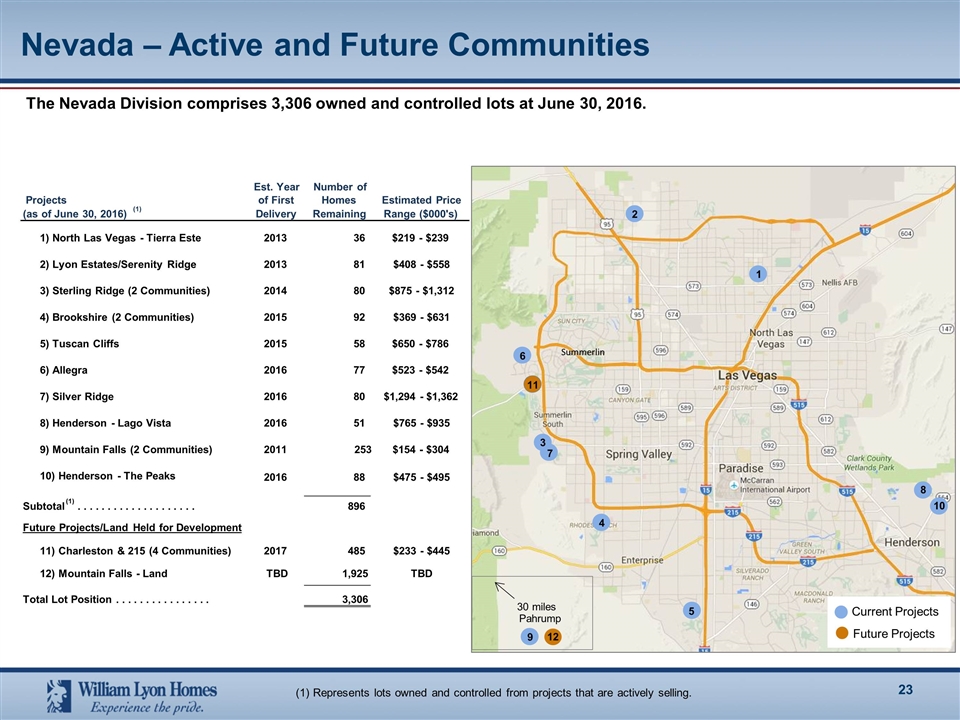
Nevada – Active and Future Communities The Nevada Division comprises 3,306 owned and controlled lots at June 30, 2016. 9 12 2 1 3 7 4 6 5 8 11 30 miles Summerlin Pahrump (1) Represents lots owned and controlled from projects that are actively selling. Current Projects Future Projects 10 Est. Year Number of Projects of First Homes Estimated Price (as of June 30, 2016) (1) Delivery Remaining Range ($000's) 1) North Las Vegas - Tierra Este 2013 36 $219 - $239 2) Lyon Estates/Serenity Ridge 2013 81 $408 - $558 3) Sterling Ridge (2 Communities) 2014 80 $875 - $1,312 4) Brookshire (2 Communities) 2015 92 $369 - $631 5) Tuscan Cliffs 2015 58 $650 - $786 6) Allegra 2016 77 $523 - $542 7) Silver Ridge 2016 80 $1,294 - $1,362 8) Henderson - Lago Vista 2016 51 $765 - $935 9) Mountain Falls (2 Communities) 2011 253 $154 - $304 10) Henderson - The Peaks 2016 88 $475 - $495 Subtotal (1) . . . . . . . . . . . . . . . . . . . . 896 Future Projects/Land Held for Development 11) Charleston & 215 (4 Communities) 2017 485 $233 - $445 12) Mountain Falls - Land TBD 1,925 TBD Total Lot Position . . . . . . . . . . . . . . . . 3,306

Colorado – Active and Future Communities The Colorado Division comprises 1,846 owned and controlled lots at June 30, 2016. (1) Represents lots owned and controlled from projects that are actively selling. 6 7 5 4 1 2 3 8 Current Projects Future Projects Est. Year Number of Projects of First Homes Estimated Price (as of June 30, 2016) (1) Delivery Remaining Range ($000's) 1) Aurora - Southshore (6 Communities) 2014 106 $359 - $591 2) Centennial - Greenfield 2016 35 $450 - $505 3) Castle Rock - Cliffside 2014 14 $518 - $596 4) Arvada - Candelas (3 Communities) 2014 186 $391 - $525 5) Arvada - Leydon Rock (2 Communities) 2014 64 $387 - $457 6) Fort Collins - Timnath Ranch 2014 192 $394 - $457 (2 Communities) 7) Loveland - Lakes at Centerra 2015 180 $358 - $398 Subtotal (1) . . . . . . . . . . . . . . . . . . . . 777 Future Projects/Land Held for Development 8) Denver - Connection (4 Communities) TBD 698 TBD Other Owned & Controlled Lots . . . . 371 Total Lot Position . . . . .. . . . . . . . . . . . . . 1,846
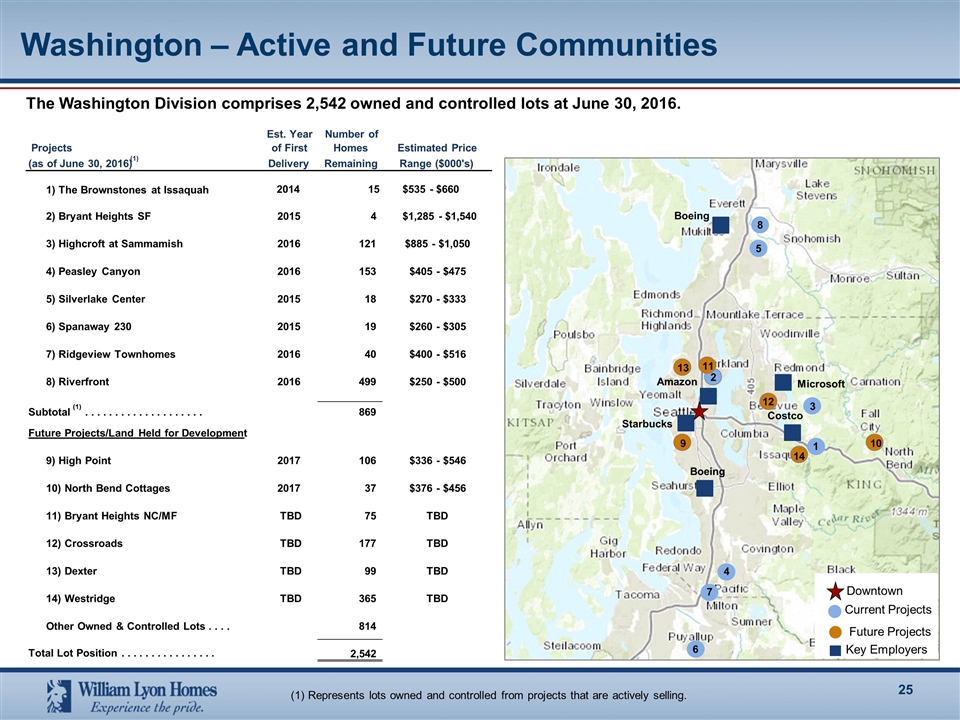
Washington – Active and Future Communities The Washington Division comprises 2,542 owned and controlled lots at June 30, 2016. Key Employers Downtown Boeing Starbucks Amazon Boeing Costco Microsoft 1 3 2 5 4 6 Current Projects Future Projects (1) Represents lots owned and controlled from projects that are actively selling. 13 9 10 12 14 7 8 11 Est. Year Number of Projects of First Homes Estimated Price (as of June 30, 2016) (1) Delivery Remaining Range ($000's) 1) The Brownstones at Issaquah 2014 15 $535 - $660 2) Bryant Heights SF 2015 4 $1,285 - $1,540 3) Highcroft at Sammamish 2016 121 $885 - $1,050 4) Peasley Canyon 2016 153 $405 - $475 5) Silverlake Center 2015 18 $270 - $333 6) Spanaway 230 2015 19 $260 - $305 7) Ridgeview Townhomes 2016 40 $400 - $516 8) Riverfront 2016 499 $250 - $500 Subtotal (1) . . . . . . . . . . . . . . . . . . . . 869 Future Projects/Land Held for Development 9) High Point 2017 106 $336 - $546 10) North Bend Cottages 2017 37 $376 - $456 11) Bryant Heights NC/MF TBD 75 TBD 12) Crossroads TBD 177 TBD 13) Dexter TBD 99 TBD 14) Westridge TBD 365 TBD Other Owned & Controlled Lots . . . . 814 Total Lot Position . . . . . . . . . . . . . . . . 2,542
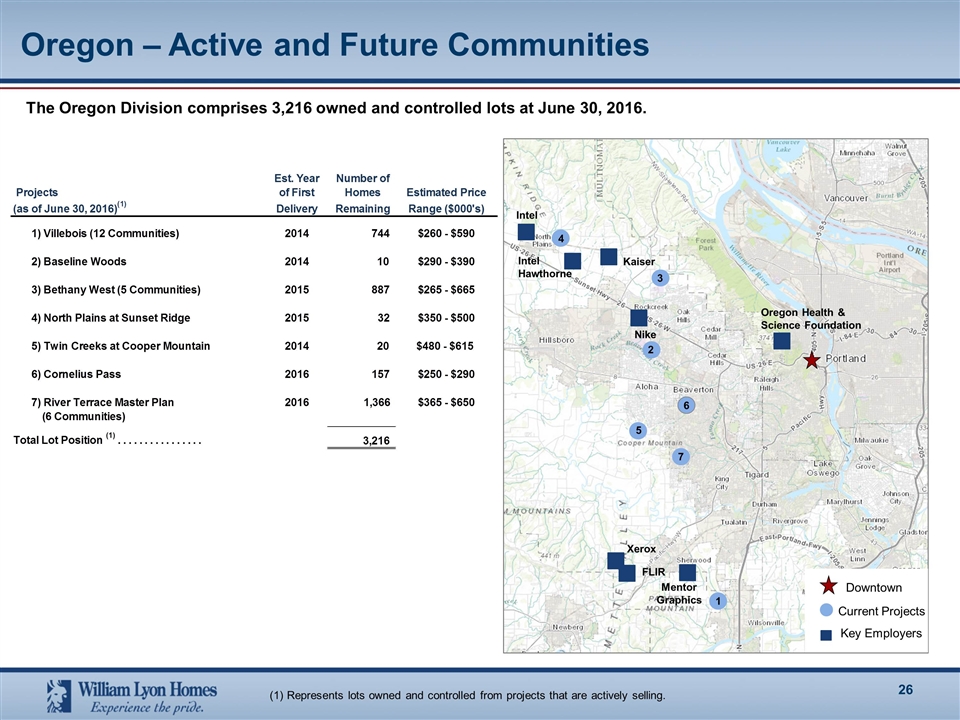
Oregon – Active and Future Communities The Oregon Division comprises 3,216 owned and controlled lots at June 30, 2016. Nike Xerox FLIR Mentor Graphics Oregon Health & Science Foundation Intel Intel Hawthorne Kaiser 4 3 2 5 1 6 Downtown Current Projects (1) Represents lots owned and controlled from projects that are actively selling. Key Employers 7

Thank you!
Appendix
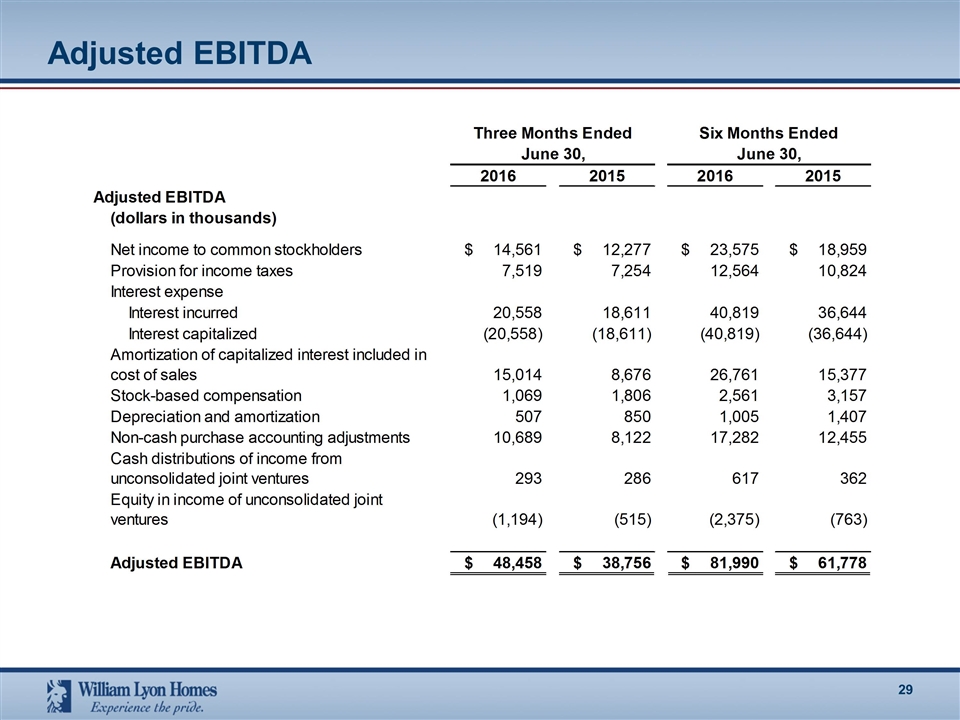
Adjusted EBITDA
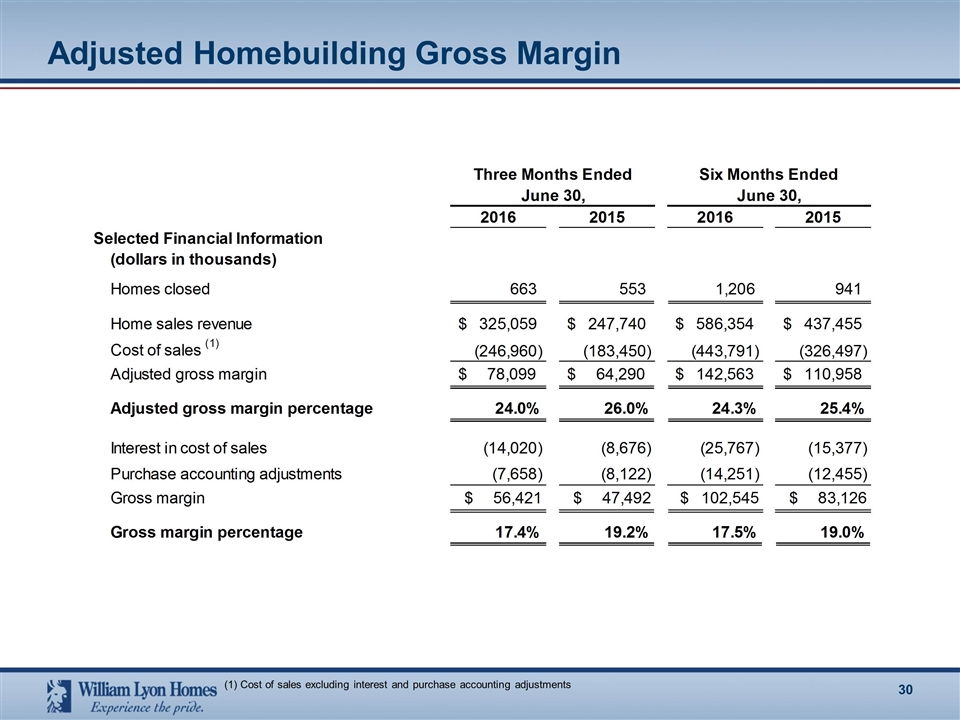
Adjusted Homebuilding Gross Margin (1) Cost of sales excluding interest and purchase accounting adjustments
Serious News for Serious Traders! Try StreetInsider.com Premium Free!
You May Also Be Interested In
- GA-ASI Selected to Build CCA for AFLCMC
- SHAREHOLDER ACTION ALERT: The Schall Law Firm Encourages Investors in Compass Minerals International, Inc. with Losses to Contact the Firm
- ROSEN, A LEADING LAW FIRM, Encourages Barclays PLC Investors to Secure Counsel Before Important Deadline in Securities Class Action – VXX
Create E-mail Alert Related Categories
SEC FilingsSign up for StreetInsider Free!
Receive full access to all new and archived articles, unlimited portfolio tracking, e-mail alerts, custom newswires and RSS feeds - and more!


 Tweet
Tweet Share
Share