

Form 8-K WABASH NATIONAL CORP For: Nov 01
 Tweet
Tweet Share
Share
UNITED STATES
SECURITIES AND EXCHANGE COMMISSION
Washington, D.C. 20549
FORM 8-K
CURRENT REPORT
Pursuant to Section 13 or 15(d) of the
Securities Exchange Act of 1934
Date of Report (Date of earliest event reported):
November 1, 2016
Wabash National Corporation
(Exact name of registrant as specified in its charter)
| Delaware | 1-10883 | 52-1375208 |
| (State or other jurisdiction of incorporation) | (Commission File No.) | (IRS Employer Identification No.) |
| 1000 Sagamore Parkway South, Lafayette, Indiana 47905 |
| (Address of principal executive offices) (Zip Code) |
Registrant’s telephone number, including
area code:
(765) 771-5310
Not applicable
(Former name or former address, if changed since last report)
Check the appropriate box below if the Form 8-K filing is intended to simultaneously satisfy the filing obligation of the registrant under any of the following provisions:
| ☐ | Written communications pursuant to Rule 425 under the Securities Act (17 CFR 230.425) |
| ☐ | Soliciting material pursuant to Rule 14a-12 under the Exchange Act (17 CFR 240.14a-12) |
| ☐ | Pre-commencement communications pursuant to Rule 14d-2(b) under the Exchange Act (17 CFR 240.14d-2(b)) |
| ☐ | Pre-commencement communications pursuant to Rule 13e-4(c) under the Exchange Act (17 CFR 240.13e-4(c)) |
INFORMATION TO BE INCLUDED IN THE REPORT
Section 7 – Regulation FD
Item 7.01 Regulation FD Disclosure.
Wabash National Corporation has prepared updated slides for use in connection with investor presentations. A copy of the slides is furnished as an exhibit hereto and is incorporated herein by reference. This information shall not be deemed “filed” for purposes of Section 18 of the Securities Exchange Act of 1934, as amended, or otherwise subject to the liabilities of that section, and is not incorporated by reference into any filing of Wabash National Corporation, whether made before or after the date of this report, regardless of any general incorporation language in the filing.
Section 9 – Financial Statements and Exhibits
Item 9.01 Financial Statements and Exhibits.
(d) Exhibits
99.1 Wabash National Corporation slide presentation.
| Page 2 |
SIGNATURES
Pursuant to the requirements of the Securities Exchange Act of 1934, as amended, the registrant has duly caused this report to be signed on its behalf by the undersigned thereunto duly authorized.
| WABASH NATIONAL CORPORATION | ||
| Date: November 1, 2016 | By: | /s/ Jeffery L. Taylor |
| Jeffery L. Taylor Senior Vice President and Chief Financial Officer | ||
| Page 3 |
EXHIBIT INDEX
| Exhibit No. | Description |
| 99.1 | Wabash National Corporation slide presentation |
| Page 4 |
Exhibit 99.1

WABASH NATIONAL CORPORATION Investor Update November 2016
2 This presentation contains certain forward - looking statements, as defined by the Private Securities Litigation Reform Act of 1995. All statements other than historical facts are forward - looking statements, including without limit, those regarding shipment outlook, Operating EBITDA, backlog, demand level expectations, profitability and earnings capacity, adjusted earnings per share guidance, margin opportunities, and potential benefits of any recent acquisitions. Any forward - looking statements are subject to certain risks and uncertainties that could cause actual results to differ materially from those implied by the forward - looking statements. Without limit, these risks and uncertainties include economic conditions, increased competition, dependence on new management, reliance on certain customers and corporate partnerships, shortages and costs of raw materials, manufacturing capacity and cost containment risks, dependence on industry trends, access to capital, acceptance of products, and government regulation. You should review and consider the various disclosures made by the Company in this presentation and in its reports to its stockholders and periodic reports on Forms 10 - K and 10 - Q. We cannot give assurance that the expectations reflected in our forward - looking statements will prove to be correct. Our actual results could differ materially from those anticipated in these forward - looking statements. All written and oral forward - looking statements attributable to us are expressly qualified in their entirety by the factors we disclose that could cause our actual results to differ materially from our expectations. S AFE H ARBOR S TATEMENT © 2016 Wabash National, L.P. All rights reserved. Wabash®, Wabash National®, DuraPlate®, DuraPlate AeroSkirt®, Walker, Brenner® and Beall® are marks owned by Wabash National, L. P. Transcraft® and Benson® are marks owned by Transcraft Corporation.
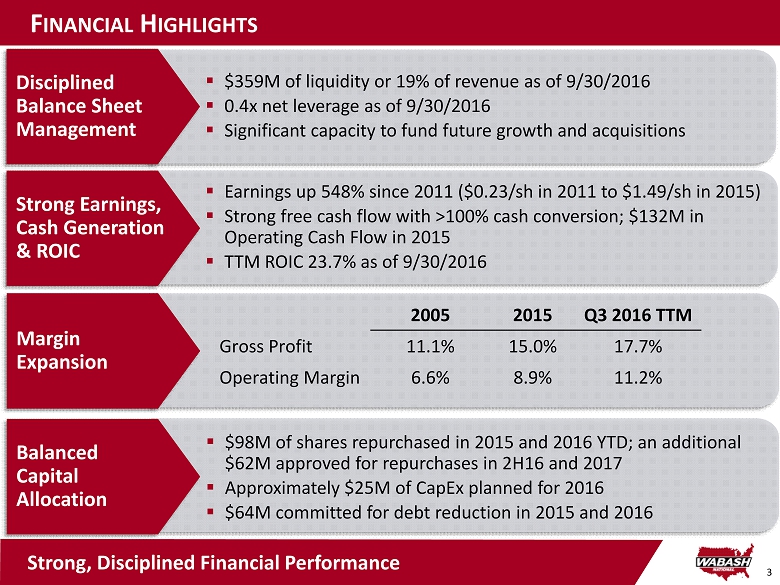
3 ▪ Earnings up 548% since 2011 ($ 0.23/ sh in 2011 to $ 1.49/ sh in 2015 ) ▪ Strong free cash flow with >100 % cash conversion; $ 132M in Operating Cash Flow in 2015 ▪ TTM ROIC 23.7% as of 9 /30/2016 ▪ $ 359M of liquidity or 19% of revenue as of 9 /30/2016 ▪ 0.4x net leverage as of 9 /30/2016 ▪ Significant capacity to fund future growth and acquisitions F INANCIAL H IGHLIGHTS Disciplined Balance Sheet Management Margin Expansion Strong Earnings, Cash Generation & ROIC Balanced Capital Allocation ▪ $98M of shares repurchased in 2015 and 2016 YTD; an additional $62M approved for repurchases in 2H16 and 2017 ▪ Approximately $25M of CapEx planned for 2016 ▪ $64M committed for debt reduction in 2015 and 2016 Strong, Disciplined Financial Performance 2005 2015 Q3 2016 TTM Gross Profit 11.1% 15.0% 17.7% Operating Margin 6.6% 8.9% 11.2%

4 2006 | 2013 | 2015 | 2016 Company Facts and Figures ▪ Founded in 1985 ▪ Publicly traded s ince 1991 (NYSE: WNC) ▪ 2015 Revenue: $2.0B ▪ 2015 New Trailer Shipments: 64,700 ▪ Nearly 6,000 associates worldwide (full time & contract) ▪ Headquarters in Lafayette, Indiana ▪ 12 manufacturing l ocations in 3 countries ▪ 13 company - owned r etail l ocations in the U.S . Over 31 Years of Innovation Leadership W ABASH N ATIONAL C ORPORATION

5 W ABASH N ATIONAL C ORPORATION Wabash National offers a wide selection of products … …that span a diverse set of markets and industries. …to a nationwide customer base of blue - chip companies … Commercial Transportation Food, Dairy & Beverage Pharmaceutical & Biotech 2015 Sales: $ 1.6B ▪ Dry and Refrigerated Vans ▪ Platform Trailers ▪ Dry and Refrigerated Truck Bodies ▪ Fleet Used Trailers ▪ Aftermarket Parts and Service Commercial Trailer Products (CTP) 2015 Sales: $ 457M ▪ Tank Trailers and Truck - Mounted Tanks ▪ Composite Panels and Products ▪ Dairy , Food and Beverage Equipment ▪ Containment and Aseptic Systems ▪ Aircraft Refueling Equipment Diversified Products Group (DPG) Chemical Leading Brands in Diverse End Markets and Industries

6 G ROWTH I NITIATIVES D RIVING R ECORD R ESULTS 2005 2015 Consolidated Revenue 2005 vs. 2015 Dry Vans All Other Products $2.0B $ 1.2B Dry Vans $1.0B (77% of Total Revenue) Dry Vans $1.2B ( 59% of Total Revenue) 67% Revenue Improvement with Less Dependency on Dry Vans 2013: Beall Acquisition 2014: Aurora Partnership for Aftermarket Parts 2006: Transcraft Acquisition 2012: Walker Group Acquisition 2008: Wabash Composites Launch and Benson Acquisition 2015: Truck Bodies Launch Key Highlights

7 G ROWTH I NITIATIVES D RIVING R ECORD R ESULTS 2005 2015 Revenue Manufacturing Retail & Distribution 22% Commercial Trailer Products (CTP) Diversified Products Group (DPG) Operating Income Manufacturing Gross Profit/ Margin 12.5% 23.4% 15.0% 0% 5% 10% 15% 20% 25% CTP Consol. DPG 11.7% 8.1% 11.1% 0% 5% 10% 15% 20% 25% Mfg. Retail & Dist. Consol. $135M $303M 96% $80M Retail & Distribution $180M $1.2B $2.0B 78% 20% 80% 24% 76% 4% Diversified Products Group (DPG) Commercial Trailer Products (CTP) Diversification Yields Higher Margins, Less Cyclicality 2016 expected to be another record year for Wabash in terms of profitability. Dick Giromini, CEO Q3 2016 Earnings Call – October 25, 2016 2015 Records ($ mils) Net Sales 2,027.5 Gross Profit 303.4 GM % 15.0% Op Income 180.4 OI % 8.9% Operating EBITDA 229.5 Operating EBITDA % 11.3%
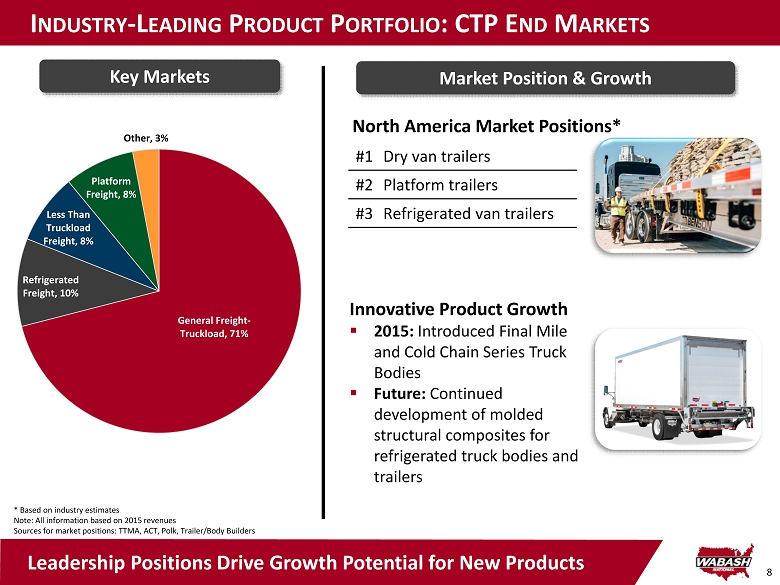
8 General Freight - Truckload , 71% Refrigerated Freight , 10% Less Than Truckload Freight , 8% Platform Freight , 8% Other , 3% I NDUSTRY - L EADING P RODUCT P ORTFOLIO : CTP E ND M ARKETS Innovative Product Growth ▪ 2015: Introduced Final Mile and Cold Chain Series Truck Bodies ▪ Future : Continued development of molded structural composites for refrigerated truck bodies and trailers North America Market Positions* * Based on industry estimates Note: All information based on 2015 revenues Sources for market positions: TTMA, ACT, Polk, Trailer/Body Builders #1 Dry van trailers #2 Platform trailers #3 Refrigerated van trailers Leadership Positions Drive Growth Potential for New Products Key Markets Market Position & Growth

9 I NDUSTRY - L EADING P RODUCT P ORTFOLIO : CTP O VERVIEW Van & Platform Trailers Transportation Products & Services DuraPlate® Dry Van DuraPlate HD® Dry V an ArcticLite® Refrigerated V an DuraPlate Pup Trailer Benson® Aluminum T railers Transcraft® Steel and Combo Trailers Transcraft® Coil H aul Trailer DuraPlate Final Mile Series Truck Body Cold Chain Series Truck Body Aftermarket Parts and Services On - Site & Mobile Customer Service Converter Dollies Intermodal Equipment Rail Products Wood Flooring Products Double Drop Trailers

10 Food, Dairy, Beverage 29% Chemical 28% General Freight 12% Aviation 7% Pharmaceutical 6% Refined Fuel 6% O&G 5% Aerodynamic Devices 4% Other 3% I NDUSTRY - L EADING P RODUCT P ORTFOLIO : DPG E ND M ARKETS Innovative Product Growth ▪ 2015: Expanded production capacity for dairy silos and tank trailers at our Mexico facility ▪ 2016: Entered into the craft brewing equipment market with W.M. Sprinkman Corporation partnership Market Positions* Key Markets Market Position & Growth Leadership Positions Drive Growth Potential for New Products * Based on industry and management estimates Note: All information based on 2015 revenues Sources for market positions: TTMA, ACT, Polk, Trailer/Body Builders #1 All liquid transportation systems #1 Stainless steel liquid tank trailers #1 Aircraft refuelers worldwide #1 Isolators and downflow booths worldwide North America Worldwide

11 Sanitary Trailer Refined Fuel Truck Processor Downflow Booth Isolator Aircraft Refueler Dry Bulk Trailer Vertical Silos Above Ground Storage Tanks Mobile Clean Room Hydrant Cart FRP Trailer Vacuum Truck Refined Fuel Truck & Pull Chemical Trailer Truck Body Panels Aerodynamic Fairings Ground Freight ULD Deck Systems Portable Storage Container I NDUSTRY - L EADING P RODUCT P ORTFOLIO : DPG O VERVIEW Tank Trailers Aviation & Truck Equip. Process Systems Composites

WABASH NATIONAL CORPORATION Our Future Outlook
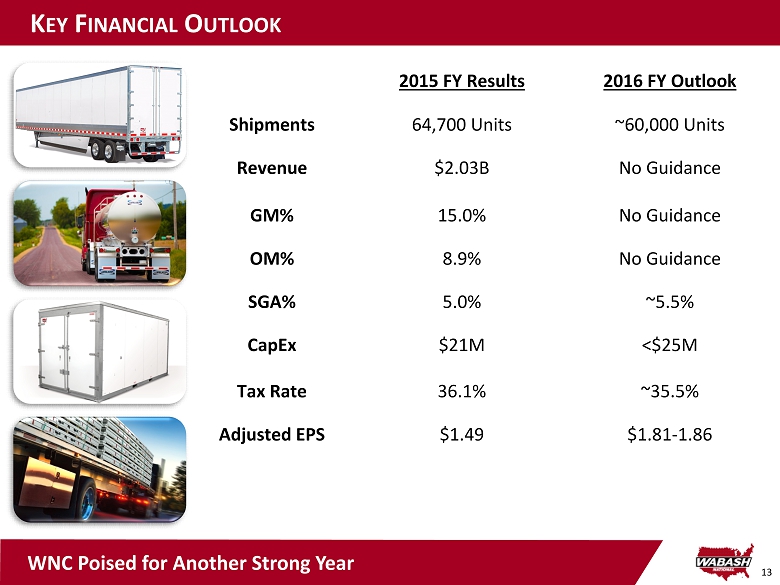
13 K EY F INANCIAL O UTLOOK 2015 FY Results 2016 FY Outlook Shipments 64,700 Units ~60,000 Units Revenue $2.03B No Guidance GM% 15.0% No Guidance OM% 8.9% No Guidance SGA% 5.0% ~5.5% CapEx $21M <$25M Tax Rate 36.1% ~35.5% Adjusted EPS $1.49 $1.81 - 1.86 WNC Poised for Another Strong Year
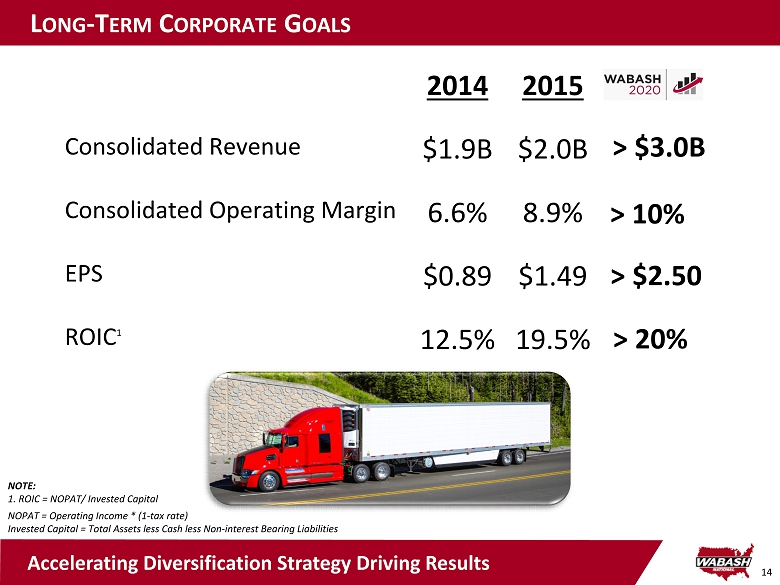
14 L ONG - T ERM C ORPORATE G OALS 2014 2015 Consolidated Revenue $1.9B $2.0B Consolidated Operating Margin 6.6% 8.9% EPS $0.89 $1.49 ROIC 1 12.5% 19.5% > $3.0B > 10% > 20% > $2.50 NOTE: 1. ROIC = NOPAT/ Invested Capital NOPAT = Operating Income * (1 - tax rate) Invested Capital = Total Assets less Cash l ess Non - interest Bearing Liabilities Accelerating Diversification Strategy Driving Results

15 L ONG - T ERM G ROWTH D RIVERS Margin Expansion - Pricing discipline - Operational efficiency / lean manufacturing - Supply chain optimization Organic Growth - New end markets and geographies - Product innovations / portfolio expansion - Aftermarket parts and service capabilities Mergers & Acquisitions - Proven ability to acquire and integrate - Enhance business stability and reduce cyclicality - Operational synergies - Strategic but selective Our Three Part Plan Will Drive Our Future Growth

16 M EGA T RENDS D RIVE G ROWTH I NITIATIVES ▪ Advanced lightweight materials ▪ Full suite of aero products ▪ Aftermarket parts growth ▪ Mobile and On - Site Customer Service ▪ Low cost energy supports chemical production ▪ $158B* of committed chemical production investment ▪ Market share growth in aluminum products ▪ New and existing designs and customers ▪ New patent - pending technology ▪ International expansion *Investment announced since 2010 per the American Chemical Council with 34% already completed Urbanization, Final Mile & Home Delivery Expansion of Cold Chain/Food Equipment Increased Regulation (GHG, ELDs, Food Safety) Energy and Chemical Production, Storage & Transportation WNC is Poised to Capitalize on These Mega Trends

17 O RGANIC G ROWTH I NITIATIVES : T RUCK B ODY S POTLIGHT ▪ Dry Truck Body Market > 50,000 units annually ▪ Refrigerated Truck Body Market > 10,000 units annually ▪ Objective is to grow Truck Body business to > $ 100M revenue by 2020 ▪ Utilizes industry - leading DuraPlate® panels ▪ Robust heavy - duty design ▪ Widely available parts ▪ ~200 presently in service; sold into existing fleet customers for 2 years ▪ Available with weight - saving floor using molded structural composite technology ▪ Applicable to Class 5 - 8 chassis Truck Body Sales Poised for Growth ▪ Utilizes legacy sheet & post trailer design technology; or ▪ Available with molded structural composite thermal technology: » 15% lighter » 25% improved thermal performance » Up to 2x improvement in puncture resistance ▪ Heavy - duty design ▪ Applicable to Class 5 - 8 chassis Final Mile Series Dry Truck Body Cold Chain Series Refrigerated Truck Body

WABASH NATIONAL CORPORATION Market Dynamics

19 T RAILER D EMAND D RIVERS ▪ 2008 - 2010: Significant under buy of new trailers ▪ More than 40% of dry van trailers > 10 years old ▪ Active dry van trailers < 15 years old still below 2007 levels ▪ Continued access to financing ▪ Hours of Service (HOS), ELDs, speed limiters, and others » Pressuring Carrier Productivity ▪ Compliance, Safety, Accountability (CSA), and California Air Resources Board (CARB) » Necessitating Fleet and Equipment Upgrades ▪ Greenhouse Gas (GHG) regulations for trailers » Driving Demand for New Aero Products ▪ Truck utilization rises due to regulatory impact ▪ Anticipated future truckload rate increases ▪ Near record fleet profitability Fleet Dynamics + Regulations = Continued Trailer Demand Fleet Dynamics Regulations Operating Environment

20 M ARKET D RIVERS : T RAILER P RODUCTS ▪ Strong demand above replacement levels forecast for next 5 years ▪ Fleet equipment dynamics and regulations key drivers of trailer demand Trailer Demand Forecasts Strong Demand Above Replacement Levels
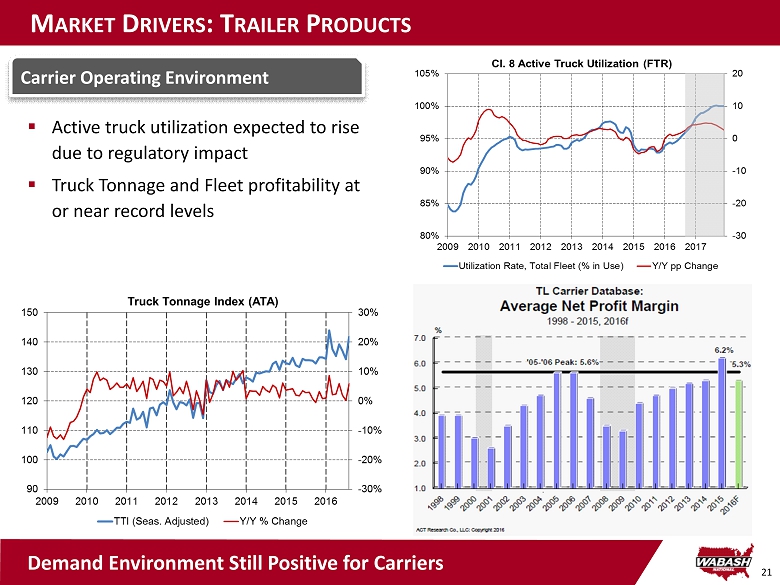
21 M ARKET D RIVERS : T RAILER P RODUCTS ▪ Active truck utilization expected to rise due to regulatory impact ▪ Truck Tonnage and Fleet profitability at or near record levels Carrier Operating Environment Demand Environment Still Positive for Carriers

22 M ARKET D RIVERS : D IVERSIFIED P RODUCTS ▪ Growing milk production supports demand for dairy silos, mixers and food - grade tank trailers ▪ Worldwide pharmaceutical R&D spend to grow 2.0% (CAGR) to $160B in 2020 Strong Dairy & Pharma Environment DPG Markets Forecasting Growth

23 M ARKET D RIVERS : D IVERSIFIED P RODUCTS ▪ Lower cost access to natural gas driving increased domestic chemical industry output; $158B of committed chemical production investment ▪ As the chemical and oil industries have continued to expand, so has production of tank trailers Growing Chemical & Oil Markets Positive Chemical and Oil Tank Marketplace Indicators

WABASH NATIONAL CORPORATION Financial Overview
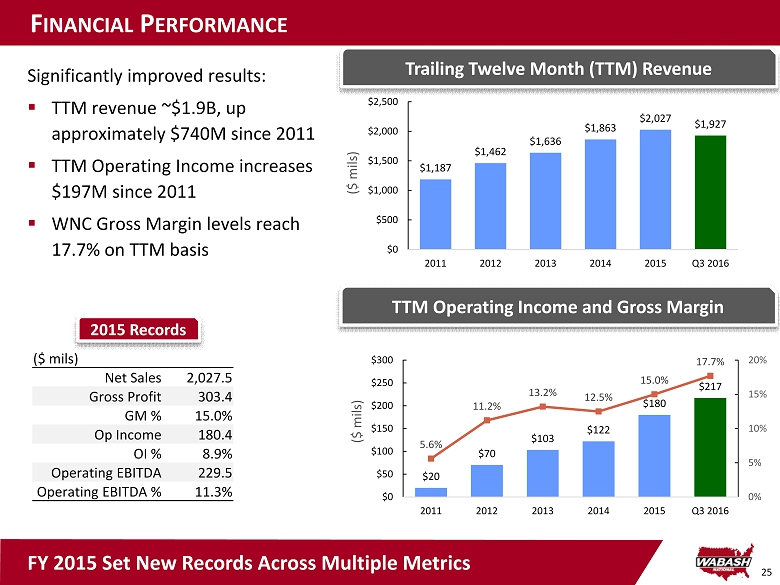
25 F INANCIAL P ERFORMANCE Trailing Twelve Month (TTM) Revenue Significantly improved results : ▪ TTM revenue ~$1.9B , up approximately $740M since 2011 ▪ TTM Operating Income increases $197M since 2011 ▪ WNC Gross Margin levels reach 17.7% on TTM basis TTM Operating Income and Gross Margin $1,187 $1,462 $1,636 $1,863 $2,027 $1,927 $0 $500 $1,000 $1,500 $2,000 $2,500 2011 2012 2013 2014 2015 Q3 2016 ($ mils) $20 $70 $103 $122 $180 $217 5.6% 11.2% 13.2% 12.5% 15.0% 17.7% 0% 5% 10% 15% 20% $0 $50 $100 $150 $200 $250 $300 2011 2012 2013 2014 2015 Q3 2016 ($ mils) 2015 Records ($ mils) Net Sales 2,027.5 Gross Profit 303.4 GM % 15.0% Op Income 180.4 OI % 8.9% Operating EBITDA 229.5 Operating EBITDA % 11.3% FY 2015 Set New Records Across Multiple Metrics
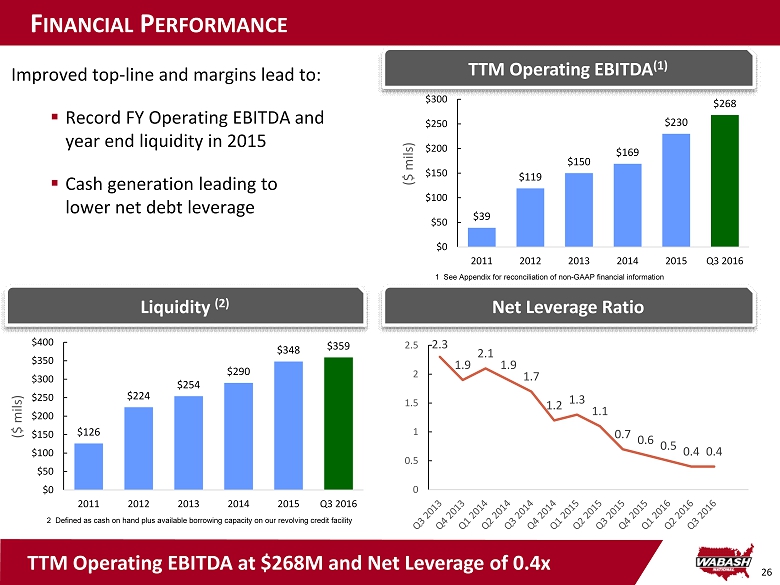
26 $39 $119 $150 $169 $230 $268 $0 $50 $100 $150 $200 $250 $300 2011 2012 2013 2014 2015 Q3 2016 ($ mils) F INANCIAL P ERFORMANCE Net Leverage Ratio Improved top - line and margins lead to: ▪ Record FY Operating EBITDA and year end liquidity in 2015 ▪ Cash generation leading to lower net debt leverage TTM Operating EBITDA (1) Liquidity (2) 2 Defined as cash on hand plus available borrowing capacity on our revolving credit facility 1 See Appendix for reconciliation of non - GAAP financial information $126 $224 $254 $290 $348 $359 $0 $50 $100 $150 $200 $250 $300 $350 $400 2011 2012 2013 2014 2015 Q3 2016 ($ mils) TTM Operating EBITDA at $268M and Net Leverage of 0.4x 2.3 1.9 2.1 1.9 1.7 1.2 1.3 1.1 0.7 0.6 0.5 0.4 0.4 0 0.5 1 1.5 2 2.5
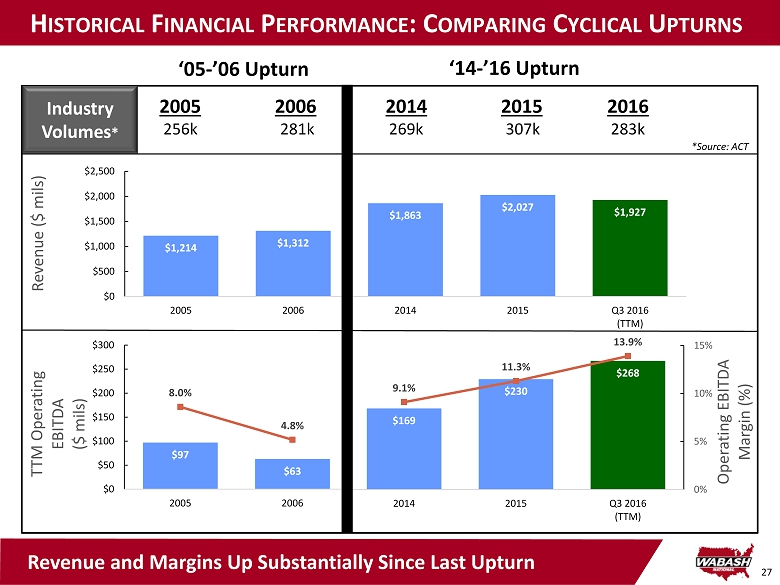
27 H ISTORICAL F INANCIAL P ERFORMANCE : C OMPARING C YCLICAL U PTURNS ‘05 - ’06 Upturn $97 $63 8.0% 4.8% $0 $50 $100 $150 $200 $250 $300 2005 2006 TTM Operating EBITDA ($ mils) Industry Volumes * ‘14 - ’16 Upturn $1,214 $1,312 $1,863 $2,027 $1,927 $0 $500 $1,000 $1,500 $2,000 $2,500 2005 2006 2014 2015 Q3 2016 (TTM) Revenue ($ mils) 2005 2006 2014 2015 2016 256k 281k 269k 307k 283k *Source: ACT Revenue and Margins Up Substantially Since Last Upturn $169 $230 $268 9.1% 11.3% 13.9% 0% 5% 10% 15% 2014 2015 Q3 2016 (TTM) Operating EBITDA Margin (%)

28 H ISTORICAL F INANCIAL P ERFORMANCE : C OMPARING C YCLICAL U PTURNS ‘05 - ’06 Upturn *Source: ACT $312 $386 16.2% 3.7% $0 $100 $200 $300 $400 $500 $600 $700 2005 2006 Invested Capital ($ mils) Industry Volumes * ‘14 - ’16 Upturn 2005 2006 2014 2015 2016 256k 281k 269k 307k 283k $617 $583 $575 12.5% 19.5% 23.7% 0% 5% 10% 15% 20% 25% 2014 2015 Q3 2016 ROIC (%) ROIC = NOPAT/ Invested Capital NOPAT = Operating Income * (1 - tax rate) Invested Capital = Total Assets less Cash l ess Non - interest Bearing Liabilities Corporate Target ROIC > 20% ROIC Up Significantly Since Last Upturn
WABASH NATIONAL CORPORATION Appendix

30 C ONSOLIDATED I NCOME S TATEMENT ($ in thousands, except per share amounts) 2011 2012 2013 2014 2015 YTD Q3 2016 Net sales 1,187,244$ 1,461,854$ 1,635,686$ 1,863,315$ 2,027,489$ 1,383,387$ Cost of sales 1,120,524 1,298,031 1,420,563 1,630,681 1,724,046 1,129,338 Gross profit 66,720$ 163,823$ 215,123$ 232,634$ 303,443$ 254,049$ % of sales 5.6% 11.2% 13.2% 12.5% 15.0% 18.4% General and administrative expenses 30,994 44,751 58,666 61,694 73,495 55,093 % of sales 2.6% 3.1% 3.6% 3.3% 3.6% 4.0% Selling expenses 12,981 23,589 30,597 26,676 27,233 20,421 % of sales 1.1% 1.6% 1.9% 1.4% 1.3% 1.5% Amortization of intangibles 2,955 10,590 21,786 21,878 21,259 14,961 % of sales 0.2% 0.7% 1.3% 1.2% 1.0% 1.1% Other operating expenses - 14,409 883 - 1,087 1,663 % of sales 0.0% 1.0% 0.1% 0.0% 0.1% 0.1% - - - - Income from operations 19,790$ 70,484$ 103,191$ 122,386$ 180,369$ 161,911$ % of sales 1.7% 4.8% 6.3% 6.6% 8.9% 11.7% Other income (expense) Interest expense (4,136) (21,724) (26,308) (22,165) (19,548) (11,938) Other, net (441) (97) 740 (1,759) 2,490 226 Income before income taxes 15,213$ 48,663$ 77,623$ 98,462$ 163,311$ 150,199$ Income tax expense (benefit) 171 (56,968) 31,094 37,532 59,022 53,766 Net income 15,042$ 105,631$ 46,529$ 60,930$ 104,289$ 96,433$ Diluted net income per share 0.22$ 1.53$ 0.67$ 0.85$ 1.50$ 1.45$

31 C ONSOLIDATED B ALANCE S HEET ($ in thousands) 2011 2012 2013 2014 2015 Q3 2016 ASSETS Current assets Cash and cash equivalents 19,976$ 81,449$ 113,262$ 146,113$ 178,853$ 189,641$ Accounts receivable 52,219 96,590 120,358 135,206 152,824 157,941 Inventories 189,533 189,487 184,173 177,144 166,982 195,149 Deferred income taxes - 33,194 21,576 16,993 22,431 - Prepaid expenses and other 2,317 8,239 9,632 10,203 8,417 19,438 Total current assets 264,045$ 408,959$ 449,001$ 485,659$ 529,507$ 562,169$ Property, plant and equipment 96,591 132,146 142,082 142,892 140,438 139,456 Deferred income taxes - 17,454 1,401 - 1,358 23,261 Goodwill - 146,444 149,967 149,603 149,718 148,285 Intangible assets 19,821 171,990 159,181 137,100 114,616 99,487 Other assets 7,593 12,057 10,613 13,397 14,033 19,159 Total assets 388,050$ 889,050$ 912,245$ 928,651$ 949,670$ 991,817$ LIABILITIES & STOCKHOLDERS' EQUITY Current liabilities Current portion of long-term debt -$ 3,381$ 3,245$ 496$ 37,611$ 2,462$ Current portion of capital lease obligations 4,007 1,140 1,609 1,458 806 568 Accounts payable 107,985 87,299 112,151 96,213 79,618 104,549 Other accrued liabilities 59,024 104,873 99,358 88,690 93,042 83,647 Total current liabilities 171,016$ 196,693$ 216,363$ 186,857$ 211,077$ 191,226$ Long-term debt 65,000 416,849 358,890 324,777 274,885 278,027 Capital lease obligations 814 3,781 6,851 5,796 1,875 1,480 Other noncurrent liabilities 4,874 1,935 6,528 18,040 20,525 23,607 Deferrred income taxes - 1,065 1,234 2,349 1,497 543 Stockholders' equity 146,346 268,727 322,379 390,832 439,811 496,934 Total Liabilities and stockholders' equity 388,050$ 889,050$ 912,245$ 928,651$ 949,670$ 991,817$

32 C ONSOLIDATED C ASH F LOWS ($ in thousands) 2011 2012 2013 2014 2015 YTD Q3 2016 Cash flows from operating activities Net income 15,042$ 105,631$ 46,529$ 60,930$ 104,289$ 96,433$ Adjustments to reconcile net income to net cash (used in) provided by operating activities Depreciation 12,636 14,975 16,550 16,951 16,739 12,241 Amortization of intangibles 2,955 10,590 21,786 21,878 21,259 14,961 Net (gain) loss on the sale of assets (9) 203 140 13 (8,299) 40 Loss on debt extinguishment 668 - 1,889 1,042 5,808 487 Deferred income taxes - (55,292) 30,089 16,573 (7,749) (935) Excess tax benefits from stock-based compensation - - - - - (509) Stock-based compensation 3,398 5,149 7,480 7,833 10,010 8,618 Non-cash interest expense - 2,972 4,643 4,840 5,222 2,718 Impairment of goodwill - - - - - 1,663 Impairment of intangibles - - - - 1,087 - Changes in operating assets and liabilities Accounts receivable (14,366) 1,180 (23,691) (14,848) (17,618) (5,117) Inventories (78,683) 41,696 6,260 3,116 10,162 (29,587) Prepaid expenses and other (162) 736 (3,893) (571) 1,786 (11,021) Accounts payable and accrued liabilities 56,968 (48,777) 18,082 (26,787) (12,243) 15,478 Other, net 386 (3,046) 2,805 1,665 1,342 496 Net cash (used in) provided by operating activities (1,167)$ 76,017$ 128,669$ 92,635$ 131,795$ 105,966$ Cash flows from investing activities Capital expenditures (7,264) (14,916) (18,352) (19,957) (20,847) (15,045) Acquisition, net of cash acquired - (364,012) (15,985) - - - Proceeds from the sale of property, plant and equipment 17 607 305 87 13,203 14 Other - (2,500) 2,500 4,113 - 2,268 Net cash used in investing activities (7,247)$ (380,821)$ (31,532)$ (15,757)$ (7,644)$ (12,763)$ Cash flows from financing activities Proceeds from issuance of common stock, net of expenses (155) - - - - - Proceeds from exercise of stock options 538 354 600 1,921 2,012 2,341 Excess tax benefits from stock-based compensation - - - 509 Borrowings under revolving credit facilities 848,705 206,015 1,166 806 1,134 455 Payments under revolving credit facilities (838,705) (271,015) (1,166) (806) (1,134) (455) Principal payments under capital lease obligations (671) (1,629) (1,700) (1,898) (4,201) (633) Principal payments under term loan credit facility - (2,250) (62,827) (42,078) (194,291) (1,446) Principal payments under industrial revenue bond - - (381) (475) (496) (386) Stock repurchase (533) (564) (35) (1,497) (61,757) (40,739) Proceeds from issuance of convertible senior notes - 145,500 - - - - Proceeds from issuance of term loan credit facility, net of issuance costs - 292,500 - - 192,845 - Convertible notes repurchase - - - - (22,936) (42,061) (1,989) (5,134) (981) - (2,587) - - 2,500 - - - - Net cash provided by (used in) financing activities 7,190$ 366,277$ (65,324)$ (44,027)$ (91,411)$ (82,415)$ Net (decrease) increase in cash and cash equivalents (1,224)$ 61,473$ 31,813$ 32,851$ 32,740$ 10,788$ Cash and cash equivalents at beginning of period 21,200 19,976 81,449 113,262 146,113 178,853 Cash and cash equivalents at end of period 19,976$ 81,449$ 113,262$ 146,113$ 178,853$ 189,641$ Debt amendment and issuance costs paid Proceeds from issuance of industrial revenue bond

33 R ECONCILIATION OF N ON - GAAP M EASURES ($ in millions) Note: This table reconciles annual net income for the periods presented to the non - GAAP measure of Operating EBITDA. Differences may exist in the calculation of Operating EBITDA due to rounding. 2005 2006 2011 2012 2013 2014 2015 Q3 2016 TTM Net income 111.1$ 9.4$ 15.0$ 105.6$ 46.5$ 60.9$ 104.3$ 129.7$ Income tax (benefit) expense (37.0) 6.9 0.2 (57.1) 31.1 37.5 59.0 70.3 Interest expense 6.4 6.9 4.1 21.7 26.3 22.2 19.5 16.7 Depreciation and amortization 15.5 20.6 15.6 25.6 38.3 38.8 38.0 36.7 Stock-based compensation 1.5 4.0 3.4 5.2 7.5 7.8 10.0 12.0 Impairment of goodwill - 15.4 - - - - - 1.7 Acquisition expenses - - 17.3 0.9 - - - Impairment of intangibles - - - - - 1.1 1.1 Other non-operating expense (income) (0.5) (0.3) 0.5 0.2 (0.7) 1.8 (2.5) (0.2) Operating EBITDA 97.0$ 62.9$ 38.8$ 118.5$ 149.9$ 169.0$ 229.5$ 268.0$ % of sales 8.0% 4.8% 3.3% 8.1% 9.2% 9.1% 11.3% 13.9%

34 R ECONCILIATION OF N ON - GAAP M EASURES a. Branch Transactions are comprised of the sale of assets for three West Coast Retail branches in 2014 and the Phoenix, Arizona branch in 2016 as well as real estate associated with the three West Coast Retail branches in 2015 $ Per Share $ Per Share $ Per Share $ Per Share $ Per Share Net Income 15,042$ 0.22$ 105,631$ 1.54$ 46,529$ 0.67$ 60,930$ 0.86$ 104,289$ 1.50$ Adjustments: Income tax benefit, net - - (58,991) (0.86) - - - - - - Impact of acquired profit in inventories and short term intangible amortization - - 3,800 0.06 - - - - - - Acquisition expenses - - 14,409 0.21 883 0.01 - - - - Revaluation of net deferred income tax assets due to changes in statutory tax rates - - - - - - 1,041 0.01 - - Branch Transactions a ͣ - - 608 0.01 (8,345) (0.12) Impairment of intangibles - - - - - - - - 1,087 0.02 Loss on debt extinguishment 668 0.01 - - 1,889 0.03 1,042 0.02 5,808 0.08 Tax effect on aforementioned items - - - - (1,111) (0.01) (660) (0.01) 553 0.01 Adjusted earnings 15,710$ 0.23$ 64,849$ 0.95$ 48,190$ 0.70$ 62,961$ 0.89$ 103,392$ 1.49$ Twelve Months Ended December 31, 2014 20152011 2012 2013 2016 Full Year Earnings Guidance b : Low Estimate High Estimate Estimated Full-Year Net Income per Diluted Share 1.80 1.85 Adjustments: Loss on debt extinguishment 0.01 0.01 Impairment of goodwill 0.03 0.03 Branch Transactions (0.01) (0.01) Tax effect on aforementioned items (0.01) (0.01) Estimated Full-Year Adjusted Earnings per Diluted Share 1.81$ 1.86$ Range b. Forward - looking estimates of net income per diluted share does not reflect certain future charges and/or credits that are inherently difficul t t o predict and estimate due to their uncertainty in timing and amount. This would include but not be limited to losses incurred for extinguishment of debt, sale or impairment of Company assets, gains o r l osses on transition of branch activities as well as other unknown items at the time of this release . Differences may exist in the calculation of adjusted earnings per share due to rounding. Note: This table reconciles annual net income for the periods presented to the non - GAAP measure of adjusted earnings and adjust ed earnings per share. Differences may exist in the calculation of adjusted earnings per share due to rounding.

35 P OTENTIAL D ILUTIVE I MPACT OF S ENIOR C ONVERTIBLE N OTES (UNAUDITED) Table below illustrates the potential dilutive shares that would be included in the calculation of the Company’s reported earnings per share in a future period assuming various hypothetical quarterly average market prices for the Company’s stock (NYSE: WNC). The table should only be considered for illustrative purposes and does not represent the Company’s estimates for future stock performances. Notes: 1. The share prices listed in this table are for illustrative purposes only. Dilution will continue beyond $24.00 per share. 2. This represents the number of shares to be used for calculating diluted earnings per share in accordance with generally accepted accounting principals. Background Information: ▪ In April 2012, the Company issued Convertible Senior Notes due 2018 with a principal amount of $150 million principal and bear interest at a rate of 3.375% annually ▪ As of the end of the Q3 2016, there is approximately $96 million principal outstanding ▪ Initial conversion rate of 85.4372 shares of common stock per $1,000 in principal amount which is equal to a conversion price of approximately $11.70 per share ▪ The Senior Notes will have a dilutive effect on earnings per share to extent average quarterly share price exceeds the conversion price ▪ The Company’s intent is to settle conversions through a net share settlement which involves repayment of cash for the principal amount and delivery of shares of common stock for any excess of conversion value over principal amount Hypothetical Quarterly Potential Incremental Average Share Price Shares for Diluted EPS (NYSE: WNC) (1) (in 000s shares) (2) 12.00$ 202 12.50$ 521 13.00$ 816 13.50$ 1,089 14.00$ 1,343 14.50$ 1,579 15.00$ 1,799 15.50$ 2,005 16.00$ 2,198 16.50$ 2,380 17.00$ 2,551 17.50$ 2,712 18.00$ 2,864 18.50$ 3,008 19.00$ 3,144 19.50$ 3,273 20.00$ 3,396 20.50$ 3,513 21.00$ 3,624 21.50$ 3,730 22.00$ 3,832 22.50$ 3,929 23.00$ 4,021 23.50$ 4,110 24.00$ 4,195
Serious News for Serious Traders! Try StreetInsider.com Premium Free!
You May Also Be Interested In
- Generational Group Advises S&L Computer Services in its Sale to Cyber Advisors
- Parkland Group Announces Masterpiece Sculpture “Sacred Heart” by Jeff Koons Finds Permanent Home at Guangzhou One Pengrui
- CONCEPT MEDICAL ANNOUNCES ENROLLMENT OF FIRST PATIENT IN "MAGICAL-ISR" IDE STUDY IN THE US
Create E-mail Alert Related Categories
SEC FilingsSign up for StreetInsider Free!
Receive full access to all new and archived articles, unlimited portfolio tracking, e-mail alerts, custom newswires and RSS feeds - and more!
