

Form 8-K VISA INC. For: Jan 28
 Tweet
Tweet Share
ShareUNITED STATES
SECURITIES AND EXCHANGE COMMISSION
WASHINGTON, D.C. 20549
FORM 8-K
CURRENT REPORT
Pursuant to Section 13 or 15(d) of the Securities Exchange Act of 1934
Date of Report (Date of earliest event reported): January 28, 2016
VISA INC.
(Exact name of Registrant as Specified in Its Charter)
| Delaware | 001-33977 | 26-0267673 | ||
| (State or Other Jurisdiction of Incorporation) |
(Commission File Number) |
(IRS Employer Identification No.) |
| P.O. Box 8999 San Francisco, California |
94128-8999 | |
| (Address of Principal Executive Offices) | (Zip Code) |
Registrant’s Telephone Number, Including Area Code: (650) 432-3200
N/A
(Former Name or Former Address, if Changed Since Last Report)
Check the appropriate box below if the Form 8-K filing is intended to simultaneously satisfy the filing obligation of the registrant under any of the following provisions (see General Instructions A.2. below):
| ¨ | Written communications pursuant to Rule 425 under the Securities Act (17 CFR 230.425) |
| ¨ | Soliciting material pursuant to Rule 14a-12 under the Exchange Act (17 CFR 240.14a-12) |
| ¨ | Pre-commencement communications pursuant to Rule 14d-2(b) under the Exchange Act (17 CFR 240.14d-2(b)) |
| ¨ | Pre-commencement communications pursuant to Rule 13e-4(c) under the Exchange Act (17 CFR 240.13e-4(c)) |
| Item 2.02 | Results of Operations and Financial Condition. |
On January 28, 2016, Visa Inc. (the “Company”) issued a press release announcing financial results for the Company’s fiscal first quarter, ended December 31, 2015.
A copy of the press release is attached hereto as Exhibit 99.1. All information in the press release is furnished but not filed.
On January 28, 2016, the Company will host a conference call to discuss financial results for its fiscal first quarter ended December 31, 2015.
A copy of the presentation to be used during the conference call is attached hereto as Exhibit 99.2. All information in the presentation is furnished but not filed.
| Item 9.01 | Financial Statements and Exhibits. |
| (d) | Exhibits |
| 99.1 | Press Release of Visa Inc., dated January 28, 2016 | |
| 99.2 | Presentation of Visa Inc., dated January 28, 2016 | |
SIGNATURES
Pursuant to the requirements of the Securities Exchange Act of 1934, the registrant has duly caused this report to be signed on its behalf by the undersigned hereunto duly authorized.
| VISA INC. | ||||||
| Date: January 28, 2016 |
By: | /s/ Vasant M. Prabhu | ||||
| Vasant M. Prabhu Chief Financial Officer | ||||||
EXHIBIT INDEX
| Exhibit |
Description | |
| 99.1 | Press Release of Visa Inc., dated January 28, 2016 | |
| 99.2 | Presentation of Visa Inc., dated January 28, 2016 |
Exhibit 99.1

Visa Inc. Reports Fiscal First Quarter 2016 Results
| • | GAAP quarterly net income of $1.9 billion or $0.80 per share including non-cash, non-operating income related to the revaluation of the Visa Europe put option |
| • | Adjusted quarterly net income of $1.7 billion or $0.69 per share excluding the revaluation of the Visa Europe put option |
San Francisco, CA, January 28, 2016 – Visa Inc. (NYSE: V) today announced financial results for the Company’s fiscal first quarter 2016. GAAP net income for the quarter, inclusive of non-cash, non-operating income related to an adjustment in the Company’s fair value of its Visa Europe put option, was $1.9 billion, or $0.80 per share. All references to earnings per share assume fully-diluted class A share count unless otherwise noted.
Excluding the $255 million non-cash, non-operating income recorded upon remeasurement of the Visa Europe put option, adjusted net income for the quarter was $1.7 billion, an increase of 7% over the prior year, or $0.69 per share, an increase of 10% over the prior year. The change in the fair value of the Visa Europe put option was triggered by the amendment of the put option in connection with the Visa Europe Transaction Agreement. The Company’s adjusted quarterly net income, effective income tax rate and earnings per share are non-GAAP financial measures that are reconciled to their most directly comparable GAAP measure in the accompanying financial tables.
Net operating revenue in the fiscal first quarter of 2016 was $3.6 billion, an increase of 5% nominally or 8% on a constant dollar basis over the prior year, driven by growth in service revenues, data processing revenues and international transaction revenues. Currency rate shifts versus the prior year negatively impacted reported net operating revenue growth by approximately 3 percentage points.
“We continue to be pleased with our financial performance given the uneven global economy and the ongoing negative effects of the strong U.S. dollar. While we continue to see relatively strong payments volume growth, these factors have meaningfully reduced our cross-border volume and revenue growth. While these headwinds do not appear to be abating in the short-term as we had hoped, the fundamentals of our business remain strong and our long-term growth trajectory remains intact as we navigate through this uncertain environment,” said Charlie Scharf, Chief Executive Officer of Visa Inc.
1
Fiscal First Quarter 2016 Financial Highlights:
Payments volume growth, on a constant dollar basis, for the three months ended September 30, 2015, on which fiscal first quarter service revenue is recognized, was 12% over the prior year at $1.3 trillion.
Payments volume growth, on a constant dollar basis, for the three months ended December 31, 2015, was 11% over the prior year at $1.3 trillion.
Cross-border volume growth, on a constant dollar basis, was 4% for the three months ended December 31, 2015.
Total processed transactions, which represent transactions processed by VisaNet, for the three months ended December 31, 2015, were 19.0 billion, an 8% increase over the prior year.
Fiscal first quarter 2016 service revenues were $1.6 billion, an increase of 7% over the prior year, and are recognized based on payments volume in the prior quarter. All other revenue categories are recognized based on current quarter activity. Data processing revenues rose 7% over the prior year to $1.5 billion. International transaction revenues grew 6% over the prior year to $1.0 billion. Other revenues were $198 million, a decrease of 3% over the prior year. Client incentives, which are a contra revenue item, were $788 million and represent 18.1% of gross revenues.
Total operating expenses were $1.2 billion for the quarter, a 2% increase over the prior year, as the Company took the necessary steps to prioritize cost controls given an increasingly challenging macro-economic environment.
The Company recognized interest expense of $24 million for the quarter ended December 31, 2015 as a result of the issuance of approximately $16.0 billion of fixed-rate senior notes.
2
For the quarter ended December 31, 2015, the GAAP effective tax rate was 26.4% and the adjusted effective tax rate was 29.3%.
Cash, cash equivalents, and available-for-sale investment securities were $24.8 billion at December 31, 2015.
The weighted-average number of diluted shares of class A common stock outstanding was 2.4 billion for the quarter ended December 31, 2015.
Notable Events:
On December 14, 2015, the Company issued fixed-rate senior notes in an aggregate principal amount of $16.0 billion with maturities ranging between 2 and 30 years, and interest rates from 1.20% to 4.30%. The weighted average interest rate is 3.08% and the weighted average maturity of the notes is 13 years. Among other things, the proceeds will be used to fund the up-front cash consideration of the purchase price for the planned acquisition of Visa Europe Limited.
During the three months ended December 31, 2015, the Company repurchased 25.7 million shares of class A common stock, at an average price of $78.52 per share, using $2.0 billion of cash on hand. The Company has $5.8 billion of remaining funds, authorized by the board of directors, available for share repurchase under the current programs as of December 31, 2015.
Financial Outlook for Fiscal Full-Year 2016:
While the Company is not changing its financial outlook for the fiscal full-year, continued moderating cross-border volume growth and subdued domestic activity across our geographies could ultimately affect our results. Current guidance is outlined below:
| • | Annual net revenue growth: High single-digit to low double-digit range on a constant dollar basis, with an expectation of about three percentage points of negative foreign currency impact; |
| • | Client incentives as a percent of gross revenues: 17.5% to 18.5% range; |
| • | Annual operating margin: Mid 60s; |
| • | Adjusted effective tax rate: Low 30s; |
3
| • | Annual adjusted diluted class A common stock earnings per share growth: Low-end of the mid-teens range on a constant dollar basis, with an expectation of about four percentage points of negative foreign currency impact; and |
| • | Annual free cash flow: About $7 billion. |
Note: The financial outlook for fiscal full-year 2016 does not include any impact from the Visa Europe transaction, including interest expense from the $16.0 billion issuance of fixed-rate senior notes of about $125 million per quarter.
Fiscal First Quarter 2016 Earnings Results Conference Call Details: Visa’s executive management team will host a live audio webcast beginning at 5:00 p.m. Eastern Time (2:00 p.m. Pacific Time) today to discuss the financial results and business highlights. All interested parties are invited to listen to the live webcast at http://investor.visa.com. A replay of the webcast will be available on the Visa Investor Relations website for 30 days. Investor information, including supplemental financial information, is available on Visa Inc.’s Investor Relations website at http://investor.visa.com.
About Visa
Visa Inc. (NYSE: V) is a global payments technology company that connects consumers, businesses, financial institutions, and governments in more than 200 countries and territories to fast, secure and reliable electronic payments. We operate one of the world’s most advanced processing networks —VisaNet — that is capable of handling more than 65,000 transaction messages a second, with fraud protection for consumers and assured payment for merchants. Visa is not a bank and does not issue cards, extend credit or set rates and fees for consumers. Visa’s innovations, however, enable its financial institution customers to offer consumers more choices: pay now with debit, pay ahead of time with prepaid or pay later with credit products. For more information, visit usa.visa.com/about-visa, visacorporate.tumblr.com and @VisaNews.
Forward-Looking Statements:
This Press Release contains forward-looking statements within the meaning of the U.S. Private Securities Litigation Reform Act of 1995. Forward-looking statements generally are identified by words such as “estimates,” “expectation,” “outlook”, “may,” “projects,” “could,” “should,” “will,” “will continue” and other similar expressions. Examples of forward-looking statements include, but are not limited to, statements we make about our revenue, client incentives, operating margin, tax rate, earnings per share, free cash flow, and the growth of those items.
By their nature, forward-looking statements: (i) speak only as of the date they are made; (ii) are not statements of historical fact or guarantees of future performance; and (iii) are subject to risks, uncertainties, assumptions or changes in circumstances that are difficult to predict or quantify.
4
Therefore, actual results could differ materially and adversely from our forward-looking statements due to a variety of factors, including the following:
| • | the impact of laws, regulations and marketplace barriers, including: |
| • | increased regulation of fees, transaction routing, payment card practices or other aspects of the payments industry in the United States, including new or revised regulations issued under the Dodd-Frank Wall Street Reform and Consumer Protection Act; |
| • | increased regulation in jurisdictions outside of the United States; |
| • | increased government support of national payment networks outside the United States; and |
| • | increased regulation of consumer privacy, data use and security; |
| • | developments in litigation and government enforcement, including those affecting interchange reimbursement fees, antitrust and tax; |
| • | new lawsuits, investigations or proceedings, or changes to our potential exposure in connection with pending lawsuits, investigations or proceedings; |
| • | economic factors, such as: |
| • | economic fragility in the Eurozone, the United States and in other advanced and emerging markets; |
| • | general economic, political and social conditions in mature and emerging markets globally; |
| • | general stock market fluctuations which may impact consumer spending; |
| • | material changes in cross-border activity, foreign exchange controls and fluctuations in currency exchange rates; and |
| • | material changes in our financial institution clients’ performance compared to our estimates; |
| • | industry developments, such as competitive pressure, rapid technological developments and disintermediation from our payments network; |
| • | system developments, such as: |
| • | disruption of our transaction processing systems or the inability to process transactions efficiently; |
| • | account data breaches or increased fraudulent or other illegal activities involving Visa-branded cards or payment products; and |
| • | failure to maintain systems interoperability with Visa Europe; |
| • | the transaction with Visa Europe may not be consummated on the terms currently contemplated or at all; |
| • | Visa Europe’s business may not be successfully integrated with our business or we may not achieve the anticipated benefits of the transaction; |
| • | the costs and risks associated with the transaction with Visa Europe; |
| • | matters arising in connection with Visa Europe’s or our efforts to comply with and satisfy applicable regulatory approvals and closing conditions relating to the transaction; |
| • | the loss of organizational effectiveness or key employees; |
| • | the failure to integrate acquisitions successfully or to effectively develop new products and businesses; |
| • | natural disasters, terrorist attacks, military or political conflicts, and public health emergencies; and |
| • | various other factors, including those more fully described in our filings with the U.S. Securities and Exchange Commission, including our Annual Report on Form 10-K for the year ended September 30, 2015, and our subsequent reports on Forms 10-Q and 8-K. |
5
You should not place undue reliance on such statements. Except as required by law, we do not intend to update or revise any forward–looking statements as a result of new information, future developments or otherwise.
Contacts:
Investor Relations: Jack Carsky or Victoria Hyde-Dunn, 650-432-7644, [email protected]
Media Relations: Connie Kim, 212-521-3962, [email protected]
6
VISA INC.
CONSOLIDATED BALANCE SHEETS
(UNAUDITED)
| December 31, 2015 |
September 30, 2015 |
|||||||
| (in millions, except par value data) | ||||||||
| Assets |
||||||||
| Cash and cash equivalents |
$ | 12,837 | $ | 3,518 | ||||
| Restricted cash—litigation escrow |
1,061 | 1,072 | ||||||
| Investment securities: |
||||||||
| Trading |
80 | 66 | ||||||
| Available-for-sale |
8,428 | 2,431 | ||||||
| Settlement receivable |
443 | 408 | ||||||
| Accounts receivable |
922 | 847 | ||||||
| Customer collateral |
1,041 | 1,023 | ||||||
| Current portion of client incentives |
414 | 303 | ||||||
| Prepaid expenses and other current assets |
247 | 353 | ||||||
|
|
|
|
|
|||||
| Total current assets |
25,473 | 10,021 | ||||||
| Investment securities, available-for-sale |
3,487 | 3,384 | ||||||
| Client incentives |
128 | 110 | ||||||
| Property, equipment and technology, net |
1,884 | 1,888 | ||||||
| Other assets |
832 | 778 | ||||||
| Intangible assets, net |
11,348 | 11,361 | ||||||
| Goodwill |
11,825 | 11,825 | ||||||
|
|
|
|
|
|||||
| Total assets |
$ | 54,977 | $ | 39,367 | ||||
|
|
|
|
|
|||||
| Liabilities |
||||||||
| Accounts payable |
$ | 118 | $ | 127 | ||||
| Settlement payable |
744 | 780 | ||||||
| Customer collateral |
1,041 | 1,023 | ||||||
| Accrued compensation and benefits |
317 | 503 | ||||||
| Client incentives |
1,116 | 1,049 | ||||||
| Accrued liabilities |
1,009 | 849 | ||||||
| Accrued litigation |
1,012 | 1,024 | ||||||
|
|
|
|
|
|||||
| Total current liabilities |
5,357 | 5,355 | ||||||
| Long-term debt |
15,877 | — | ||||||
| Deferred tax liabilities |
3,344 | 3,273 | ||||||
| Other liabilities |
923 | 897 | ||||||
|
|
|
|
|
|||||
| Total liabilities |
25,501 | 9,525 | ||||||
|
|
|
|
|
|||||
| Equity |
||||||||
| Preferred stock, $0.0001 par value, 25 shares authorized and none issued |
— | — | ||||||
| Class A common stock, $0.0001 par value, 2,001,622 shares authorized, 1,926 and 1,950 shares issued and outstanding at December 31, 2015 and September 30, 2015, respectively |
— | — | ||||||
| Class B common stock, $0.0001 par value, 622 shares authorized, 245 shares issued and outstanding at December 31, 2015 and September 30, 2015 |
— | — | ||||||
| Class C common stock, $0.0001 par value, 1,097 shares authorized, 19 and 20 shares issued and outstanding at December 31, 2015 and September 30, 2015, respectively |
— | — | ||||||
| Additional paid-in capital |
17,824 | 18,073 | ||||||
| Accumulated income |
11,701 | 11,843 | ||||||
| Accumulated other comprehensive loss, net: |
||||||||
| Investment securities, available-for-sale |
23 | 5 | ||||||
| Defined benefit pension and other postretirement plans |
(131 | ) | (161 | ) | ||||
| Derivative instruments classified as cash flow hedges |
60 | 83 | ||||||
| Foreign currency translation adjustments |
(1 | ) | (1 | ) | ||||
|
|
|
|
|
|||||
| Total accumulated other comprehensive loss, net |
(49 | ) | (74 | ) | ||||
|
|
|
|
|
|||||
| Total equity |
29,476 | 29,842 | ||||||
|
|
|
|
|
|||||
| Total liabilities and equity |
$ | 54,977 | $ | 39,367 | ||||
|
|
|
|
|
|||||
VISA INC.
CONSOLIDATED STATEMENTS OF OPERATIONS
(UNAUDITED)
| Three Months Ended December 31, |
||||||||
| 2015 | 2014 | |||||||
| (in millions, except per share data) | ||||||||
| Operating Revenues |
||||||||
| Service revenues |
$ | 1,645 | $ | 1,538 | ||||
| Data processing revenues |
1,479 | 1,383 | ||||||
| International transaction revenues |
1,031 | 970 | ||||||
| Other revenues |
198 | 204 | ||||||
| Client incentives |
(788 | ) | (713 | ) | ||||
|
|
|
|
|
|||||
| Total operating revenues |
3,565 | 3,382 | ||||||
|
|
|
|
|
|||||
| Operating Expenses |
||||||||
| Personnel |
499 | 509 | ||||||
| Marketing |
194 | 205 | ||||||
| Network and processing |
128 | 114 | ||||||
| Professional fees |
72 | 70 | ||||||
| Depreciation and amortization |
120 | 120 | ||||||
| General and administrative |
156 | 126 | ||||||
|
|
|
|
|
|||||
| Total operating expenses |
1,169 | 1,144 | ||||||
|
|
|
|
|
|||||
| Operating income |
2,396 | 2,238 | ||||||
| Non-operating Income |
||||||||
| Interest expense |
(29 | ) | (3 | ) | ||||
| Other |
272 | 27 | ||||||
|
|
|
|
|
|||||
| Total non-operating income |
243 | 24 | ||||||
|
|
|
|
|
|||||
| Income before income taxes |
2,639 | 2,262 | ||||||
| Income tax provision |
698 | 693 | ||||||
|
|
|
|
|
|||||
| Net income |
$ | 1,941 | $ | 1,569 | ||||
|
|
|
|
|
|||||
| Basic earnings per share |
||||||||
| Class A common stock |
$ | 0.80 | $ | 0.63 | ||||
|
|
|
|
|
|||||
| Class B common stock |
$ | 1.32 | $ | 1.05 | ||||
|
|
|
|
|
|||||
| Class C common stock |
$ | 3.20 | $ | 2.54 | ||||
|
|
|
|
|
|||||
| Basic weighted-average shares outstanding |
||||||||
| Class A common stock |
1,937 | 1,974 | ||||||
|
|
|
|
|
|||||
| Class B common stock |
245 | 245 | ||||||
|
|
|
|
|
|||||
| Class C common stock |
20 | 22 | ||||||
|
|
|
|
|
|||||
| Diluted earnings per share |
||||||||
| Class A common stock |
$ | 0.80 | $ | 0.63 | ||||
|
|
|
|
|
|||||
| Class B common stock |
$ | 1.32 | $ | 1.04 | ||||
|
|
|
|
|
|||||
| Class C common stock |
$ | 3.20 | $ | 2.53 | ||||
|
|
|
|
|
|||||
| Diluted weighted-average shares outstanding |
||||||||
| Class A common stock |
2,430 | 2,478 | ||||||
|
|
|
|
|
|||||
| Class B common stock |
245 | 245 | ||||||
|
|
|
|
|
|||||
| Class C common stock |
20 | 22 | ||||||
|
|
|
|
|
|||||
VISA INC.
CONSOLIDATED STATEMENTS OF CASH FLOWS
(UNAUDITED)
| Three Months Ended December 31, |
||||||||
| 2015 | 2014 | |||||||
| (in millions) | ||||||||
| Operating Activities |
||||||||
| Net income |
$ | 1,941 | $ | 1,569 | ||||
| Adjustments to reconcile net income to net cash provided by operating activities: |
||||||||
| Amortization of client incentives |
788 | 713 | ||||||
| Fair value adjustment for the Visa Europe put option |
(255 | ) | — | |||||
| Share-based compensation |
39 | 45 | ||||||
| Excess tax benefit for share-based compensation |
(36 | ) | (58 | ) | ||||
| Depreciation and amortization of property, equipment, technology and intangible assets |
120 | 120 | ||||||
| Deferred income taxes |
45 | 97 | ||||||
| Other |
5 | (19 | ) | |||||
| Change in operating assets and liabilities: |
||||||||
| Settlement receivable |
(35 | ) | 286 | |||||
| Accounts receivable |
(75 | ) | (78 | ) | ||||
| Client incentives |
(850 | ) | (687 | ) | ||||
| Other assets |
23 | (141 | ) | |||||
| Accounts payable |
— | 10 | ||||||
| Settlement payable |
(36 | ) | (477 | ) | ||||
| Accrued and other liabilities |
317 | 484 | ||||||
| Accrued litigation |
(12 | ) | (103 | ) | ||||
|
|
|
|
|
|||||
| Net cash provided by operating activities |
1,979 | 1,761 | ||||||
|
|
|
|
|
|||||
| Investing Activities |
||||||||
| Purchases of property, equipment, technology and intangible assets |
(126 | ) | (104 | ) | ||||
| Investment securities, available-for-sale: |
||||||||
| Purchases |
(6,803 | ) | (758 | ) | ||||
| Proceeds from maturities and sales |
739 | 226 | ||||||
| Purchases of / contributions to other investments |
(8 | ) | — | |||||
| Proceeds / distributions from other investments |
4 | — | ||||||
|
|
|
|
|
|||||
| Net cash used in investing activities |
(6,194 | ) | (636 | ) | ||||
|
|
|
|
|
|||||
| Financing Activities |
||||||||
| Repurchase of class A common stock |
(2,015 | ) | (803 | ) | ||||
| Dividends paid |
(340 | ) | (297 | ) | ||||
| Proceeds from issuance of senior notes |
15,971 | — | ||||||
| Debt issuance costs |
(77 | ) | — | |||||
| Payments from litigation escrow account—U.S. retrospective responsibility plan |
11 | 100 | ||||||
| Cash proceeds from issuance of common stock under employee equity plans |
29 | 30 | ||||||
| Restricted stock and performance-based shares settled in cash for taxes |
(81 | ) | (100 | ) | ||||
| Excess tax benefit for share-based compensation |
36 | 58 | ||||||
|
|
|
|
|
|||||
| Net cash provided by (used in) financing activities |
13,534 | (1,012 | ) | |||||
|
|
|
|
|
|||||
| Effect of exchange rate changes on cash and cash equivalents |
— | 1 | ||||||
|
|
|
|
|
|||||
| Increase in cash and cash equivalents |
9,319 | 114 | ||||||
| Cash and cash equivalents at beginning of year |
3,518 | 1,971 | ||||||
|
|
|
|
|
|||||
| Cash and cash equivalents at end of period |
$ | 12,837 | $ | 2,085 | ||||
|
|
|
|
|
|||||
| Supplemental Disclosure |
||||||||
| Income taxes paid, net of refunds |
$ | 79 | $ | 57 | ||||
| Accruals related to purchases of property, equipment, technology and intangible assets |
$ | 40 | $ | 21 | ||||
VISA INC.
FISCAL 2016 AND 2015 QUARTERLY RESULTS OF OPERATIONS
(UNAUDITED)
| Fiscal 2016 Quarter Ended |
Fiscal 2015 Quarter Ended | |||||||||||||||||||
| December 31, 2015 |
September 30, 2015 |
June 30, 2015 |
March 31, 2015 |
December 31, 2014 |
||||||||||||||||
| (in millions) | ||||||||||||||||||||
| Operating Revenues |
||||||||||||||||||||
| Service revenues |
$ | 1,645 | $ | 1,637 | $ | 1,550 | $ | 1,577 | $ | 1,538 | ||||||||||
| Data processing revenues |
1,479 | 1,429 | 1,400 | 1,340 | 1,383 | |||||||||||||||
| International transaction revenues |
1,031 | 1,091 | 1,039 | 964 | 970 | |||||||||||||||
| Other revenues |
198 | 216 | 199 | 204 | 204 | |||||||||||||||
| Client incentives |
(788 | ) | (802 | ) | (670 | ) | (676 | ) | (713 | ) | ||||||||||
|
|
|
|
|
|
|
|
|
|
|
|||||||||||
| Total operating revenues |
3,565 | 3,571 | 3,518 | 3,409 | 3,382 | |||||||||||||||
|
|
|
|
|
|
|
|
|
|
|
|||||||||||
| Operating Expenses |
||||||||||||||||||||
| Personnel |
499 | 521 | 566 | 483 | 509 | |||||||||||||||
| Marketing |
194 | 253 | 224 | 190 | 205 | |||||||||||||||
| Network and processing |
128 | 134 | 117 | 109 | 114 | |||||||||||||||
| Professional fees |
72 | 107 | 82 | 77 | 70 | |||||||||||||||
| Depreciation and amortization |
120 | 119 | 130 | 125 | 120 | |||||||||||||||
| General and administrative |
156 | 143 | 137 | 141 | 126 | |||||||||||||||
| Litigation provision |
— | 11 | — | 3 | — | |||||||||||||||
|
|
|
|
|
|
|
|
|
|
|
|||||||||||
| Total operating expenses |
1,169 | 1,288 | 1,256 | 1,128 | 1,144 | |||||||||||||||
|
|
|
|
|
|
|
|
|
|
|
|||||||||||
| Operating income |
2,396 | 2,283 | 2,262 | 2,281 | 2,238 | |||||||||||||||
| Non-operating Income (Expense) |
||||||||||||||||||||
| Interest expense |
(29 | ) | — | 8 | (7 | ) | (3 | ) | ||||||||||||
| Other |
272 | — | (102 | ) | 8 | 27 | ||||||||||||||
|
|
|
|
|
|
|
|
|
|
|
|||||||||||
| Total non-operating income (expense) |
243 | — | (94 | ) | 1 | 24 | ||||||||||||||
|
|
|
|
|
|
|
|
|
|
|
|||||||||||
| Income before income taxes |
2,639 | 2,283 | 2,168 | 2,282 | 2,262 | |||||||||||||||
| Income tax provision |
698 | 771 | 471 | 732 | 693 | |||||||||||||||
|
|
|
|
|
|
|
|
|
|
|
|||||||||||
| Net income |
$ | 1,941 | $ | 1,512 | $ | 1,697 | $ | 1,550 | $ | 1,569 | ||||||||||
|
|
|
|
|
|
|
|
|
|
|
|||||||||||
VISA INC.
RECONCILIATION OF NON-GAAP FINANCIAL RESULTS
(UNAUDITED)
During the first quarter of fiscal 2016, we recorded a decrease of $255 million in the fair value of the Visa Europe put option, resulting in the recognition of non-cash, non-operating income that we do not believe is indicative of our operating performance. As such, we believe the presentation of adjusted financial results provides a clearer understanding of our operating performance for the current period presented. This amount is not subject to income tax and therefore has no impact on our reported income tax provision. There was no comparable adjustment recorded for the three months ended December 31, 2014. Adjusted net income, effective income tax rate and diluted earnings per share are non-GAAP financial measures and should not be relied upon as substitutes for measures calculated in accordance with U.S. GAAP. The following table reconciles our as-reported net income, effective income tax rate and diluted earnings per share, which are calculated in accordance with U.S. GAAP, to our respective non-GAAP adjusted financial measures for the three months ended December 31, 2015:
| Three Months Ended December 31, 2015 | ||||||||||||
| Net Income | Effective Income Tax Rate(1) |
Diluted Earnings per Share(1) |
||||||||||
| (in millions, except percentages and per share data) | ||||||||||||
| As reported |
$ | 1,941 | 26% | $ | 0.80 | |||||||
| Revaluation of Visa Europe put option |
(255 | ) | 3% | (0.10 | ) | |||||||
|
|
|
|
|
|
|
|||||||
| As adjusted |
$ | 1,686 | 29% | $ | 0.69 | |||||||
|
|
|
|
|
|
|
|||||||
| Diluted weighted-average shares outstanding, as reported |
2,430 | |||||||||||
| (1) | Figures in the table may not recalculate exactly due to rounding. Effective income tax rate and diluted earnings per share figures are calculated based on unrounded numbers. |

Operational Performance Data
The tables below provide information regarding the available operational results for the 3 months ended December 31, 2015, as well as the prior four quarterly reporting periods and the 12 months ended December 31, 2015 and 2014, for cards carrying the Visa, Visa Electron and Interlink brands.
1. Branded Volume and Transactions
The tables present regional total volume, payments volume, and cash volume, and the number of payments transactions, cash transactions, accounts and cards for cards carrying the Visa, Visa Electron and Interlink brands. Card counts include PLUS proprietary cards. Nominal and constant dollar growth rates over prior years are provided for volume-based data.
| For the 3 Months Ended December 31, 2015 | ||||||||||||||||||||||||||||||||||||||||||||||
| Total Volume ($ billions) |
Growth (Nominal USD) |
Growth (Constant USD) |
Payments Volume ($ billions) |
Growth (Nominal USD) |
Growth (Constant USD) |
Payments Transactions (millions) |
Cash Volume ($ billions) |
Growth (Nominal USD) |
Growth (Constant USD) |
Cash |
||||||||||||||||||||||||||||||||||||
| All Visa Credit & Debit |
||||||||||||||||||||||||||||||||||||||||||||||
| Asia Pacific |
$ | 526 | 3.0% | 10.9% | $ | 387 | 7.9% | 15.7% | 4,894 | $ | 139 | -8.5% | -0.5% | 1,039 | ||||||||||||||||||||||||||||||||
| Canada |
59 | -10.8% | 4.9% | 55 | -11.1% | 4.6% | 720 | 5 | -6.8% | 9.7% | 11 | |||||||||||||||||||||||||||||||||||
| CEMEA |
227 | -13.8% | 4.8% | 60 | -7.0% | 11.5% | 2,097 | 167 | -16.0% | 2.7% | 1,234 | |||||||||||||||||||||||||||||||||||
| LAC |
237 | -17.1% | 10.3% | 89 | -17.6% | 14.2% | 2,912 | 147 | -16.7% | 8.1% | 1,173 | |||||||||||||||||||||||||||||||||||
| US |
841 | 8.9% | 8.9% | 713 | 9.5% | 9.5% | 14,033 | 128 | 5.5% | 5.5% | 934 | |||||||||||||||||||||||||||||||||||
|
|
|
|
|
|
|
|
|
|
||||||||||||||||||||||||||||||||||||||
| Visa Inc. |
1,890 | -0.4% | 9.0% | 1,305 | 4.8% | 11.5% | 24,656 | 586 | -10.4% | 3.9% | 4,392 | |||||||||||||||||||||||||||||||||||
| Visa Credit Programs |
||||||||||||||||||||||||||||||||||||||||||||||
| US |
$ | 372 | 9.2% | 9.2% | $ | 358 | 9.2% | 9.2% | 4,393 | $ | 14 | 7.9% | 7.9% | 17 | ||||||||||||||||||||||||||||||||
| International |
504 | -1.3% | 12.1% | 470 | 0.5% | 13.5% | 6,490 | 34 | -20.3% | -3.9% | 164 | |||||||||||||||||||||||||||||||||||
|
|
|
|
|
|
|
|
|
|
||||||||||||||||||||||||||||||||||||||
| Visa Inc. |
876 | 2.9% | 10.8% | 827 | 4.1% | 11.6% | 10,883 | 49 | -13.7% | -0.7% | 181 | |||||||||||||||||||||||||||||||||||
| Visa Debit Programs |
||||||||||||||||||||||||||||||||||||||||||||||
| US |
$ | 469 | 8.7% | 8.7% | $ | 355 | 9.8% | 9.8% | 9,640 | $ | 113 | 5.2% | 5.2% | 917 | ||||||||||||||||||||||||||||||||
| International |
546 | -11.4% | 6.4% | 122 | -3.5% | 15.6% | 4,133 | 424 | -13.5% | 4.0% | 3,293 | |||||||||||||||||||||||||||||||||||
|
|
|
|
|
|
|
|
|
|
||||||||||||||||||||||||||||||||||||||
| Visa Inc. |
1,014 | -3.1% | 7.5% | 477 | 6.1% | 11.3% | 13,773 | 537 | -10.1% | 4.3% | 4,210 | |||||||||||||||||||||||||||||||||||
| For the 3 Months Ended September 30, 2015 | ||||||||||||||||||||||||||||||||||||||||||||||
| Total Volume ($ billions) |
Growth (Nominal USD) |
Growth (Constant USD) |
Payments Volume ($ billions) |
Growth (Nominal USD) |
Growth (Constant USD) |
Payments Transactions (millions) |
Cash Volume ($ billions) |
Growth (Nominal USD) |
Growth (Constant USD) |
Cash |
Accounts |
Cards | ||||||||||||||||||||||||||||||||||
| All Visa Credit & Debit |
||||||||||||||||||||||||||||||||||||||||||||||
| Asia Pacific |
$ | 510 | 0.8% | 11.2% | $ | 372 | 5.7% | 16.6% | 4,674 | $ | 138 | -10.3% | -1.2% | 1,029 | 738 | 835 | ||||||||||||||||||||||||||||||
| Canada |
58 | -12.0% | 5.2% | 54 | -12.1% | 5.1% | 698 | 5 | -11.3% | 6.0% | 12 | 43 | 50 | |||||||||||||||||||||||||||||||||
| CEMEA |
232 | -17.1% | 9.4% | 61 | -9.9% | 17.1% | 1,914 | 171 | -19.4% | 6.9% | 1,195 | 333 | 321 | |||||||||||||||||||||||||||||||||
| LAC |
227 | -17.5% | 11.2% | 85 | -18.1% | 14.0% | 2,702 | 142 | -17.2% | 9.6% | 1,093 | 415 | 451 | |||||||||||||||||||||||||||||||||
| US |
822 | 8.7% | 8.7% | 693 | 9.7% | 9.7% | 13,658 | 129 | 3.9% | 3.9% | 959 | 630 | 802 | |||||||||||||||||||||||||||||||||
|
|
|
|
|
|
|
|
|
|
|
| ||||||||||||||||||||||||||||||||||||
| Visa Inc. |
1,850 | -1.8% | 9.7% | 1,265 | 4.0% | 12.1% | 23,647 | 585 | -12.3% | 4.8% | 4,287 | 2,158 | 2,459 | |||||||||||||||||||||||||||||||||
| Visa Credit Programs |
||||||||||||||||||||||||||||||||||||||||||||||
| US |
$ | 359 | 9.9% | 9.9% | $ | 345 | 10.2% | 10.2% | 4,224 | $ | 14 | 2.9% | 2.9% | 18 | 250 | 329 | ||||||||||||||||||||||||||||||
| International |
491 | -2.7% | 14.1% | 456 | -0.3% | 15.6% | 6,211 | 35 | -25.3% | -2.3% | 164 | 499 | 558 | |||||||||||||||||||||||||||||||||
|
|
|
|
|
|
|
|
|
|
|
| ||||||||||||||||||||||||||||||||||||
| Visa Inc. |
850 | 2.3% | 12.3% | 800 | 3.9% | 13.2% | 10,435 | 50 | -18.9% | -0.8% | 181 | 749 | 887 | |||||||||||||||||||||||||||||||||
| Visa Debit Programs |
||||||||||||||||||||||||||||||||||||||||||||||
| US |
$ | 463 | 7.9% | 7.9% | $ | 349 | 9.2% | 9.2% | 9,434 | $ | 115 | 4.0% | 4.0% | 941 | 380 | 473 | ||||||||||||||||||||||||||||||
| International |
537 | -13.8% | 7.2% | 116 | -8.7% | 13.1% | 3,777 | 420 | -15.1% | 5.7% | 3,164 | 1,029 | 1,099 | |||||||||||||||||||||||||||||||||
|
|
|
|
|
|
|
|
|
|
|
| ||||||||||||||||||||||||||||||||||||
| Visa Inc. |
1,000 | -5.0% | 7.5% | 465 | 4.1% | 10.1% | 13,212 | 535 | -11.7% | 5.4% | 4,105 | 1,410 | 1,572 | |||||||||||||||||||||||||||||||||
Operational Performance Data
| For the 3 Months Ended June 30, 2015 | ||||||||||||||||||||||||||||||||||||||||||||||||||||
| Total Volume ($ billions) |
Growth (Nominal USD) |
Growth (Constant USD) |
Payments Volume ($ billions) |
Growth (Nominal USD) |
Growth (Constant USD) |
Payments Transactions (millions) |
Cash Volume ($ billions) |
Growth (Nominal USD) |
Growth (Constant USD) |
Cash Transactions (millions) |
Accounts (millions) |
Cards (millions) |
||||||||||||||||||||||||||||||||||||||||
| All Visa Credit & Debit |
||||||||||||||||||||||||||||||||||||||||||||||||||||
| Asia Pacific |
$ | 510 | 4.3% | 10.9% | $ | 364 | 7.9% | 15.3% | 4,394 | $ | 145 | -3.8% | 1.1% | 1,003 | 725 | 822 | ||||||||||||||||||||||||||||||||||||
| Canada |
62 | -5.0% | 6.0% | 57 | -5.3% | 5.7% | 679 | 5 | -2.5% | 8.9% | 12 | 42 | 49 | |||||||||||||||||||||||||||||||||||||||
| CEMEA |
238 | -13.8% | 7.3% | 61 | -6.0% | 15.3% | 1,783 | 177 | -16.3% | 4.8% | 1,195 | 332 | 321 | |||||||||||||||||||||||||||||||||||||||
| LAC |
237 | -10.9% | 11.6% | 89 | -12.4% | 12.5% | 2,595 | 148 | -10.0% | 11.1% | 1,072 | 420 | 451 | |||||||||||||||||||||||||||||||||||||||
| US |
810 | 8.0% | 8.0% | 683 | 8.8% | 8.8% | 13,265 | 126 | 3.8% | 3.8% | 951 | 628 | 798 | |||||||||||||||||||||||||||||||||||||||
|
|
|
|
|
|
|
|
|
|
|
|
|
|
|
|||||||||||||||||||||||||||||||||||||||
| Visa Inc. |
1,855 | 0.6% | 9.1% | 1,254 | 5.3% | 11.0% | 22,717 | 602 | -8.0% | 5.1% | 4,232 | 2,145 | 2,441 | |||||||||||||||||||||||||||||||||||||||
| Visa Credit Programs |
||||||||||||||||||||||||||||||||||||||||||||||||||||
| US |
$ | 352 | 11.3% | 11.3% | $ | 339 | 11.7% | 11.7% | 4,072 | $ | 13 | 3.5% | 3.5% | 16 | 246 | 323 | ||||||||||||||||||||||||||||||||||||
| International |
490 | 0.6% | 12.9% | 453 | 3.0% | 14.5% | 5,915 | 37 | -21.7% | -3.8% | 160 | 496 | 554 | |||||||||||||||||||||||||||||||||||||||
|
|
|
|
|
|
|
|
|
|
|
|
|
|
|
|||||||||||||||||||||||||||||||||||||||
| Visa Inc. |
843 | 4.8% | 12.2% | 792 | 6.5% | 13.3% | 9,988 | 51 | -16.3% | -2.0% | 176 | 742 | 876 | |||||||||||||||||||||||||||||||||||||||
| Visa Debit Programs |
||||||||||||||||||||||||||||||||||||||||||||||||||||
| US |
$ | 457 | 5.6% | 5.6% | $ | 344 | 6.1% | 6.1% | 9,192 | $ | 113 | 3.8% | 3.8% | 935 | 382 | 476 | ||||||||||||||||||||||||||||||||||||
| International |
555 | -8.6% | 7.4% | 117 | -4.7% | 11.3% | 3,537 | 438 | -9.6% | 6.4% | 3,121 | 1,021 | 1,089 | |||||||||||||||||||||||||||||||||||||||
|
|
|
|
|
|
|
|
|
|
|
|
|
|
|
|||||||||||||||||||||||||||||||||||||||
| Visa Inc. |
1,013 | -2.7% | 6.6% | 462 | 3.2% | 7.4% | 12,729 | 551 | -7.1% | 5.9% | 4,056 | 1,404 | 1,565 | |||||||||||||||||||||||||||||||||||||||
| For the 3 Months Ended March 31, 2015 | ||||||||||||||||||||||||||||||||||||||||||||||||||||
| Total Volume ($ billions) |
Growth (Nominal USD) |
Growth (Constant USD) |
Payments Volume ($ billions) |
Growth (Nominal USD) |
Growth (Constant USD) |
Payments Transactions (millions) |
Cash Volume ($ billions) |
Growth (Nominal USD) |
Growth (Constant USD) |
Cash Transactions (millions) |
Accounts (millions) |
Cards (millions) |
||||||||||||||||||||||||||||||||||||||||
| All Visa Credit & Debit |
||||||||||||||||||||||||||||||||||||||||||||||||||||
| Asia Pacific |
$ | 495 | 2.9% | 8.6% | $ | 343 | 4.8% | 11.6% | 4,092 | $ | 152 | -1.2% | 2.4% | 986 | 711 | 809 | ||||||||||||||||||||||||||||||||||||
| Canada |
54 | -5.0% | 7.1% | 49 | -5.3% | 6.8% | 602 | 5 | -1.7% | 10.9% | 12 | 42 | 49 | |||||||||||||||||||||||||||||||||||||||
| CEMEA |
212 | -16.0% | 11.8% | 54 | -8.2% | 19.9% | 1,615 | 158 | -18.4% | 9.3% | 1,121 | 329 | 323 | |||||||||||||||||||||||||||||||||||||||
| LAC |
243 | -2.9% | 13.4% | 93 | -1.4% | 15.7% | 2,529 | 149 | -3.8% | 12.1% | 1,043 | 417 | 450 | |||||||||||||||||||||||||||||||||||||||
| US |
748 | 8.4% | 8.4% | 628 | 9.2% | 9.2% | 12,206 | 120 | 4.3% | 4.3% | 890 | 620 | 789 | |||||||||||||||||||||||||||||||||||||||
|
|
|
|
|
|
|
|
|
|
|
|
|
|
|
|||||||||||||||||||||||||||||||||||||||
| Visa Inc. |
1,751 | 1.2% | 9.5% | 1,168 | 5.4% | 10.8% | 21,044 | 584 | -6.2% | 7.0% | 4,052 | 2,120 | 2,420 | |||||||||||||||||||||||||||||||||||||||
| Visa Credit Programs |
||||||||||||||||||||||||||||||||||||||||||||||||||||
| US |
$ | 316 | 12.3% | 12.3% | $ | 303 | 12.3% | 12.3% | 3,623 | $ | 13 | 12.1% | 12.1% | 15 | 241 | 318 | ||||||||||||||||||||||||||||||||||||
| International |
463 | 0.0% | 11.5% | 428 | 2.7% | 12.8% | 5,533 | 35 | -24.2% | -2.6% | 153 | 489 | 546 | |||||||||||||||||||||||||||||||||||||||
|
|
|
|
|
|
|
|
|
|
|
|
|
|
|
|||||||||||||||||||||||||||||||||||||||
| Visa Inc. |
779 | 4.6% | 11.8% | 731 | 6.4% | 12.6% | 9,156 | 48 | -16.8% | 1.0% | 168 | 730 | 864 | |||||||||||||||||||||||||||||||||||||||
| Visa Debit Programs |
||||||||||||||||||||||||||||||||||||||||||||||||||||
| US |
$ | 433 | 5.8% | 5.8% | $ | 325 | 6.5% | 6.5% | 8,583 | $ | 107 | 3.4% | 3.4% | 875 | 379 | 471 | ||||||||||||||||||||||||||||||||||||
| International |
540 | -6.4% | 9.4% | 111 | -3.7% | 11.9% | 3,306 | 429 | -7.0% | 8.7% | 3,009 | 1,011 | 1,085 | |||||||||||||||||||||||||||||||||||||||
|
|
|
|
|
|
|
|
|
|
|
|
|
|
|
|||||||||||||||||||||||||||||||||||||||
| Visa Inc. |
972 | -1.3% | 7.7% | 437 | 3.7% | 7.9% | 11,889 | 536 | -5.1% | 7.6% | 3,884 | 1,390 | 1,556 | |||||||||||||||||||||||||||||||||||||||
| For the 3 Months Ended December 31, 2014 | ||||||||||||||||||||||||||||||||||||||||||||||||||||
| Total Volume ($ billions) |
Growth (Nominal USD) |
Growth (Constant USD) |
Payments Volume ($ billions) |
Growth (Nominal USD) |
Growth (Constant USD) |
Payments Transactions (millions) |
Cash Volume ($ billions) |
Growth (Nominal USD) |
Growth (Constant USD) |
Cash Transactions (millions) |
Accounts (millions) |
Cards (millions) |
||||||||||||||||||||||||||||||||||||||||
| All Visa Credit & Debit |
||||||||||||||||||||||||||||||||||||||||||||||||||||
| Asia Pacific |
$ | 511 | 3.6% | 7.9% | $ | 359 | 5.8% | 10.8% | 4,186 | $ | 152 | -1.4% | 1.7% | 974 | 698 | 797 | ||||||||||||||||||||||||||||||||||||
| Canada |
66 | -0.1% | 8.7% | 62 | -0.1% | 8.7% | 671 | 5 | 0.2% | 9.0% | 11 | 42 | 49 | |||||||||||||||||||||||||||||||||||||||
| CEMEA |
264 | -7.8% | 15.5% | 65 | 3.2% | 26.1% | 1,616 | 199 | -10.9% | 12.4% | 1,213 | 325 | 321 | |||||||||||||||||||||||||||||||||||||||
| LAC |
285 | -0.6% | 12.9% | 109 | -1.3% | 12.6% | 2,683 | 177 | -0.2% | 13.0% | 1,130 | 414 | 452 | |||||||||||||||||||||||||||||||||||||||
| US |
772 | 9.4% | 9.4% | 651 | 10.2% | 10.2% | 12,595 | 121 | 5.2% | 5.2% | 916 | 611 | 782 | |||||||||||||||||||||||||||||||||||||||
|
|
|
|
|
|
|
|
|
|
|
|
|
|
|
|||||||||||||||||||||||||||||||||||||||
| Visa Inc. |
1,898 | 3.3% | 10.1% | 1,245 | 6.9% | 11.1% | 21,750 | 654 | -3.1% | 8.1% | 4,243 | 2,089 | 2,401 | |||||||||||||||||||||||||||||||||||||||
| Visa Credit Programs |
||||||||||||||||||||||||||||||||||||||||||||||||||||
| US |
$ | 341 | 13.7% | 13.7% | $ | 327 | 13.9% | 13.9% | 3,957 | $ | 13 | 9.2% | 9.2% | 16 | 236 | 313 | ||||||||||||||||||||||||||||||||||||
| International |
510 | 1.6% | 10.6% | 467 | 3.9% | 11.7% | 5,769 | 43 | -18.3% | -1.2% | 173 | 485 | 543 | |||||||||||||||||||||||||||||||||||||||
|
|
|
|
|
|
|
|
|
|
|
|
|
|
|
|||||||||||||||||||||||||||||||||||||||
| Visa Inc. |
851 | 6.1% | 11.9% | 795 | 7.8% | 12.7% | 9,725 | 56 | -13.1% | 1.4% | 189 | 721 | 857 | |||||||||||||||||||||||||||||||||||||||
| Visa Debit Programs |
||||||||||||||||||||||||||||||||||||||||||||||||||||
| US |
$ | 431 | 6.2% | 6.2% | $ | 324 | 6.6% | 6.6% | 8,638 | $ | 108 | 4.7% | 4.7% | 899 | 374 | 469 | ||||||||||||||||||||||||||||||||||||
| International |
616 | -2.3% | 10.8% | 126 | 2.3% | 14.4% | 3,387 | 490 | -3.4% | 9.9% | 3,155 | 994 | 1,076 | |||||||||||||||||||||||||||||||||||||||
|
|
|
|
|
|
|
|
|
|
|
|
|
|
|
|||||||||||||||||||||||||||||||||||||||
| Visa Inc. |
1,047 | 1.0% | 8.6% | 450 | 5.4% | 8.5% | 12,025 | 597 | -2.0% | 8.8% | 4,054 | 1,368 | 1,545 | |||||||||||||||||||||||||||||||||||||||
Operational Performance Data
| For the 12 Months Ended December 31, 2015 | ||||||||||||||||||||||||||||||||||||||||||||||||
| Total Volume ($ billions) |
Growth (Nominal USD) |
Growth (Constant USD) |
Payments Volume ($ billions) |
Growth (Nominal USD) |
Growth (Constant USD) |
Payments Transactions (millions) |
Cash Volume ($ billions) |
Growth (Nominal USD) |
Growth (Constant USD) |
Cash |
||||||||||||||||||||||||||||||||||||||
| All Visa Credit & Debit |
||||||||||||||||||||||||||||||||||||||||||||||||
| Asia Pacific |
$ | 2,041 | 2.8% | 10.4% | $ | 1,467 | 6.6% | 14.8% | 18,055 | $ | 574 | -6.0% | 0.5% | 4,055 | ||||||||||||||||||||||||||||||||||
| Canada |
233 | -8.4% | 5.8% | 214 | -8.6% | 5.5% | 2,699 | 19 | -5.7% | 8.8% | 46 | |||||||||||||||||||||||||||||||||||||
| CEMEA |
909 | -15.2% | 8.2% | 236 | -7.8% | 15.8% | 7,410 | 673 | -17.5% | 5.8% | 4,746 | |||||||||||||||||||||||||||||||||||||
| LAC |
943 | -12.4% | 11.6% | 357 | -12.7% | 14.1% | 10,738 | 587 | -12.2% | 10.2% | 4,381 | |||||||||||||||||||||||||||||||||||||
| US |
3,221 | 8.5% | 8.5% | 2,718 | 9.3% | 9.3% | 53,162 | 503 | 4.4% | 4.4% | 3,734 | |||||||||||||||||||||||||||||||||||||
|
|
|
|
|
|
|
|
|
|
||||||||||||||||||||||||||||||||||||||||
| Visa Inc. |
7,346 | -0.1% | 9.3% | 4,991 | 4.9% | 11.3% | 92,064 | 2,355 | -9.3% | 5.2% | 16,962 | |||||||||||||||||||||||||||||||||||||
| Visa Credit Programs |
||||||||||||||||||||||||||||||||||||||||||||||||
| US |
$ | 1,399 | 10.6% | 10.6% | $ | 1,344 | 10.8% | 10.8% | 16,312 | $ | 55 | 6.4% | 6.4% | 66 | ||||||||||||||||||||||||||||||||||
| International |
1,948 | -0.9% | 12.6% | 1,807 | 1.4% | 14.1% | 24,149 | 142 | -22.9% | -3.2% | 641 | |||||||||||||||||||||||||||||||||||||
|
|
|
|
|
|
|
|
|
|
||||||||||||||||||||||||||||||||||||||||
| Visa Inc. |
3,347 | 3.6% | 11.8% | 3,151 | 5.2% | 12.7% | 40,461 | 197 | -16.5% | -0.7% | 707 | |||||||||||||||||||||||||||||||||||||
| Visa Debit Programs |
||||||||||||||||||||||||||||||||||||||||||||||||
| US |
$ | 1,822 | 7.0% | 7.0% | $ | 1,374 | 7.9% | 7.9% | 36,850 | $ | 448 | 4.1% | 4.1% | 3,668 | ||||||||||||||||||||||||||||||||||
| International |
2,177 | -10.1% | 7.6% | 467 | -5.2% | 13.0% | 14,753 | 1,711 | -11.4% | 6.2% | 12,588 | |||||||||||||||||||||||||||||||||||||
|
|
|
|
|
|
|
|
|
|
||||||||||||||||||||||||||||||||||||||||
| Visa Inc. |
3,999 | -3.1% | 7.3% | 1,840 | 4.3% | 9.2% | 51,602 | 2,159 | -8.6% | 5.8% | 16,255 | |||||||||||||||||||||||||||||||||||||
| For the 12 Months Ended December 31, 2014 | ||||||||||||||||||||||||||||||||||||||||||||||||
| Total Volume ($ billions) |
Growth (Nominal USD) |
Growth (Constant USD) |
Payments Volume ($ billions) |
Growth (Nominal USD) |
Growth (Constant USD) |
Payments Transactions (millions) |
Cash Volume ($ billions) |
Growth (Nominal USD) |
Growth (Constant USD) |
Cash |
Accounts |
Cards (millions) |
||||||||||||||||||||||||||||||||||||
| All Visa Credit & Debit |
||||||||||||||||||||||||||||||||||||||||||||||||
| Asia Pacific |
$ | 1,986 | 6.7% | 9.5% | $ | 1,376 | 9.8% | 12.6% | 15,581 | $ | 610 | 0.1% | 3.3% | 3,722 | 698 | 797 | ||||||||||||||||||||||||||||||||
| Canada |
254 | 0.8% | 8.4% | 234 | 0.8% | 8.5% | 2,500 | 20 | 0.6% | 8.1% | 46 | 42 | 49 | |||||||||||||||||||||||||||||||||||
| CEMEA |
1,071 | 1.4% | 14.6% | 256 | 13.6% | 25.9% | 5,743 | 816 | -1.9% | 11.4% | 4,670 | 325 | 321 | |||||||||||||||||||||||||||||||||||
| LAC |
1,077 | -0.1% | 11.6% | 408 | 0.4% | 12.8% | 9,939 | 668 | -0.4% | 10.9% | 4,183 | 414 | 452 | |||||||||||||||||||||||||||||||||||
| US |
2,968 | 9.0% | 9.0% | 2,486 | 9.7% | 9.7% | 48,273 | 482 | 5.5% | 5.5% | 3,687 | 611 | 782 | |||||||||||||||||||||||||||||||||||
|
|
|
|
|
|
|
|
|
|
|
|
|
|||||||||||||||||||||||||||||||||||||
| Visa Inc. |
7,356 | 5.5% | 10.1% | 4,760 | 8.6% | 11.3% | 82,036 | 2,596 | 0.3% | 7.8% | 16,308 | 2,089 | 2,401 | |||||||||||||||||||||||||||||||||||
| Visa Credit Programs |
||||||||||||||||||||||||||||||||||||||||||||||||
| US |
$ | 1,265 | 12.3% | 12.3% | $ | 1,213 | 12.5% | 12.5% | 14,412 | $ | 52 | 7.8% | 7.8% | 64 |
236 |
313 | ||||||||||||||||||||||||||||||||
| International |
1,966 | 4.8% | 10.6% | 1,782 | 6.4% | 11.7% | 21,750 | 184 | -8.8% | -0.1% | 709 |
485 |
543 | |||||||||||||||||||||||||||||||||||
|
|
|
|
|
|
|
|
|
|
|
|
|
|||||||||||||||||||||||||||||||||||||
| Visa Inc. |
3,231 | 7.6% | 11.3% | 2,995 | 8.8% | 12.0% | 36,163 | 235 | -5.6% | 1.8% | 773 |
721 |
857 | |||||||||||||||||||||||||||||||||||
| Visa Debit Programs |
||||||||||||||||||||||||||||||||||||||||||||||||
| US |
$ | 1,703 | 6.7% | 6.7% | $ | 1,273 | 7.2% | 7.2% | 33,861 | $ | 430 | 5.3% | 5.3% | 3,623 |
374 |
469 | ||||||||||||||||||||||||||||||||
| International |
2,423 | 2.1% | 11.4% | 492 | 11.3% | 20.4% | 12,013 | 1,930 | 0.0% | 9.3% | 11,912 |
994 |
1,076 | |||||||||||||||||||||||||||||||||||
|
|
|
|
|
|
|
|
|
|
|
|
|
|||||||||||||||||||||||||||||||||||||
| Visa Inc. |
4,126 | 3.9% | 9.2% | 1,765 | 8.3% | 10.1% | 45,874 | 2,361 | 0.9% | 8.4% | 15,535 |
1,368 |
1,545 | |||||||||||||||||||||||||||||||||||
Operational Performance Data
2. Cross-Border Volume
The table below represents cross-border volume growth for cards carrying the Visa, Visa Electron, Interlink and PLUS brands. Cross-border volume refers to payments and cash volume where the issuing country is different from the merchant country.
| Period |
Growth (Nominal USD) |
Growth (Constant USD) | ||
| 3 Months Ended |
||||
| Dec 31, 2015 |
-4% | 4% | ||
| Sep 30, 2015 |
-4% | 5% | ||
| Jun 30, 2015 |
0% | 8% | ||
| Mar 31, 2015 |
2% | 8% | ||
| Dec 31, 2014 |
4% | 8% | ||
| 12 Months Ended |
||||
| Dec 31, 2015 |
-2% | 6% | ||
| Dec 31, 2014 |
6% | 8% |
3. Visa Processed Transactions
The table below represents transactions involving Visa, Visa Electron, Interlink and PLUS cards processed on Visa’s networks.
| Period |
Processed Transactions (millions) |
Growth | ||
| 3 Months Ended |
||||
| Dec 31, 2015 |
18,986 | 8% | ||
| Sep 30, 2015 |
18,365 | 8% | ||
| Jun 30, 2015 |
18,024 | 8% | ||
| Mar 31, 2015 |
16,980 | 11% | ||
| Dec 31, 2014 |
17,599 | 10% | ||
| 12 Months Ended |
||||
| Dec 31, 2015 |
72,355 | 9% | ||
| Dec 31, 2014 |
66,607 | 10% |
Operational Performance Data
Footnote
Payments volume represents the aggregate dollar amount of purchases made with cards carrying the Visa, Visa Electron and Interlink brands for the relevant period; and cash volume represents the aggregate dollar amount of cash disbursements obtained with these cards for the relevant period and includes the impact of balance transfers and convenience checks; but excludes proprietary PLUS volume. Total volume represents payments volume plus cash volume.
Visa payment products are comprised of credit and debit programs, and data relating to each program is included in the tables. Debit programs include Visa’s signature based and Interlink (PIN) debit programs.
The data presented is based on results reported quarterly by Visa’s financial institution clients on their operating certificates. Estimates may be utilized if data is unavailable.
On occasion, previously presented information may be updated. Prior period updates, if any, are not material.
Visa’s CEMEA region is comprised of countries in Central Europe, the Middle East and Africa. Effective with the 3 months ended September 2013, Croatia moved from the CEMEA region to Visa Europe. Several European Union countries in Central Europe, Israel and Turkey are not included in CEMEA. LAC is comprised of countries in Central and South America and the Caribbean. International includes Asia Pacific, Canada, CEMEA and LAC.
Information denominated in U.S. dollars is calculated by applying an established U.S. dollar/local currency exchange rate for each local currency in which Visa Inc. volumes are reported (“Nominal USD”). These exchange rates are calculated on a quarterly basis using the established exchange rate for each quarter. To eliminate the impact of foreign currency fluctuations against the U.S. dollar in measuring performance, Visa Inc. also reports year-over-year growth in total volume, payments volume and cash volume on the basis of local currency information (“Constant USD”). This presentation represents Visa’s historical methodology which may be subject to review and refinement.
| Exhibit 99.2
|

Visa Inc.
Fiscal First Quarter 2016 Financial Results
January 28, 2016
|
|
Forward-Looking Statements
This presentation contains forward-looking statements within the meaning of the U.S. Private Securities Litigation Reform Act of 1995. Forward-looking statements generally are identified by words such as “estimates,” “believe,” “outlook,” “will,” “continue” and other similar expressions. Examples of forward-looking statements include, but are not limited to, statements we make about our revenue, client incentives, operating margin, tax rate, earnings per share, free cash flow, and the growth of those items.
By their nature, forward-looking statements: (i) speak only as of the date they are made; (ii) are not statements of historical fact or guarantees of future performance; and (iii) are subject to risks, uncertainties, assumptions or changes in circumstances that are difficult to predict or quantify. Therefore, actual results could differ materially and adversely from our forward-looking statements due to a variety of factors, including the following: the impact of laws, regulations and marketplace barriers, including: increased regulation of fees, transaction routing, payment card practices or other aspects of the payments industry in the United States, including new or revised regulations issued under the Dodd-Frank Wall Street Reform and Consumer Protection Act; increased regulation in jurisdictions outside of the United States; increased government support of national payments networks outside the United States; and increased regulation of consumer privacy, data use and security; developments in litigation and government enforcement, including those affecting interchange reimbursement fees, antitrust and tax; new lawsuits, investigations or proceedings, or changes to our potential exposure in connection with pending lawsuits, investigations or proceedings; economic factors, such as: economic fragility in the Eurozone, the United States and in other advanced and emerging markets; general economic, political and social conditions in mature and emerging markets globally; general stock market fluctuations which may impact consumer spending; material changes in cross-border activity, foreign exchange controls and fluctuations in currency exchange rates; and material changes in our financial institution clients’ performance compared to our estimates; industry developments, such as competitive pressure, rapid technological developments and disintermediation from our payments network; system developments, such as: disruption of our transaction processing systems or the inability to process transactions efficiently; account data breaches or increased fraudulent or other illegal activities involving Visa-branded cards or payment products; and failure to maintain systems interoperability with Visa Europe;
the transaction with Visa Europe may not be consummated on the terms currently contemplated or at all;
Visa Europe’s business may not be successfully integrated with our business or we may not achieve the anticipated benefits of the transaction; the costs and risks associated with the transaction with Visa Europe;
matters arising in connection with Visa Europe’s or our efforts to comply with and satisfy applicable regulatory approvals and closing conditions relating to the transaction; the loss of organizational effectiveness or key employees; the failure to integrate acquisitions successfully or to effectively develop new products and businesses; natural disasters, terrorist attacks, military or political conflicts, and public health emergencies; and various other factors, including those more fully described in our filings with the U.S. Securities and Exchange Commission, including our Annual Report on Form 10-K for the year ended September 30, 2015, and our subsequent reports on Forms 10-Q and 8-K.
You should not place undue reliance on such statements. Except as required by law, we do not intend to update or revise any forward–looking statements as a result of new information, future developments or otherwise.
2 Fiscal First Quarter 2016 Financial Results
|
|
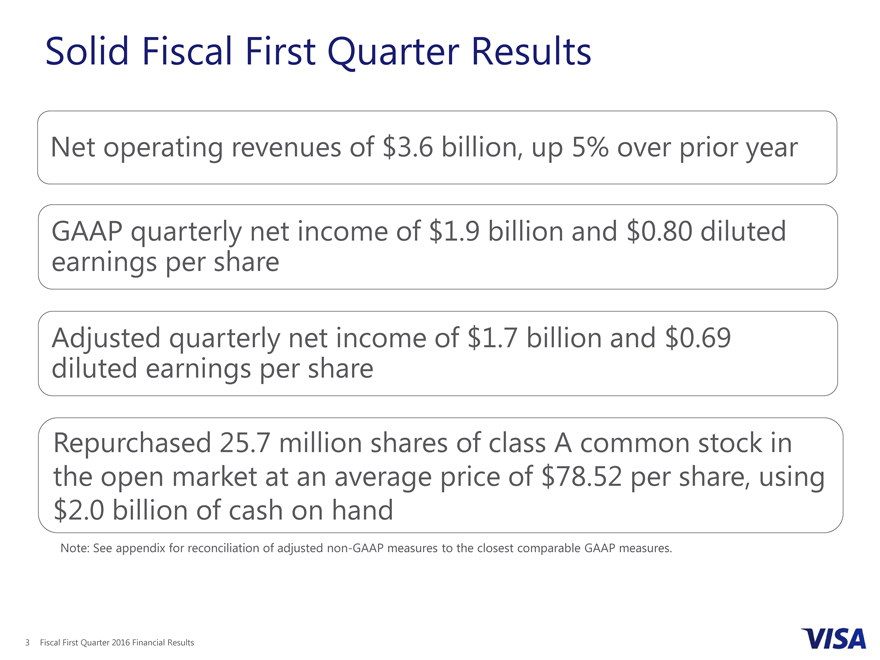
Net Fiscal First Quarter Results
Solid operating revenues of $3.6 billion, up 5% over prior year
GAAP quarterly net income of $1.9 billion and $0.80 diluted earnings per share
Adjusted quarterly net income of $1.7 billion and $0.69 diluted earnings per share
Repurchased 25.7 million shares of class A common stock in the open market at an average price of $78.52 per share, using $2.0 billion of cash on hand
Note: See appendix for reconciliation of adjusted non-GAAP measures to the closest comparable GAAP measures.
3 Fiscal First Quarter 2016 Financial Results
|
|
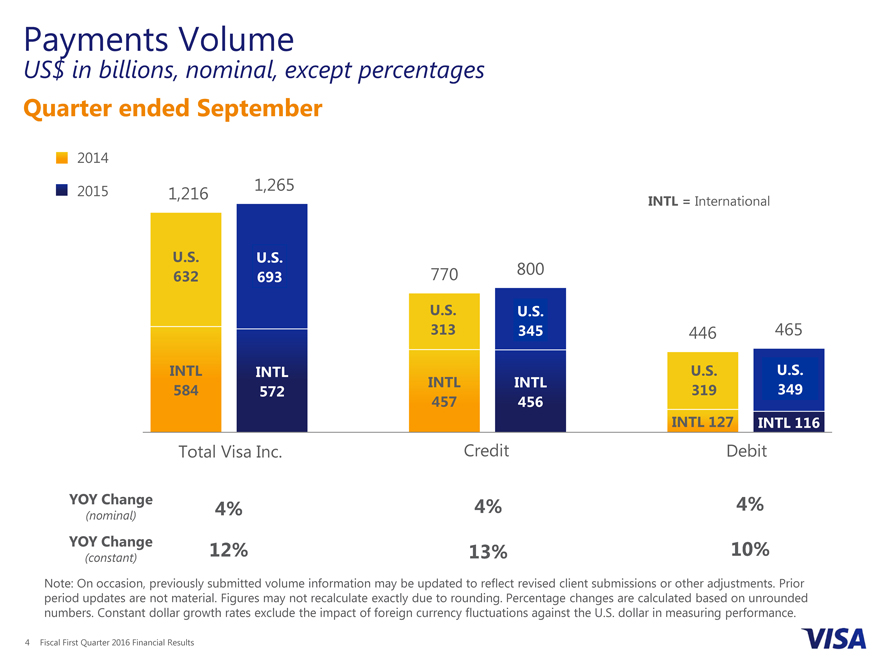
Payments Volume
US$ in billions, nominal, except percentages
Quarter ended September
2014
2015 1,216 1,265
INTL = International
U.S. U.S.
632 693 770 800
U.S. U.S.
313 345 446 465
INTL INTL U.S. U.S.
584 572 INTL INTL 319 349
457 456
INTL 127 INTL 116
Total Visa Inc. Credit Debit
YOY Change 4% 4% 4%
(nominal)
YOY Change 12% 13% 10%
(constant)
Note: On occasion, previously submitted volume information may be updated to reflect revised client submissions or other adjustments. Prior period updates are not material. Figures may not recalculate exactly due to rounding. Percentage changes are calculated based on unrounded numbers. Constant dollar growth rates exclude the impact of foreign currency fluctuations against the U.S. dollar in measuring performance.
4 Fiscal First Quarter 2016 Financial Results
|
|
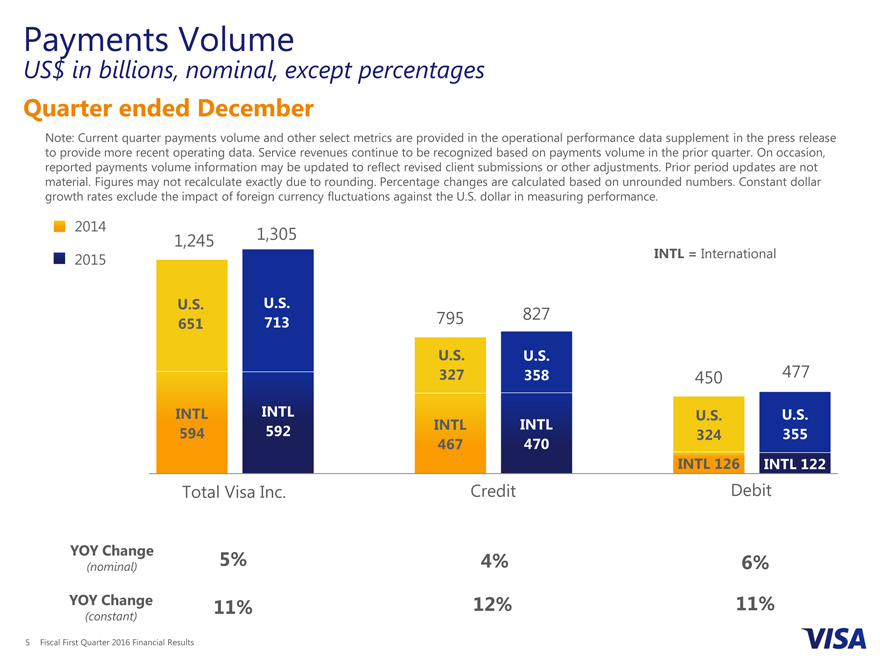
Payments Volume
US$ in billions, nominal, except percentages
Quarter ended December
Note: Current quarter payments volume and other select metrics are provided in the operational performance data supplement in the press release to provide more recent operating data. Service revenues continue to be recognized based on payments volume in the prior quarter. On occasion, reported payments volume information may be updated to reflect revised client submissions or other adjustments. Prior period updates are not material. Figures may not recalculate exactly due to rounding. Percentage changes are calculated based on unrounded numbers. Constant dollar growth rates exclude the impact of foreign currency fluctuations against the U.S. dollar in measuring performance.
2014
1,245 1,305
2015 INTL = International
U.S. U.S.
651 U.S. 713U.S. 795 827
575 631 U.S. U.S.
327U.S. U.358S. 450 477
277 313
INTL INTL U.S. U.S.
594 592 INTL 467 INTL INTL INTL 470 U.S. 324 U.S. 355
298 319
420 457 INTL 126 INTL 122
INTL 109 INTL 127
Total Visa Inc. Credit Debit
YOY Change
(nominal) 5% 4% 6%
YOY Change 11% 12% 11%
(constant)
5 Fiscal First Quarter 2016 Financial Results
|
|
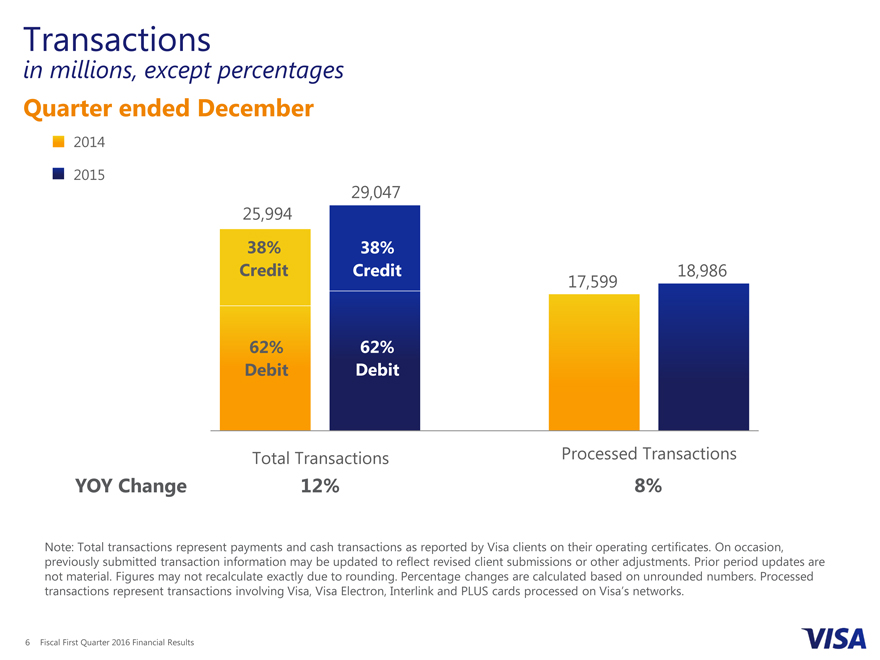
Transactions
in millions, except percentages
Quarter ended December
2014
2015
29,047
25,994
38% 38%
CreditCr t CredCreditt 18,986
17,599
38% 38%
62% 62%
Debit Debit Debit
62%
Total Transactions Processed Transactions
YOY Change 12% 8%
Note: Total transactions represent payments and cash transactions as reported by Visa clients on their operating certificates. On occasion, previously submitted transaction information may be updated to reflect revised client submissions or other adjustments. Prior period updates are not material. Figures may not recalculate exactly due to rounding. Percentage changes are calculated based on unrounded numbers. Processed transactions represent transactions involving Visa, Visa Electron, Interlink and PLUS cards processed on Visa’s networks.
6 Fiscal First Quarter 2016 Financial Results
|
|

Total Cards
in millions, except percentages
Quarter ended September
2014
2015
2,340 2,459
1,491 1,572
849 887
Visa Inc. Credit Debit
YOY Change 5% 5% 5%
Note: The data presented is based on results reported quarterly by Visa clients on their operating certificates. Estimates may be utilized if data is unavailable. On occasion, previously submitted card information may be updated to reflect revised client submissions or other adjustments. Prior period updates are not material. Figures may not recalculate exactly due to rounding. Percentage changes are calculated based on unrounded numbers.
7 Fiscal First Quarter 2016 Financial Results
|
|
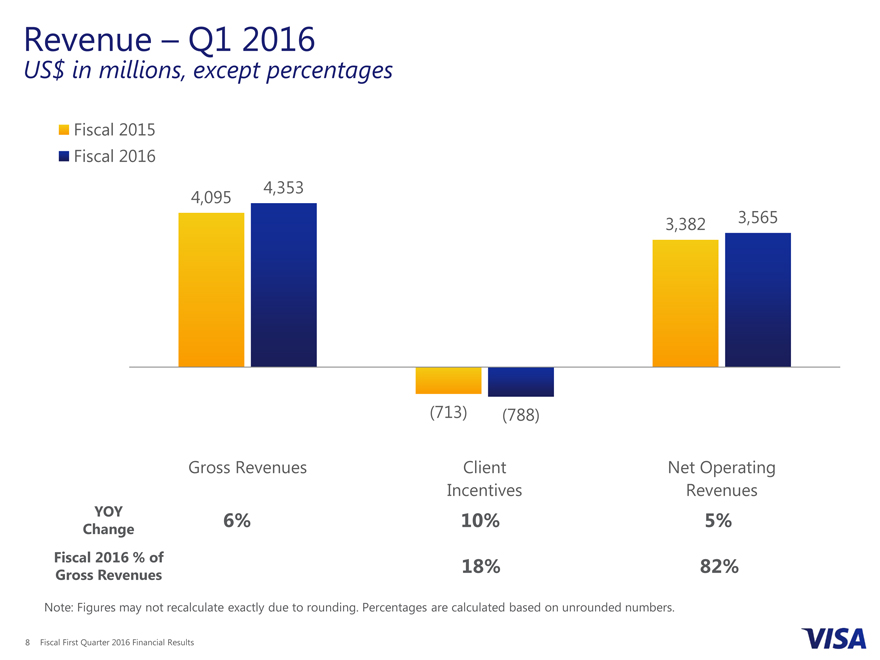
Revenue – Q1 2016
US$ in millions, except percentages
Fiscal 2015
Fiscal 2016
4,095 4,353
3,382 3,565
(713) (788)
Gross Revenues Client Net Operating
Incentives Revenues
YOY 6% 10% 5%
Change
Fiscal 2016 % of 18% 82%
Gross Revenues
Note: Figures may not recalculate exactly due to rounding. Percentages are calculated based on unrounded numbers.
8 Fiscal First Quarter 2016 Financial Results
|
|
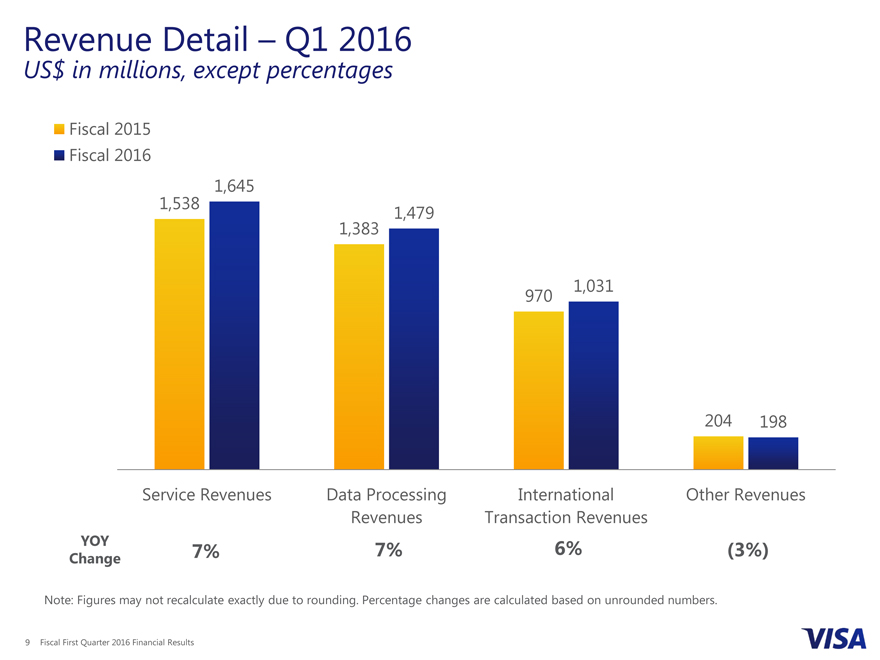
Revenue Detail – Q1 2016
US$ in millions, except percentages
Fiscal 2015
Fiscal 2016
1,645
1,538 1,479
1,383
970 1,031
204 198
Service Revenues Data Processing International Other Revenues
Revenues Transaction Revenues
YOY 7% 7% 6% (3%)
Change
Note: Figures may not recalculate exactly due to rounding. Percentage changes are calculated based on unrounded numbers.
9 Fiscal First Quarter 2016 Financial Results
|
|
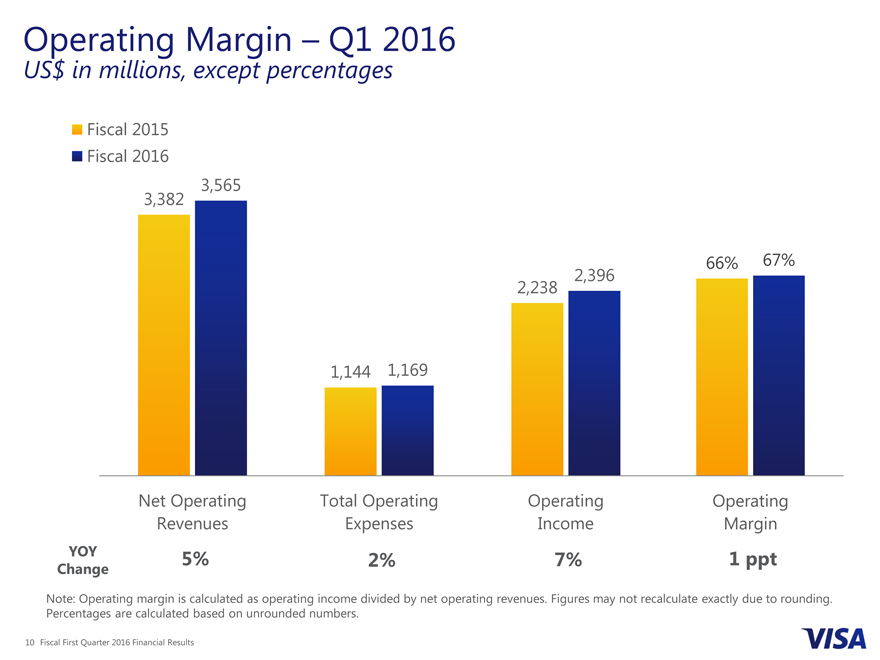
Operating Margin – Q1 2016
US$ in millions, except percentages
Fiscal 2015
Fiscal 2016
3,382 3,565
66% 67%
2,238 2,396
1,144 1,169
Net Operating Total Operating Operating Operating
Revenues Expenses Income Margin
YOY 5% 2% 7% 1 ppt
Change
Note: Operating margin is calculated as operating income divided by net operating revenues. Figures may not recalculate exactly due to rounding. Percentages are calculated based on unrounded numbers.
10 Fiscal First Quarter 2016 Financial Results
|
|
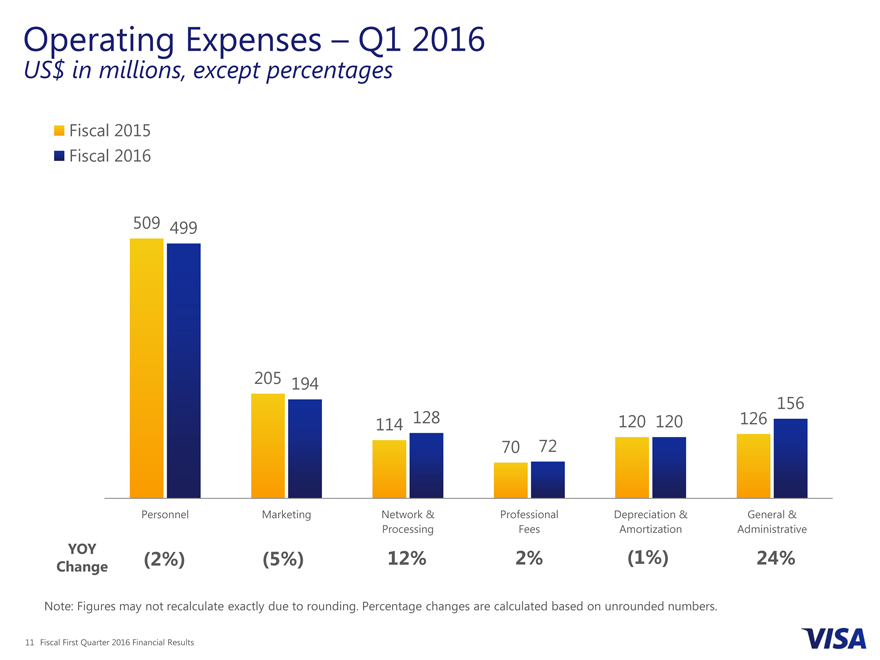
Operating Expenses – Q1 2016
US$ in millions, except percentages
Fiscal 2015
Fiscal 2016
509 499
205 194
114 128 120 120 126 156
70 72
Personnel Marketing Network & Professional Depreciation & General &
Processing Fees Amortization Administrative
YOY (2%) (5%) 12% 2% (1%) 24%
Change
Note: Figures may not recalculate exactly due to rounding. Percentage changes are calculated based on unrounded numbers.
11 Fiscal First Quarter 2016 Financial Results
|
|
Other Financial Results
Cash, cash equivalents and available-for-sale investment securities of $24.8 billion at the end of the fiscal first quarter
Free cash flow of $1.9 billion for the fiscal first quarter
Capital expenditures of $126 million during the fiscal first quarter
Issued $16.0 billion of fixed-rate senior notes
12 Fiscal First Quarter 2016 Financial Results
|
|
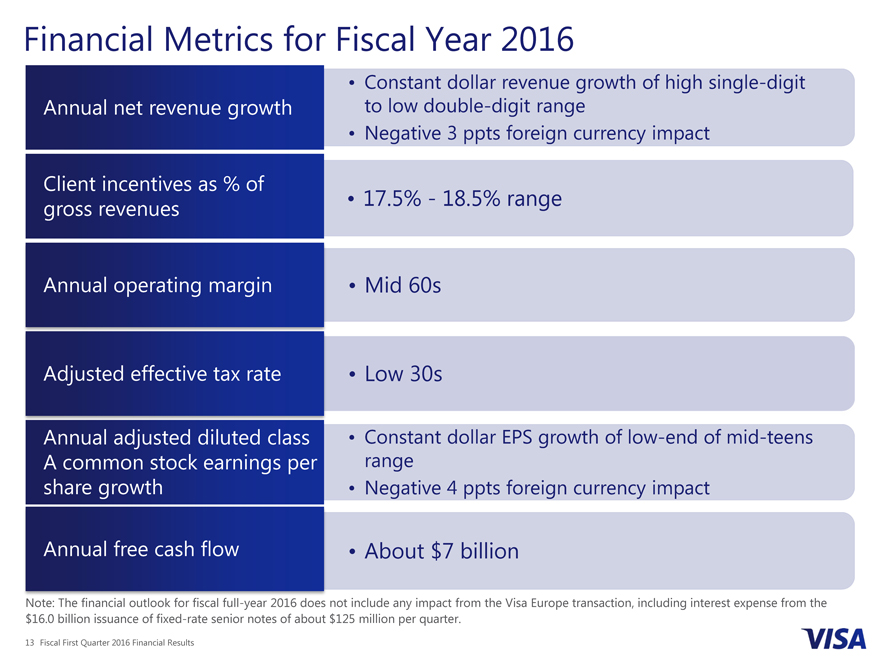
Financial Metrics for Fiscal Year 2016
Constant dollar revenue growth of high single-digit
Annual net revenue growth to low double-digit range
Negative 3 ppts foreign currency impact
Client incentives as % of
gross revenues 17.5%—18.5% range
Annual operating margin Mid 60s
Adjusted effective tax rate Low 30s
Annual adjusted diluted class Constant dollar EPS growth of low-end of mid-teens
A common stock earnings per range
share growth Negative 4 ppts foreign currency impact
Annual free cash flow About $7 billion
Note: fourth The quarters financial of 2016, outlook the for Company fiscal full-year will realize 2016 interest does not expense include per any quarter impact of from about the $122 Visa million Europe related transaction. to the [Over issuance the of fiscal its fixed-rate second, third senior and notes. ]
13 Fiscal First Quarter 2016 Financial Results
|
|

Appendix
|
|
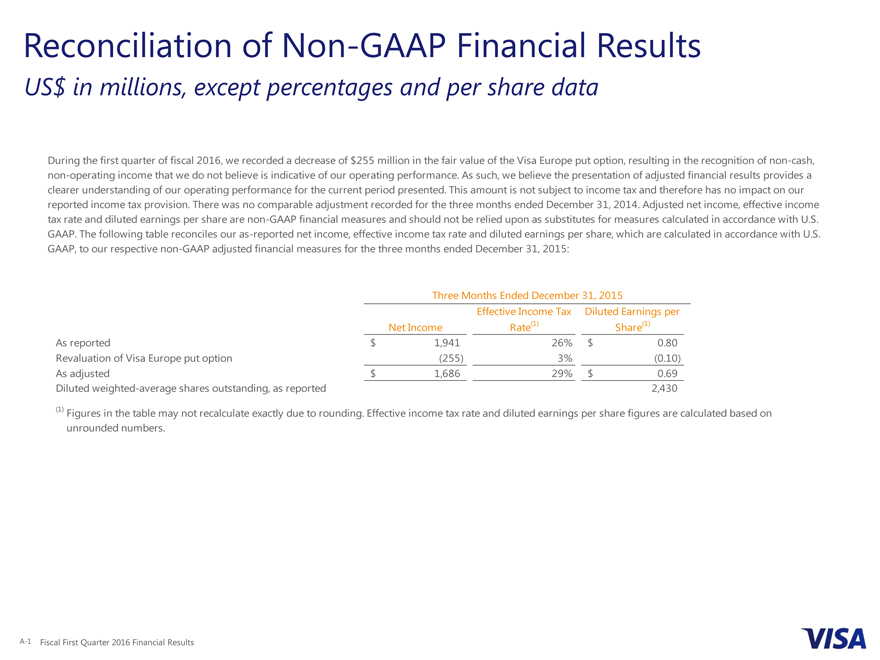
Reconciliation of Non-GAAP Financial Results
US$ in millions, except percentages and per share data
During the first quarter of fiscal 2016, we recorded a decrease of $255 million in the fair value of the Visa Europe put option, resulting in the recognition of non-cash, non-operating income that we do not believe is indicative of our operating performance. As such, we believe the presentation of adjusted financial results provides a clearer understanding of our operating performance for the current period presented. This amount is not subject to income tax and therefore has no impact on our reported income tax provision. There was no comparable adjustment recorded for the three months ended December 31, 2014. Adjusted net income, effective income tax rate and diluted earnings per share are non-GAAP financial measures and should not be relied upon as substitutes for measures calculated in accordance with U.S. GAAP. The following table reconciles our as-reported net income, effective income tax rate and diluted earnings per share, which are calculated in accordance with U.S.
GAAP, to our respective non-GAAP adjusted financial measures for the three months ended December 31, 2015:
Three Months Ended December 31, 2015
Effective Income Tax Diluted Earnings per
Net Income Rate(1) Share(1)
As reported $ 1,941 26% $ 0.80
Revaluation of Visa Europe put option (255) 3% (0.10)
As adjusted $ 1,686 29% $ 0.69
Diluted weighted-average shares outstanding, as reported 2,430
(1) Figures in the table may not recalculate exactly due to rounding. Effective income tax rate and diluted earnings per share figures are calculated based on
unrounded numbers.
A-1 Fiscal First Quarter 2016 Financial Results
|
|
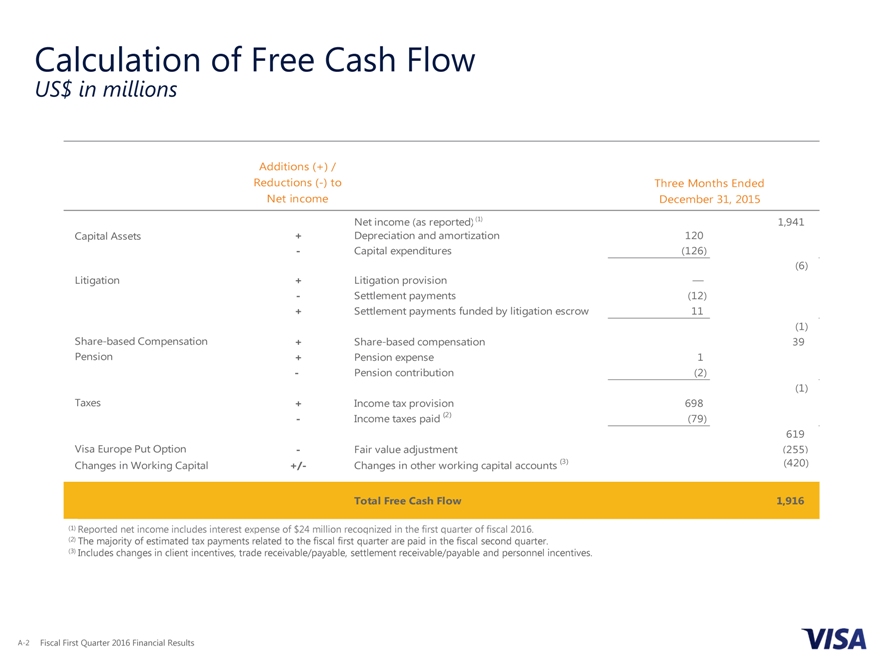
Calculation of Free Cash Flow
US$ in millions
Additions (+) /
Reductions (-) to Three Months Ended
Net income December 31, 2015(1)
Net income (as reported) 1,941
Capital Assets + Depreciation and amortization 120
— Capital expenditures (126)
(6)
Litigation + Litigation provision —
— Settlement payments (12)
+ Settlement payments funded by litigation escrow 11
(2)
Share-based Compensation + Share-based compensation 39
Pension + Pension expense 1
— Pension contribution (3)
(1)
Taxes + Income tax provision 698
— Income taxes paid (1) (79)
619
Visa Europe Put Option — Fair value adjustment (255)
Changes in Working Capital +/- Changes in other working capital accounts (2) (420)
Total Free Cash Flow 1,916
(1) Reported net income includes interest expense of $24 million recognized in the first quarter of fiscal 2016.
(2) The majority of estimated tax payments related to the fiscal first quarter are paid in the fiscal second quarter.
(3) Includes changes in client incentives, trade receivable/payable, settlement receivable/payable and personnel incentives.
A-2 Fiscal First Quarter 2016 Financial Results
Serious News for Serious Traders! Try StreetInsider.com Premium Free!
You May Also Be Interested In
- Midday movers: Tesla, Boeing rise; Uber, Old Dominion Freight fall
- PRUVN Reveals Human Clinical Trial Results of Max International's RiboCeine™ Supplementation's Impact on Serum Glutathione Levels
- BMO Capital Reiterates Outperform Rating on Visa (V)
Create E-mail Alert Related Categories
SEC FilingsSign up for StreetInsider Free!
Receive full access to all new and archived articles, unlimited portfolio tracking, e-mail alerts, custom newswires and RSS feeds - and more!
