Form 8-K VALMONT INDUSTRIES INC For: Jan 10
UNITED STATES
SECURITIES AND EXCHANGE COMMISSION
WASHINGTON, DC 20549
FORM 8-K
CURRENT REPORT PURSUANT
TO SECTION 13 OR 15(D) OF THE
SECURITIES EXCHANGE ACT OF 1934
January 10, 2017
Date of report (Date of earliest event reported)
Valmont Industries, Inc.
(Exact Name of Registrant as Specified in Its Charter)
Delaware
(State or Other Jurisdiction of Incorporation)
|
1-31429 |
|
47-0351813 |
|
(Commission File Number) |
|
(IRS Employer Identification No.) |
|
One Valmont Plaza |
|
|
|
Omaha, NE |
|
68154 |
|
(Address of Principal Executive Offices) |
|
(Zip Code) |
(402) 963-1000
(Registrant’s Telephone Number, Including Area Code)
(Former Name or Former Address, if Changed Since Last Report)
Check the appropriate box below if the Form 8-K filing is intended to simultaneously satisfy the filing obligation of the registrant under any of the following provisions (see General Instruction A.2. below):
o Written communications pursuant to Rule 425 under the Securities Act (17 CFR 230.425)
o Soliciting material pursuant to Rule 14a-12 under the Exchange Act (17 CFR 240.14a-12)
o Pre-commencement communications pursuant to Rule 14d-2(b) under the Exchange Act (17 CFR 240.14d-2(b))
o Pre-commencement communications pursuant to Rule 13e-4(c) under the Exchange Act (17 CFR 240.13e-4(c))
Item 7.01. Regulation FD Disclosure
Valmont Industries, Inc. (the “Company”) is furnishing as Exhibit 99.1 to this report an updated slide presentation concerning the Company that may be used at future Company presentations, and that will also be posted on the Company website, www.valmont.com, under “IR Events and Presentations.” Exhibit 99.1 is being furnished in accordance with Regulation FD of the Securities and Exchange Commission.
The information in this Item 7.01 is being furnished and shall not be deemed “filed” for the purpose of Section 18 of the Securities Exchange Act of 1934, as amended, or otherwise subject to the liabilities of that section. The information in this Item 7.01 shall not be incorporated by reference into any registration statement or other document pursuant to the Securities Act of 1933, as amended.
Forward-looking Statement Disclosure
Exhibit 99.1 contains “forward-looking statements” within the meaning of the Private Securities Litigation Reform Act of 1995. Such statements involve known and unknown risks, uncertainties and other factors that could cause the actual results of the Company to differ materially from the results expressed or implied by such statements, including general economic and business conditions, conditions affecting the industries served by the Company and its subsidiaries, conditions affecting the Company’s customers and suppliers, competitor responses to the Company’s products and services, the overall market acceptance of such products and services, the integration of acquisitions and other factors disclosed in the Company’s periodic reports filed with the Securities and Exchange Commission. Consequently such forward-looking statements should be regarded as the Company’s current plans, estimates and beliefs. The Company does not undertake and specifically declines any obligation to publicly release the results of any revisions to these forward-looking statements that may be made to reflect any future events or circumstances after the date of such statements or to reflect the occurrence of anticipated or unanticipated events.
Item 9.01. Financial Statements and Exhibits.
|
(d) |
Exhibits. |
|
|
|
|
99.1 |
Slide Presentation |
SIGNATURES
Pursuant to the requirements of the Securities Exchange Act of 1934, the registrant has duly caused this report to be signed on its behalf by the undersigned hereunto duly authorized.
|
|
Valmont Industries, Inc. | ||
|
Date: January 10, 2017 |
| ||
|
|
|
| |
|
|
By: |
/s/ Mark Jaksich | |
|
|
|
Name: |
Mark Jaksich |
|
|
|
Title: |
Chief Financial Officer |
|
|
| ||
Exhibit 99.1
INVESTOR PRESENTATION

2 These slides contain (and the accompanying oral discussion will contain) “forward-looking statements” within the meaning of the Private Securities Litigation Reform Act of 1995. Such statements involve known and unknown risks, uncertainties and other factors that could cause the actual results of the Company to differ materially from the results expressed or implied by such statements, including general economic and business conditions, conditions affecting the industries served by the Company and its subsidiaries, conditions affecting the Company’s customers and suppliers, competitor responses to the Company’s products and services, the overall market acceptance of such products and services, the integration of acquisitions and other factors disclosed in the Company’s periodic reports filed with the Securities and Exchange Commission. Consequently such forward-looking statements should be regarded as the Company’s current plans, estimates and beliefs. The Company does not undertake and specifically declines any obligation to publicly release the results of any revisions to these forward-looking statements that may be made to reflect any future events or circumstances after the date of such statements or to reflect the occurrence of anticipated or unanticipated events. Forward-looking Statement Disclosure
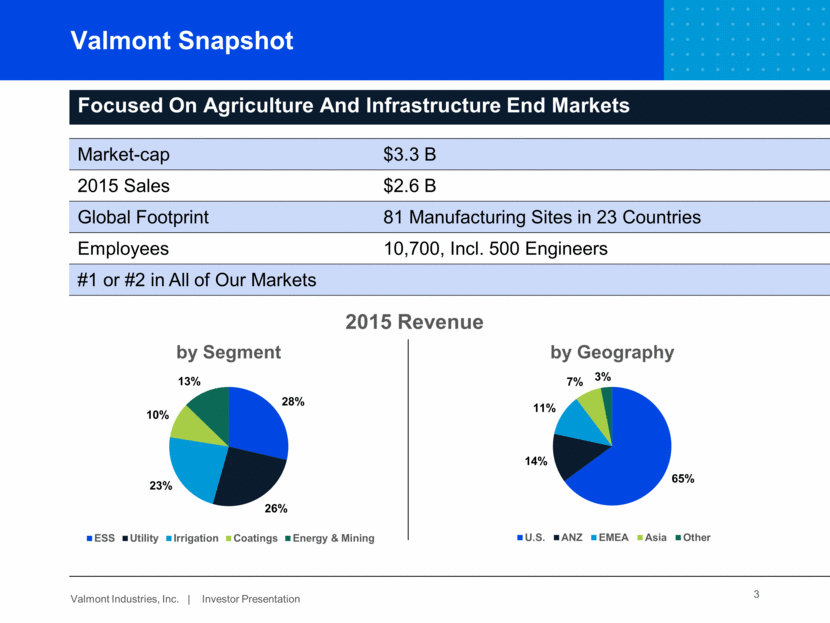
Valmont Snapshot Focused On Agriculture And Infrastructure End Markets Market-cap $3.3 B 2015 Sales $2.6 B Global Footprint 81 Manufacturing Sites in 23 Countries Employees 10,700, Incl. 500 Engineers #1 or #2 in All of Our Markets 2015 Revenue 3 65% 14% 11% 7% 3% by Geography U.S. ANZ EMEA Asia Other 28% 26% 23% 10% 13% by Segment ESS Utility Irrigation Coatings Energy & Mining
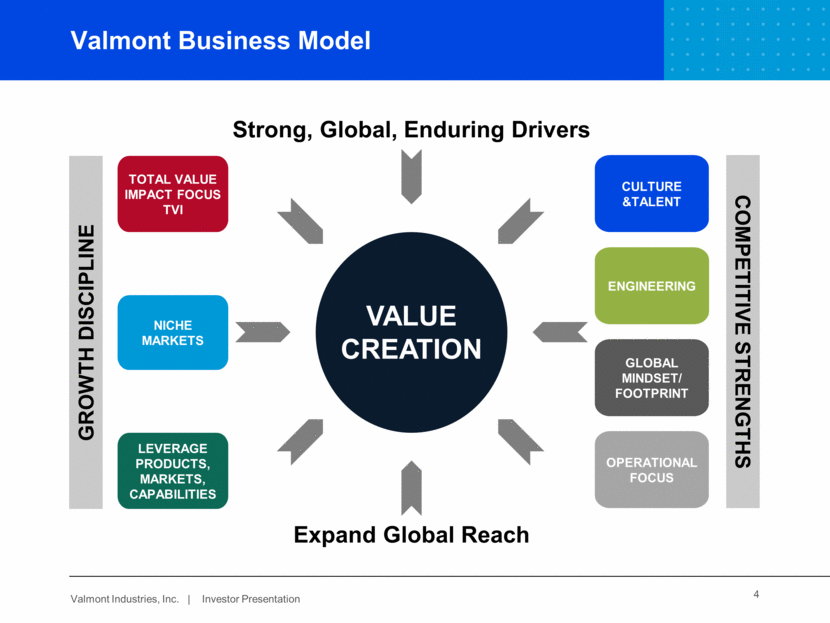
Valmont Business Model TOTAL VALUE IMPACT FOCUS TVI NICHE MARKETS LEVERAGE PRODUCTS, MARKETS, CAPABILITIES GLOBAL MINDSET/ FOOTPRINT ENGINEERING OPERATIONAL FOCUS CULTURE &TALENT GROWTH DISCIPLINE COMPETITIVE STRENGTHS Strong, Global, Enduring Drivers Expand Global Reach VALUE CREATION 4
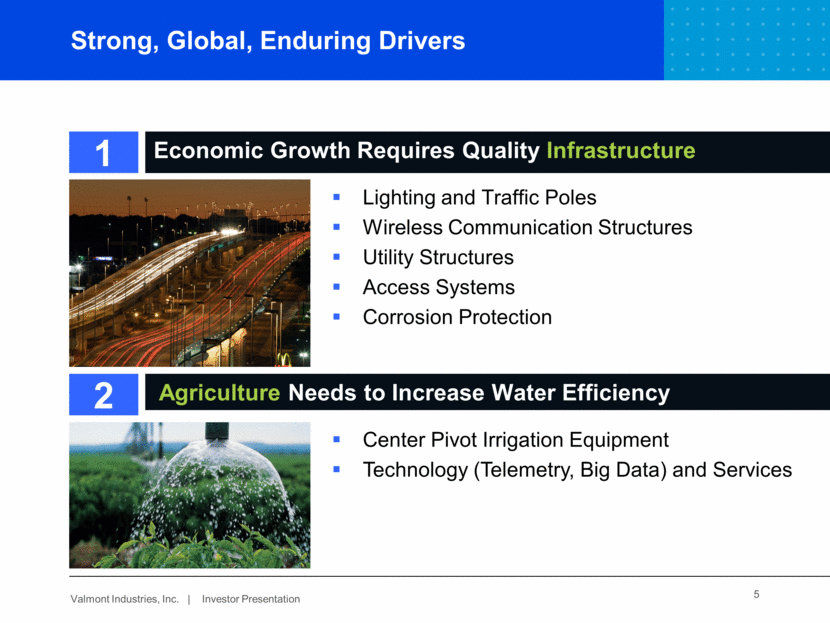
Strong, Global, Enduring Drivers Economic Growth Requires Quality Infrastructure Center Pivot Irrigation Equipment Technology (Telemetry, Big Data) and Services Lighting and Traffic Poles Wireless Communication Structures Utility Structures Access Systems Corrosion Protection Agriculture Needs to Increase Water Efficiency 1 2 5
Valmont Historical Performance 2013 Was Top Of The Cycle For Valmont With $3.3B Revenue And 14.3% Operating Income At The Peak $m 1 Excluding impact of restructuring, impairment and certain non-recurring charges. 2Please see Company’s Reg. G table at end of presentation. 5.0% GAAP (2) (1) 6 $2.0 $2.7 $3.0 $3.3 $3.1 $2.6 9.0% 9.9% 12.6% 14.3% 11.5% 9.1% 0.0% 2.0% 4.0% 6.0% 8.0% 10.0% 12.0% 14.0% 16.0% $- $0.5 $1.0 $1.5 $2.0 $2.5 $3.0 $3.5 2010 2011 2012 2013 2014 2015
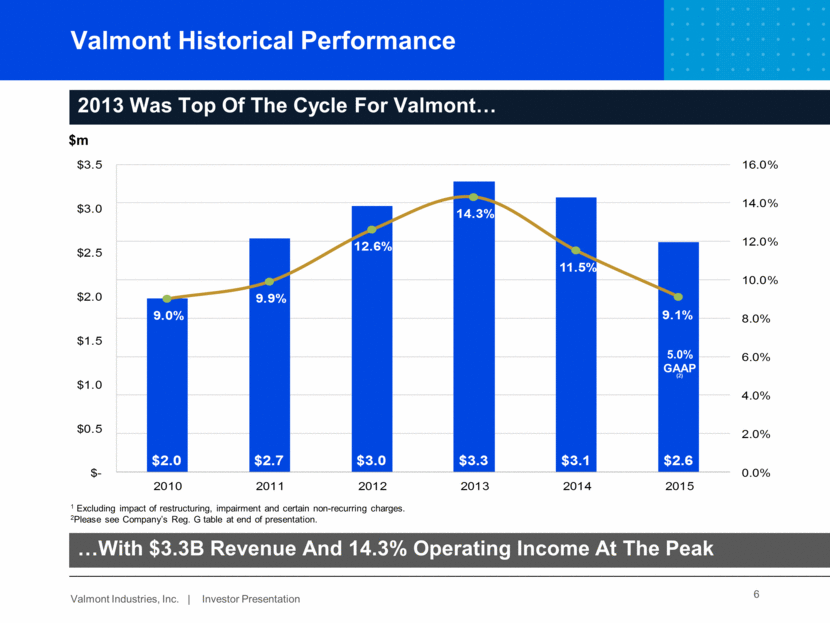
Nine Month Operating Income GAAP 7 Operating Income (in millions) 2015 2016 Yr-Yr Change % of Sales 2015 % of Sales 2016 Engineered Support Structures $45.7 $54.8 19.7% 7.9% 9.4% Utility Support Structures 40.3 48.3 20.0% 8.0% 10.8% Coatings 22.0 37.1 68.7% 9.7% 17.4% Energy & Mining 2.8 9.2 233.5% 1.1% 3.9% Irrigation 76.2 70.8 (7.2%) 16.1% 16.1% Other (3.8) - Corporate (34.5) (32.7) Consolidated Operating Income $148.7 $187.4 26.0% 7.5% 10.1%
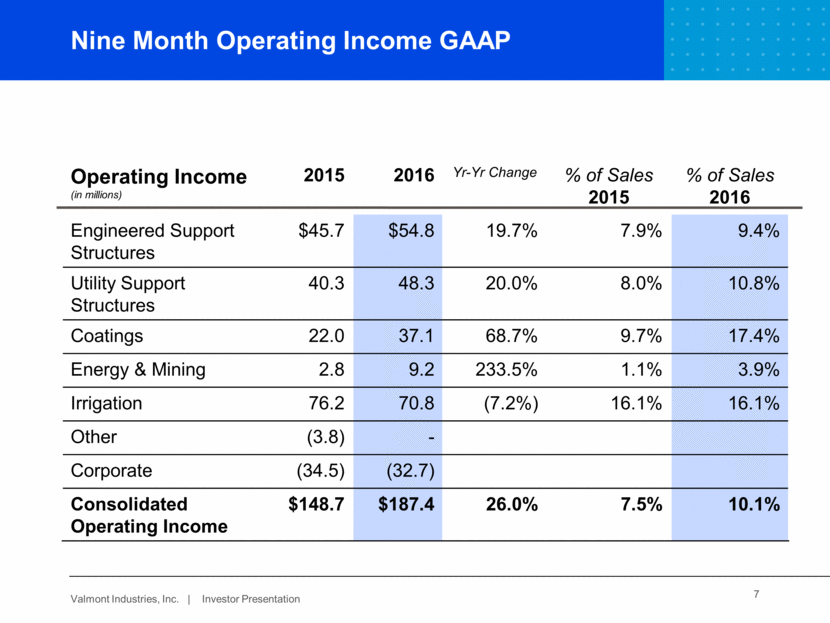
Nine Month Operating Income Adjusted* 8 Adjusted Operating Income (in millions) 2015 2016 Yr-Yr Change % of Sales 2015 % of Sales 2016 Engineered SupportStructures $51.0 $55.3 8.5% 8.8% 9.5% Utility Support Structures 43.9 48.9 11.3% 8.7% 10.9% Coatings 37.8 37.7 (0.3%) 16.7% 17.6% Energy & Mining 12.4 10.8 (13.0%) 4.8% 4.6% Irrigation 76.6 70.8 (7.6%) 16.1% 16.1% Other (3.8) - Corporate (30.2) (31.0) Consolidated Operating Income $187.7 $192.5 2.5% 9.5% 10.4% * See reconciliation of GAAP operating income to adjusted (non-GAAP) figures for 2015 & 2016 at the end of this presentation.
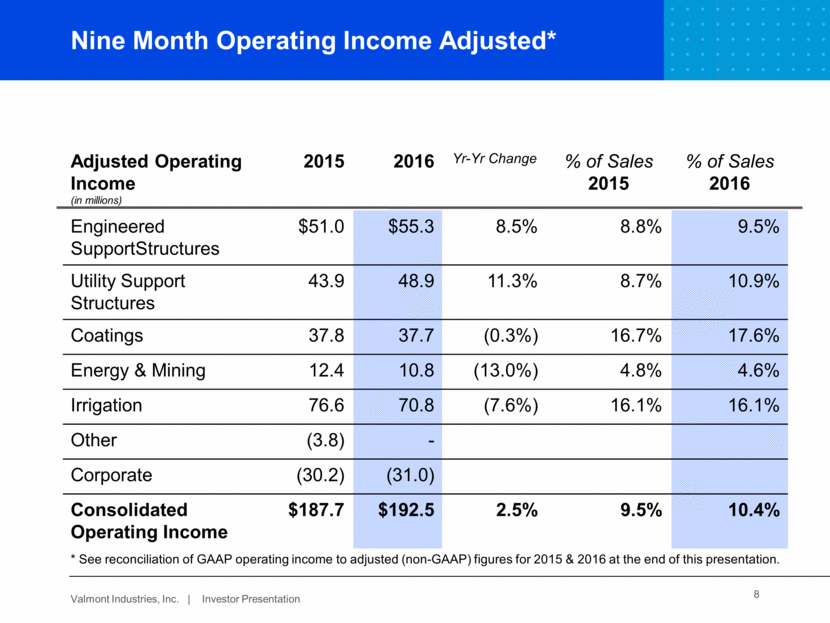
Metric Goal 2011-2015 5 yr. Average Revenue Growth 5-10% 9.2% EPS Growth > 10% 9.5% ROIC > 10% 11.6% Free Cash Flow Conversion > 1.0x net earnings 0.82 Long-term Financial Objectives 9
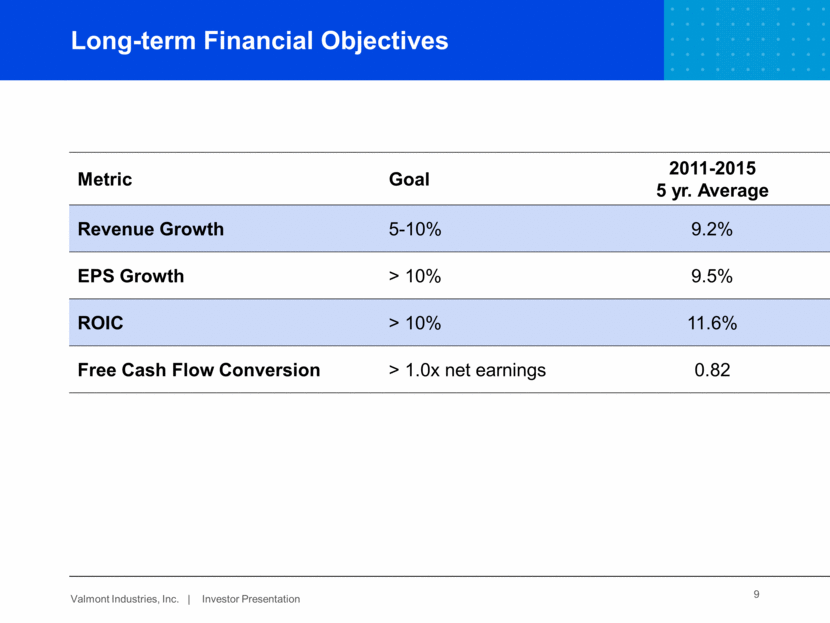
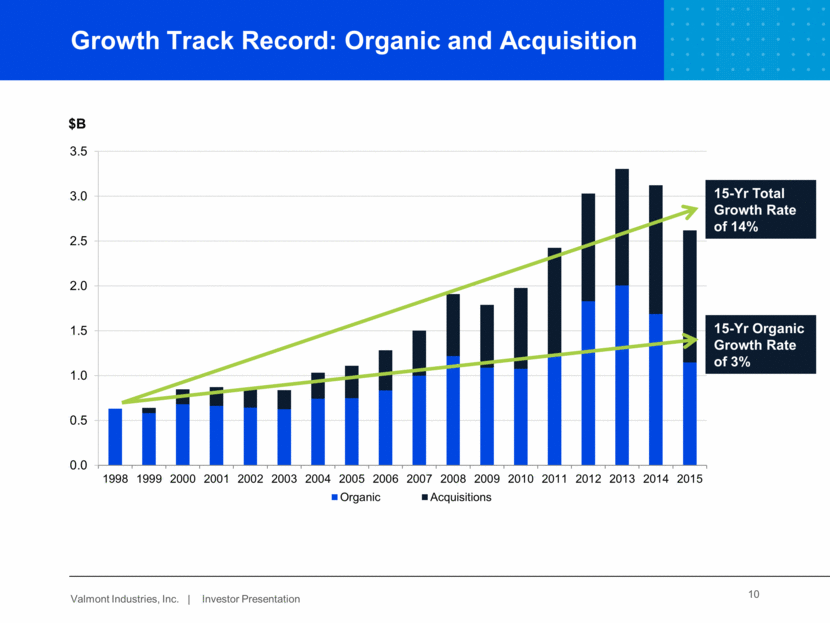
Growth Track Record: Organic and Acquisition $B 15-Yr Total Growth Rate of 14% 15-Yr Organic Growth Rate of 3% 10
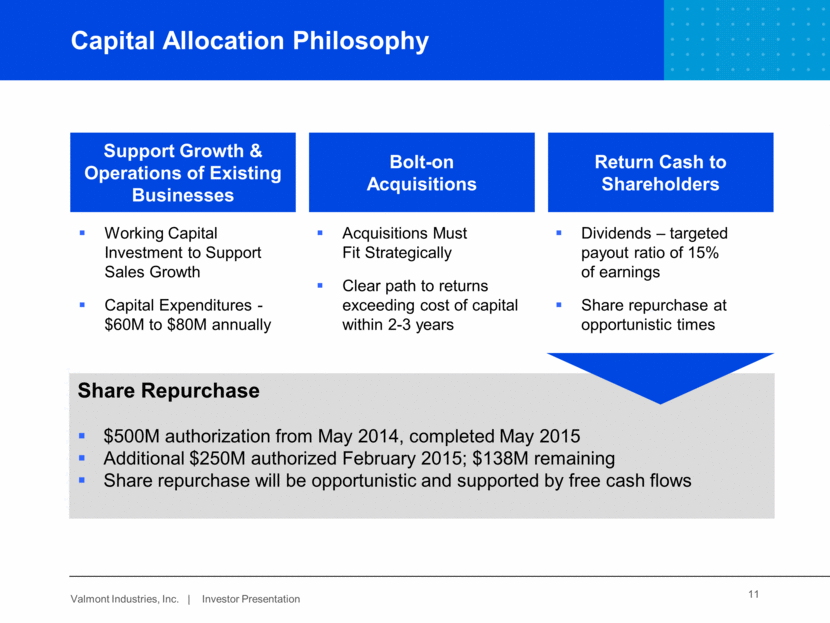
Capital Allocation Philosophy Support Growth & Operations of Existing Businesses Bolt-on Acquisitions Return Cash to Shareholders Working Capital Investment to Support Sales Growth Capital Expenditures - $60M to $80M annually Acquisitions Must Fit Strategically Clear path to returns exceeding cost of capital within 2-3 years Dividends – targeted payout ratio of 15% of earnings Share repurchase at opportunistic times Share Repurchase $500M authorization from May 2014, completed May 2015 Additional $250M authorized February 2015; $138M remaining Share repurchase will be opportunistic and supported by free cash flows 11
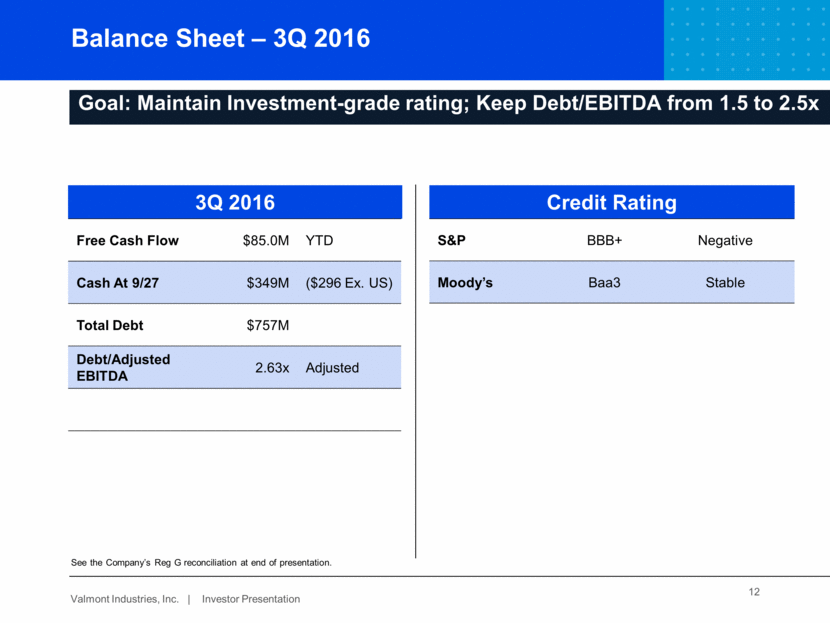
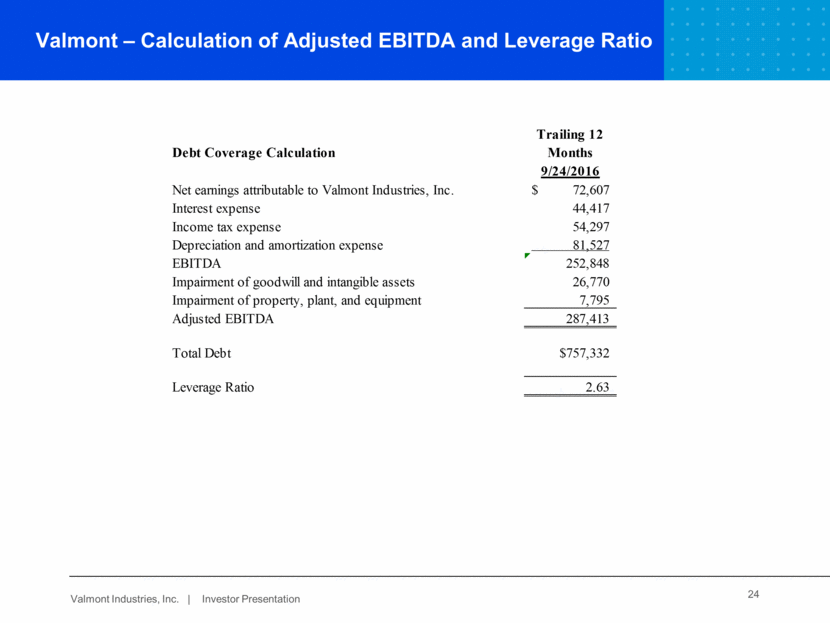
3Q 2016 Credit Rating Balance Sheet – 3Q 2016 Goal: Maintain Investment-grade rating; Keep Debt/EBITDA from 1.5 to 2.5x Free Cash Flow $85.0M YTD Cash At 9/27 $349M ($296 Ex. US) Total Debt $757M Debt/Adjusted EBITDA 2.63x Adjusted S&P BBB+ Negative Moody’s Baa3 Stable See the Company’s Reg G reconciliation at end of presentation. 12
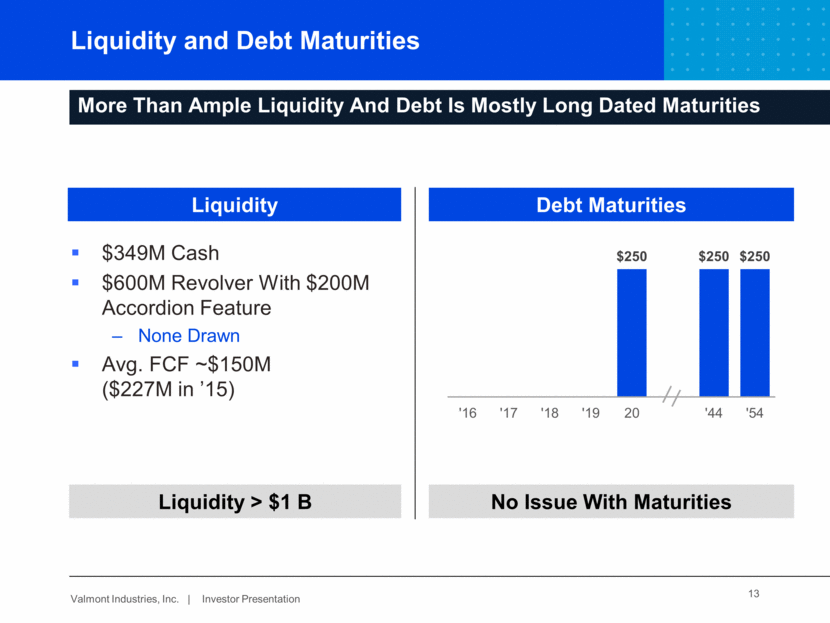
$349M Cash $600M Revolver With $200M Accordion Feature None Drawn Avg. FCF ~$150M ($227M in ’15) More Than Ample Liquidity And Debt Is Mostly Long Dated Maturities Liquidity and Debt Maturities Liquidity > $1 B No Issue With Maturities Liquidity Debt Maturities 13 $250 $250 $250 '16 '17 '18 '19 20 '44 '54
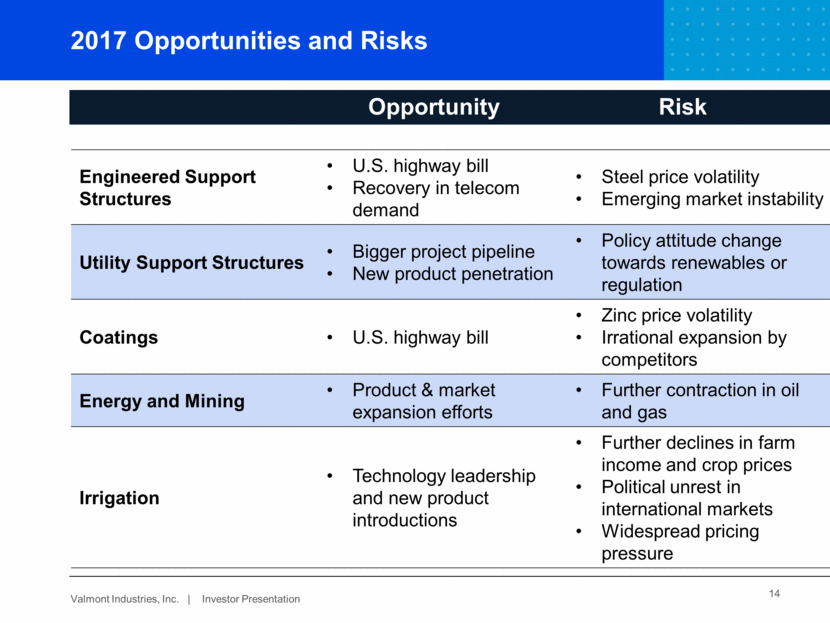
14 Opportunity Risk 2017 Opportunities and Risks Engineered Support Structures U.S. highway bill Recovery in telecom demand Steel price volatility Emerging market instability Utility Support Structures Bigger project pipeline New product penetration Policy attitude change towards renewables or regulation Coatings U.S. highway bill Zinc price volatility Irrational expansion by competitors Energy and Mining Product & market expansion efforts Further contraction in oil and gas Irrigation Technology leadership and new product introductions Further declines in farm income and crop prices Political unrest in international markets Widespread pricing pressure
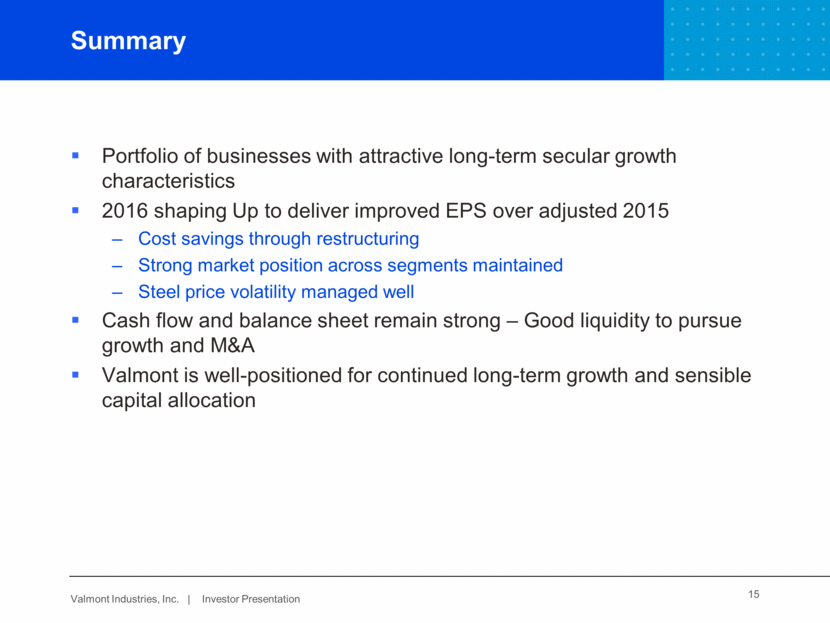
Portfolio of businesses with attractive long-term secular growth characteristics 2016 shaping Up to deliver improved EPS over adjusted 2015 Cost savings through restructuring Strong market position across segments maintained Steel price volatility managed well Cash flow and balance sheet remain strong – Good liquidity to pursue growth and M&A Valmont is well-positioned for continued long-term growth and sensible capital allocation Summary 15
Appendix 16
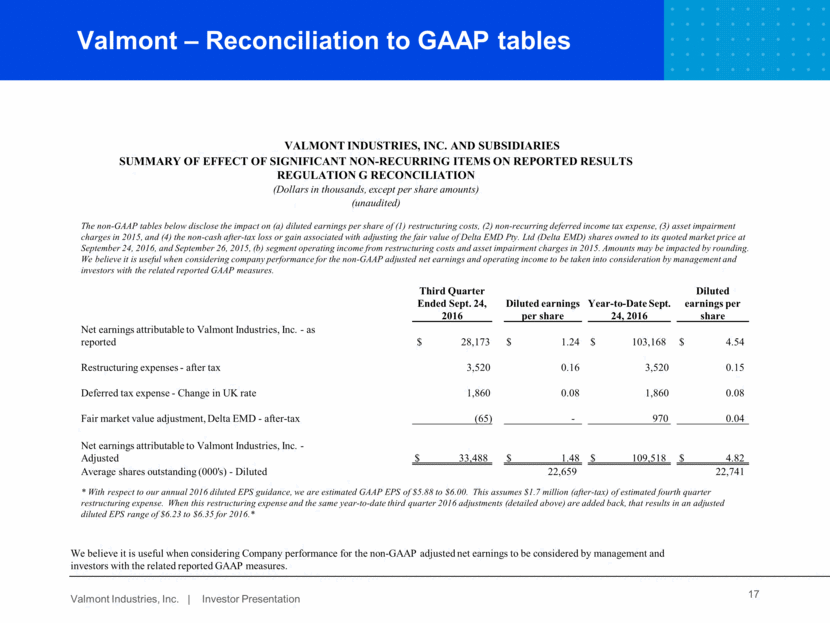
Valmont – Recast 2015 Segment Figures We believe it is useful when considering Company performance for the non-GAAP adjusted net earnings to be considered by management and investors with the related reported GAAP measures. 17 SUMMARY OF EFFECT OF SIGNIFICANT NON-RECURRING ITEMS ON REPORTED RESULTS REGULATION G RECONCILIATION (Dollars in thousands, except per share amounts) (unaudited) The non-GAAP tables below disclose the impact on (a) diluted earnings per share of (1) restructuring costs, (2) non-recurring deferred income tax expense, (3) asset impairment charges in 2015, and (4) the non-cash after-tax loss or gain associated with adjusting the fair value of Delta EMD Pty. Ltd (Delta EMD) shares owned to its quoted market price at September 24, 2016, and September 26, 2015, (b) segment operating income from restructuring costs and asset impairment charges in 2015. Amounts may be impacted by rounding. We believe it is useful when considering company performance for the non-GAAP adjusted net earnings and operating income to be taken into consideration by management and investors with the related reported GAAP measures. Third Quarter Ended Sept. 24, 2016 Diluted earnings per share Year-to-Date Sept. 24, 2016 Diluted earnings per share Net earnings attributable to Valmont Industries, Inc. - as reported $ 28,173 $ 1.24 $ 103,168 $ 4.54 Restructuring expenses - after tax 3,520 0.16 3,520 0.15 Deferred tax expense - Change in UK rate 1,860 0.08 1,860 0.08 Fair market value adjustment, Delta EMD - after-tax (65) - 970 0.04 Net earnings attributable to Valmont Industries, Inc. - Adjusted $ 33,488 $ 1.48 $ 109,518 $ 4.82 Average shares outstanding (000's) - Diluted 22,659 22,741 * With respect to our annual 2016 diluted EPS guidance, we are estimated GAAP EPS of $5.88 to $6.00. This assumes $1.7 million (after-tax) of estimated fourth quarter restructuring expense. When this restructuring expense and the same year-to-date third quarter 2016 adjustments (detailed above) are added back, that results in an adjusted diluted EPS range of $6.23 to $6.35 for 2016.* VALMONT INDUSTRIES, INC. AND SUBSIDIARIES SUMMARY OF EFFECT OF SIGNIFICANT NON-RECURRING ITEMS ON REPORTED RESULTS REGULATION G RECONCILIATION (Dollars in thousands, except per share amounts) (unaudited) The non-GAAP tables below disclose the impact on (a) diluted earnings per share of (1) restructuring costs, (2) non-recurring deferred income tax expense, (3) asset impairment charges in 2015, and (4) the non-cash after-tax loss or gain associated with adjusting the fair value of Delta EMD Pty. Ltd (Delta EMD) shares owned to its quoted market price at September 24, 2016, and September 26, 2015, (b) segment operating income from restructuring costs and asset impairment charges in 2015. Amounts may be impacted by rounding. We believe it is useful when considering company performance for the non-GAAP adjusted net earnings and operating income to be taken into consideration by management and investors with the related reported GAAP measures. Third Quarter Ended Sept. 24, 2016 Diluted earnings per share Year-to-Date Sept. 24, 2016 Diluted earnings per share Net earnings attributable to Valmont Industries, Inc. - as reported $ 28,173 $ 1.24 $ 103,168 $ 4.54 Restructuring expenses - after tax 3,520 0.16 3,520 0.15 Deferred tax expense - Change in UK rate 1,860 0.08 1,860 0.08 Fair market value adjustment, Delta EMD - after-tax (65) - 970 0.04 Net earnings attributable to Valmont Industries, Inc. - Adjusted $ 33,488 $ 1.48 $ 109,518 $ 4.82 Average shares outstanding (000's) - Diluted 22,659 22,741 * With respect to our annual 2016 diluted EPS guidance, we are estimated GAAP EPS of $5.88 to $6.00. This assumes $1.7 million (after-tax) of estimated fourth quarter restructuring expense. When this restructuring expense and the same year-to-date third quarter 2016 adjustments (detailed above) are added back, that results in an adjusted diluted EPS range of $6.23 to $6.35 for 2016.* Valmont – Reconciliation to GAAP tables
18 Third Quarter Ended Sept. 26, 2015 Diluted earnings per share Year-to-Date Sept. 26, 2015 Diluted earnings per share Net earnings attributable to Valmont Industries, Inc. - as reported $ 12,066 $ 0.52 $ 70,678 $ 3.00 Restructuring expenses - after tax 6,310 0.27 16,634 0.71 Impairment of goodwill and trade names - after tax 13,370 0.58 13,370 0.57 Fair market value adjustment, Delta EMD - after-tax 430 0.02 (4) NM Net earnings attributable to Valmont Industries, Inc. - Adjusted $ 32,176 $ 1.39 $ 100,678 $ 4.28 Average shares outstanding (000's) - Diluted 23,170 23,534 Valmont – Reconciliation to GAAP tables (cont)
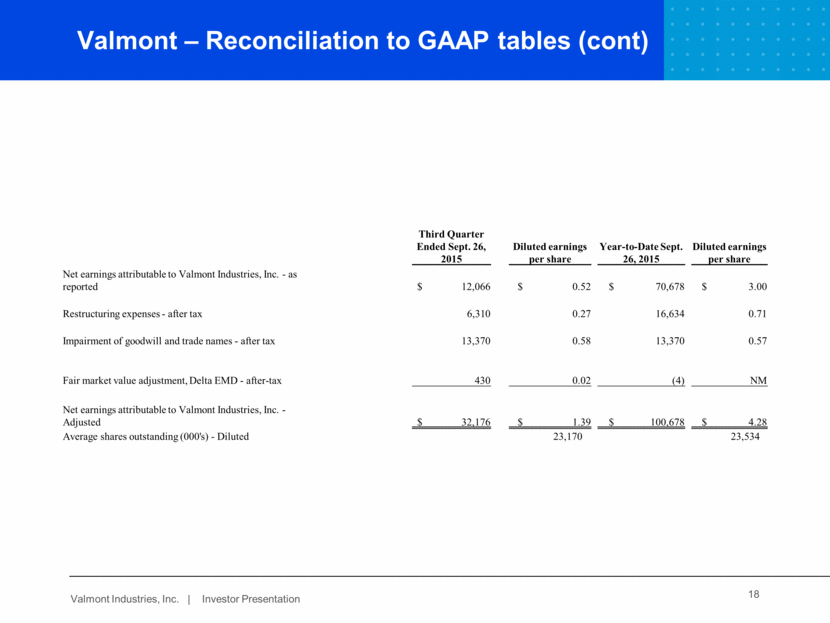
19 For Year-to-Date PeriodEnded Sept. 24, 2016 Segment Operating Income Reconciliation Operating Income- As Reported Restructuring expenses - before tax Adjusted Operating Income Net Sales Engineered Support Structures $ 54,753 $ 587 $ 55,340 $ 584,071 Op Inc. & Adjusted Op Inc. as a % of Sales 9.4% 9.5% Utility Support Structures 48,326 528 48,854 446,432 Op Inc. & Adjusted Op Inc. as a % of Sales 10.8% 10.9% Energy & Mining 9,184 1,610 10,794 234,693 Op Inc. & Adjusted Op Inc. as a % of Sales 3.9% 4.6% Coatings 37,132 545 37,677 213,961 Op Inc. & Adjusted Op Inc. as a % of Sales 17.4% 17.6% Irrigation 70,761 - 70,761 438,575 Op Inc. & Adjusted Op Inc. as a % of Sales 16.1% 16.1% Corporate/Other (32,745) 1,795 (30,950) Consolidated Results $ 187,411 $ 5,065 192,476 $ 1,847,101 Op Inc. & Adjusted Op Inc. as a % of Sales 10.1% 10.4% Valmont – Reconciliation to GAAP tables (cont)
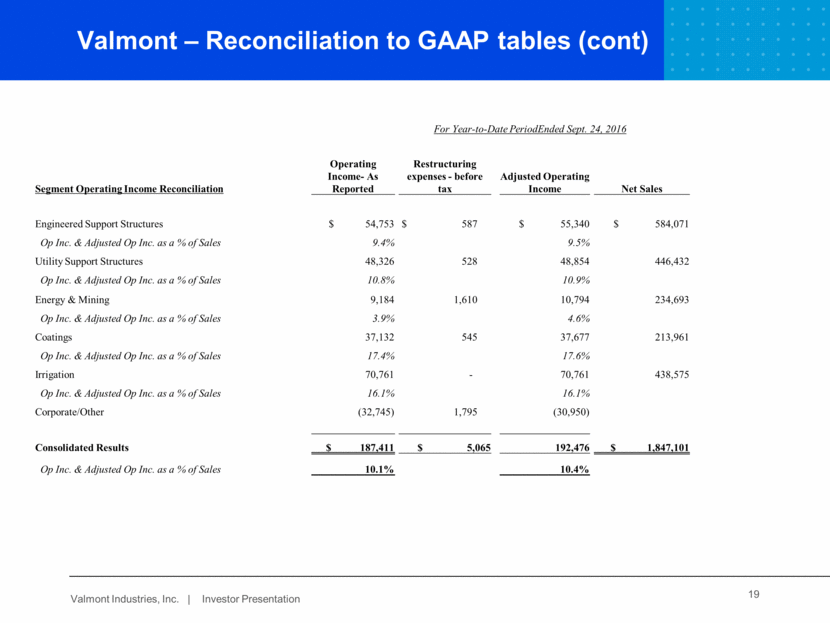
20 For Year-to-Date PeriodEnded Sept. 26, 2015 Segment Operating Income Reconciliation Operating Income- As Reported Restructuring expenses - before tax Impairment of goodwill and TM - before tax Adjusted Operating Income Net Sales Engineered Support Structures $ 45,742 $ 5,210 $ - $ 50,952 $ 578,070 Op Inc. & Adjusted Op Inc. as a % of Sales 7.9% 8.8% Utility Support Structures 40,261 3,614 - 43,875 503,954 Op Inc. & Adjusted Op Inc. as a % of Sales 8.0% 8.7% Energy & Mining 2,762 4,625 5,000 12,387 259,005 Op Inc. & Adjusted Op Inc. as a % of Sales 1.1% 4.8% Coatings 22,006 $ 5,576 10,200 37,782 226,654 Op Inc. & Adjusted Op Inc. as a % of Sales 9.7% 16.7% Irrigation 76,233 401 - 76,634 474,655 Op Inc. & Adjusted Op Inc. as a % of Sales 16.1% 16.1% Corporate/Other (38,309) 4,418 - (33,891) 6,202 Consolidated Results $ 148,695 $ 23,844 $ 15,200 $ 187,739 $ 1,985,096 Op Inc. & Adjusted Op Inc. as a % of Sales 7.5% 9.5% Valmont – Reconciliation to GAAP tables (cont)
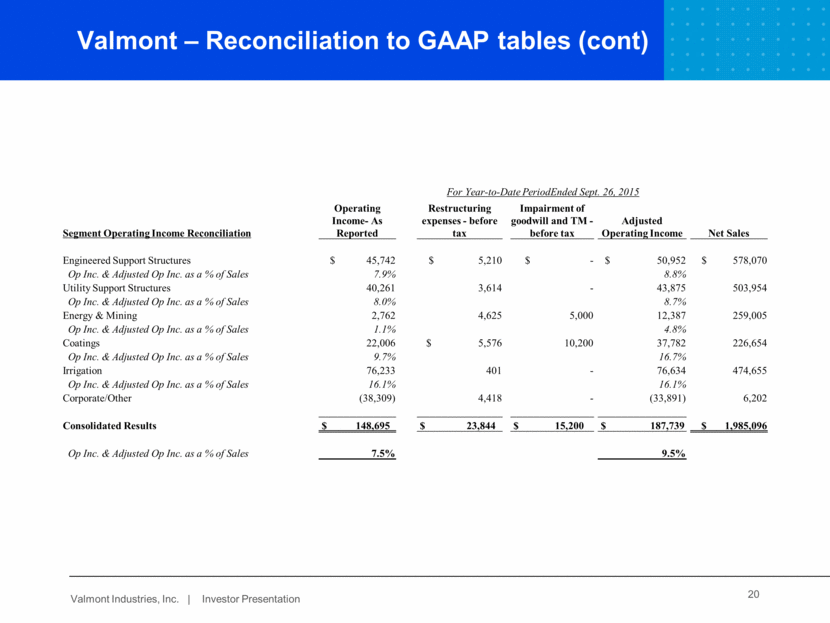
Valmont – Summary of Effect of Significant Non-recurring Items on Reported Full Year 2015 Results 21 We believe it is useful when considering Company performance for the non-GAAP adjusted net earnings to be considered by management and investors with the related reported GAAP measures. NM NM
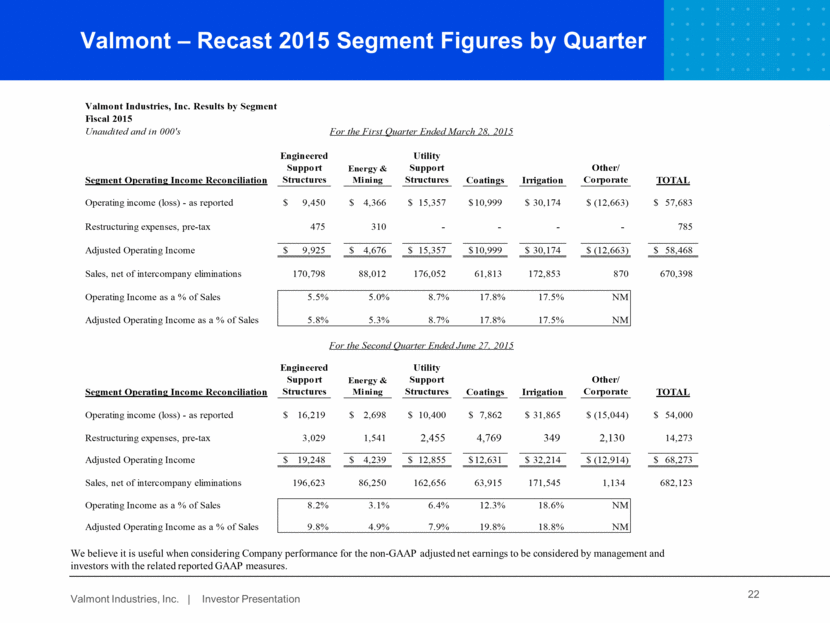
Valmont – Recast 2015 Segment Figures Valmont – Recast 2015 Segment Figures by Quarter We believe it is useful when considering Company performance for the non-GAAP adjusted net earnings to be considered by management and investors with the related reported GAAP measures. 22 Valmont Industries, Inc. Results by Segment Fiscal 2015 Unaudited and in 000's For the First Quarter Ended March 28, 2015 Segment Operating Income Reconciliation Engineered Support Structures Energy & Mining Utility Support Structures Coatings Irrigation Other/ Corporate TOTAL Operating income (loss) - as reported $ 9,450 $ 4,366 $ 15,357 $10,999 $ 30,174 $ (12,663) $ 57,683 Restructuring expenses, pre-tax 475 310 - # - # - - 785 Adjusted Operating Income $ 9,925 $ 4,676 $ 15,357 $10,999 $ 30,174 $ (12,663) $ 58,468 Sales, net of intercompany eliminations 170,798 88,012 176,052 61,813 172,853 870 670,398 Operating Income as a % of Sales 5.5% 5.0% 8.7% 17.8% 17.5% NM Adjusted Operating Income as a % of Sales 5.8% 5.3% 8.7% 17.8% 17.5% NM For the Second Quarter Ended June 27, 2015 Segment Operating Income Reconciliation Engineered Support Structures Energy & Mining Utility Support Structures Coatings Irrigation Other/ Corporate TOTAL Operating income (loss) - as reported $ 16,219 $ 2,698 $ 10,400 $ 7,862 $ 31,865 $ (15,044) $ 54,000 Restructuring expenses, pre-tax 3,029 1,541 2,455 4,769 349 2,130 14,273 Adjusted Operating Income $ 19,248 $ 4,239 $ 12,855 $12,631 $ 32,214 $ (12,914) $ 68,273 Sales, net of intercompany eliminations #NAME? 86,250 #NAME? #NAME? #NAME? #NAME? #NAME? Operating Income as a % of Sales #NAME? 3.1% #NAME? #NAME? #NAME? NM Adjusted Operating Income as a % of Sales #NAME? 4.9% #NAME? #NAME? #NAME? NM
Valmont – Recast 2015 Segment Figures (Cont.) We believe it is useful when considering Company performance for the non-GAAP adjusted net earnings to be considered by management and investors with the related reported GAAP measures. 23 Unaudited and in 000's For the Third Quarter Ended Sept. 27, 2015 Segment Operating Income Reconciliation Engineered Support Structures Energy & Mining Utility Support Structures Coatings Irrigation Other/ Corporate TOTAL Operating income (loss) - as reported $ 20,072 $ (4,302) $ 14,525 $ 3,148 $ 14,193 $ (10,624) $ 37,012 Restructuring expenses 1,597 2,971 1,159 806 52 2,215 8,800 Impairment of goodwill and trade names - 5,000 - 10,200 - - 15,200 Adjusted Operating Income $ 21,669 $ 3,669 $ 15,684 $14,154 $ 14,245 $ (8,409) $ 61,012 Sales, net of intercompany eliminations #NAME? #NAME? #NAME? #NAME? #NAME? #NAME? #NAME? Operating Income as a % of Sales #NAME? #NAME? #NAME? #NAME? #NAME? NM Adjusted Operating Income as a % of Sales #NAME? #NAME? #NAME? #NAME? #NAME? NM For the Fourth Quarter Ended Dec. 26, 2015 Segment Operating Income Reconciliation Engineered Support Structures Energy & Mining Utility Support Structures Coatings Irrigation Other/ Corporate TOTAL Operating income (loss) - as reported $ 13,850 $(21,523) (2,414) 5,363 8,305 (20,581) $ (17,000) Restructuring expenses 4,159 2,353 1,578 1,005 876 6,038 16,009 Other non-recurring charges* - - 17,001 - 7,009 - 24,010 Impairment of goodwill and trade names - 19,640 - 6,530 - 600 26,770 Adjusted Operating Income $ 18,009 $ 470 $ 16,165 $12,898 $ 16,190 $ (13,943) $ 49,789 Sales, net of intercompany eliminations #NAME? #NAME? #NAME? #NAME? #NAME? - 633,828 Operating Income as a % of Sales #NAME? #NAME? #NAME? #NAME? #NAME? NM Adjusted Operating Income as a % of Sales #NAME? #NAME? #NAME? #NAME? #NAME? NM * Other non-recurring charges (pre-tax) are the provision for the Utility commercial settlement and the allowance for doubtful China Irrigation receivable. On an after-tax basis, the line also includes $7.1 million of deferred income tax expense due to a 2% decrease in the U.K. tax rate.

Valmont – Calculation of Adjusted EBITDA and Leverage Ratio Valmont – Calculation of Adjusted EBITDA and Leverage Ratio 24 Debt Coverage Calculation Trailing 12 Months 9/24/2016 Net earnings attributable to Valmont Industries, Inc. $ 72,607 Interest expense 44,417 Income tax expense 54,297 Depreciation and amortization expense 81,527 EBITDA 252,848 Impairment of goodwill and intangible assets 26,770 Impairment of property, plant, and equipment 7,795 Adjusted EBITDA 287,413 Total Debt $757,332 Leverage Ratio 2.63
INVESTOR PRESENTATION

Serious News for Serious Traders! Try StreetInsider.com Premium Free!
You May Also Be Interested In
- Sysco Declares Increase to Quarterly Dividend
- Dime Community Bancshares Declares Quarterly Cash Dividend for Series A Preferred Stock
- Celestica Announces Election of Directors and Approval to Proceed with Share Reclassification
Create E-mail Alert Related Categories
SEC FilingsSign up for StreetInsider Free!
Receive full access to all new and archived articles, unlimited portfolio tracking, e-mail alerts, custom newswires and RSS feeds - and more!


 Tweet
Tweet Share
Share