Form 8-K US BANCORP \DE\ For: May 16
UNITED STATES
SECURITIES AND EXCHANGE COMMISSION
WASHINGTON, D.C. 20549
FORM 8-K
CURRENT REPORT
PURSUANT TO SECTION 13 OR 15(d)
OF THE SECURITIES EXCHANGE ACT OF 1934
Date of Report: May 16, 2016
(Date of earliest event reported)
U.S. BANCORP
(Exact name of registrant as specified in its charter)
Delaware
(State or other jurisdiction of incorporation)
| 1-6880 | 41-0255900 | |
| (Commission file number) | (IRS Employer Identification No.) |
800 Nicollet Mall
Minneapolis, Minnesota 55402
(Address of principal executive offices, including zip code)
(651) 466-3000
(Registrant’s telephone number, including area code)
Not Applicable
(Former name or former address, if changed since last report)
Check the appropriate box below if the Form 8-K filing is intended to simultaneously satisfy the filing obligation of the registrant under any of the following provisions:
| ¨ | Written communications pursuant to Rule 425 under the Securities Act (17 CFR 230.425) |
| ¨ | Soliciting material pursuant to Rule 14a-12 under the Exchange Act (17 CFR 240.14a-12) |
| ¨ | Pre-commencement communications pursuant to Rule 14d-2(b) under the Exchange Act (17 CFR 240.14d-2(b)) |
| ¨ | Pre-commencement communications pursuant to Rule 13e-4(c) under the Exchange Act (17 CFR 240.13e-4(c)) |
| Item 7.01 | Regulation FD Disclosure. |
As previously announced, Andrew Cecere, U.S. Bancorp’s President and Chief Operating Officer, and Kathleen A. Rogers, U.S. Bancorp’s Vice Chairman and Chief Financial Officer, will make a presentation at the Barclays Americas Select Franchise Conference 2016 in London, England, at 8:30 a.m. local time (2:30 a.m. Central time) on Tuesday, May 17, 2016. A copy of the presentation slides, which will be discussed during the presentation, is attached hereto as Exhibit 99.1. These slides can also be accessed on U.S. Bancorp’s website at usbank.com by clicking on “About U.S. Bank” and then “Webcasts & Presentations” under the “Investor/Shareholder Information” heading, which is located at the left side of the bottom of the page. A live audio webcast of the presentation can also be accessed at this location on the website, and a replay of the webcast will be available at the same location on the website and will remain posted for 90 days.
The information in this Current Report on Form 8-K, including Exhibit 99.1 attached hereto, is being furnished and shall not be deemed “filed” for purposes of Section 18 of the Securities Exchange Act of 1934, as amended, or otherwise subject to the liabilities of that Section. The information in this Current Report on Form 8-K, including Exhibit 99.1 attached hereto, shall not be incorporated by reference into any registration statement or other document pursuant to the Securities Act of 1933, except as otherwise expressly stated in such filing.
| Item 9.01 | Financial Statements and Exhibits. |
(d) Exhibits.
| 99.1 | Barclays Americas Select Franchise Conference 2016 Slides | |
2
SIGNATURE
Pursuant to the requirements of the Securities Exchange Act of 1934, the registrant has duly caused this report to be signed on its behalf by the undersigned hereunto duly authorized.
| U.S. BANCORP | ||
| By: | /s/ James L. Chosy | |
| James L. Chosy | ||
| Executive Vice President and General Counsel | ||
Date: May 16, 2016
3
Barclays Americas Select Franchise Conference 2016 Andy Cecere President and COO May 17, 2016 Kathy Rogers Vice Chairman and CFO Exhibit 99.1
Forward-looking Statements and Additional Information The following information appears in accordance with the Private Securities Litigation Reform Act of 1995: This presentation contains forward-looking statements about U.S. Bancorp. Statements that are not historical or current facts, including statements about beliefs and expectations, are forward-looking statements and are based on the information available to, and assumptions and estimates made by, management as of the date hereof. These forward-looking statements cover, among other things, anticipated future revenue and expenses and the future plans and prospects of U.S. Bancorp. Forward-looking statements involve inherent risks and uncertainties, and important factors could cause actual results to differ materially from those anticipated. A reversal or slowing of the current economic recovery or another severe contraction could adversely affect U.S. Bancorp’s revenues and the values of its assets and liabilities. Global financial markets could experience a recurrence of significant turbulence, which could reduce the availability of funding to certain financial institutions and lead to a tightening of credit, a reduction of business activity, and increased market volatility. Stress in the commercial real estate markets, as well as a downturn in the residential real estate markets, could cause credit losses and deterioration in asset values. In addition, U.S. Bancorp’s business and financial performance is likely to be negatively impacted by recently enacted and future legislation and regulation. U.S. Bancorp’s results could also be adversely affected by deterioration in general business and economic conditions; changes in interest rates; deterioration in the credit quality of its loan portfolios or in the value of the collateral securing those loans; deterioration in the value of securities held in its investment securities portfolio; legal and regulatory developments; litigation; increased competition from both banks and non-banks; changes in customer behavior and preferences; breaches in data security; effects of mergers and acquisitions and related integration; effects of critical accounting policies and judgments; and management’s ability to effectively manage credit risk, market risk, operational risk, compliance risk, strategic risk, interest rate risk, liquidity risk and reputational risk. For discussion of these and other risks that may cause actual results to differ from expectations, refer to U.S. Bancorp’s Annual Report on Form 10-K for the year ended December 31, 2015, on file with the Securities and Exchange Commission, including the sections entitled “Risk Factors” and “Corporate Risk Profile” contained in Exhibit 13, and all subsequent filings with the Securities and Exchange Commission under Sections 13(a), 13(c), 14 or 15(d) of the Securities Exchange Act of 1934. However, factors other than these also could adversely affect U.S. Bancorp’s results, and the reader should not consider these factors to be a complete set of all potential risks or uncertainties. Forward-looking statements speak only as of the date hereof, and U.S. Bancorp undertakes no obligation to update them in light of new information or future events. This presentation includes non-GAAP financial measures to describe U.S. Bancorp’s performance. The calculations of these measures are provided within or in the appendix of the presentation. These disclosures should not be viewed as a substitute for operating results determined in accordance with GAAP, nor are they necessarily comparable to non-GAAP performance measures that may be presented by other companies.
Agenda Overview Business Lines Innovation Financial Management Capital Management 2Q16 Update
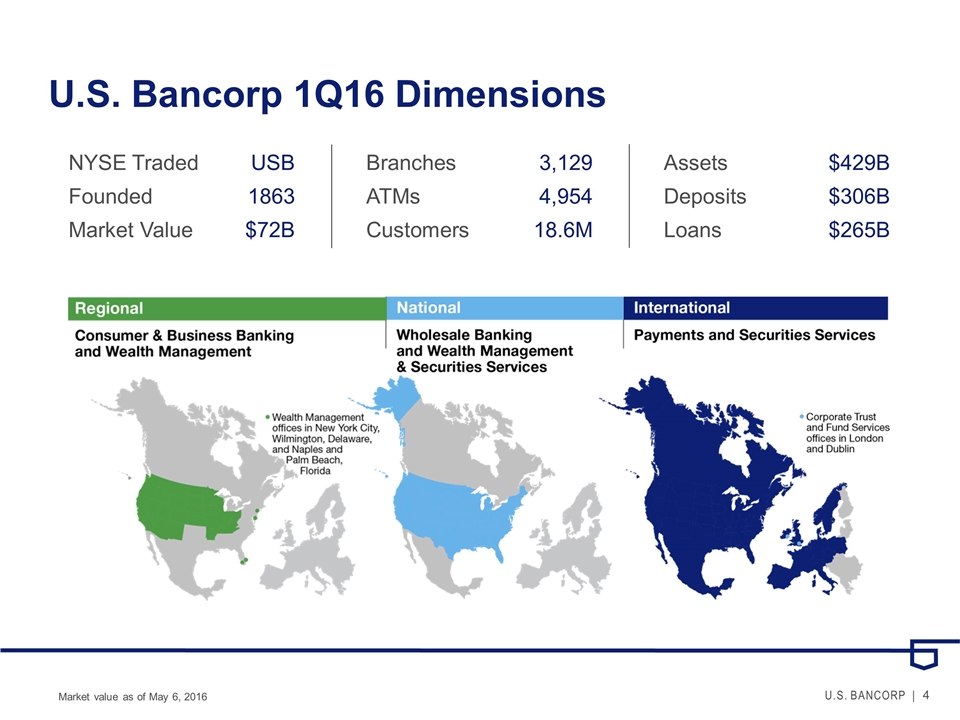
U.S. Bancorp 1Q16 Dimensions Market value as of May 6, 2016 NYSE TradedUSB Founded1863 Market Value$72B Branches3,129 ATMs4,954 Customers18.6M Assets$429B Deposits$306B Loans$265B
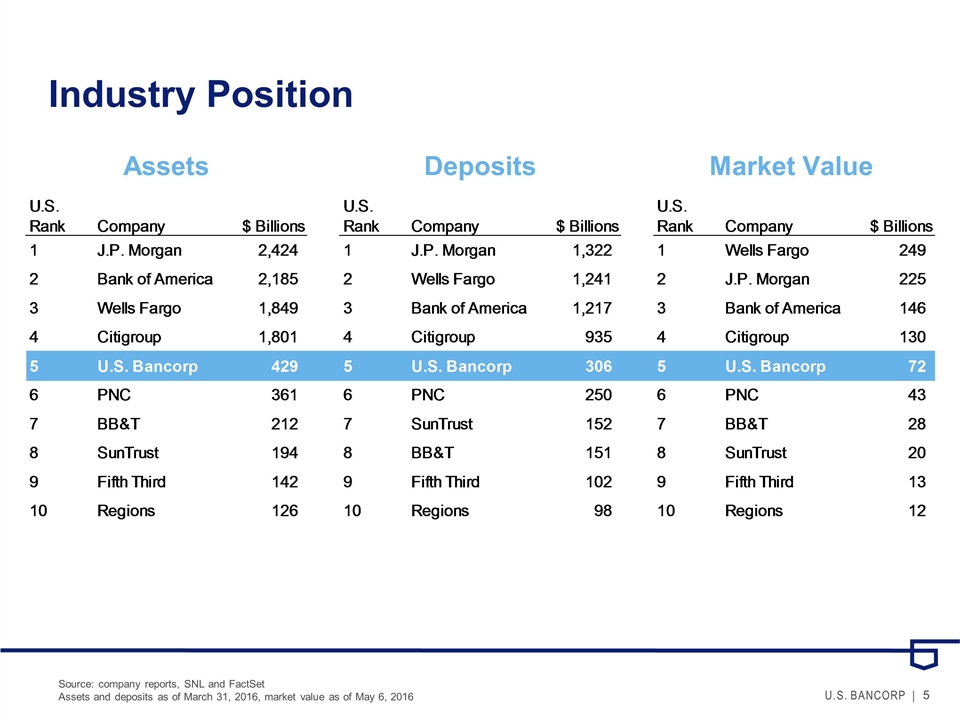
Industry Position Source: company reports, SNL and FactSet Assets and deposits as of March 31, 2016, market value as of May 6, 2016 Assets Market Value Deposits
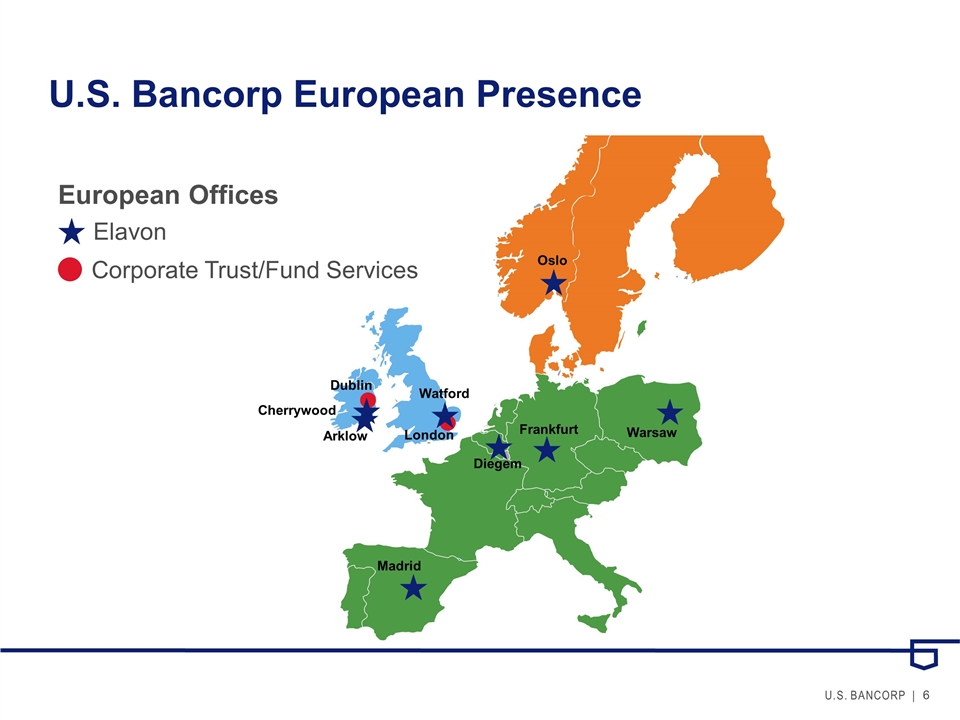
U.S. Bancorp European Presence European Offices Elavon Corporate Trust/Fund Services Cherrywood Dublin Arklow London Diegem Frankfurt Oslo Warsaw Madrid Watford
European Merchant Customers
Agenda Overview Business Lines Innovation Financial Management Capital Management 2Q16 Update
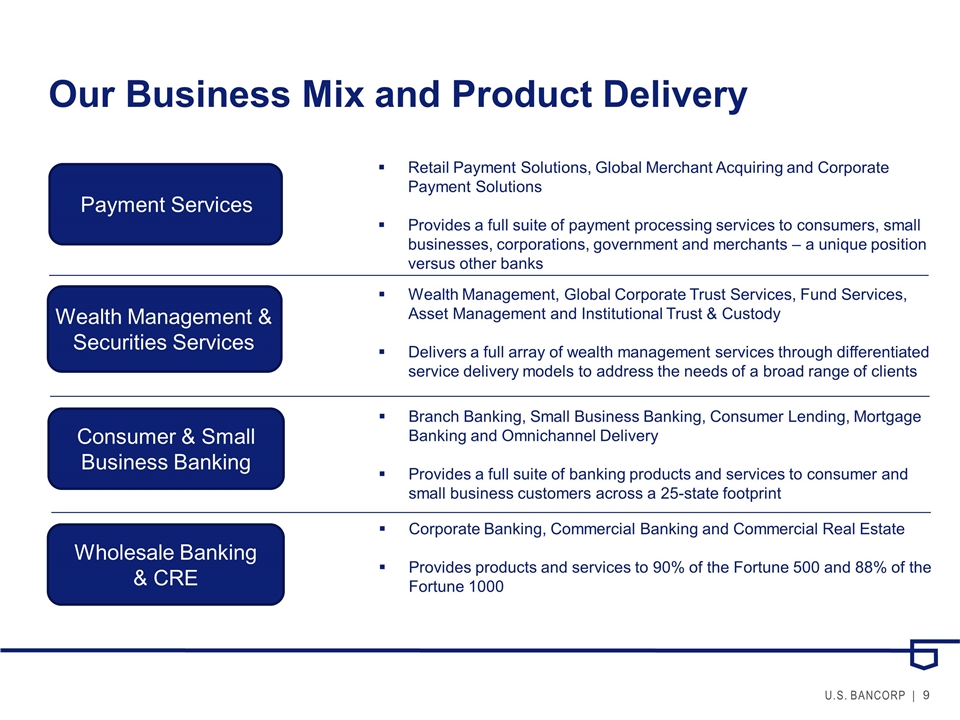
Our Business Mix and Product Delivery Payment Services Wealth Management & Securities Services Retail Payment Solutions, Global Merchant Acquiring and Corporate Payment Solutions Provides a full suite of payment processing services to consumers, small businesses, corporations, government and merchants – a unique position versus other banks Wealth Management, Global Corporate Trust Services, Fund Services, Asset Management and Institutional Trust & Custody Delivers a full array of wealth management services through differentiated service delivery models to address the needs of a broad range of clients Branch Banking, Small Business Banking, Consumer Lending, Mortgage Banking and Omnichannel Delivery Provides a full suite of banking products and services to consumer and small business customers across a 25-state footprint Corporate Banking, Commercial Banking and Commercial Real Estate Provides products and services to 90% of the Fortune 500 and 88% of the Fortune 1000 Wholesale Banking & CRE Consumer & Small Business Banking
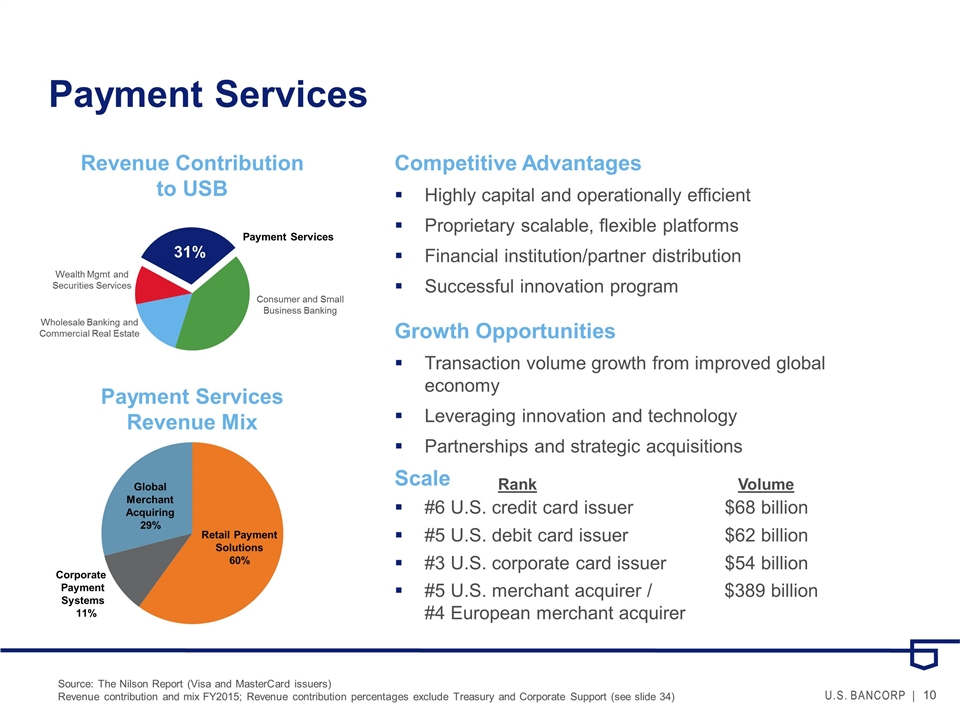
Payment Services Competitive Advantages Highly capital and operationally efficient Proprietary scalable, flexible platforms Financial institution/partner distribution Successful innovation program Scale #6 U.S. credit card issuer$68 billion #5 U.S. debit card issuer$62 billion #3 U.S. corporate card issuer$54 billion #5 U.S. merchant acquirer / $389 billion #4 European merchant acquirer Retail Payment Solutions 60% Global Merchant Acquiring 29% Corporate Payment Systems 11% Revenue Contribution to USB Payment Services Revenue Mix 31% Source: The Nilson Report (Visa and MasterCard issuers) Revenue contribution and mix FY2015; Revenue contribution percentages exclude Treasury and Corporate Support (see slide 34) Consumer and Small Business Banking Wealth Mgmt and Securities Services Wholesale Banking and Commercial Real Estate Payment Services Growth Opportunities Transaction volume growth from improved global economy Leveraging innovation and technology Partnerships and strategic acquisitions Rank Volume
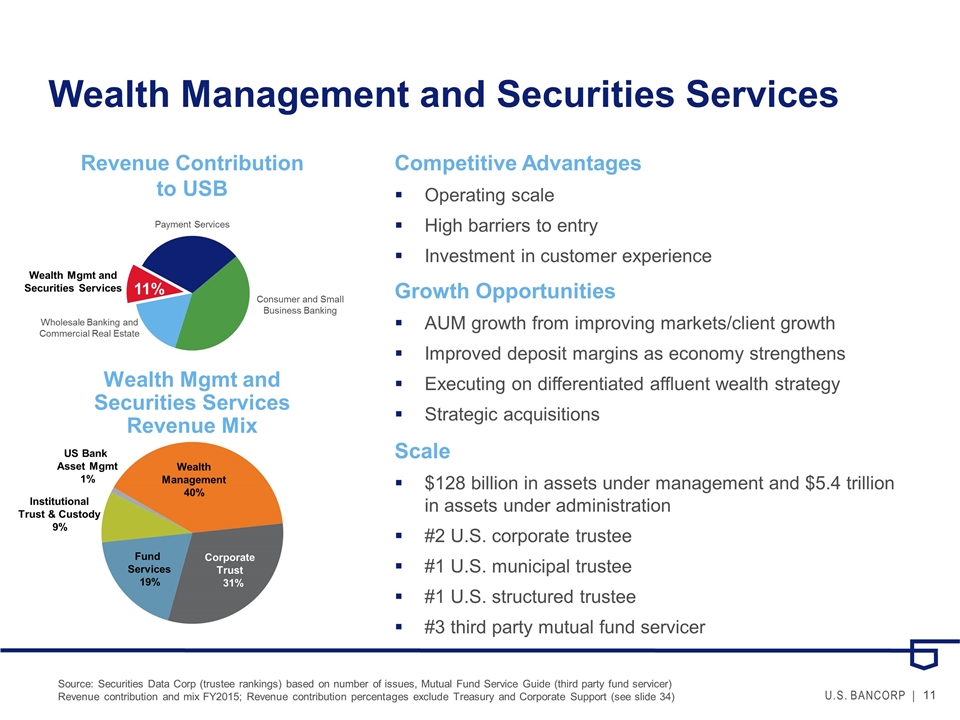
Wealth Management and Securities Services Scale $128 billion in assets under management and $5.4 trillion in assets under administration #2 U.S. corporate trustee #1 U.S. municipal trustee #1 U.S. structured trustee #3 third party mutual fund servicer Wealth Management 40% Fund Services 19% Corporate Trust 31% Revenue Contribution to USB Wealth Mgmt and Securities Services Revenue Mix Source: Securities Data Corp (trustee rankings) based on number of issues, Mutual Fund Service Guide (third party fund servicer) Revenue contribution and mix FY2015; Revenue contribution percentages exclude Treasury and Corporate Support (see slide 34) US Bank Asset Mgmt 1% Institutional Trust & Custody 9% Consumer and Small Business Banking Wealth Mgmt and Securities Services Wholesale Banking and Commercial Real Estate Payment Services 11% Competitive Advantages Operating scale High barriers to entry Investment in customer experience Growth Opportunities AUM growth from improving markets/client growth Improved deposit margins as economy strengthens Executing on differentiated affluent wealth strategy Strategic acquisitions
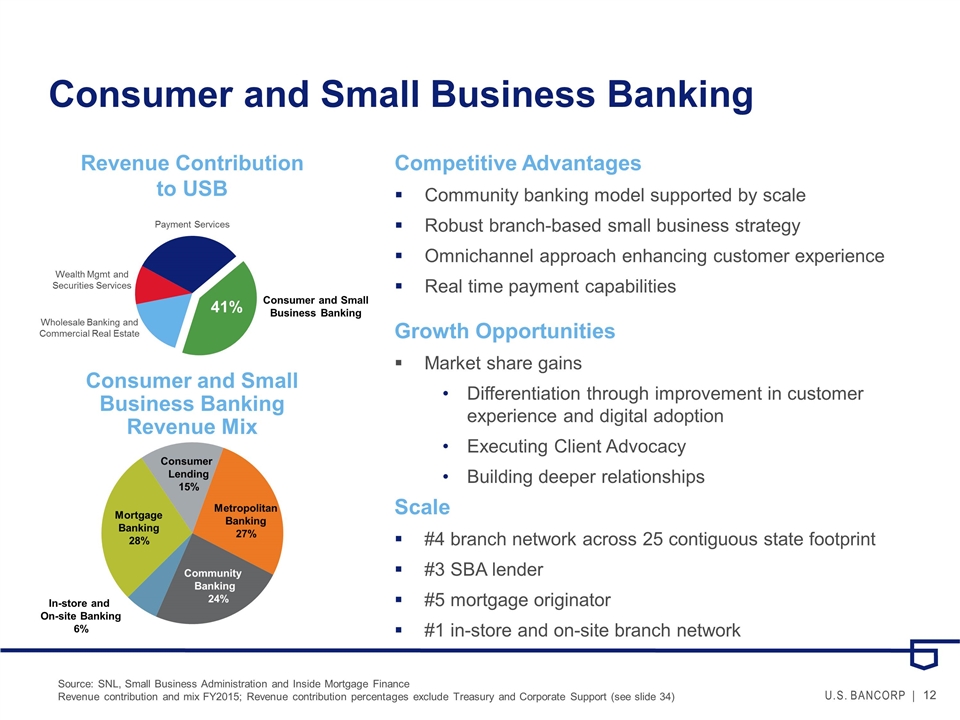
Consumer and Small Business Banking Competitive Advantages Community banking model supported by scale Robust branch-based small business strategy Omnichannel approach enhancing customer experience Real time payment capabilities Scale #4 branch network across 25 contiguous state footprint #3 SBA lender #5 mortgage originator #1 in-store and on-site branch network Mortgage Banking 28% Community Banking 24% Consumer and Small Business Banking Revenue Mix 41% Metropolitan Banking 27% In-store and On-site Banking 6% Consumer Lending 15% Source: SNL, Small Business Administration and Inside Mortgage Finance Revenue contribution and mix FY2015; Revenue contribution percentages exclude Treasury and Corporate Support (see slide 34) Revenue Contribution to USB Consumer and Small Business Banking Wealth Mgmt and Securities Services Wholesale Banking and Commercial Real Estate Payment Services Growth Opportunities Market share gains Differentiation through improvement in customer experience and digital adoption Executing Client Advocacy Building deeper relationships
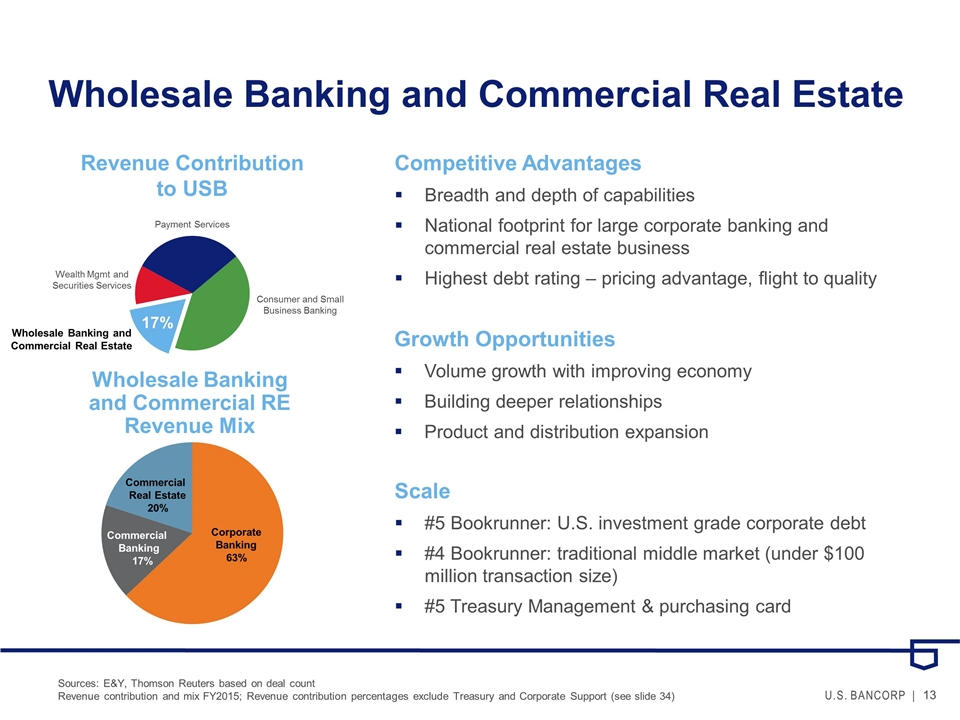
Wholesale Banking and Commercial Real Estate Corporate Banking 63% Commercial Real Estate 20% Commercial Banking 17% Wholesale Banking and Commercial RE Revenue Mix Sources: E&Y, Thomson Reuters based on deal count Revenue contribution and mix FY2015; Revenue contribution percentages exclude Treasury and Corporate Support (see slide 34) Revenue Contribution to USB Consumer and Small Business Banking Wealth Mgmt and Securities Services Wholesale Banking and Commercial Real Estate Payment Services 17% Competitive Advantages Breadth and depth of capabilities National footprint for large corporate banking and commercial real estate business Highest debt rating – pricing advantage, flight to quality Growth Opportunities Volume growth with improving economy Building deeper relationships Product and distribution expansion Scale #5 Bookrunner: U.S. investment grade corporate debt #4 Bookrunner: traditional middle market (under $100 million transaction size) #5 Treasury Management & purchasing card
Agenda Overview Business Lines Innovation Financial Management Capital Management 2Q16 Update
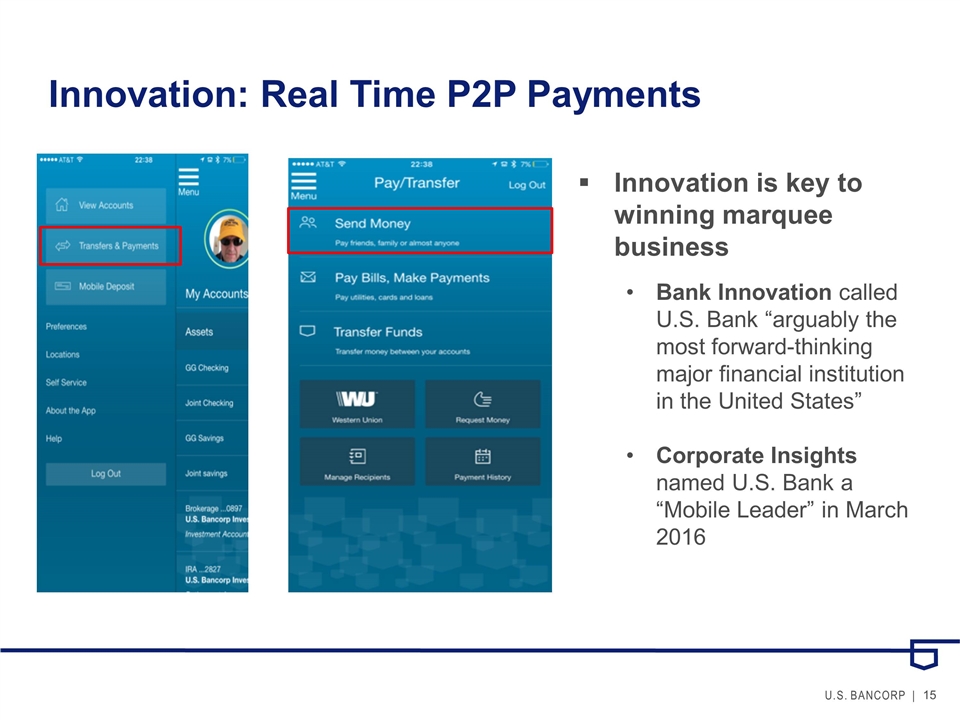
Innovation: Real Time P2P Payments Innovation is key to winning marquee business Bank Innovation called U.S. Bank “arguably the most forward-thinking major financial institution in the United States” Corporate Insights named U.S. Bank a “Mobile Leader” in March 2016
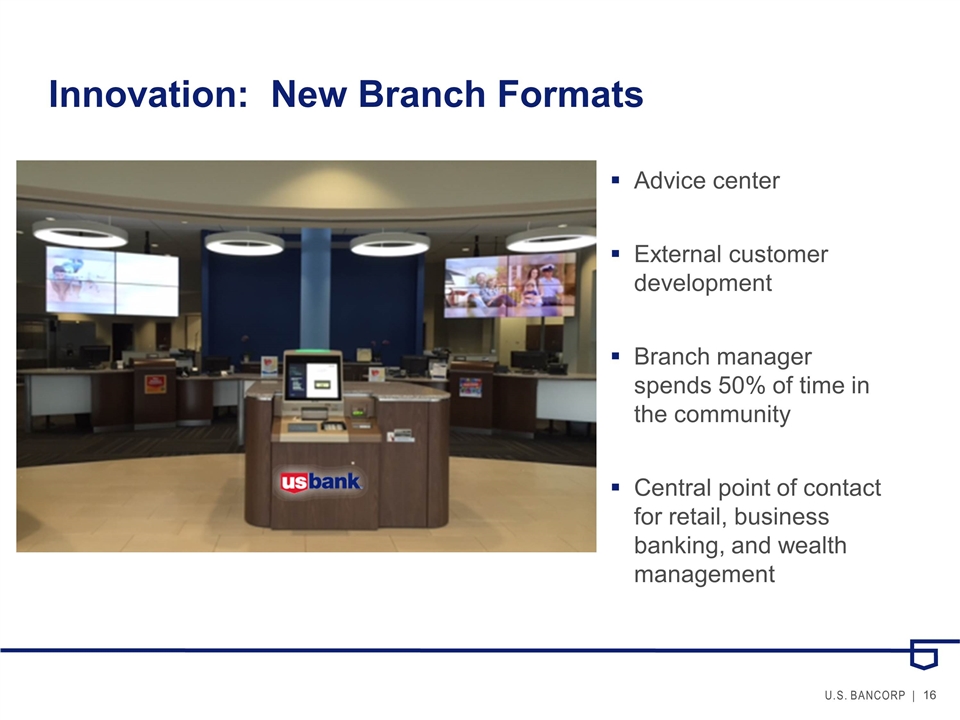
Innovation: New Branch Formats Advice center External customer development Branch manager spends 50% of time in the community Central point of contact for retail, business banking, and wealth management

Innovation: Aviation Fuel Payments MSA Pay is the first mobile app in the general aviation space Simple, secure and efficient cardless payments for fueling, catering and other services Enables paperless approval and invoicing Awarded for uniqueness, value, “stickiness,” ease of use and “wow” factor
Agenda Overview Business Lines Innovation Financial Management Capital Management 2Q16 Update
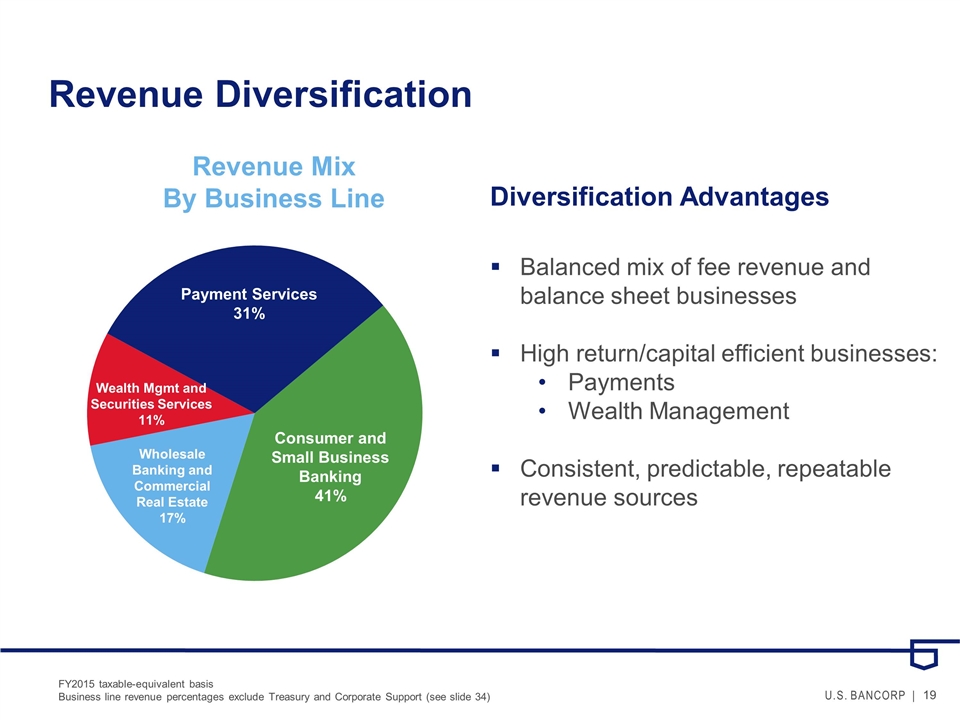
Revenue Diversification Revenue Mix By Business Line Consumer and Small Business Banking 41% Payment Services 31% Wealth Mgmt and Securities Services 11% Wholesale Banking and Commercial Real Estate 17% FY2015 taxable-equivalent basis Business line revenue percentages exclude Treasury and Corporate Support (see slide 34) Diversification Advantages Balanced mix of fee revenue and balance sheet businesses High return/capital efficient businesses: Payments Wealth Management Consistent, predictable, repeatable revenue sources
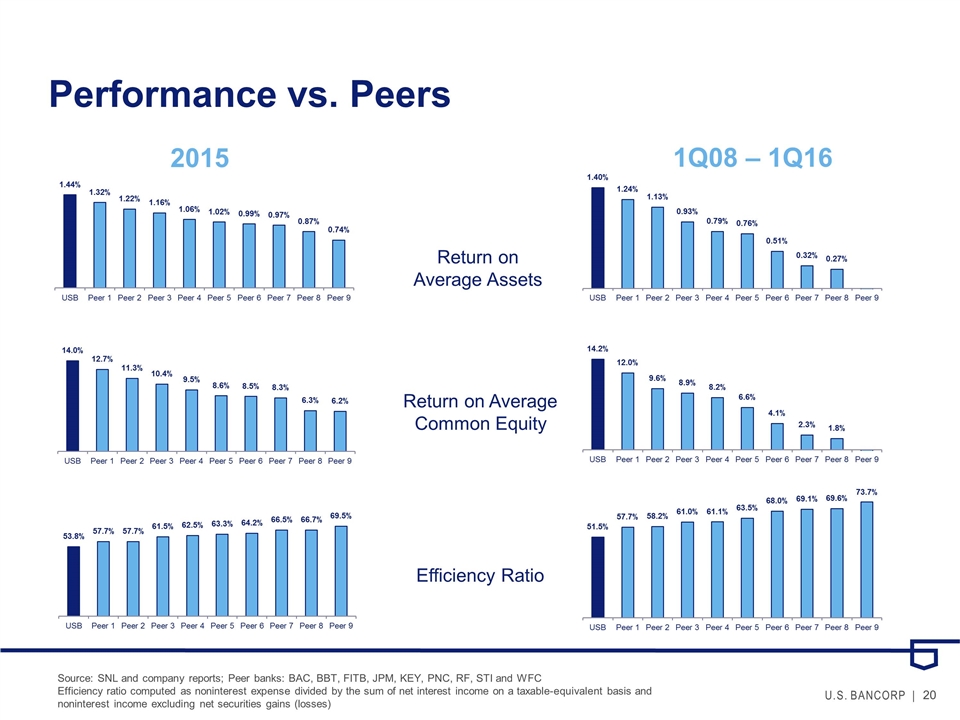
Performance vs. Peers Return on Average Assets Return on Average Common Equity Efficiency Ratio 1Q08 – 1Q16 2015 Source: SNL and company reports; Peer banks: BAC, BBT, FITB, JPM, KEY, PNC, RF, STI and WFC Efficiency ratio computed as noninterest expense divided by the sum of net interest income on a taxable-equivalent basis and noninterest income excluding net securities gains (losses)
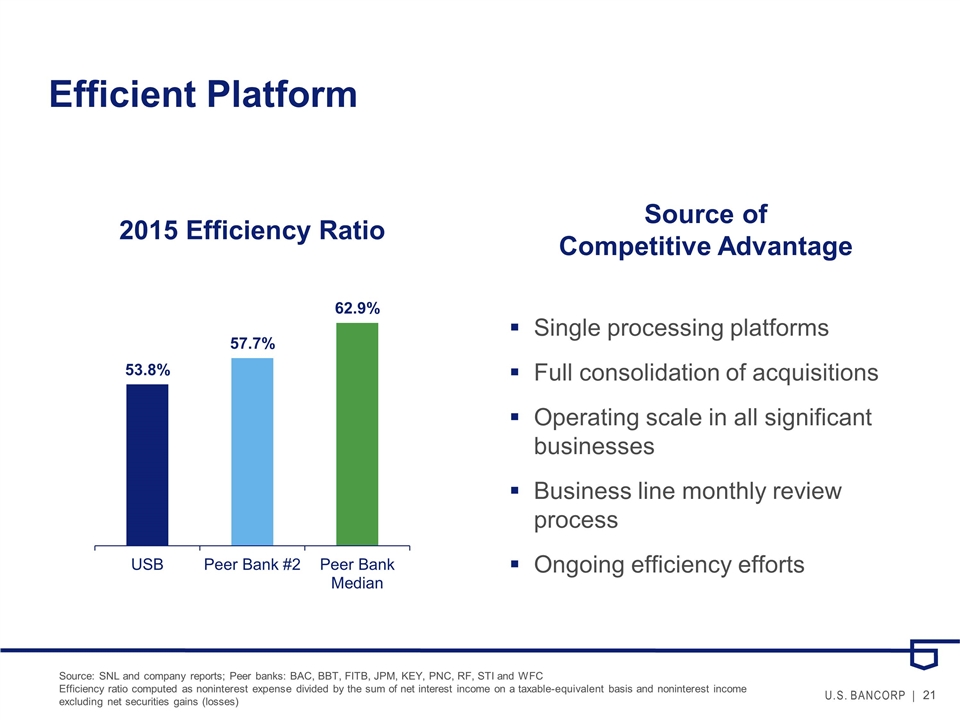
Efficient Platform Single processing platforms Full consolidation of acquisitions Operating scale in all significant businesses Business line monthly review process Ongoing efficiency efforts Source of Competitive Advantage Source: SNL and company reports; Peer banks: BAC, BBT, FITB, JPM, KEY, PNC, RF, STI and WFC Efficiency ratio computed as noninterest expense divided by the sum of net interest income on a taxable-equivalent basis and noninterest income excluding net securities gains (losses)
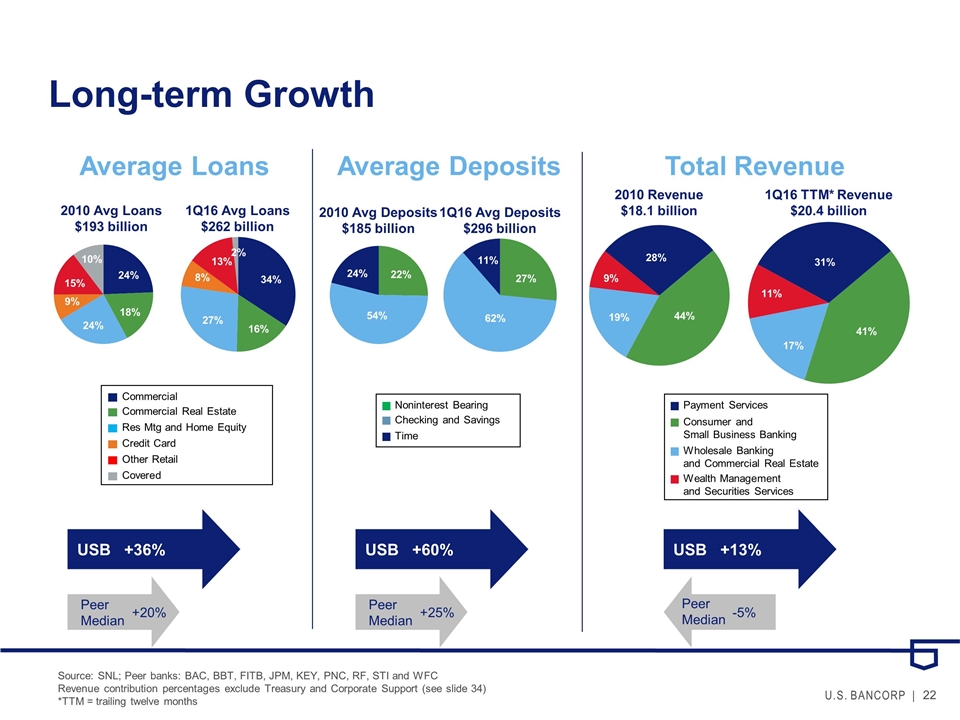
Source: SNL; Peer banks: BAC, BBT, FITB, JPM, KEY, PNC, RF, STI and WFC Revenue contribution percentages exclude Treasury and Corporate Support (see slide 34) *TTM = trailing twelve months Commercial Commercial Real Estate Res Mtg and Home Equity Credit Card Other Retail Covered 2010 Avg Loans $193 billion 1Q16 Avg Loans $262 billion 24% 18% 24% 15% 10% 9% 34% 16% 27% 13% 2% 8% Average Loans Long-term Growth Average Deposits USB +36% Peer Median +20% Total Revenue 2010 Avg Deposits $185 billion 1Q16 Avg Deposits $296 billion 22% 54% 24% 27% 62% 11% Noninterest Bearing Checking and Savings Time USB +60% Peer Median +25% USB +13% Payment Services Consumer and Small Business Banking Wealth Management and Securities Services Wholesale Banking and Commercial Real Estate 2010 Revenue $18.1 billion 1Q16 TTM* Revenue $20.4 billion 19% 9% 28% 44% 17% 11% 31% 41% Peer Median -5%
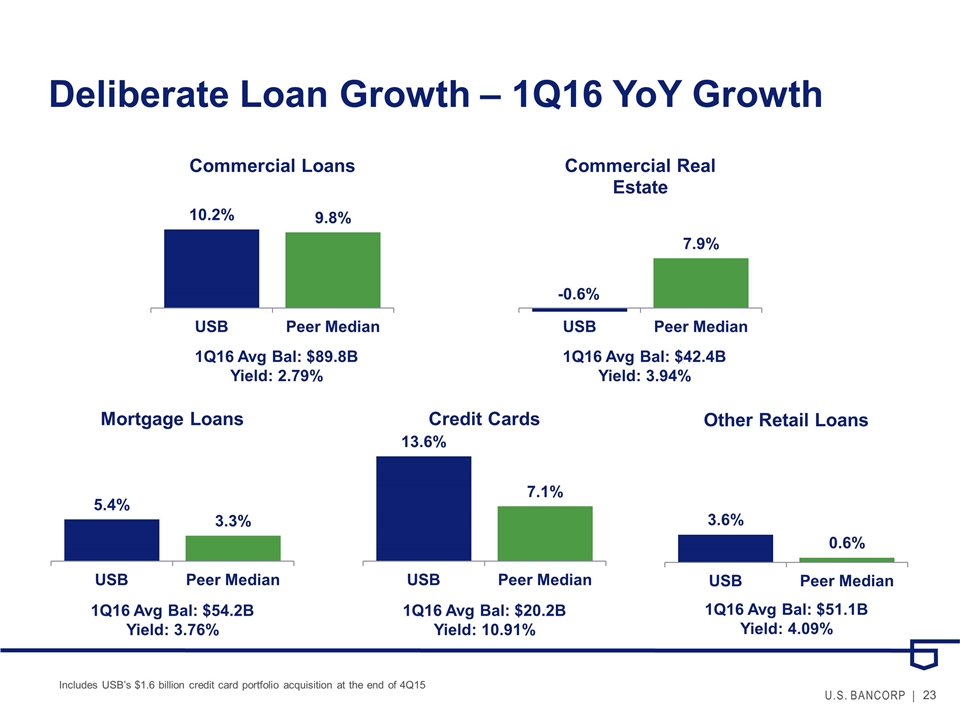
Deliberate Loan Growth – 1Q16 YoY Growth 1Q16 Avg Bal: $89.8B Yield: 2.79% 1Q16 Avg Bal: $42.4B Yield: 3.94% 1Q16 Avg Bal: $54.2B Yield: 3.76% 1Q16 Avg Bal: $20.2B Yield: 10.91% 1Q16 Avg Bal: $51.1B Yield: 4.09% Includes USB’s $1.6 billion credit card portfolio acquisition at the end of 4Q15

Net Interest Income & Margin Net Interest Income increase driven by: Earning assets increase of 1.4% Higher income from increase in short-term rates Partially offset by fewer days than the previous quarter Flat Net Interest Margin reflects: Higher short-term rates: +2 basis points Other: -2 basis points, principally due to loan mix Linked 2Q16 guidance: Modest increase in net interest income and relatively stable net interest margin Headwinds: loan growth mix, lower long-term rates Tailwinds: earning asset growth, increase in short-term rates $ in millions Linked Quarter 4Q15 1Q16
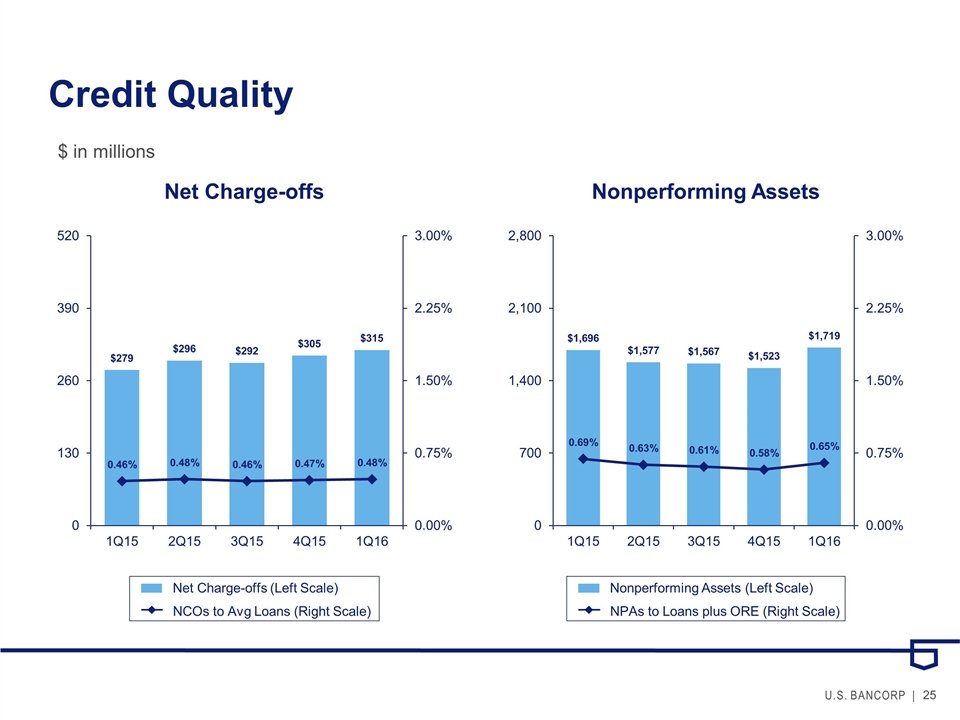
Credit Quality Net Charge-offs Nonperforming Assets Net Charge-offs (Left Scale) NCOs to Avg Loans (Right Scale) Nonperforming Assets (Left Scale) NPAs to Loans plus ORE (Right Scale) $ in millions

Energy Credit Loans by Segment $ in millions, ending balances
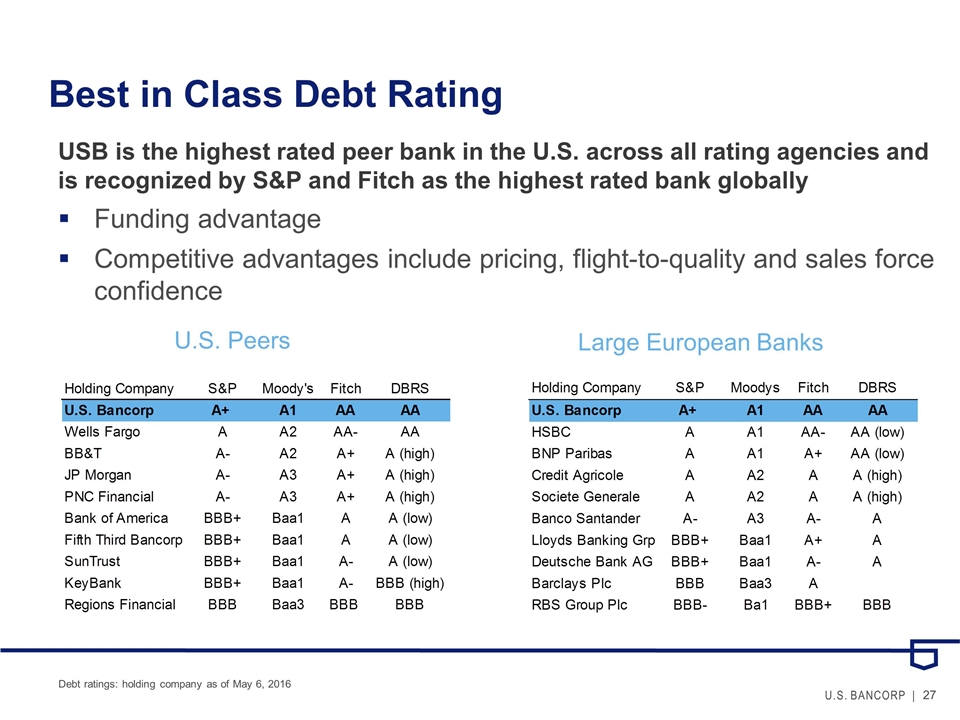
Best in Class Debt Rating Debt ratings: holding company as of May 6, 2016 USB is the highest rated peer bank in the U.S. across all rating agencies and is recognized by S&P and Fitch as the highest rated bank globally Funding advantage Competitive advantages include pricing, flight-to-quality and sales force confidence U.S. Peers Large European Banks
Agenda Overview Business Lines Innovation Financial Management Capital Management 2Q16 Update
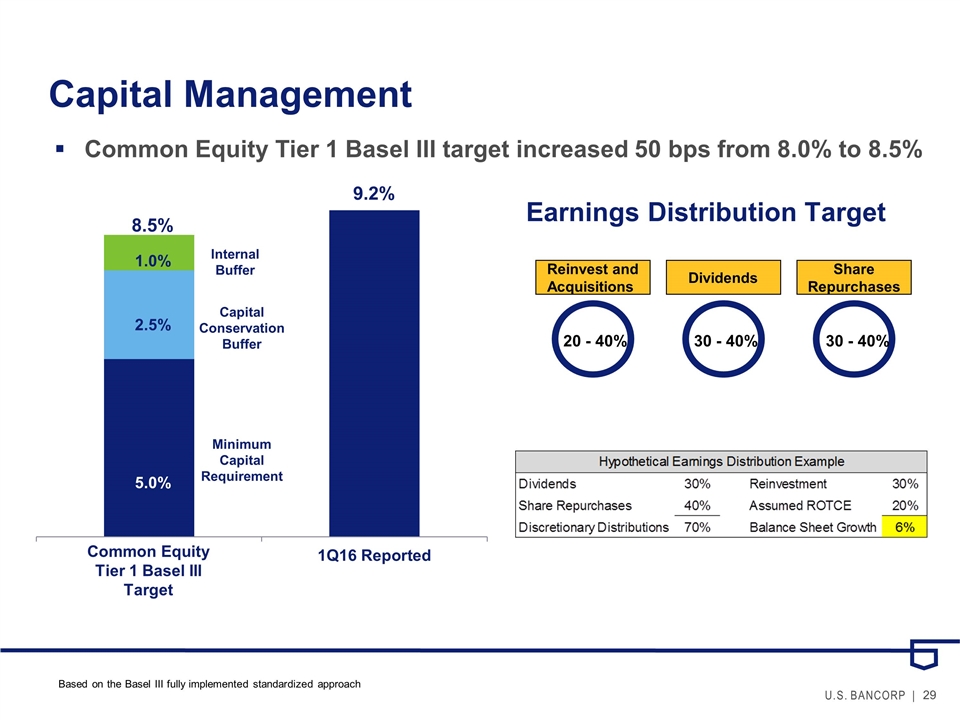
Capital Management Based on the Basel III fully implemented standardized approach Earnings Distribution Target Reinvest and Acquisitions Dividends Share Repurchases 20 - 40% 30 - 40% 30 - 40% Common Equity Tier 1 Basel III target increased 50 bps from 8.0% to 8.5%

Agenda Overview Business Lines Innovation Financial Management Capital Management 2Q16 Update
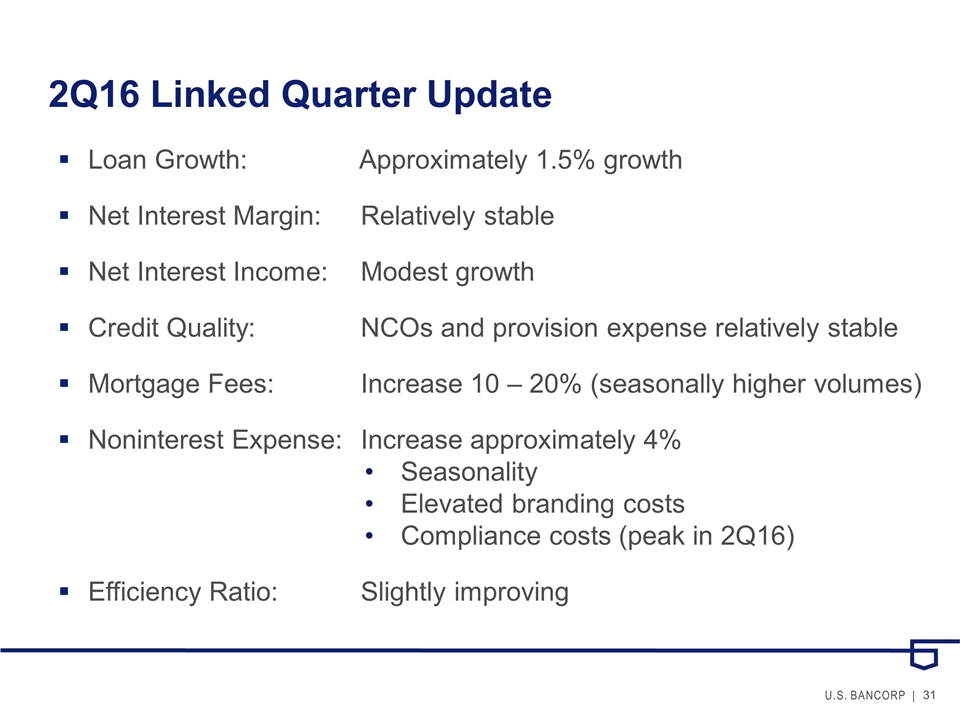
2Q16 Linked Quarter Update Loan Growth: Approximately 1.5% growth Net Interest Margin: Relatively stable Net Interest Income: Modest growth Credit Quality: NCOs and provision expense relatively stable Mortgage Fees: Increase 10 – 20% (seasonally higher volumes) Noninterest Expense: Increase approximately 4% Seasonality Elevated branding costs Compliance costs (peak in 2Q16) Efficiency Ratio: Slightly improving
Appendix
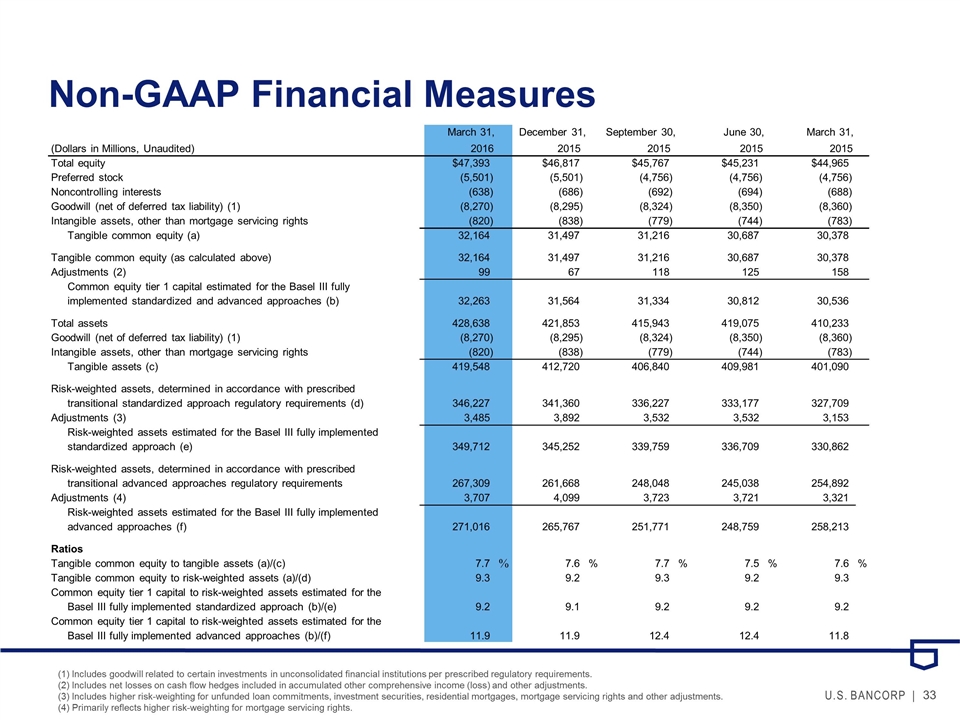
Non-GAAP Financial Measures (1) Includes goodwill related to certain investments in unconsolidated financial institutions per prescribed regulatory requirements. (2) Includes net losses on cash flow hedges included in accumulated other comprehensive income (loss) and other adjustments. (3) Includes higher risk-weighting for unfunded loan commitments, investment securities, residential mortgages, mortgage servicing rights and other adjustments. (4) Primarily reflects higher risk-weighting for mortgage servicing rights. March 31, December 31, September 30, June 30, March 31, (Dollars in Millions, Unaudited) 2016 2015 2015 2015 2015 Total equity $47,393 $46,817 $45,767 $45,231 $44,965 Preferred stock (5,501) (5,501) (4,756) (4,756) (4,756) Noncontrolling interests (638) (686) (692) (694) (688) Goodwill (net of deferred tax liability) (1) (8,270) (8,295) (8,324) (8,350) (8,360) Intangible assets, other than mortgage servicing rights (820) (838) (779) (744) (783) Tangible common equity (a) 32,164 31,497 31,216 30,687 30,378 Tangible common equity (as calculated above) 32,164 31,497 31,216 30,687 30,378 Adjustments (2) 99 67 118 125 158 Common equity tier 1 capital estimated for the Basel III fully implemented standardized and advanced approaches (b) 32,263 31,564 31,334 30,812 30,536 Total assets 428,638 421,853 415,943 419,075 410,233 Goodwill (net of deferred tax liability) (1) (8,270) (8,295) (8,324) (8,350) (8,360) Intangible assets, other than mortgage servicing rights (820) (838) (779) (744) (783) Tangible assets (c) 419,548 412,720 406,840 409,981 401,090 Risk-weighted assets, determined in accordance with prescribed transitional standardized approach regulatory requirements (d) 346,227 341,360 336,227 333,177 327,709 Adjustments (3) 3,485 3,892 3,532 3,532 3,153 Risk-weighted assets estimated for the Basel III fully implemented standardized approach (e) 349,712 345,252 339,759 336,709 330,862 Risk-weighted assets, determined in accordance with prescribed transitional advanced approaches regulatory requirements 267,309 261,668 248,048 245,038 254,892 Adjustments (4) 3,707 4,099 3,723 3,721 3,321 Risk-weighted assets estimated for the Basel III fully implemented advanced approaches (f) 271,016 265,767 251,771 248,759 258,213 Ratios Tangible common equity to tangible assets (a)/(c) 7.7 % 7.6 % 7.7 % 7.5 % 7.6 % Tangible common equity to risk-weighted assets (a)/(d) 9.3 9.2 9.3 9.2 9.3 Common equity tier 1 capital to risk-weighted assets estimated for the Basel III fully implemented standardized approach (b)/(e) 9.2 9.1 9.2 9.2 9.2 Common equity tier 1 capital to risk-weighted assets estimated for the Basel III fully implemented advanced approaches (b)/(f) 11.9 11.9 12.4 12.4 11.8
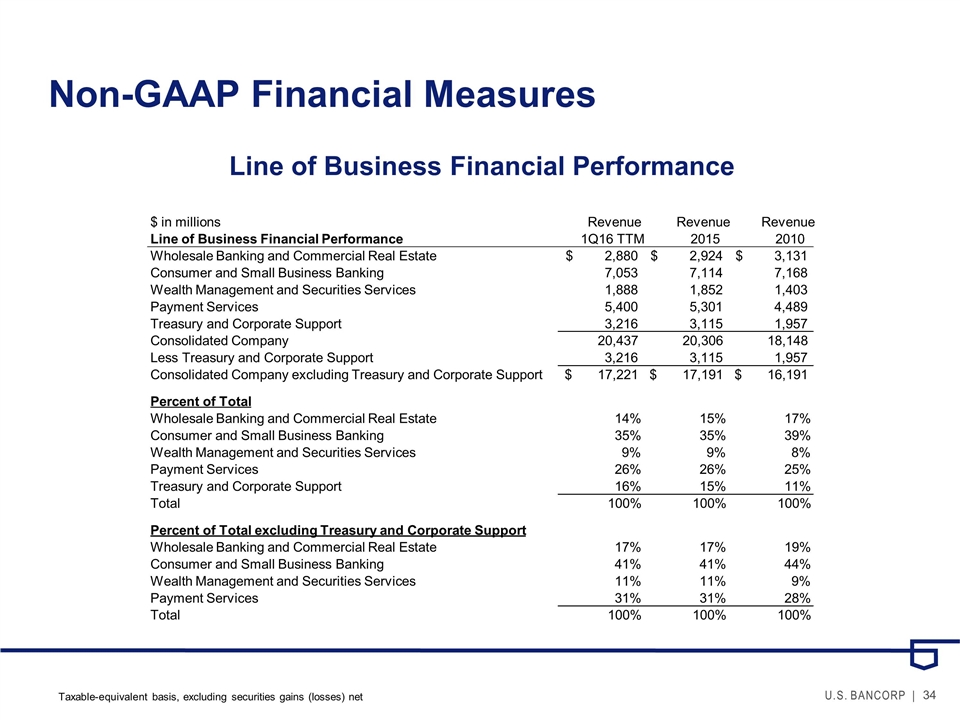
Non-GAAP Financial Measures Line of Business Financial Performance Taxable-equivalent basis, excluding securities gains (losses) net $ in millions Revenue Revenue Revenue Line of Business Financial Performance 1Q16 TTM 2015 x 2010 x Wholesale Banking and Commercial Real Estate 2,880 $ 2,924 $ 3,131 $ Consumer and Small Business Banking 7,053 7,114 7,168 Wealth Management and Securities Services 1,888 1,852 1,403 Payment Services 5,400 5,301 4,489 Treasury and Corporate Support 3,216 3,115 1,957 Consolidated Company 20,437 20,306 18,148 Less Treasury and Corporate Support 3,216 3,115 1,957 Consolidated Company excluding Treasury and Corporate Support 17,221 $ 17,191 $ 16,191 $ Percent of Total Wholesale Banking and Commercial Real Estate 14% 15% 17% Consumer and Small Business Banking 35% 35% 39% Wealth Management and Securities Services 9% 9% 8% Payment Services 26% 26% 25% Treasury and Corporate Support 16% 15% 11% Total 100% 100% 100% Percent of Total excluding Treasury and Corporate Support Wholesale Banking and Commercial Real Estate 17% 17% 19% Consumer and Small Business Banking 41% 41% 44% Wealth Management and Securities Services 11% 11% 9% Payment Services 31% 31% 28% Total 100% 100% 100%
Barclays Americas Select Franchise Conference 2016 May 17, 2016
Serious News for Serious Traders! Try StreetInsider.com Premium Free!
You May Also Be Interested In
- U.S. Bank CFO Survey: Corporate Finance Leaders Tighten Belts Amid Uncertainty
- DiCello Levitt LLP Announces Investor Class Action Lawsuit Filed Against Perion Network Ltd. (Nasdaq: Peri) and Lead Plaintiff Deadline
- ROSEN, NATIONAL TRIAL LAWYERS, Encourages Northern Genesis Acquisition Corp. n/k/a The Lion Electric Company Investors to Secure Counsel Before Important Deadline in Securities Class Action – NGA
Create E-mail Alert Related Categories
SEC FilingsSign up for StreetInsider Free!
Receive full access to all new and archived articles, unlimited portfolio tracking, e-mail alerts, custom newswires and RSS feeds - and more!


 Tweet
Tweet Share
Share