Form 8-K US BANCORP \DE\ For: Jan 18
UNITED STATES
SECURITIES AND EXCHANGE COMMISSION
Washington, D.C. 20549
FORM 8-K
CURRENT REPORT
PURSUANT TO SECTION 13 OR 15(d) OF THE
SECURITIES EXCHANGE ACT OF 1934
Date of Report (Date of earliest event reported): January 18, 2017
U.S. BANCORP
(Exact name of registrant as specified in its charter)
1-6880
(Commission File Number)
| DELAWARE | 41-0255900 | |
| (State or other jurisdiction | (I.R.S. Employer Identification | |
| of incorporation) | Number) |
800 Nicollet Mall
Minneapolis, Minnesota 55402
(Address of principal executive offices and zip code)
(651) 466-3000
(Registrant’s telephone number, including area code)
(not applicable)
(Former name or former address, if changed since last report)
Check the appropriate box below if the Form 8-K filing is intended to simultaneously satisfy the filing obligation of the registrant under any of the following provisions:
| ☐ | Written communications pursuant to Rule 425 Under the Securities Act (17 CFR 230.425) |
| ☐ | Soliciting material pursuant to Rule 14a-12 under the Exchange Act (17 CFR 240.14a-12) |
| ☐ | Pre-commencement communications pursuant to Rule 14d-2(b) under the Exchange Act (17 CFR 240.14d-2(b)) |
| ☐ | Pre-commencement communications pursuant to Rule 13e-4(c) under the Exchange Act (17 CFR 240.13e-4(c)) |
ITEM 2.02 RESULTS OF OPERATIONS AND FINANCIAL CONDITION.
On January 18, 2017, U.S. Bancorp (the “Company”) issued a press release reporting quarter ended December 31, 2016 results, and posted on its website its 4Q16 Earnings Conference Call Presentation, which contains certain additional historical and forward-looking information relating to the Company. The press release is included as Exhibit 99.1 hereto and is incorporated herein by reference. The information included in the press release is considered to be “filed” under the Securities Exchange Act of 1934. The 4Q16 Earnings Conference Call Presentation is included as Exhibit 99.2 hereto and is incorporated herein by reference. The information included in the 4Q16 Earnings Conference Call Presentation is considered to be “furnished” under the Securities Exchange Act of 1934. The press release and 4Q16 Earnings Conference Call Presentation contain forward-looking statements regarding the Company and each includes a cautionary statement identifying important factors that could cause actual results to differ materially from those anticipated.
ITEM 9.01 FINANCIAL STATEMENTS AND EXHIBITS.
(c) Exhibits.
| 99.1 | Press Release issued by U.S. Bancorp on January 18, 2017, deemed “filed” under the Securities Exchange Act of 1934. |
| 99.2 | 4Q16 Earnings Conference Call Presentation, deemed “furnished” under the Securities Exchange Act of 1934. |
SIGNATURES
Pursuant to the requirements of the Securities Exchange Act of 1934, the registrant has duly caused this report to be signed on its behalf by the undersigned hereunto duly authorized.
| U.S. BANCORP |
| By /s/ Craig E. Gifford |
| Craig E. Gifford |
| Executive Vice President and Controller |
DATE: January 18, 2017
Exhibit 99.1

|
News Release | |||||
| Contacts: Dana Ripley Media (612) 303-3167 |
Jennifer Thompson Investors/Analysts (612) 303-0778 |
|||||
U.S. BANCORP REPORTS FOURTH QUARTER AND FULL YEAR 2016 EARNINGS
Record Net Income and Earnings Per Share for the Full Year 2016
Full year return on average assets of 1.36 percent and average common equity of 13.4 percent
Returned 79 percent of full year earnings to shareholders
MINNEAPOLIS, January 18, 2017 — U.S. Bancorp (NYSE: USB) today reported net income of $1,478 million for the fourth quarter of 2016, or $0.82 per diluted common share, compared with $1,476 million, or $0.80 per diluted common share, in the fourth quarter of 2015.
Highlights for the full year of 2016 included:
| • | Record diluted earnings per common share of $3.24, which was 2.5 percent higher than 2015 |
| • | Industry-leading return on average assets of 1.36 percent and average common equity of 13.4 percent |
| • | Returned 79 percent of 2016 earnings to shareholders through dividends and share buybacks |
Highlights for the fourth quarter of 2016 included:
| • | Average total loans grew 1.1 percent on a linked quarter basis and 6.2 percent over the fourth quarter of 2015 |
| • | Average total deposits grew 3.3 percent on a linked quarter basis and 11.8 percent over the fourth quarter of 2015 |
| • | Net interest income (taxable-equivalent basis) grew 2.1 percent on a linked quarter basis and 4.6 percent year-over-year |
| • | Average earning assets grew 2.1 percent on a linked quarter basis and 7.7 percent year-over-year |
| • | Net interest margin of 2.98 percent for the fourth quarter of 2016 was unchanged from the third quarter of 2016, and down 8 basis points from the fourth quarter of 2015, primarily due to changes in the loan and investment portfolio mix and higher average cash balances |
(MORE)
U.S. Bancorp Reports Fourth Quarter 2016 Results
January 18, 2017
Page 2
| • | Noninterest income increased 3.9 percent on a year-over-year basis |
| • | Payment services revenue increased 4.0 percent (5.6 percent excluding the impact of foreign currency rate changes) |
| • | Trust and investment management fees increased 9.5 percent |
| • | Mortgage banking revenue increased 13.7 percent |
| • | Credit quality was stable relative to the third quarter and year-over-year |
| • | Strong capital position. At December 31, 2016, the estimated common equity tier 1 capital to risk-weighted assets ratio was 9.1 percent using the Basel III fully implemented standardized approach and was 11.7 percent using the Basel III fully implemented advanced approaches method. |
| EARNINGS SUMMARY |
Table 1 | |||||||||||||||||||||||||||||||
| ($ in millions, except per-share data) | Percent Change 4Q16 vs 3Q16 |
Percent Change 4Q16 vs 4Q15 |
||||||||||||||||||||||||||||||
| 4Q 2016 |
3Q 2016 |
4Q 2015 |
Full Year 2016 |
Full Year 2015 |
Percent Change |
|||||||||||||||||||||||||||
| Net income attributable to U.S. Bancorp |
$ | 1,478 | $ | 1,502 | $ | 1,476 | (1.6 | ) | .1 | $ | 5,888 | $ | 5,879 | .2 | ||||||||||||||||||
| Diluted earnings per common share |
$ | .82 | $ | .84 | $ | .80 | (2.4 | ) | 2.5 | $ | 3.24 | $ | 3.16 | 2.5 | ||||||||||||||||||
| Return on average assets (%) |
1.32 | 1.36 | 1.41 | 1.36 | 1.44 | |||||||||||||||||||||||||||
| Return on average common equity (%) |
13.1 | 13.5 | 13.7 | 13.4 | 14.0 | |||||||||||||||||||||||||||
| Net interest margin (%) |
2.98 | 2.98 | 3.06 | 3.01 | 3.05 | |||||||||||||||||||||||||||
| Efficiency ratio (%) (a) |
55.3 | 54.5 | 53.9 | 54.9 | 53.8 | |||||||||||||||||||||||||||
| Tangible efficiency ratio (%) (a) |
54.5 | 53.7 | 53.0 | 54.0 | 53.0 | |||||||||||||||||||||||||||
| Dividends declared per common share |
$ | .280 | $ | .280 | $ | .255 | — | 9.8 | $ | 1.070 | $ | 1.010 | 5.9 | |||||||||||||||||||
| Book value per common share (period end) |
$ | 24.63 | $ | 24.78 | $ | 23.28 | (.6 | ) | 5.8 | |||||||||||||||||||||||
| (a) | See Non-GAAP Financial Measures reconciliation on page 21 |
Net income attributable to U.S. Bancorp was $1,478 million for the fourth quarter of 2016, 0.1 percent higher than the $1,476 million for the fourth quarter of 2015, and 1.6 percent lower than the $1,502 million for the third quarter of 2016. Diluted earnings per common share of $0.82 in the fourth quarter of 2016 were $0.02 higher than the fourth quarter of 2015 and $0.02 lower than the third quarter of 2016. The increase in net income year-over-year was principally due to total net revenue growth, including an increase in net interest income of 4.6 percent on a taxable-equivalent basis (4.8 percent as reported on a GAAP basis), mainly a result of loan growth, and an increase in noninterest income of 3.9 percent, driven by higher payment services revenue, trust and investment management fees and mortgage banking revenue. This
(MORE)
U.S. Bancorp Reports Fourth Quarter 2016 Results
January 18, 2017
Page 3
increase was partially offset by higher noninterest expense related to increased compensation expense due to hiring to support business growth and compliance programs as well as merit increases and higher variable compensation expense. The decrease in net income on a linked quarter basis was principally due to a seasonal increase in noninterest expense of 2.5 percent driven by investments in tax-advantaged projects and professional services expense, along with an increase in the provision for credit losses due to loan growth. These increases were partially offset by an increase in total net revenue of 0.9 percent, reflecting an increase in net interest income of 2.1 percent on a taxable-equivalent basis and as reported on a GAAP basis, partially offset by a decrease in noninterest income of 0.6 percent driven by lower mortgage banking revenue.
U.S. Bancorp Chairman and Chief Executive Officer Richard K. Davis said, “U.S. Bancorp delivered an outstanding performance in 2016 with record net income, EPS, and revenue. In a challenging year where the economic environment was often unpredictable, we delivered industry-leading returns, we made important investments in our long-term growth strategy, and we returned 79 percent of our earnings to shareholders through dividends and share buybacks.
“As importantly, the fundamental elements of our core businesses are solid and we are well positioned for growth as we enter 2017. With an intense focus on our customers and providing them with innovative products and services, we are optimistic we will continue to create outstanding value for our shareholders, customers, and communities.
“Our success in 2016 was a result of the tremendous efforts of our 70,000 employees working hard as One U.S. Bank to help our customers build financially secure futures – and they did it with ethics and integrity. For the second year, the Ethisphere Institute named U.S. Bank to its World’s Most Ethical Companies list. For the tenth year, the Ponemon Institute named U.S. Bank the Most Trusted Bank. For the sixth year, FORTUNE magazine named U.S. Bank the number one superregional bank. And for the first time, MONEY magazine named U.S. Bank the Best Big Bank. We are proud of these achievements because they are a reflection of our people and our culture. As usual, you can expect U.S. Bank to deliver consistent, predictable, and repeatable results.”
(MORE)
U.S. Bancorp Reports Fourth Quarter 2016 Results
January 18, 2017
Page 4
| INCOME STATEMENT HIGHLIGHTS |
Table 2 | |||||||||||||||||||||||||||||||
| ($ in millions, except per-share data) | Percent | Percent | ||||||||||||||||||||||||||||||
| Change | Change | |||||||||||||||||||||||||||||||
| 4Q | 3Q | 4Q | 4Q16 vs | 4Q16 vs | Full Year | Full Year | Percent | |||||||||||||||||||||||||
| 2016 | 2016 | 2015 | 3Q16 | 4Q15 | 2016 | 2015 | Change | |||||||||||||||||||||||||
| Net interest income |
$ | 2,955 | $ | 2,893 | $ | 2,819 | 2.1 | 4.8 | $ | 11,528 | $ | 11,001 | 4.8 | |||||||||||||||||||
| Taxable-equivalent adjustment |
49 | 50 | 52 | (2.0 | ) | (5.8 | ) | 203 | 213 | (4.7 | ) | |||||||||||||||||||||
|
|
|
|
|
|
|
|
|
|
|
|||||||||||||||||||||||
| Net interest income (taxable-equivalent basis) |
3,004 | 2,943 | 2,871 | 2.1 | 4.6 | 11,731 | 11,214 | 4.6 | ||||||||||||||||||||||||
| Noninterest income |
2,431 | 2,445 | 2,340 | (.6 | ) | 3.9 | 9,577 | 9,092 | 5.3 | |||||||||||||||||||||||
|
|
|
|
|
|
|
|
|
|
|
|||||||||||||||||||||||
| Total net revenue |
5,435 | 5,388 | 5,211 | .9 | 4.3 | 21,308 | 20,306 | 4.9 | ||||||||||||||||||||||||
| Noninterest expense |
3,004 | 2,931 | 2,809 | 2.5 | 6.9 | 11,676 | 10,931 | 6.8 | ||||||||||||||||||||||||
|
|
|
|
|
|
|
|
|
|
|
|||||||||||||||||||||||
| Income before provision and income taxes |
2,431 | 2,457 | 2,402 | (1.1 | ) | 1.2 | 9,632 | 9,375 | 2.7 | |||||||||||||||||||||||
| Provision for credit losses |
342 | 325 | 305 | 5.2 | 12.1 | 1,324 | 1,132 | 17.0 | ||||||||||||||||||||||||
|
|
|
|
|
|
|
|
|
|
|
|||||||||||||||||||||||
| Income before taxes |
2,089 | 2,132 | 2,097 | (2.0 | ) | (.4 | ) | 8,308 | 8,243 | .8 | ||||||||||||||||||||||
| Income taxes and taxable-equivalent adjustment |
598 | 616 | 608 | (2.9 | ) | (1.6 | ) | 2,364 | 2,310 | 2.3 | ||||||||||||||||||||||
|
|
|
|
|
|
|
|
|
|
|
|||||||||||||||||||||||
| Net income |
1,491 | 1,516 | 1,489 | (1.6 | ) | .1 | 5,944 | 5,933 | .2 | |||||||||||||||||||||||
| Net (income) loss attributable to noncontrolling interests |
(13 | ) | (14 | ) | (13 | ) | 7.1 | — | (56 | ) | (54 | ) | (3.7 | ) | ||||||||||||||||||
|
|
|
|
|
|
|
|
|
|
|
|||||||||||||||||||||||
| Net income attributable to U.S. Bancorp |
$ | 1,478 | $ | 1,502 | $ | 1,476 | (1.6 | ) | .1 | $ | 5,888 | $ | 5,879 | .2 | ||||||||||||||||||
|
|
|
|
|
|
|
|
|
|
|
|||||||||||||||||||||||
| Net income applicable to U.S. Bancorp common shareholders |
$ | 1,391 | $ | 1,434 | $ | 1,404 | (3.0 | ) | (.9 | ) | $ | 5,589 | $ | 5,608 | (.3 | ) | ||||||||||||||||
|
|
|
|
|
|
|
|
|
|
|
|||||||||||||||||||||||
| Diluted earnings per common share |
$ | .82 | $ | .84 | $ | .80 | (2.4 | ) | 2.5 | $ | 3.24 | $ | 3.16 | 2.5 | ||||||||||||||||||
|
|
|
|
|
|
|
|
|
|
|
|||||||||||||||||||||||
(MORE)
U.S. Bancorp Reports Fourth Quarter 2016 Results
January 18, 2017
Page 5
| NET INTEREST INCOME |
Table 3 | |||||||||||||||||||||||||||||||
| (Taxable-equivalent basis; $ in millions) | ||||||||||||||||||||||||||||||||
| Change | Change | |||||||||||||||||||||||||||||||
| 4Q | 3Q | 4Q | 4Q16 vs | 4Q16 vs | Full Year | Full Year | ||||||||||||||||||||||||||
| 2016 | 2016 | 2015 | 3Q16 | 4Q15 | 2016 | 2015 | Change | |||||||||||||||||||||||||
| Components of net interest income |
||||||||||||||||||||||||||||||||
| Income on earning assets |
$ | 3,424 | $ | 3,371 | $ | 3,209 | $ | 53 | $ | 215 | $ | 13,375 | $ | 12,619 | $ | 756 | ||||||||||||||||
| Expense on interest-bearing liabilities |
420 | 428 | 338 | (8 | ) | 82 | 1,644 | 1,405 | 239 | |||||||||||||||||||||||
|
|
|
|
|
|
|
|
|
|
|
|
|
|
|
|
|
|||||||||||||||||
| Net interest income |
$ | 3,004 | $ | 2,943 | $ | 2,871 | $ | 61 | $ | 133 | $ | 11,731 | $ | 11,214 | $ | 517 | ||||||||||||||||
|
|
|
|
|
|
|
|
|
|
|
|
|
|
|
|
|
|||||||||||||||||
| Average yields and rates paid |
||||||||||||||||||||||||||||||||
| Earning assets yield |
3.40 | % | 3.41 | % | 3.42 | % | (.01 | )% | (.02 | )% | 3.43 | % | 3.43 | % | .00 | % | ||||||||||||||||
| Rate paid on interest-bearing liabilities |
.57 | .59 | .50 | (.02 | ) | .07 | .57 | .52 | .05 | |||||||||||||||||||||||
|
|
|
|
|
|
|
|
|
|
|
|
|
|
|
|
|
|||||||||||||||||
| Gross interest margin |
2.83 | % | 2.82 | % | 2.92 | % | .01 | % | (.09 | )% | 2.86 | % | 2.91 | % | (.05 | )% | ||||||||||||||||
|
|
|
|
|
|
|
|
|
|
|
|
|
|
|
|
|
|||||||||||||||||
| Net interest margin |
2.98 | % | 2.98 | % | 3.06 | % | — | % | (.08 | )% | 3.01 | % | 3.05 | % | (.04 | )% | ||||||||||||||||
|
|
|
|
|
|
|
|
|
|
|
|
|
|
|
|
|
|||||||||||||||||
| Average balances |
||||||||||||||||||||||||||||||||
| Investment securities (a) |
$ | 110,386 | $ | 108,109 | $ | 105,536 | $ | 2,277 | $ | 4,850 | $ | 107,922 | $ | 103,161 | $ | 4,761 | ||||||||||||||||
| Loans |
272,671 | 269,637 | 256,692 | 3,034 | 15,979 | 267,811 | 250,459 | 17,352 | ||||||||||||||||||||||||
| Earning assets |
401,971 | 393,783 | 373,091 | 8,188 | 28,880 | 389,877 | 367,445 | 22,432 | ||||||||||||||||||||||||
| Interest-bearing liabilities |
295,288 | 290,331 | 269,940 | 4,957 | 25,348 | 287,760 | 269,474 | 18,286 | ||||||||||||||||||||||||
| (a) | Excludes unrealized gain (loss) |
Net Interest Income
Net interest income on a taxable-equivalent basis in the fourth quarter of 2016 was $3,004 million, an increase of $133 million (4.6 percent) over the fourth quarter of 2015. The increase was principally driven by loan growth partially offset by a lower net interest margin. Average earning assets were $28.9 billion (7.7 percent) higher than the fourth quarter of 2015, driven by increases of $16.0 billion (6.2 percent) in average total loans, $4.9 billion (4.6 percent) in average investment securities and higher average cash balances. Net interest income on a taxable-equivalent basis increased $61 million (2.1 percent) linked quarter, primarily due to growth in average earning assets. Average earning assets were $8.2 billion (2.1 percent) higher on a linked quarter basis, reflecting growth in average total loans of $3.0 billion (1.1 percent), average investment securities of $2.3 billion (2.1 percent) and higher average cash balances.
The net interest margin in the fourth quarter of 2016 was 2.98 percent, compared with 3.06 percent in the fourth quarter of 2015, and 2.98 percent in the third quarter of 2016. The decrease in the net interest margin of 8 basis points on a year-over-year basis was principally due to lower yields on securities purchases, lower reinvestment rates on maturing securities and maintaining higher cash balances. On a
(MORE)
U.S. Bancorp Reports Fourth Quarter 2016 Results
January 18, 2017
Page 6
linked quarter basis, net interest margin was impacted by higher average cash balances as well as lower average rates on new securities purchases and lower reinvestment rates on maturing securities, offset by the favorable impact of interest rates on loans.
Investment Securities
Average investment securities in the fourth quarter of 2016 were $4.9 billion (4.6 percent) higher year-over-year and $2.3 billion (2.1 percent) higher than the prior quarter. These increases were primarily due to purchases of U.S. Treasury and U.S. government agency-backed securities, net of prepayments and maturities, to support liquidity.
| AVERAGE LOANS |
Table 4 | |||||||||||||||||||||||||||||||
| ($ in millions) | Percent | Percent | ||||||||||||||||||||||||||||||
| Change | Change | |||||||||||||||||||||||||||||||
| 4Q | 3Q | 4Q | 4Q16 vs | 4Q16 vs | Full Year | Full Year | Percent | |||||||||||||||||||||||||
| 2016 | 2016 | 2015 | 3Q16 | 4Q15 | 2016 | 2015 | Change | |||||||||||||||||||||||||
| Commercial |
$ | 88,448 | $ | 87,067 | $ | 81,592 | 1.6 | 8.4 | $ | 86,754 | $ | 78,815 | 10.1 | |||||||||||||||||||
| Lease financing |
5,359 | 5,302 | 5,211 | 1.1 | 2.8 | 5,289 | 5,268 | .4 | ||||||||||||||||||||||||
|
|
|
|
|
|
|
|
|
|
|
|||||||||||||||||||||||
| Total commercial |
93,807 | 92,369 | 86,803 | 1.6 | 8.1 | 92,043 | 84,083 | 9.5 | ||||||||||||||||||||||||
| Commercial mortgages |
31,767 | 31,888 | 31,830 | (.4 | ) | (.2 | ) | 31,860 | 32,378 | (1.6 | ) | |||||||||||||||||||||
| Construction and development |
11,624 | 11,486 | 10,401 | 1.2 | 11.8 | 11,180 | 10,037 | 11.4 | ||||||||||||||||||||||||
|
|
|
|
|
|
|
|
|
|
|
|||||||||||||||||||||||
| Total commercial real estate |
43,391 | 43,374 | 42,231 | — | 2.7 | 43,040 | 42,415 | 1.5 | ||||||||||||||||||||||||
| Residential mortgages |
56,718 | 56,284 | 52,970 | .8 | 7.1 | 55,682 | 51,840 | 7.4 | ||||||||||||||||||||||||
| Credit card |
20,942 | 20,628 | 18,838 | 1.5 | 11.2 | 20,490 | 18,057 | 13.5 | ||||||||||||||||||||||||
| Retail leasing |
6,191 | 5,773 | 5,265 | 7.2 | 17.6 | 5,619 | 5,563 | 1.0 | ||||||||||||||||||||||||
| Home equity and second mortgages |
16,444 | 16,470 | 16,241 | (.2 | ) | 1.2 | 16,419 | 16,046 | 2.3 | |||||||||||||||||||||||
| Other |
31,245 | 30,608 | 29,556 | 2.1 | 5.7 | 30,292 | 27,470 | 10.3 | ||||||||||||||||||||||||
|
|
|
|
|
|
|
|
|
|
|
|||||||||||||||||||||||
| Total other retail |
53,880 | 52,851 | 51,062 | 1.9 | 5.5 | 52,330 | 49,079 | 6.6 | ||||||||||||||||||||||||
|
|
|
|
|
|
|
|
|
|
|
|||||||||||||||||||||||
| Total loans, excluding covered loans |
268,738 | 265,506 | 251,904 | 1.2 | 6.7 | 263,585 | 245,474 | 7.4 | ||||||||||||||||||||||||
|
|
|
|
|
|
|
|
|
|
|
|||||||||||||||||||||||
| Covered loans |
3,933 | 4,131 | 4,788 | (4.8 | ) | (17.9 | ) | 4,226 | 4,985 | (15.2 | ) | |||||||||||||||||||||
|
|
|
|
|
|
|
|
|
|
|
|||||||||||||||||||||||
| Total loans |
$ | 272,671 | $ | 269,637 | $ | 256,692 | 1.1 | 6.2 | $ | 267,811 | $ | 250,459 | 6.9 | |||||||||||||||||||
|
|
|
|
|
|
|
|
|
|
|
|||||||||||||||||||||||
(MORE)
U.S. Bancorp Reports Fourth Quarter 2016 Results
January 18, 2017
Page 7
Loans
Average total loans were $16.0 billion (6.2 percent) higher in the fourth quarter of 2016 than the fourth quarter of 2015 (5.6 percent excluding the credit card portfolio acquisition at the end of the fourth quarter of 2015). The increase was due to growth in total commercial loans (8.1 percent), residential mortgages (7.1 percent), total other retail loans (5.5 percent), total commercial real estate (2.7 percent) and credit card loans (11.2 percent). Excluding the credit card portfolio acquisition, credit card loans were 2.6 percent higher than the fourth quarter of 2015. These increases were partially offset by a decrease in the run-off covered loans portfolio (17.9 percent). Average total loans were $3.0 billion (1.1 percent) higher in the fourth quarter of 2016 than the third quarter of 2016. This increase was driven by linked quarter growth in total commercial loans (1.6 percent), total other retail loans (1.9 percent), residential mortgages (0.8 percent), and credit card loans (1.5 percent).
| AVERAGE DEPOSITS |
Table 5 | |||||||||||||||||||||||||||||||
| ($ in millions) | Percent | Percent | ||||||||||||||||||||||||||||||
| Change | Change | |||||||||||||||||||||||||||||||
| 4Q | 3Q | 4Q | 4Q16 vs | 4Q16 vs | Full Year | Full Year | Percent | |||||||||||||||||||||||||
| 2016 | 2016 | 2015 | 3Q16 | 4Q15 | 2016 | 2015 | Change | |||||||||||||||||||||||||
| Noninterest-bearing deposits |
$ | 84,892 | $ | 82,021 | $ | 83,894 | 3.5 | 1.2 | $ | 81,176 | $ | 79,203 | 2.5 | |||||||||||||||||||
| Interest-bearing savings deposits |
||||||||||||||||||||||||||||||||
| Interest checking |
64,647 | 63,456 | 57,109 | 1.9 | 13.2 | 61,726 | 55,974 | 10.3 | ||||||||||||||||||||||||
| Money market savings |
106,637 | 99,921 | 82,828 | 6.7 | 28.7 | 96,518 | 79,266 | 21.8 | ||||||||||||||||||||||||
| Savings accounts |
41,310 | 40,695 | 37,991 | 1.5 | 8.7 | 40,382 | 37,150 | 8.7 | ||||||||||||||||||||||||
|
|
|
|
|
|
|
|
|
|
|
|||||||||||||||||||||||
| Total of savings deposits |
212,594 | 204,072 | 177,928 | 4.2 | 19.5 | 198,626 | 172,390 | 15.2 | ||||||||||||||||||||||||
| Time deposits |
31,697 | 32,455 | 32,683 | (2.3 | ) | (3.0 | ) | 33,008 | 35,558 | (7.2 | ) | |||||||||||||||||||||
|
|
|
|
|
|
|
|
|
|
|
|||||||||||||||||||||||
| Total interest-bearing deposits |
244,291 | 236,527 | 210,611 | 3.3 | 16.0 | 231,634 | 207,948 | 11.4 | ||||||||||||||||||||||||
|
|
|
|
|
|
|
|
|
|
|
|||||||||||||||||||||||
| Total deposits |
$ | 329,183 | $ | 318,548 | $ | 294,505 | 3.3 | 11.8 | $ | 312,810 | $ | 287,151 | 8.9 | |||||||||||||||||||
|
|
|
|
|
|
|
|
|
|
|
|||||||||||||||||||||||
Deposits
Average total deposits for the fourth quarter of 2016 were $34.7 billion (11.8 percent) higher than the fourth quarter of 2015. Average noninterest-bearing deposits increased $1.0 billion (1.2 percent) year-over-year mainly in Consumer and Small Business Banking, partially offset by a decline in deposits within Wealth Management and Securities Services. Average total savings deposits were $34.7 billion (19.5 percent) higher year-over-year, the result of growth across all business lines. Average time deposits were $1.0 billion (3.0 percent) lower than the prior year quarter. Changes in time deposits are largely related to those deposits
(MORE)
U.S. Bancorp Reports Fourth Quarter 2016 Results
January 18, 2017
Page 8
managed as an alternative to other funding sources such as wholesale borrowing, based largely on relative pricing and liquidity characteristics.
Average total deposits increased $10.6 billion (3.3 percent) over the third quarter of 2016. On a linked quarter basis, average noninterest-bearing deposits grew $2.9 billion (3.5 percent) and average total savings deposits grew $8.5 billion (4.2 percent) reflecting increases across all business lines. Average time deposits, which are managed based on funding needs, relative pricing, and liquidity characteristics, decreased $758 million (2.3 percent) on a linked quarter basis.
| NONINTEREST INCOME |
Table 6 | |||||||||||||||||||||||||||||||
| ($ in millions) | Percent | Percent | ||||||||||||||||||||||||||||||
| Change | Change | |||||||||||||||||||||||||||||||
| 4Q | 3Q | 4Q | 4Q16 vs | 4Q16 vs | Full Year | Full Year | Percent | |||||||||||||||||||||||||
| 2016 | 2016 | 2015 | 3Q16 | 4Q15 | 2016 | 2015 | Change | |||||||||||||||||||||||||
| Credit and debit card revenue |
$ | 316 | $ | 299 | $ | 294 | 5.7 | 7.5 | $ | 1,177 | $ | 1,070 | 10.0 | |||||||||||||||||||
| Corporate payment products revenue |
171 | 190 | 170 | (10.0 | ) | .6 | 712 | 708 | .6 | |||||||||||||||||||||||
| Merchant processing services |
404 | 412 | 393 | (1.9 | ) | 2.8 | 1,592 | 1,547 | 2.9 | |||||||||||||||||||||||
| ATM processing services |
87 | 87 | 79 | — | 10.1 | 338 | 318 | 6.3 | ||||||||||||||||||||||||
| Trust and investment management fees |
368 | 362 | 336 | 1.7 | 9.5 | 1,427 | 1,321 | 8.0 | ||||||||||||||||||||||||
| Deposit service charges |
186 | 192 | 182 | (3.1 | ) | 2.2 | 725 | 702 | 3.3 | |||||||||||||||||||||||
| Treasury management fees |
147 | 147 | 139 | — | 5.8 | 583 | 561 | 3.9 | ||||||||||||||||||||||||
| Commercial products revenue |
217 | 219 | 222 | (.9 | ) | (2.3 | ) | 871 | 867 | .5 | ||||||||||||||||||||||
| Mortgage banking revenue |
240 | 314 | 211 | (23.6 | ) | 13.7 | 979 | 906 | 8.1 | |||||||||||||||||||||||
| Investment products fees |
38 | 41 | 44 | (7.3 | ) | (13.6 | ) | 158 | 185 | (14.6 | ) | |||||||||||||||||||||
| Securities gains (losses), net |
6 | 10 | 1 | (40.0 | ) | nm | 22 | — | nm | |||||||||||||||||||||||
| Other |
251 | 172 | 269 | 45.9 | (6.7 | ) | 993 | 907 | 9.5 | |||||||||||||||||||||||
|
|
|
|
|
|
|
|
|
|
|
|
|
|||||||||||||||||||||
| Total noninterest income |
$ | 2,431 | $ | 2,445 | $ | 2,340 | (.6 | ) | 3.9 | $ | 9,577 | $ | 9,092 | 5.3 | ||||||||||||||||||
|
|
|
|
|
|
|
|
|
|
|
|
|
|||||||||||||||||||||
Noninterest Income
Fourth quarter noninterest income was $2,431 million, which was $91 million (3.9 percent) higher than the fourth quarter of 2015, reflecting increases in payment services revenue, trust and investment management fees, and mortgage banking revenue, partially offset by a decline in other noninterest income. Credit and debit card revenue increased $22 million (7.5 percent) reflecting higher transaction volumes including the impact of acquired portfolios. Merchant processing services revenue increased $11 million (2.8 percent) as a result of an increase in product fees and higher volumes. Adjusted for the approximate $11 million impact of foreign currency rate changes, year-over-year merchant processing services revenue increased approximately 5.6 percent. Trust and investment management fees increased $32 million (9.5
(MORE)
U.S. Bancorp Reports Fourth Quarter 2016 Results
January 18, 2017
Page 9
percent) reflecting lower money market fee waivers along with account growth, an increase in assets under management, and improved market conditions. Mortgage banking revenue increased $29 million (13.7 percent) over a year ago driven by higher origination and sales volumes. Other income decreased $18 million (6.7 percent) compared with the prior year quarter, primarily reflecting lower income from leasing residuals and the impact of a gain on the sale of a deposit portfolio in the fourth quarter of 2015 partially offset by stronger trading income and higher fourth quarter 2016 equity investment income.
Noninterest income was $14 million (0.6 percent) lower in the fourth quarter of 2016 than the third quarter of 2016 principally driven by lower mortgage banking revenue and seasonally lower corporate payment products revenue, partially offset by seasonally higher credit and debit card revenue and an increase in other noninterest income. Mortgage banking revenue decreased $74 million (23.6 percent) reflecting lower origination and sales volume, while corporate payment products revenue was $19 million (10.0 percent) lower, reflecting seasonally lower government-related transaction volumes. Credit and debit card revenue increased $17 million (5.7 percent), driven by seasonally higher sales volumes. The increase in other income of $79 million (45.9 percent) was primarily driven by changes in equity investment income.
| NONINTEREST EXPENSE |
Table 7 | |||||||||||||||||||||||||||||||
| ($ in millions) | Percent | Percent | ||||||||||||||||||||||||||||||
| Change | Change | |||||||||||||||||||||||||||||||
| 4Q | 3Q | 4Q | 4Q16 vs | 4Q16 vs | Full Year | Full Year | Percent | |||||||||||||||||||||||||
| 2016 | 2016 | 2015 | 3Q16 | 4Q15 | 2016 | 2015 | Change | |||||||||||||||||||||||||
| Compensation |
$ | 1,357 | $ | 1,329 | $ | 1,212 | 2.1 | 12.0 | $ | 5,212 | $ | 4,812 | 8.3 | |||||||||||||||||||
| Employee benefits |
261 | 280 | 272 | (6.8 | ) | (4.0 | ) | 1,119 | 1,167 | (4.1 | ) | |||||||||||||||||||||
| Net occupancy and equipment |
247 | 250 | 246 | (1.2 | ) | .4 | 988 | 991 | (.3 | ) | ||||||||||||||||||||||
| Professional services |
156 | 127 | 125 | 22.8 | 24.8 | 502 | 423 | 18.7 | ||||||||||||||||||||||||
| Marketing and business development |
107 | 102 | 96 | 4.9 | 11.5 | 435 | 361 | 20.5 | ||||||||||||||||||||||||
| Technology and communications |
238 | 243 | 230 | (2.1 | ) | 3.5 | 955 | 887 | 7.7 | |||||||||||||||||||||||
| Postage, printing and supplies |
75 | 80 | 74 | (6.3 | ) | 1.4 | 311 | 297 | 4.7 | |||||||||||||||||||||||
| Other intangibles |
45 | 45 | 46 | — | (2.2 | ) | 179 | 174 | 2.9 | |||||||||||||||||||||||
| Other |
518 | 475 | 508 | 9.1 | 2.0 | 1,975 | 1,819 | 8.6 | ||||||||||||||||||||||||
|
|
|
|
|
|
|
|
|
|
|
|||||||||||||||||||||||
| Total noninterest expense |
$ | 3,004 | $ | 2,931 | $ | 2,809 | 2.5 | 6.9 | $ | 11,676 | $ | 10,931 | 6.8 | |||||||||||||||||||
|
|
|
|
|
|
|
|
|
|
|
|||||||||||||||||||||||
(MORE)
U.S. Bancorp Reports Fourth Quarter 2016 Results
January 18, 2017
Page 10
Noninterest Expense
Fourth quarter noninterest expense was $3,004 million, $195 million (6.9 percent) higher than the fourth quarter of 2015, primarily due to higher compensation, professional services and marketing expenses. Compensation expense increased $145 million (12.0 percent) principally due to the impact of hiring to support business growth and compliance programs, merit increases, and higher variable compensation. Professional services increased $31 million (24.8 percent) primarily due to compliance programs and implementation costs of capital investments to support business growth. Marketing increased $11 million (11.5 percent) to support new business development. Partially offsetting these increases was an $11 million (4.0 percent) decrease in employee benefits expense mainly due to lower pension and healthcare costs.
Noninterest expense increased $73 million (2.5 percent) on a linked quarter basis driven by higher other noninterest expense, professional services expense and compensation expense. Other noninterest expense increased $43 million (9.1 percent) primarily due to seasonally higher costs related to investments in tax-advantaged projects. Professional services expense was $29 million (22.8 percent) higher due to seasonally higher costs across a majority of the lines of business including capital investments, and risk and compliance activities. Compensation expense increased $28 million (2.1 percent) primarily due to increased staffing to support business investment and compliance programs. Partially offsetting these increases was a $19 million (6.8 percent) decrease in employee benefits expense driven by lower healthcare costs.
Provision for Income Taxes
The provision for income taxes for the fourth quarter of 2016 resulted in a tax rate on a taxable-equivalent basis of 28.6 percent (effective tax rate of 26.9 percent), compared with 29.0 percent (effective tax rate of 27.2 percent) in the fourth quarter of 2015, and 28.9 percent (effective tax rate of 27.2 percent) in the third quarter of 2016.
(MORE)
U.S. Bancorp Reports Fourth Quarter 2016 Results
January 18, 2017
Page 11
| ALLOWANCE FOR CREDIT LOSSES |
Table 8 | |||||||||||||||||||||||||||||||||||||||
| ($ in millions) | 4Q | 3Q | 2Q | 1Q | 4Q | |||||||||||||||||||||||||||||||||||
| 2016 | %(b) | 2016 | % (b) | 2016 | % (b) | 2016 | % (b) | 2015 | % (b) | |||||||||||||||||||||||||||||||
| Balance, beginning of period |
$ | 4,338 | $ | 4,329 | $ | 4,320 | $ | 4,306 | $ | 4,306 | ||||||||||||||||||||||||||||||
| Net charge-offs |
||||||||||||||||||||||||||||||||||||||||
| Commercial |
71 | .32 | 84 | .38 | 74 | .34 | 78 | .37 | 58 | .28 | ||||||||||||||||||||||||||||||
| Lease financing |
5 | .37 | 3 | .23 | 5 | .38 | 5 | .38 | 5 | .38 | ||||||||||||||||||||||||||||||
|
|
|
|
|
|
|
|
|
|
|
|||||||||||||||||||||||||||||||
| Total commercial |
76 | .32 | 87 | .37 | 79 | .34 | 83 | .37 | 63 | .29 | ||||||||||||||||||||||||||||||
| Commercial mortgages |
(3 | ) | (.04 | ) | 5 | .06 | (4 | ) | (.05 | ) | (2 | ) | (.03 | ) | 2 | .02 | ||||||||||||||||||||||||
| Construction and development |
(6 | ) | (.21 | ) | (4 | ) | (.14 | ) | 4 | .15 | (3 | ) | (.11 | ) | (2 | ) | (.08 | ) | ||||||||||||||||||||||
|
|
|
|
|
|
|
|
|
|
|
|||||||||||||||||||||||||||||||
| Total commercial real estate |
(9 | ) | (.08 | ) | 1 | .01 | — | — | (5 | ) | (.05 | ) | — | — | ||||||||||||||||||||||||||
| Residential mortgages |
12 | .08 | 12 | .08 | 17 | .12 | 19 | .14 | 16 | .12 | ||||||||||||||||||||||||||||||
| Credit card |
181 | 3.44 | 161 | 3.11 | 170 | 3.39 | 164 | 3.26 | 166 | 3.50 | ||||||||||||||||||||||||||||||
| Retail leasing |
1 | .06 | 1 | .07 | 2 | .15 | 1 | .08 | 1 | .08 | ||||||||||||||||||||||||||||||
| Home equity and second mortgages |
(1 | ) | (.02 | ) | 1 | .02 | (1 | ) | (.02 | ) | 2 | .05 | 6 | .15 | ||||||||||||||||||||||||||
| Other |
62 | .79 | 52 | .68 | 50 | .68 | 51 | .69 | 53 | .71 | ||||||||||||||||||||||||||||||
|
|
|
|
|
|
|
|
|
|
|
|||||||||||||||||||||||||||||||
| Total other retail |
62 | .46 | 54 | .41 | 51 | .40 | 54 | .43 | 60 | .47 | ||||||||||||||||||||||||||||||
|
|
|
|
|
|
|
|
|
|
|
|
|
|
|
|
|
|
|
|||||||||||||||||||||||
| Total net charge-offs, excluding covered loans |
322 | .48 | 315 | .47 | 317 | .49 | 315 | .49 | 305 | .48 | ||||||||||||||||||||||||||||||
| Covered loans |
— | — | — | — | — | — | — | — | — | — | ||||||||||||||||||||||||||||||
|
|
|
|
|
|
|
|
|
|
|
|||||||||||||||||||||||||||||||
| Total net charge-offs |
322 | .47 | 315 | .46 | 317 | .48 | 315 | .48 | 305 | .47 | ||||||||||||||||||||||||||||||
| Provision for credit losses |
342 | 325 | 327 | 330 | 305 | |||||||||||||||||||||||||||||||||||
| Other changes (a) |
(1 | ) | (1 | ) | (1 | ) | (1 | ) | — | |||||||||||||||||||||||||||||||
|
|
|
|
|
|
|
|
|
|
|
|||||||||||||||||||||||||||||||
| Balance, end of period |
$ | 4,357 | $ | 4,338 | $ | 4,329 | $ | 4,320 | $ | 4,306 | ||||||||||||||||||||||||||||||
|
|
|
|
|
|
|
|
|
|
|
|||||||||||||||||||||||||||||||
| Components |
||||||||||||||||||||||||||||||||||||||||
| Allowance for loan losses |
$ | 3,813 | $ | 3,797 | $ | 3,806 | $ | 3,853 | $ | 3,863 | ||||||||||||||||||||||||||||||
| Liability for unfunded credit commitments |
544 | 541 | 523 | 467 | 443 | |||||||||||||||||||||||||||||||||||
|
|
|
|
|
|
|
|
|
|
|
|||||||||||||||||||||||||||||||
| Total allowance for credit losses |
$ | 4,357 | $ | 4,338 | $ | 4,329 | $ | 4,320 | $ | 4,306 | ||||||||||||||||||||||||||||||
|
|
|
|
|
|
|
|
|
|
|
|||||||||||||||||||||||||||||||
| Gross charge-offs |
$ | 405 | $ | 398 | $ | 407 | $ | 405 | $ | 381 | ||||||||||||||||||||||||||||||
| Gross recoveries |
$ | 83 | $ | 83 | $ | 90 | $ | 90 | $ | 76 | ||||||||||||||||||||||||||||||
| Allowance for credit losses as a percentage of |
||||||||||||||||||||||||||||||||||||||||
| Period-end loans, excluding covered loans |
1.60 | 1.61 | 1.62 | 1.65 | 1.67 | |||||||||||||||||||||||||||||||||||
| Nonperforming loans, excluding covered loans |
317 | 309 | 311 | 302 | 360 | |||||||||||||||||||||||||||||||||||
| Nonperforming assets, excluding covered assets |
275 | 264 | 263 | 255 | 288 | |||||||||||||||||||||||||||||||||||
| Period-end loans |
1.59 | 1.60 | 1.61 | 1.63 | 1.65 | |||||||||||||||||||||||||||||||||||
| Nonperforming loans |
318 | 310 | 312 | 303 | 361 | |||||||||||||||||||||||||||||||||||
| Nonperforming assets |
272 | 261 | 259 | 251 | 283 | |||||||||||||||||||||||||||||||||||
| (a) | Includes net changes in credit losses to be reimbursed by the FDIC and reductions in the allowance for covered loans where the reversal of a previously recorded allowance was offset by an associated decrease in the indemnification asset, and the impact of any loan sales. |
| (b) | Annualized and calculated on average loan balances |
(MORE)
U.S. Bancorp Reports Fourth Quarter 2016 Results
January 18, 2017
Page 12
Credit Quality
The Company’s provision for credit losses for the fourth quarter of 2016 was $342 million, which was $17 million (5.2 percent) higher than the prior quarter and $37 million (12.1 percent) higher than the fourth quarter of 2015. Credit quality was relatively stable compared with the third quarter of 2016.
The provision for credit losses was $20 million higher than net charge-offs in the fourth quarter of 2016, $10 million higher than net charge-offs in the third quarter of 2016, and equal to net charge-offs in the fourth quarter of 2015. The reserve build for the fourth quarter of 2016 was driven by portfolio growth, partially offset by improvement in residential mortgage and home equity credit quality. Total net charge-offs in the fourth quarter of 2016 were $322 million, compared with $315 million in the third quarter of 2016, and $305 million in the fourth quarter of 2015. Net charge-offs increased $7 million (2.2 percent) compared with the third quarter of 2016 reflecting a seasonal increase in credit card loan net charge-offs, offset by declines in commercial and commercial real estate loan net charge-offs. Net charge-offs increased $17 million (5.6 percent) compared with the fourth quarter of 2015 primarily due to higher commercial and credit card loan net charge-offs, partially offset by lower charge-offs related to commercial real estate and residential mortgages. The net charge-off ratio was 0.47 percent in the fourth quarter of 2016, compared with 0.46 percent in the third quarter of 2016 and 0.47 percent in the fourth quarter of 2015.
The allowance for credit losses was $4,357 million at December 31, 2016, compared with $4,338 million at September 30, 2016, and $4,306 million at December 31, 2015. The ratio of the allowance for credit losses to period-end loans was 1.59 percent at December 31, 2016, compared with 1.60 percent at September 30, 2016, and 1.65 percent at December 31, 2015. The ratio of the allowance for credit losses to nonperforming loans was 318 percent at December 31, 2016, compared with 310 percent at September 30, 2016, and 361 percent at December 31, 2015.
Nonperforming assets were $1,603 million at December 31, 2016, compared with $1,664 million at September 30, 2016, and $1,523 million at December 31, 2015. The ratio of nonperforming assets to loans and other real estate was 0.59 percent at December 31, 2016, compared with 0.61 percent at September 30, 2016, and 0.58 percent at December 31, 2015. The $61 million (3.7 percent) decrease in nonperforming assets on a linked quarter basis was driven by improvements in commercial loans, residential mortgages and other real estate. The $80 million (5.3 percent) increase in nonperforming assets on a year-over-year basis was driven by commercial loans within the energy portfolio, partially offset by improvements in the Company’s residential portfolio. Accruing loans 90 days or more past due were $764 million ($552 million
(MORE)
U.S. Bancorp Reports Fourth Quarter 2016 Results
January 18, 2017
Page 13
excluding covered loans) at December 31, 2016, compared with $748 million ($518 million excluding covered loans) at September 30, 2016, and $831 million ($541 million excluding covered loans) at December 31, 2015.
| DELINQUENT LOAN RATIOS AS A PERCENT OF ENDING LOAN BALANCES |
Table 9 | |||||||||||||||||||
| (Percent) | ||||||||||||||||||||
| Dec 31 | Sep 30 | Jun 30 | Mar 31 | Dec 31 | ||||||||||||||||
| 2016 | 2016 | 2016 | 2016 | 2015 | ||||||||||||||||
| Delinquent loan ratios - 90 days or more past due excluding nonperforming loans |
|
|||||||||||||||||||
| Commercial |
.06 | .05 | .05 | .05 | .05 | |||||||||||||||
| Commercial real estate |
.02 | .02 | .03 | .04 | .03 | |||||||||||||||
| Residential mortgages |
.27 | .28 | .27 | .31 | .33 | |||||||||||||||
| Credit card |
1.16 | 1.11 | .98 | 1.10 | 1.09 | |||||||||||||||
| Other retail |
.15 | .14 | .13 | .15 | .15 | |||||||||||||||
| Total loans, excluding covered loans |
.20 | .19 | .18 | .20 | .21 | |||||||||||||||
| Covered loans |
5.53 | 5.72 | 5.81 | 6.23 | 6.31 | |||||||||||||||
| Total loans |
.28 | .28 | .27 | .30 | .32 | |||||||||||||||
| Delinquent loan ratios - 90 days or more past due including nonperforming loans |
|
|||||||||||||||||||
| Commercial |
.57 | .61 | .58 | .57 | .25 | |||||||||||||||
| Commercial real estate |
.31 | .26 | .27 | .28 | .33 | |||||||||||||||
| Residential mortgages |
1.31 | 1.37 | 1.39 | 1.54 | 1.66 | |||||||||||||||
| Credit card |
1.18 | 1.13 | 1.00 | 1.14 | 1.13 | |||||||||||||||
| Other retail |
.45 | .42 | .43 | .45 | .46 | |||||||||||||||
| Total loans, excluding covered loans |
.71 | .72 | .70 | .75 | .67 | |||||||||||||||
| Covered loans |
5.68 | 5.89 | 5.98 | 6.39 | 6.48 | |||||||||||||||
| Total loans |
.78 | .79 | .79 | .84 | .78 | |||||||||||||||
(MORE)
U.S. Bancorp Reports Fourth Quarter 2016 Results
January 18, 2017
Page 14
| ASSET QUALITY |
Table 10 | |||||||||||||||||||
| ($ in millions) | ||||||||||||||||||||
| Dec 31 | Sep 30 | Jun 30 | Mar 31 | Dec 31 | ||||||||||||||||
| 2016 | 2016 | 2016 | 2016 | 2015 | ||||||||||||||||
| Nonperforming loans |
||||||||||||||||||||
| Commercial |
$ | 443 | $ | 477 | $ | 450 | $ | 457 | $ | 160 | ||||||||||
| Lease financing |
40 | 40 | 39 | 16 | 14 | |||||||||||||||
|
|
|
|
|
|
|
|
|
|
|
|||||||||||
| Total commercial |
483 | 517 | 489 | 473 | 174 | |||||||||||||||
| Commercial mortgages |
87 | 98 | 91 | 94 | 92 | |||||||||||||||
| Construction and development |
37 | 7 | 12 | 10 | 35 | |||||||||||||||
|
|
|
|
|
|
|
|
|
|
|
|||||||||||
| Total commercial real estate |
124 | 105 | 103 | 104 | 127 | |||||||||||||||
| Residential mortgages |
595 | 614 | 628 | 677 | 712 | |||||||||||||||
| Credit card |
3 | 4 | 5 | 7 | 9 | |||||||||||||||
| Other retail |
157 | 153 | 157 | 157 | 162 | |||||||||||||||
|
|
|
|
|
|
|
|
|
|
|
|||||||||||
| Total nonperforming loans, excluding covered loans |
1,362 | 1,393 | 1,382 | 1,418 | 1,184 | |||||||||||||||
| Covered loans |
6 | 7 | 7 | 7 | 8 | |||||||||||||||
|
|
|
|
|
|
|
|
|
|
|
|||||||||||
| Total nonperforming loans |
1,368 | 1,400 | 1,389 | 1,425 | 1,192 | |||||||||||||||
| Other real estate (a) |
186 | 213 | 229 | 242 | 280 | |||||||||||||||
| Covered other real estate (a) |
26 | 28 | 34 | 33 | 32 | |||||||||||||||
| Other nonperforming assets |
23 | 23 | 20 | 19 | 19 | |||||||||||||||
|
|
|
|
|
|
|
|
|
|
|
|||||||||||
| Total nonperforming assets (b) |
$ | 1,603 | $ | 1,664 | $ | 1,672 | $ | 1,719 | $ | 1,523 | ||||||||||
|
|
|
|
|
|
|
|
|
|
|
|||||||||||
| Total nonperforming assets, excluding covered assets |
$ | 1,571 | $ | 1,629 | $ | 1,631 | $ | 1,679 | $ | 1,483 | ||||||||||
|
|
|
|
|
|
|
|
|
|
|
|||||||||||
| Accruing loans 90 days or more past due, excluding covered loans |
$ | 552 | $ | 518 | $ | 478 | $ | 528 | $ | 541 | ||||||||||
|
|
|
|
|
|
|
|
|
|
|
|||||||||||
| Accruing loans 90 days or more past due |
$ | 764 | $ | 748 | $ | 724 | $ | 804 | $ | 831 | ||||||||||
|
|
|
|
|
|
|
|
|
|
|
|||||||||||
| Performing restructured loans, excluding GNMA and covered loans |
$ | 2,557 | $ | 2,672 | $ | 2,676 | $ | 2,735 | $ | 2,766 | ||||||||||
|
|
|
|
|
|
|
|
|
|
|
|||||||||||
| Performing restructured GNMA and covered loans |
$ | 1,604 | $ | 1,375 | $ | 1,602 | $ | 1,851 | $ | 1,944 | ||||||||||
|
|
|
|
|
|
|
|
|
|
|
|||||||||||
| Nonperforming assets to loans plus ORE, excluding covered assets (%) |
.58 | .61 | .62 | .64 | .58 | |||||||||||||||
| Nonperforming assets to loans plus ORE (%) |
.59 | .61 | .62 | .65 | .58 | |||||||||||||||
| (a) | Includes equity investments in entities whose principal assets are other real estate owned. |
| (b) | Does not include accruing loans 90 days or more past due. |
(MORE)
U.S. Bancorp Reports Fourth Quarter 2016 Results
January 18, 2017
Page 15
| COMMON SHARES |
Table 11 | |||||||||||||||||||
| (Millions) | 4Q | 3Q | 2Q | 1Q | 4Q | |||||||||||||||
| 2016 | 2016 | 2016 | 2016 | 2015 | ||||||||||||||||
| Beginning shares outstanding |
1,705 | 1,719 | 1,732 | 1,745 | 1,754 | |||||||||||||||
| Shares issued for stock incentive plans, acquisitions and other corporate purposes |
6 | 2 | 2 | 3 | 1 | |||||||||||||||
| Shares repurchased |
(14 | ) | (16 | ) | (15 | ) | (16 | ) | (10 | ) | ||||||||||
|
|
|
|
|
|
|
|
|
|
|
|||||||||||
| Ending shares outstanding |
1,697 | 1,705 | 1,719 | 1,732 | 1,745 | |||||||||||||||
|
|
|
|
|
|
|
|
|
|
|
|||||||||||
| CAPITAL POSITION |
Table 12 | |||||||||||||||||||
| ($ in millions) | Dec 31 | Sep 30 | Jun 30 | Mar 31 | Dec 31 | |||||||||||||||
| 2016 | 2016 | 2016 | 2016 | 2015 | ||||||||||||||||
| Total U.S. Bancorp shareholders’ equity |
$ | 47,298 | $ | 47,759 | $ | 47,390 | $ | 46,755 | $ | 46,131 | ||||||||||
| Standardized Approach |
||||||||||||||||||||
| Basel III transitional standardized approach |
||||||||||||||||||||
| Common equity tier 1 capital |
$ | 33,720 | $ | 33,827 | $ | 33,444 | $ | 32,827 | $ | 32,612 | ||||||||||
| Tier 1 capital |
39,421 | 39,531 | 39,148 | 38,532 | 38,431 | |||||||||||||||
| Total risk-based capital |
47,355 | 47,452 | 47,049 | 45,412 | 45,313 | |||||||||||||||
| Common equity tier 1 capital ratio |
9.4 | % | 9.5 | % | 9.5 | % | 9.5 | % | 9.6 | % | ||||||||||
| Tier 1 capital ratio |
11.0 | 11.1 | 11.1 | 11.1 | 11.3 | |||||||||||||||
| Total risk-based capital ratio |
13.2 | 13.3 | 13.4 | 13.1 | 13.3 | |||||||||||||||
| Leverage ratio |
9.0 | 9.2 | 9.3 | 9.3 | 9.5 | |||||||||||||||
| Common equity tier 1 capital to risk-weighted assets estimated for the Basel III fully implemented standardized approach (a) |
9.1 | 9.3 | 9.3 | 9.2 | 9.1 | |||||||||||||||
| Advanced Approaches |
||||||||||||||||||||
| Common equity tier 1 capital to risk-weighted assets for the Basel III transitional advanced approaches |
12.2 | 12.4 | 12.3 | 12.3 | 12.5 | |||||||||||||||
| Common equity tier 1 capital to risk-weighted assets estimated for the Basel III fully implemented advanced approaches (a) |
11.7 | 12.1 | 12.0 | 11.9 | 11.9 | |||||||||||||||
| Tangible common equity to tangible assets (a) |
7.5 | 7.5 | 7.6 | 7.7 | 7.6 | |||||||||||||||
| Tangible common equity to risk-weighted assets (a) |
9.2 | 9.3 | 9.3 | 9.3 | 9.2 | |||||||||||||||
Beginning January 1, 2014, the regulatory capital requirements effective for the Company follow Basel III, subject to certain transition provisions from Basel I over the following four years to full implementation by January 1, 2018. Basel III includes two comprehensive methodologies for calculating risk-weighted assets: a general standardized approach and more risk-sensitive advanced approaches, with the Company’s capital adequacy being evaluated against the methodology that is most restrictive.
| (a) | See Non-GAAP Financial Measures reconciliation on page 21 |
(MORE)
U.S. Bancorp Reports Fourth Quarter 2016 Results
January 18, 2017
Page 16
Capital Management
Total U.S. Bancorp shareholders’ equity was $47.3 billion at December 31, 2016, compared with $47.8 billion at September 30, 2016, and $46.1 billion at December 31, 2015. During the fourth quarter, the Company returned 81 percent of earnings to shareholders through dividends and share buybacks.
All regulatory ratios continue to be in excess of “well-capitalized” requirements. The estimated common equity tier 1 capital to risk-weighted assets ratio using the Basel III fully implemented standardized approach was 9.1 percent at December 31, 2016, compared with 9.3 percent at September 30, 2016, and 9.1 percent at December 31, 2015. The decline from the third quarter of 2016 in the common equity tier 1 ratio was principally due to the impact of rising interest rates on unrealized gains (losses) of securities available-for-sale. The estimated common equity tier 1 capital to risk-weighted assets ratio using the Basel III fully implemented advanced approaches method was 11.7 percent at December 31, 2016, compared with 12.1 percent at September 30, 2016, and 11.9 percent at December 31, 2015.
On Wednesday, January 18, 2017, at 8:00 a.m. CST, Richard K. Davis, chairman and chief executive officer, and Terry Dolan, vice chairman and chief financial officer, will host a conference call to review the financial results. The conference call will be available online or by telephone. To access the webcast and presentation, go to www.usbank.com and click on “About U.S. Bank.” The “Webcasts & Presentations” link can be found under the Investor/Shareholder information heading, which is at the left side near the bottom of the page. To access the conference call from locations within the United States and Canada, please dial 866-316-1409. Participants calling from outside the United States and Canada, please dial 706-634-9086. The conference ID number for all participants is 17948161. For those unable to participate during the live call, a recording will be available at approximately 11:00 a.m. CST on Wednesday, January 18 and be accessible through Wednesday, January 25 at 11:00 p.m. CST. To access the recorded message within the United States and Canada, dial 855-859-2056. If calling from outside the United States and Canada, please dial 404-537-3406 to access the recording. The conference ID is 17948161.
Minneapolis-based U.S. Bancorp (NYSE: USB), with $446 billion in assets as of December 31, 2016, is the parent company of U.S. Bank National Association, the fifth largest commercial bank in the United States. The Company operates 3,106 banking offices in 25 states and 4,842 ATMs and provides a comprehensive line of banking, investment, mortgage, trust and payment services products to consumers, businesses and institutions. Visit U.S. Bancorp on the web at www.usbank.com.
(MORE)
U.S. Bancorp Reports Fourth Quarter 2016 Results
January 18, 2017
Page 17
Forward-Looking Statements
The following information appears in accordance with the Private Securities Litigation Reform Act of 1995:
This press release contains forward-looking statements about U.S. Bancorp. Statements that are not historical or current facts, including statements about beliefs and expectations, are forward-looking statements and are based on the information available to, and assumptions and estimates made by, management as of the date hereof. These forward-looking statements cover, among other things, anticipated future revenue and expenses and the future plans and prospects of U.S. Bancorp. Forward-looking statements involve inherent risks and uncertainties, and important factors could cause actual results to differ materially from those anticipated. A reversal or slowing of the current economic recovery or another severe contraction could adversely affect U.S. Bancorp’s revenues and the values of its assets and liabilities. Global financial markets could experience a recurrence of significant turbulence, which could reduce the availability of funding to certain financial institutions and lead to a tightening of credit, a reduction of business activity, and increased market volatility. Stress in the commercial real estate markets, as well as a downturn in the residential real estate markets could cause credit losses and deterioration in asset values. In addition, U.S. Bancorp’s business and financial performance is likely to be negatively impacted by recently enacted and future legislation and regulation. U.S. Bancorp’s results could also be adversely affected by deterioration in general business and economic conditions (which could result, in part, from the United Kingdom’s withdrawal from the European Union); changes in interest rates; deterioration in the credit quality of its loan portfolios or in the value of the collateral securing those loans; deterioration in the value of securities held in its investment securities portfolio; legal and regulatory developments; litigation; increased competition from both banks and non-banks; changes in customer behavior and preferences; breaches in data security; effects of mergers and acquisitions and related integration; effects of critical accounting policies and judgments; and management’s ability to effectively manage credit risk, market risk, operational risk, compliance risk, strategic risk, interest rate risk, liquidity risk and reputational risk.
For discussion of these and other risks that may cause actual results to differ from expectations, refer to U.S. Bancorp’s Annual Report on Form 10-K for the year ended December 31, 2015, on file with the Securities and Exchange Commission, including the sections entitled “Risk Factors” and “Corporate Risk Profile” contained in Exhibit 13, and all subsequent filings with the Securities and Exchange Commission under Sections 13(a), 13(c), 14 or 15(d) of the Securities Exchange Act of 1934. However, factors other than these also could adversely affect U.S. Bancorp’s results, and the reader should not consider these factors to be a complete set of all potential risks or uncertainties. Forward-looking statements speak only as of the date hereof, and U.S. Bancorp undertakes no obligation to update them in light of new information or future events.
(MORE)
U.S. Bancorp Reports Fourth Quarter 2016 Results
January 18, 2017
Page 18
Non-GAAP Financial Measures
In addition to capital ratios defined by banking regulators, the Company considers various other measures when evaluating capital utilization and adequacy, including:
| • | Tangible common equity to tangible assets, |
| • | Tangible common equity to risk-weighted assets, |
| • | Common equity tier 1 capital to risk-weighted assets estimated for the Basel III fully implemented standardized approach, and |
| • | Common equity tier 1 capital to risk-weighted assets estimated for the Basel III fully implemented advanced approaches. |
These capital measures are viewed by management as useful additional methods of reflecting the level of capital available to withstand unexpected market or economic conditions. Additionally, presentation of these measures allows investors, analysts and banking regulators to assess the Company’s capital position relative to other financial services companies. These measures differ from currently effective capital ratios defined by banking regulations principally in that the numerator of the currently effective ratios, which are subject to certain transitional provisions, temporarily excludes a portion of unrealized gains and losses related to available-for-sale securities and retirement plan obligations, and includes a portion of capital related to intangible assets, other than mortgage servicing rights. These capital measures are not defined in generally accepted accounting principles (“GAAP”), or are not currently effective or defined in federal banking regulations. As a result, these capital measures disclosed by the Company may be considered non-GAAP financial measures.
The Company also discloses net interest income and related ratios and analysis on a taxable-equivalent basis, which may also be considered non-GAAP financial measures. The Company believes this presentation to be the preferred industry measurement of net interest income as it provides a relevant comparison of net interest income arising from taxable and tax-exempt sources. In addition, certain performance measures, including the efficiency ratio and net interest margin utilize net interest income on a taxable-equivalent basis.
There may be limits in the usefulness of these measures to investors. As a result, the Company encourages readers to consider the consolidated financial statements and other financial information contained in this press release in their entirety, and not to rely on any single financial measure. A table follows that shows the Company’s calculation of these non-GAAP financial measures.
###
(MORE)
U.S. Bancorp
Consolidated Statement of Income
| Three Months Ended | Year Ended | |||||||||||||||
| (Dollars and Shares in Millions, Except Per Share Data) | December 31, | December 31, | ||||||||||||||
| (Unaudited) |
2016 | 2015 | 2016 | 2015 | ||||||||||||
| Interest Income |
||||||||||||||||
| Loans |
$ | 2,771 | $ | 2,583 | $ | 10,810 | $ | 10,059 | ||||||||
| Loans held for sale |
44 | 40 | 154 | 206 | ||||||||||||
| Investment securities |
523 | 499 | 2,078 | 2,001 | ||||||||||||
| Other interest income |
36 | 34 | 125 | 136 | ||||||||||||
|
|
|
|
|
|
|
|
|
|||||||||
| Total interest income |
3,374 | 3,156 | 13,167 | 12,402 | ||||||||||||
| Interest Expense |
||||||||||||||||
| Deposits |
170 | 113 | 622 | 457 | ||||||||||||
| Short-term borrowings |
62 | 56 | 263 | 245 | ||||||||||||
| Long-term debt |
187 | 168 | 754 | 699 | ||||||||||||
|
|
|
|
|
|
|
|
|
|||||||||
| Total interest expense |
419 | 337 | 1,639 | 1,401 | ||||||||||||
|
|
|
|
|
|
|
|
|
|||||||||
| Net interest income |
2,955 | 2,819 | 11,528 | 11,001 | ||||||||||||
| Provision for credit losses |
342 | 305 | 1,324 | 1,132 | ||||||||||||
|
|
|
|
|
|
|
|
|
|||||||||
| Net interest income after provision for credit losses |
2,613 | 2,514 | 10,204 | 9,869 | ||||||||||||
| Noninterest Income |
||||||||||||||||
| Credit and debit card revenue |
316 | 294 | 1,177 | 1,070 | ||||||||||||
| Corporate payment products revenue |
171 | 170 | 712 | 708 | ||||||||||||
| Merchant processing services |
404 | 393 | 1,592 | 1,547 | ||||||||||||
| ATM processing services |
87 | 79 | 338 | 318 | ||||||||||||
| Trust and investment management fees |
368 | 336 | 1,427 | 1,321 | ||||||||||||
| Deposit service charges |
186 | 182 | 725 | 702 | ||||||||||||
| Treasury management fees |
147 | 139 | 583 | 561 | ||||||||||||
| Commercial products revenue |
217 | 222 | 871 | 867 | ||||||||||||
| Mortgage banking revenue |
240 | 211 | 979 | 906 | ||||||||||||
| Investment products fees |
38 | 44 | 158 | 185 | ||||||||||||
| Securities gains (losses), net |
6 | 1 | 22 | — | ||||||||||||
| Other |
251 | 269 | 993 | 907 | ||||||||||||
|
|
|
|
|
|
|
|
|
|||||||||
| Total noninterest income |
2,431 | 2,340 | 9,577 | 9,092 | ||||||||||||
| Noninterest Expense |
||||||||||||||||
| Compensation |
1,357 | 1,212 | 5,212 | 4,812 | ||||||||||||
| Employee benefits |
261 | 272 | 1,119 | 1,167 | ||||||||||||
| Net occupancy and equipment |
247 | 246 | 988 | 991 | ||||||||||||
| Professional services |
156 | 125 | 502 | 423 | ||||||||||||
| Marketing and business development |
107 | 96 | 435 | 361 | ||||||||||||
| Technology and communications |
238 | 230 | 955 | 887 | ||||||||||||
| Postage, printing and supplies |
75 | 74 | 311 | 297 | ||||||||||||
| Other intangibles |
45 | 46 | 179 | 174 | ||||||||||||
| Other |
518 | 508 | 1,975 | 1,819 | ||||||||||||
|
|
|
|
|
|
|
|
|
|||||||||
| Total noninterest expense |
3,004 | 2,809 | 11,676 | 10,931 | ||||||||||||
|
|
|
|
|
|
|
|
|
|||||||||
| Income before income taxes |
2,040 | 2,045 | 8,105 | 8,030 | ||||||||||||
| Applicable income taxes |
549 | 556 | 2,161 | 2,097 | ||||||||||||
|
|
|
|
|
|
|
|
|
|||||||||
| Net income |
1,491 | 1,489 | 5,944 | 5,933 | ||||||||||||
| Net (income) loss attributable to noncontrolling interests |
(13 | ) | (13 | ) | (56 | ) | (54 | ) | ||||||||
|
|
|
|
|
|
|
|
|
|||||||||
| Net income attributable to U.S. Bancorp |
$ | 1,478 | $ | 1,476 | $ | 5,888 | $ | 5,879 | ||||||||
|
|
|
|
|
|
|
|
|
|||||||||
| Net income applicable to U.S. Bancorp common shareholders |
$ | 1,391 | $ | 1,404 | $ | 5,589 | $ | 5,608 | ||||||||
|
|
|
|
|
|
|
|
|
|||||||||
| Earnings per common share |
$ | .82 | $ | .80 | $ | 3.25 | $ | 3.18 | ||||||||
| Diluted earnings per common share |
$ | .82 | $ | .80 | $ | 3.24 | $ | 3.16 | ||||||||
| Dividends declared per common share |
$ | .280 | $ | .255 | $ | 1.070 | $ | 1.010 | ||||||||
| Average common shares outstanding |
1,700 | 1,747 | 1,718 | 1,764 | ||||||||||||
| Average diluted common shares outstanding |
1,705 | 1,754 | 1,724 | 1,772 | ||||||||||||
Page 19
U.S. Bancorp
Consolidated Ending Balance Sheet
| December 31, | December 31, | |||||||
| (Dollars in Millions) |
2016 | 2015 | ||||||
| Assets |
||||||||
| Cash and due from banks |
$ | 15,705 | $ | 11,147 | ||||
| Investment securities |
||||||||
|
Held-to-maturity |
42,991 | 43,590 | ||||||
|
Available-for-sale |
66,284 | 61,997 | ||||||
| Loans held for sale |
4,826 | 3,184 | ||||||
| Loans |
||||||||
| Commercial |
93,386 | 88,402 | ||||||
| Commercial real estate |
43,098 | 42,137 | ||||||
| Residential mortgages |
57,274 | 53,496 | ||||||
| Credit card |
21,749 | 21,012 | ||||||
| Other retail |
53,864 | 51,206 | ||||||
|
|
|
|
|
|||||
| Total loans, excluding covered loans |
269,371 | 256,253 | ||||||
| Covered loans |
3,836 | 4,596 | ||||||
|
|
|
|
|
|||||
| Total loans |
273,207 | 260,849 | ||||||
| Less allowance for loan losses |
(3,813 | ) | (3,863 | ) | ||||
|
|
|
|
|
|||||
| Net loans |
269,394 | 256,986 | ||||||
| Premises and equipment |
2,443 | 2,513 | ||||||
| Goodwill |
9,344 | 9,361 | ||||||
| Other intangible assets |
3,303 | 3,350 | ||||||
| Other assets |
31,674 | 29,725 | ||||||
|
|
|
|
|
|||||
| Total assets |
$ | 445,964 | $ | 421,853 | ||||
|
|
|
|
|
|||||
| Liabilities and Shareholders’ Equity |
||||||||
| Deposits |
||||||||
| Noninterest-bearing |
$ | 86,097 | $ | 83,766 | ||||
| Interest-bearing |
248,493 | 216,634 | ||||||
|
|
|
|
|
|||||
| Total deposits |
334,590 | 300,400 | ||||||
| Short-term borrowings |
13,963 | 27,877 | ||||||
| Long-term debt |
33,323 | 32,078 | ||||||
| Other liabilities |
16,155 | 14,681 | ||||||
|
|
|
|
|
|||||
| Total liabilities |
398,031 | 375,036 | ||||||
| Shareholders’ equity |
||||||||
| Preferred stock |
5,501 | 5,501 | ||||||
| Common stock |
21 | 21 | ||||||
| Capital surplus |
8,440 | 8,376 | ||||||
| Retained earnings |
50,151 | 46,377 | ||||||
| Less treasury stock |
(15,280 | ) | (13,125 | ) | ||||
| Accumulated other comprehensive income (loss) |
(1,535 | ) | (1,019 | ) | ||||
|
|
|
|
|
|||||
| Total U.S. Bancorp shareholders’ equity |
47,298 | 46,131 | ||||||
| Noncontrolling interests |
635 | 686 | ||||||
|
|
|
|
|
|||||
| Total equity |
47,933 | 46,817 | ||||||
|
|
|
|
|
|||||
| Total liabilities and equity |
$ | 445,964 | $ | 421,853 | ||||
Page 20
U.S. Bancorp
Non-GAAP Financial Measures
| December 31, | September 30, | June 30, | March 31, | December 31, | ||||||||||||||||
| (Dollars in Millions, Unaudited) |
2016 | 2016 | 2016 | 2016 | 2015 | |||||||||||||||
| Total equity |
$ | 47,933 | $ | 48,399 | $ | 48,029 | $ | 47,393 | $ | 46,817 | ||||||||||
| Preferred stock |
(5,501 | ) | (5,501 | ) | (5,501 | ) | (5,501 | ) | (5,501 | ) | ||||||||||
| Noncontrolling interests |
(635 | ) | (640 | ) | (639 | ) | (638 | ) | (686 | ) | ||||||||||
| Goodwill (net of deferred tax liability) (1) |
(8,203 | ) | (8,239 | ) | (8,246 | ) | (8,270 | ) | (8,295 | ) | ||||||||||
| Intangible assets, other than mortgage servicing rights |
(712 | ) | (756 | ) | (796 | ) | (820 | ) | (838 | ) | ||||||||||
|
|
|
|
|
|
|
|
|
|
|
|||||||||||
| Tangible common equity (a) |
32,882 | 33,263 | 32,847 | 32,164 | 31,497 | |||||||||||||||
| Tangible common equity (as calculated above) |
32,882 | 33,263 | 32,847 | 32,164 | 31,497 | |||||||||||||||
| Adjustments (2) |
(55 | ) | 97 | 133 | 99 | 67 | ||||||||||||||
|
|
|
|
|
|
|
|
|
|
|
|||||||||||
| Common equity tier 1 capital estimated for the Basel III fully implemented standardized and advanced approaches (b) |
32,827 | 33,360 | 32,980 | 32,263 | 31,564 | |||||||||||||||
| Total assets |
445,964 | 454,134 | 438,463 | 428,638 | 421,853 | |||||||||||||||
| Goodwill (net of deferred tax liability) (1) |
(8,203 | ) | (8,239 | ) | (8,246 | ) | (8,270 | ) | (8,295 | ) | ||||||||||
| Intangible assets, other than mortgage servicing rights |
(712 | ) | (756 | ) | (796 | ) | (820 | ) | (838 | ) | ||||||||||
|
|
|
|
|
|
|
|
|
|
|
|||||||||||
| Tangible assets (c) |
437,049 | 445,139 | 429,421 | 419,548 | 412,720 | |||||||||||||||
| Risk-weighted assets, determined in accordance with prescribed transitional standardized approach regulatory requirements (d) |
358,237 | * | 356,733 | 351,462 | 346,227 | 341,360 | ||||||||||||||
| Adjustments (3) |
4,027 | * | 3,165 | 3,079 | 3,485 | 3,892 | ||||||||||||||
|
|
|
|
|
|
|
|
|
|
|
|||||||||||
| Risk-weighted assets estimated for the Basel III fully implemented standardized approach (e) |
362,264 | * | 359,898 | 354,541 | 349,712 | 345,252 | ||||||||||||||
| Risk-weighted assets, determined in accordance with prescribed transitional advanced approaches regulatory requirements |
277,141 | * | 272,832 | 271,495 | 267,309 | 261,668 | ||||||||||||||
| Adjustments (4) |
4,295 | * | 3,372 | 3,283 | 3,707 | 4,099 | ||||||||||||||
|
|
|
|
|
|
|
|
|
|
|
|||||||||||
| Risk-weighted assets estimated for the Basel III fully implemented advanced approaches (f) |
281,436 | * | 276,204 | 274,778 | 271,016 | 265,767 | ||||||||||||||
| Ratios* |
||||||||||||||||||||
| Tangible common equity to tangible assets (a)/(c) |
7.5 | % | 7.5 | % | 7.6 | % | 7.7 | % | 7.6 | % | ||||||||||
| Tangible common equity to risk-weighted assets (a)/(d) |
9.2 | 9.3 | 9.3 | 9.3 | 9.2 | |||||||||||||||
| Common equity tier 1 capital to risk-weighted assets estimated for the Basel III fully implemented standardized approach (b)/(e) |
9.1 | 9.3 | 9.3 | 9.2 | 9.1 | |||||||||||||||
| Common equity tier 1 capital to risk-weighted assets estimated for the Basel III fully implemented advanced approaches (b)/(f) |
11.7 | 12.1 | 12.0 | 11.9 | 11.9 | |||||||||||||||
| Three Months Ended | Year Ended | |||||||||||||||||||||||||||
| December 31, | September 30, | June 30, | March 31, | December 31, | December 31, | December 31, | ||||||||||||||||||||||
| 2016 | 2016 | 2016 | 2016 | 2015 | 2016 | 2015 | ||||||||||||||||||||||
| Net interest income |
$ | 2,955 | $ | 2,893 | $ | 2,845 | $ | 2,835 | $ | 2,819 | $ | 11,528 | $ | 11,001 | ||||||||||||||
| Taxable-equivalent adjustment (5) |
49 | 50 | 51 | 53 | 52 | 203 | 213 | |||||||||||||||||||||
|
|
|
|
|
|
|
|
|
|
|
|
|
|
|
|||||||||||||||
| Net interest income, on a taxable-equivalent basis |
3,004 | 2,943 | 2,896 | 2,888 | 2,871 | 11,731 | 11,214 | |||||||||||||||||||||
| Net interest income, on a taxable-equivalent basis (as calculated above) |
3,004 | 2,943 | 2,896 | 2,888 | 2,871 | 11,731 | 11,214 | |||||||||||||||||||||
| Noninterest income |
2,431 | 2,445 | 2,552 | 2,149 | 2,340 | 9,577 | 9,092 | |||||||||||||||||||||
| Less: Securities gains (losses), net |
6 | 10 | 3 | 3 | 1 | 22 | — | |||||||||||||||||||||
|
|
|
|
|
|
|
|
|
|
|
|
|
|
|
|||||||||||||||
| Total net revenue, excluding net securities gains (losses) (g) |
5,429 | 5,378 | 5,445 | 5,034 | 5,210 | 21,286 | 20,306 | |||||||||||||||||||||
| Noninterest expense (h) |
3,004 | 2,931 | 2,992 | 2,749 | 2,809 | 11,676 | 10,931 | |||||||||||||||||||||
| Less: Intangible amortization |
45 | 45 | 44 | 45 | 46 | 179 | 174 | |||||||||||||||||||||
|
|
|
|
|
|
|
|
|
|
|
|
|
|
|
|||||||||||||||
| Noninterest expense, excluding intangible amortization (i) |
2,959 | 2,886 | 2,948 | 2,704 | 2,763 | 11,497 | 10,757 | |||||||||||||||||||||
| Efficiency ratio (h)/(g) |
55.3 | % | 54.5 | % | 54.9 | % | 54.6 | % | 53.9 | % | 54.9 | % | 53.8 | % | ||||||||||||||
| Tangible efficiency ratio (i)/(g) |
54.5 | 53.7 | 54.1 | 53.7 | 53.0 | 54.0 | 53.0 | |||||||||||||||||||||
| * | Preliminary data. Subject to change prior to filings with applicable regulatory agencies. |
| (1) | Includes goodwill related to certain investments in unconsolidated financial institutions per prescribed regulatory requirements. |
| (2) | Includes net losses on cash flow hedges included in accumulated other comprehensive income (loss) and other adjustments. |
| (3) | Includes higher risk-weighting for unfunded loan commitments, investment securities, residential mortgages, mortgage servicing rights and other adjustments. |
| (4) | Primarily reflects higher risk-weighting for mortgage servicing rights. |
| (5) | Utilizes a tax rate of 35 percent for those assets and liabilities whose income or expense is not included for federal income tax purposes. |
Page 21
Supplemental Business Line Schedules
4Q 2016

U.S. Bancorp Fourth Quarter 2016 Business Line Results
January 18, 2017
Page 2
| LINE OF BUSINESS FINANCIAL PERFORMANCE (a) |
||||||||||||||||||||||||||||||||||||
| ($ in millions) | ||||||||||||||||||||||||||||||||||||
| Net Income Attributable | Net Income Attributable | |||||||||||||||||||||||||||||||||||
| to U.S. Bancorp | Percent Change | to U.S. Bancorp | 4Q 2016 | |||||||||||||||||||||||||||||||||
| 4Q | 3Q | 4Q | 4Q16 vs | 4Q16 vs | Full Year | Full Year | Percent | Earnings | ||||||||||||||||||||||||||||
| Business Line |
2016 | 2016 | 2015 | 3Q16 | 4Q15 | 2016 | 2015 | Change | Composition | |||||||||||||||||||||||||||
| Wholesale Banking and Commercial Real Estate |
$ | 276 | $ | 229 | $ | 198 | 20.5 | 39.4 | $ | 861 | $ | 861 | — | 19 | % | |||||||||||||||||||||
| Consumer and Small Business Banking |
309 | 370 | 349 | (16.5 | ) | (11.5 | ) | 1,370 | 1,323 | 3.6 | 21 | |||||||||||||||||||||||||
| Wealth Management and Securities Services |
107 | 95 | 68 | 12.6 | 57.4 | 379 | 242 | 56.6 | 7 | |||||||||||||||||||||||||||
| Payment Services |
322 | 332 | 329 | (3.0 | ) | (2.1 | ) | 1,276 | 1,173 | 8.8 | 22 | |||||||||||||||||||||||||
| Treasury and Corporate Support |
464 | 476 | 532 | (2.5 | ) | (12.8 | ) | 2,002 | 2,280 | (12.2 | ) | 31 | ||||||||||||||||||||||||
|
|
|
|
|
|
|
|
|
|
|
|
|
|||||||||||||||||||||||||
| Consolidated Company |
$ | 1,478 | $ | 1,502 | $ | 1,476 | (1.6 | ) | .1 | $ | 5,888 | $ | 5,879 | .2 | 100 | % | ||||||||||||||||||||
|
|
|
|
|
|
|
|
|
|
|
|
|
|||||||||||||||||||||||||
| (a) | preliminary data |
Lines of Business
The Company’s major lines of business are Wholesale Banking and Commercial Real Estate, Consumer and Small Business Banking, Wealth Management and Securities Services, Payment Services, and Treasury and Corporate Support. These operating segments are components of the Company about which financial information is prepared and is evaluated regularly by management in deciding how to allocate resources and assess performance. Noninterest expenses incurred by centrally managed operations or business lines that directly support another business line’s operations are charged to the applicable business line based on its utilization of those services, primarily measured by the volume of customer activities, number of employees
or other relevant factors. These allocated expenses are reported as net shared services expense within noninterest expense. Designations, assignments and allocations change from time to time as management systems are enhanced, methods of evaluating performance or product lines change or business segments are realigned to better respond to the Company’s diverse customer base. During 2016, certain organization and methodology changes were made and, accordingly, prior period results were restated and presented on a comparable basis.
U.S. Bancorp Fourth Quarter 2016 Business Line Results
January 18, 2017
Page 3
| WHOLESALE BANKING AND COMMERCIAL REAL ESTATE (a) |
||||||||||||||||||||||||||||||||
| ($ in millions) |
||||||||||||||||||||||||||||||||
| Percent Change | ||||||||||||||||||||||||||||||||
| 4Q | 3Q | 4Q | 4Q16 vs | 4Q16 vs | YTD | YTD | Percent | |||||||||||||||||||||||||
| 2016 | 2016 | 2015 | 3Q16 | 4Q15 | 2016 | 2015 | Change | |||||||||||||||||||||||||
| Condensed Income Statement |
||||||||||||||||||||||||||||||||
| Net interest income (taxable-equivalent basis) |
$ | 602 | $ | 563 | $ | 507 | 6.9 | 18.7 | $ | 2,240 | $ | 2,002 | 11.9 | |||||||||||||||||||
| Noninterest income |
221 | 220 | 222 | .5 | (.5 | ) | 897 | 892 | .6 | |||||||||||||||||||||||
| Securities gains (losses), net |
2 | — | — | nm | nm | 2 | — | nm | ||||||||||||||||||||||||
|
|
|
|
|
|
|
|
|
|
|
|||||||||||||||||||||||
| Total net revenue |
825 | 783 | 729 | 5.4 | 13.2 | 3,139 | 2,894 | 8.5 | ||||||||||||||||||||||||
| Noninterest expense |
367 | 349 | 332 | 5.2 | 10.5 | 1,417 | 1,322 | 7.2 | ||||||||||||||||||||||||
| Other intangibles |
1 | 1 | 1 | — | — | 4 | 4 | — | ||||||||||||||||||||||||
|
|
|
|
|
|
|
|
|
|
|
|||||||||||||||||||||||
| Total noninterest expense |
368 | 350 | 333 | 5.1 | 10.5 | 1,421 | 1,326 | 7.2 | ||||||||||||||||||||||||
|
|
|
|
|
|
|
|
|
|
|
|||||||||||||||||||||||
| Income before provision and taxes |
457 | 433 | 396 | 5.5 | 15.4 | 1,718 | 1,568 | 9.6 | ||||||||||||||||||||||||
| Provision for credit losses |
23 | 73 | 84 | (68.5 | ) | (72.6 | ) | 365 | 214 | 70.6 | ||||||||||||||||||||||
|
|
|
|
|
|
|
|
|
|
|
|||||||||||||||||||||||
| Income before income taxes |
434 | 360 | 312 | 20.6 | 39.1 | 1,353 | 1,354 | (.1 | ) | |||||||||||||||||||||||
| Income taxes and taxable-equivalent adjustment |
158 | 131 | 114 | 20.6 | 38.6 | 492 | 493 | (.2 | ) | |||||||||||||||||||||||
|
|
|
|
|
|
|
|
|
|
|
|||||||||||||||||||||||
| Net income |
276 | 229 | 198 | 20.5 | 39.4 | 861 | 861 | — | ||||||||||||||||||||||||
| Net (income) loss attributable to noncontrolling interests |
— | — | — | — | — | — | — | — | ||||||||||||||||||||||||
|
|
|
|
|
|
|
|
|
|
|
|||||||||||||||||||||||
| Net income attributable to U.S. Bancorp |
$ | 276 | $ | 229 | $ | 198 | 20.5 | 39.4 | $ | 861 | $ | 861 | — | |||||||||||||||||||
|
|
|
|
|
|
|
|
|
|
|
|||||||||||||||||||||||
| Average Balance Sheet Data |
||||||||||||||||||||||||||||||||
| Loans |
$ | 93,654 | $ | 92,299 | $ | 87,242 | 1.5 | 7.3 | $ | 92,057 | $ | 85,085 | 8.2 | |||||||||||||||||||
| Other earning assets |
2,833 | 2,500 | 1,987 | 13.3 | 42.6 | 2,452 | 2,233 | 9.8 | ||||||||||||||||||||||||
| Goodwill |
1,647 | 1,647 | 1,647 | — | — | 1,647 | 1,647 | — | ||||||||||||||||||||||||
| Other intangible assets |
16 | 16 | 19 | — | (15.8 | ) | 17 | 20 | (15.0 | ) | ||||||||||||||||||||||
| Assets |
102,471 | 100,871 | 95,248 | 1.6 | 7.6 | 100,575 | 93,421 | 7.7 | ||||||||||||||||||||||||
| Noninterest-bearing deposits |
37,891 | 36,625 | 38,138 | 3.5 | (.6 | ) | 36,849 | 36,345 | 1.4 | |||||||||||||||||||||||
| Interest-bearing deposits |
72,157 | 67,406 | 51,581 | 7.0 | 39.9 | 63,977 | 50,567 | 26.5 | ||||||||||||||||||||||||
|
|
|
|
|
|
|
|
|
|
|
|||||||||||||||||||||||
| Total deposits |
110,048 | 104,031 | 89,719 | 5.8 | 22.7 | 100,826 | 86,912 | 16.0 | ||||||||||||||||||||||||
| Total U.S. Bancorp shareholders’ equity |
9,201 | 8,997 | 8,449 | 2.3 | 8.9 | 8,996 | 8,309 | 8.3 | ||||||||||||||||||||||||
| (a) | preliminary data |
Wholesale Banking and Commercial Real Estate offers lending, equipment finance and small-ticket leasing, depository services, treasury management, capital markets services, international trade services and other financial services to middle market, large corporate, commercial real estate, financial institution, non-profit and public sector clients. Wholesale Banking and Commercial Real Estate contributed $276 million of the Company’s net income in the fourth quarter of 2016, compared with $198 million in the fourth quarter of 2015. Wholesale Banking and Commercial Real Estate’s net income increased $78 million (39.4 percent) over the same quarter of 2015 primarily due to an increase in net interest income and a decrease in the provision for credit losses, partially offset by an increase in noninterest expense. Total net revenue increased $96 million (13.2 percent) due to a $95 million (18.7 percent) increase in net interest income, while noninterest income was essentially flat. Net interest income increased year-over-year primarily due to higher
U.S. Bancorp Fourth Quarter 2016 Business Line Results
January 18, 2017
Page 4
average loan and deposit balances along with the impact of higher rates on the margin benefit from deposits, partially offset by lower rates on loans. Total noninterest expense was $35 million (10.5 percent) higher compared with a year ago primarily due to an increase in variable costs allocated to manage the business, including the impact of a special FDIC surcharge that began in the third quarter of 2016. The provision for credit losses decreased $61 million (72.6 percent) primarily due to a favorable change in the reserve allocation driven by an increase in reserves related to energy credits in the prior year and lower net charge-offs.
U.S. Bancorp Fourth Quarter 2016 Business Line Results
January 18, 2017
Page 5
| CONSUMER AND SMALL BUSINESS BANKING (a) |
||||||||||||||||||||||||||||||||
| ($ in millions) | ||||||||||||||||||||||||||||||||
| Percent Change | ||||||||||||||||||||||||||||||||
| 4Q | 3Q | 4Q | 4Q16 vs | 4Q16 vs | YTD | YTD | Percent | |||||||||||||||||||||||||
| 2016 | 2016 | 2015 | 3Q16 | 4Q15 | 2016 | 2015 | Change | |||||||||||||||||||||||||
| Condensed Income Statement |
||||||||||||||||||||||||||||||||
| Net interest income (taxable-equivalent basis) |
$ | 1,229 | $ | 1,199 | $ | 1,161 | 2.5 | 5.9 | $ | 4,752 | $ | 4,580 | 3.8 | |||||||||||||||||||
| Noninterest income |
627 | 712 | 608 | (11.9 | ) | 3.1 | 2,527 | 2,485 | 1.7 | |||||||||||||||||||||||
| Securities gains (losses), net |
— | — | — | — | — | — | — | — | ||||||||||||||||||||||||
|
|
|
|
|
|
|
|
|
|
|
|||||||||||||||||||||||
| Total net revenue |
1,856 | 1,911 | 1,769 | (2.9 | ) | 4.9 | 7,279 | 7,065 | 3.0 | |||||||||||||||||||||||
| Noninterest expense |
1,291 | 1,276 | 1,181 | 1.2 | 9.3 | 4,999 | 4,799 | 4.2 | ||||||||||||||||||||||||
| Other intangibles |
8 | 8 | 10 | — | (20.0 | ) | 32 | 40 | (20.0 | ) | ||||||||||||||||||||||
|
|
|
|
|
|
|
|
|
|
|
|||||||||||||||||||||||
| Total noninterest expense |
1,299 | 1,284 | 1,191 | 1.2 | 9.1 | 5,031 | 4,839 | 4.0 | ||||||||||||||||||||||||
|
|
|
|
|
|
|
|
|
|
|
|||||||||||||||||||||||
| Income before provision and taxes |
557 | 627 | 578 | (11.2 | ) | (3.6 | ) | 2,248 | 2,226 | 1.0 | ||||||||||||||||||||||
| Provision for credit losses |
71 | 45 | 30 | 57.8 | nm | 93 | 148 | (37.2 | ) | |||||||||||||||||||||||
|
|
|
|
|
|
|
|
|
|
|
|||||||||||||||||||||||
| Income before income taxes |
486 | 582 | 548 | (16.5 | ) | (11.3 | ) | 2,155 | 2,078 | 3.7 | ||||||||||||||||||||||
| Income taxes and taxable-equivalent adjustment |
177 | 212 | 199 | (16.5 | ) | (11.1 | ) | 785 | 755 | 4.0 | ||||||||||||||||||||||
|
|
|
|
|
|
|
|
|
|
|
|||||||||||||||||||||||
| Net income |
309 | 370 | 349 | (16.5 | ) | (11.5 | ) | 1,370 | 1,323 | 3.6 | ||||||||||||||||||||||
| Net (income) loss attributable to noncontrolling interests |
— | — | — | — | — | — | — | — | ||||||||||||||||||||||||
|
|
|
|
|
|
|
|
|
|
|
|||||||||||||||||||||||
| Net income attributable to U.S. Bancorp |
$ | 309 | $ | 370 | $ | 349 | (16.5 | ) | (11.5 | ) | $ | 1,370 | $ | 1,323 | 3.6 | |||||||||||||||||
|
|
|
|
|
|
|
|
|
|
|
|||||||||||||||||||||||
| Average Balance Sheet Data |
||||||||||||||||||||||||||||||||
| Loans |
$ | 138,691 | $ | 137,671 | $ | 132,467 | .7 | 4.7 | $ | 136,425 | $ | 129,670 | 5.2 | |||||||||||||||||||
| Other earning assets |
5,476 | 5,257 | 4,661 | 4.2 | 17.5 | 4,703 | 6,519 | (27.9 | ) | |||||||||||||||||||||||
| Goodwill |
3,681 | 3,681 | 3,681 | — | — | 3,681 | 3,681 | — | ||||||||||||||||||||||||
| Other intangible assets |
2,508 | 2,270 | 2,654 | 10.5 | (5.5 | ) | 2,421 | 2,594 | (6.7 | ) | ||||||||||||||||||||||
| Assets |
154,887 | 153,496 | 147,600 | .9 | 4.9 | 151,754 | 146,554 | 3.5 | ||||||||||||||||||||||||
| Noninterest-bearing deposits |
28,838 | 28,379 | 26,691 | 1.6 | 8.0 | 27,544 | 25,829 | 6.6 | ||||||||||||||||||||||||
| Interest-bearing deposits |
117,411 | 115,884 | 110,483 | 1.3 | 6.3 | 115,325 | 109,511 | 5.3 | ||||||||||||||||||||||||
|
|
|
|
|
|
|
|
|
|
|
|||||||||||||||||||||||
| Total deposits |
146,249 | 144,263 | 137,174 | 1.4 | 6.6 | 142,869 | 135,340 | 5.6 | ||||||||||||||||||||||||
| Total U.S. Bancorp shareholders’ equity |
11,353 | 11,312 | 10,736 | .4 | 5.7 | 11,192 | 10,892 | 2.8 | ||||||||||||||||||||||||
| (a) | preliminary data |
Consumer and Small Business Banking delivers products and services through banking offices, telephone servicing and sales, on-line services, direct mail, ATM processing and mobile devices, such as mobile phones and tablet computers. It encompasses community banking, metropolitan banking and indirect lending, as well as mortgage banking. Consumer and Small Business Banking contributed $309 million of the Company’s net income in the fourth quarter of 2016, compared with $349 million in the fourth quarter of 2015. Consumer and Small Business Banking’s net income decreased $40 million (11.5 percent) from the same quarter of 2015 due to an increase in noninterest expense and an increase in the provision for credit losses, partially offset by an increase in total net revenue. Total net revenue increased $87 million (4.9 percent) due to higher net interest income and noninterest income. Net interest income was $68 million (5.9 percent) higher primarily due to higher average loan and deposit balances, partially offset by lower loan
U.S. Bancorp Fourth Quarter 2016 Business Line Results
January 18, 2017
Page 6
rates. Noninterest income was $19 million (3.1 percent) higher than a year ago, driven by higher mortgage banking revenue, reflecting the impact of higher origination and sales revenue, partially offset by lower income from leasing residuals. Total noninterest expense in the fourth quarter of 2016 increased $108 million (9.1 percent) over the same quarter of the prior year primarily due to higher net shared services expense, including the impact of capital investments to support business growth, and higher compensation expense, reflecting the impact of merit increases, increased staffing, and higher variable compensation related to higher mortgage production. The provision for credit losses increased $41 million primarily due to an unfavorable change in the reserve allocation reflecting slower improvements in residential mortgage and home equity credit quality and higher net charge-offs.
U.S. Bancorp Fourth Quarter 2016 Business Line Results
January 18, 2017
Page 7
| WEALTH MANAGEMENT AND SECURITIES SERVICES (a) |
||||||||||||||||||||||||||||||||
| ($ in millions) | ||||||||||||||||||||||||||||||||
| Percent Change | ||||||||||||||||||||||||||||||||
| 4Q | 3Q | 4Q | 4Q16 vs | 4Q16 vs | YTD | YTD | Percent | |||||||||||||||||||||||||
| 2016 | 2016 | 2015 | 3Q16 | 4Q15 | 2016 | 2015 | Change | |||||||||||||||||||||||||
| Condensed Income Statement |
||||||||||||||||||||||||||||||||
| Net interest income (taxable-equivalent basis) |
$ | 163 | $ | 135 | $ | 103 | 20.7 | 58.3 | $ | 537 | $ | 355 | 51.3 | |||||||||||||||||||
| Noninterest income |
406 | 403 | 375 | .7 | 8.3 | 1,589 | 1,475 | 7.7 | ||||||||||||||||||||||||
| Securities gains (losses), net |
— | — | — | — | — | — | — | — | ||||||||||||||||||||||||
|
|
|
|
|
|
|
|
|
|
|
|||||||||||||||||||||||
| Total net revenue |
569 | 538 | 478 | 5.8 | 19.0 | 2,126 | 1,830 | 16.2 | ||||||||||||||||||||||||
| Noninterest expense |
397 | 384 | 364 | 3.4 | 9.1 | 1,510 | 1,422 | 6.2 | ||||||||||||||||||||||||
| Other intangibles |
6 | 6 | 7 | — | (14.3 | ) | 24 | 28 | (14.3 | ) | ||||||||||||||||||||||
|
|
|
|
|
|
|
|
|
|
|
|||||||||||||||||||||||
| Total noninterest expense |
403 | 390 | 371 | 3.3 | 8.6 | 1,534 | 1,450 | 5.8 | ||||||||||||||||||||||||
|
|
|
|
|
|
|
|
|
|
|
|||||||||||||||||||||||
| Income before provision and taxes |
166 | 148 | 107 | 12.2 | 55.1 | 592 | 380 | 55.8 | ||||||||||||||||||||||||
| Provision for credit losses |
(2 | ) | (1 | ) | — | nm | nm | (4 | ) | — | nm | |||||||||||||||||||||
|
|
|
|
|
|
|
|
|
|
|
|||||||||||||||||||||||
| Income before income taxes |
168 | 149 | 107 | 12.8 | 57.0 | 596 | 380 | 56.8 | ||||||||||||||||||||||||
| Income taxes and taxable-equivalent adjustment |
61 | 54 | 39 | 13.0 | 56.4 | 217 | 138 | 57.2 | ||||||||||||||||||||||||
|
|
|
|
|
|
|
|
|
|
|
|||||||||||||||||||||||
| Net income |
107 | 95 | 68 | 12.6 | 57.4 | 379 | 242 | 56.6 | ||||||||||||||||||||||||
| Net (income) loss attributable to noncontrolling interests |
— | — | — | — | — | — | — | — | ||||||||||||||||||||||||
|
|
|
|
|
|
|
|
|
|
|
|||||||||||||||||||||||
| Net income attributable to U.S. Bancorp |
$ | 107 | $ | 95 | $ | 68 | 12.6 | 57.4 | $ | 379 | $ | 242 | 56.6 | |||||||||||||||||||
|
|
|
|
|
|
|
|
|
|
|
|||||||||||||||||||||||
| Average Balance Sheet Data |
|
|||||||||||||||||||||||||||||||
| Loans |
$ | 7,645 | $ | 7,297 | $ | 6,639 | 4.8 | 15.2 | $ | 7,261 | $ | 6,225 | 16.6 | |||||||||||||||||||
| Other earning assets |
145 | 142 | 182 | 2.1 | (20.3 | ) | 141 | 203 | (30.5 | ) | ||||||||||||||||||||||
| Goodwill |
1,567 | 1,567 | 1,567 | — | — | 1,566 | 1,567 | (.1 | ) | |||||||||||||||||||||||
| Other intangible assets |
93 | 99 | 116 | (6.1 | ) | (19.8 | ) | 101 | 126 | (19.8 | ) | |||||||||||||||||||||
| Assets |
10,655 | 10,382 | 9,524 | 2.6 | 11.9 | 10,352 | 9,238 | 12.1 | ||||||||||||||||||||||||
| Noninterest-bearing deposits |
15,120 | 13,825 | 16,223 | 9.4 | (6.8 | ) | 13,735 | 14,393 | (4.6 | ) | ||||||||||||||||||||||
| Interest-bearing deposits |
53,909 | 51,705 | 46,377 | 4.3 | 16.2 | 49,924 | 45,296 | 10.2 | ||||||||||||||||||||||||
|
|
|
|
|
|
|
|
|
|
|
|||||||||||||||||||||||
| Total deposits |
69,029 | 65,530 | 62,600 | 5.3 | 10.3 | 63,659 | 59,689 | 6.7 | ||||||||||||||||||||||||
| Total U.S. Bancorp shareholders’ equity |
2,392 | 2,378 | 2,329 | .6 | 2.7 | 2,382 | 2,312 | 3.0 | ||||||||||||||||||||||||
| (a) | preliminary data |
Wealth Management and Securities Services provides private banking, financial advisory services, investment management, retail brokerage services, insurance, trust, custody and fund servicing through five businesses: Wealth Management, Corporate Trust Services, U.S. Bancorp Asset Management, Institutional Trust & Custody and Fund Services. Wealth Management and Securities Services contributed $107 million of the Company’s net income in the fourth quarter of 2016, compared with $68 million in the fourth quarter of 2015. The business line’s contribution was $39 million (57.4 percent) higher than the same quarter of 2015, reflecting an increase in total net revenue, partially offset by an increase in total noninterest expense. Total net revenue increased $91 million (19.0 percent) year-over-year driven by an increase in net interest income of $60 million (58.3 percent), principally due to the impact of higher rates on the margin benefit from deposits, along with a $31 million (8.3 percent) increase in total noninterest income, reflecting the
U.S. Bancorp Fourth Quarter 2016 Business Line Results
January 18, 2017
Page 8
impact of lower money market fee waivers along with account growth, growth in assets under management and improved market conditions. Total noninterest expense increased $32 million (8.6 percent) primarily as a result of higher compensation expense, reflecting the impact of merit increases and higher staffing. The provision for credit losses was relatively flat compared with the prior year quarter.
U.S. Bancorp Fourth Quarter 2016 Business Line Results
January 18, 2017
Page 9
| PAYMENT SERVICES (a) |
||||||||||||||||||||||||||||||||
| ($ in millions) | ||||||||||||||||||||||||||||||||
| Percent Change | ||||||||||||||||||||||||||||||||
| 4Q | 3Q | 4Q | 4Q16 vs | 4Q16 vs | YTD | YTD | Percent | |||||||||||||||||||||||||
| 2016 | 2016 | 2015 | 3Q16 | 4Q15 | 2016 | 2015 | Change | |||||||||||||||||||||||||
| Condensed Income Statement |
||||||||||||||||||||||||||||||||
| Net interest income (taxable-equivalent basis) |
$ | 562 | $ | 538 | $ | 520 | 4.5 | 8.1 | $ | 2,140 | $ | 1,930 | 10.9 | |||||||||||||||||||
| Noninterest income |
911 | 912 | 870 | (.1 | ) | 4.7 | 3,562 | 3,371 | 5.7 | |||||||||||||||||||||||
| Securities gains (losses), net |
— | — | — | — | — | — | — | — | ||||||||||||||||||||||||
|
|
|
|
|
|
|
|
|
|
|
|||||||||||||||||||||||
| Total net revenue |
1,473 | 1,450 | 1,390 | 1.6 | 6.0 | 5,702 | 5,301 | 7.6 | ||||||||||||||||||||||||
| Noninterest expense |
671 | 677 | 632 | (.9 | ) | 6.2 | 2,656 | 2,521 | 5.4 | |||||||||||||||||||||||
| Other intangibles |
30 | 30 | 28 | — | 7.1 | 119 | 102 | 16.7 | ||||||||||||||||||||||||
|
|
|
|
|
|
|
|
|
|
|
|||||||||||||||||||||||
| Total noninterest expense |
701 | 707 | 660 | (.8 | ) | 6.2 | 2,775 | 2,623 | 5.8 | |||||||||||||||||||||||
|
|
|
|
|
|
|
|
|
|
|
|||||||||||||||||||||||
| Income before provision and taxes |
772 | 743 | 730 | 3.9 | 5.8 | 2,927 | 2,678 | 9.3 | ||||||||||||||||||||||||
| Provision for credit losses |
254 | 208 | 202 | 22.1 | 25.7 | 869 | 787 | 10.4 | ||||||||||||||||||||||||
|
|
|
|
|
|
|
|
|
|
|
|||||||||||||||||||||||
| Income before income taxes |
518 | 535 | 528 | (3.2 | ) | (1.9 | ) | 2,058 | 1,891 | 8.8 | ||||||||||||||||||||||
| Income taxes and taxable-equivalent adjustment |
189 | 195 | 192 | (3.1 | ) | (1.6 | ) | 750 | 687 | 9.2 | ||||||||||||||||||||||
|
|
|
|
|
|
|
|
|
|
|
|||||||||||||||||||||||
| Net income |
329 | 340 | 336 | (3.2 | ) | (2.1 | ) | 1,308 | 1,204 | 8.6 | ||||||||||||||||||||||
| Net (income) loss attributable to noncontrolling interests |
(7 | ) | (8 | ) | (7 | ) | 12.5 | — | (32 | ) | (31 | ) | (3.2 | ) | ||||||||||||||||||
|
|
|
|
|
|
|
|
|
|
|
|||||||||||||||||||||||
| Net income attributable to U.S. Bancorp |
$ | 322 | $ | 332 | $ | 329 | (3.0 | ) | (2.1 | ) | $ | 1,276 | $ | 1,173 | 8.8 | |||||||||||||||||
|
|
|
|
|
|
|
|
|
|
|
|||||||||||||||||||||||
| Average Balance Sheet Data |
||||||||||||||||||||||||||||||||
| Loans |
$ | 29,265 | $ | 28,909 | $ | 26,719 | 1.2 | 9.5 | $ | 28,549 | $ | 25,712 | 11.0 | |||||||||||||||||||
| Other earning assets |
258 | 267 | 1,039 | (3.4 | ) | (75.2 | ) | 351 | 526 | (33.3 | ) | |||||||||||||||||||||
| Goodwill |
2,456 | 2,463 | 2,469 | (.3 | ) | (.5 | ) | 2,465 | 2,475 | (.4 | ) | |||||||||||||||||||||
| Other intangible assets |
465 | 494 | 436 | (5.9 | ) | 6.7 | 494 | 411 | 20.2 | |||||||||||||||||||||||
| Assets |
34,891 | 34,733 | 33,082 | .5 | 5.5 | 34,409 | 31,796 | 8.2 | ||||||||||||||||||||||||
| Noninterest-bearing deposits |
964 | 954 | 891 | 1.0 | 8.2 | 951 | 879 | 8.2 | ||||||||||||||||||||||||
| Interest-bearing deposits |
99 | 98 | 708 | 1.0 | (86.0 | ) | 97 | 696 | (86.1 | ) | ||||||||||||||||||||||
|
|
|
|
|
|
|
|
|
|
|
|||||||||||||||||||||||
| Total deposits |
1,063 | 1,052 | 1,599 | 1.0 | (33.5 | ) | 1,048 | 1,575 | (33.5 | ) | ||||||||||||||||||||||
| Total U.S. Bancorp shareholders’ equity |
6,470 | 6,386 | 6,044 | 1.3 | 7.0 | 6,390 | 5,868 | 8.9 | ||||||||||||||||||||||||
| (a) | preliminary data |
Payment Services includes consumer and business credit cards, stored-value cards, debit cards, corporate, government and purchasing card services, consumer lines of credit and merchant processing. Payment Services contributed $322 million of the Company’s net income in the fourth quarter of 2016, compared with $329 million in the fourth quarter of 2015. The $7 million (2.1 percent) decrease in the business line’s contribution from the prior year was primarily due to an increase in the provision for credit losses and an increase in noninterest expense, partially offset by an increase in total net revenue, which grew $83 million (6.0 percent) year-over-year. Net interest income increased $42 million (8.1 percent) primarily due to higher average loan balances and fees. Total noninterest income was $41 million (4.7 percent) higher year-over-year due to an increase in credit and debit card revenue on higher transaction volumes, including the impact of acquired portfolios and an increase in merchant processing services as a result of an increase in
U.S. Bancorp Fourth Quarter 2016 Business Line Results
January 18, 2017
Page 10
product fees and higher volumes. Total noninterest expense increased $41 million (6.2 percent) over the fourth quarter of 2015, reflecting higher compensation expense due to merit increases and higher staffing to support business investment and compliance programs, higher net shared services expense, and higher card losses. The provision for credit losses increased $52 million (25.7 percent) due to an unfavorable change in the reserve allocation due to portfolio growth along with higher net charge-offs.
U.S. Bancorp Fourth Quarter 2016 Business Line Results
January 18, 2017
Page 11
| TREASURY AND CORPORATE SUPPORT (a) |
||||||||||||||||||||||||||||||||
| ($ in millions) | ||||||||||||||||||||||||||||||||
| Percent Change | ||||||||||||||||||||||||||||||||
| 4Q 2016 |
3Q 2016 |
4Q 2015 |
4Q16 vs 3Q16 |
4Q16 vs 4Q15 |
YTD 2016 |
YTD 2015 |
Percent Change |
|||||||||||||||||||||||||
| Condensed Income Statement |
||||||||||||||||||||||||||||||||
| Net interest income (taxable-equivalent basis) |
$ | 448 | $ | 508 | $ | 580 | (11.8 | ) | (22.8 | ) | $ | 2,062 | $ | 2,347 | (12.1 | ) | ||||||||||||||||
| Noninterest income |
260 | 188 | 264 | 38.3 | (1.5 | ) | 980 | 869 | 12.8 | |||||||||||||||||||||||
| Securities gains (losses), net |
4 | 10 | 1 | (60.0 | ) | nm | 20 | — | nm | |||||||||||||||||||||||
|
|
|
|
|
|
|
|
|
|
|
|||||||||||||||||||||||
| Total net revenue |
712 | 706 | 845 | .8 | (15.7 | ) | 3,062 | 3,216 | (4.8 | ) | ||||||||||||||||||||||
| Noninterest expense |
233 | 200 | 254 | 16.5 | (8.3 | ) | 915 | 693 | 32.0 | |||||||||||||||||||||||
| Other intangibles |
— | — | — | — | — | — | — | — | ||||||||||||||||||||||||
|
|
|
|
|
|
|
|
|
|
|
|||||||||||||||||||||||
| Total noninterest expense |
233 | 200 | 254 | 16.5 | (8.3 | ) | 915 | 693 | 32.0 | |||||||||||||||||||||||
|
|
|
|
|
|
|
|
|
|
|
|||||||||||||||||||||||
| Income before provision and taxes |
479 | 506 | 591 | (5.3 | ) | (19.0 | ) | 2,147 | 2,523 | (14.9 | ) | |||||||||||||||||||||
| Provision for credit losses |
(4 | ) | — | (11 | ) | nm | 63.6 | 1 | (17 | ) | nm | |||||||||||||||||||||
|
|
|
|
|
|
|
|
|
|
|
|||||||||||||||||||||||
| Income before income taxes |
483 | 506 | 602 | (4.5 | ) | (19.8 | ) | 2,146 | 2,540 | (15.5 | ) | |||||||||||||||||||||
| Income taxes and taxable-equivalent adjustment |
13 | 24 | 64 | (45.8 | ) | (79.7 | ) | 120 | 237 | (49.4 | ) | |||||||||||||||||||||
|
|
|
|
|
|
|
|
|
|
|
|||||||||||||||||||||||
| Net income |
470 | 482 | 538 | (2.5 | ) | (12.6 | ) | 2,026 | 2,303 | (12.0 | ) | |||||||||||||||||||||
| Net (income) loss attributable to noncontrolling interests |
(6 | ) | (6 | ) | (6 | ) | — | — | (24 | ) | (23 | ) | (4.3 | ) | ||||||||||||||||||
|
|
|
|
|
|
|
|
|
|
|
|||||||||||||||||||||||
| Net income attributable to U.S. Bancorp |
$ | 464 | $ | 476 | $ | 532 | (2.5 | ) | (12.8 | ) | $ | 2,002 | $ | 2,280 | (12.2 | ) | ||||||||||||||||
|
|
|
|
|
|
|
|
|
|
|
|||||||||||||||||||||||
| Average Balance Sheet Data |
||||||||||||||||||||||||||||||||
| Loans |
$ | 3,416 | $ | 3,461 | $ | 3,625 | (1.3 | ) | (5.8 | ) | $ | 3,519 | $ | 3,767 | (6.6 | ) | ||||||||||||||||
| Other earning assets |
120,588 | 115,980 | 108,530 | 4.0 | 11.1 | 114,419 | 107,505 | 6.4 | ||||||||||||||||||||||||
| Goodwill |
— | — | — | — | — | — | — | — | ||||||||||||||||||||||||
| Other intangible assets |
— | — | — | — | — | — | — | — | ||||||||||||||||||||||||
| Assets |
141,999 | 138,381 | 129,668 | 2.6 | 9.5 | 136,223 | 127,856 | 6.5 | ||||||||||||||||||||||||
| Noninterest-bearing deposits |
2,079 | 2,238 | 1,951 | (7.1 | ) | 6.6 | 2,097 | 1,757 | 19.4 | |||||||||||||||||||||||
| Interest-bearing deposits |
715 | 1,434 | 1,462 | (50.1 | ) | (51.1 | ) | 2,311 | 1,878 | 23.1 | ||||||||||||||||||||||
|
|
|
|
|
|
|
|
|
|
|
|||||||||||||||||||||||
| Total deposits |
2,794 | 3,672 | 3,413 | (23.9 | ) | (18.1 | ) | 4,408 | 3,635 | 21.3 | ||||||||||||||||||||||
| Total U.S. Bancorp shareholders’ equity |
18,219 | 18,718 | 18,215 | (2.7 | ) | — | 18,379 | 17,432 | 5.4 | |||||||||||||||||||||||
| (a) preliminary data |
||||||||||||||||||||||||||||||||
Treasury and Corporate Support includes the Company’s investment portfolios, funding, capital management, interest rate risk management, income taxes not allocated to the business lines, including most investments in tax-advantaged projects, and the residual aggregate of those expenses associated with corporate activities that are managed on a consolidated basis. Treasury and Corporate Support recorded net income of $464 million in the fourth quarter of 2016, compared with $532 million in the fourth quarter of 2015. The decrease in net income of $68 million (12.8 percent) from the prior year quarter was primarily due to a decrease in total net revenue, partially offset by a decrease in total noninterest expense. Net interest income decreased $132 million (22.8 percent) from the fourth quarter of 2015 principally due to the impact of higher rates credited to the business lines on deposits and the issuance of long-term debt, partially offset by growth in the investment portfolio. Total noninterest income was relatively flat compared with the fourth
U.S. Bancorp Fourth Quarter 2016 Business Line Results
January 18, 2017
Page 12
quarter of last year reflecting the impact of a gain on the sale of a deposit portfolio in the fourth quarter of 2015 and an increase in equity investment income in the current year quarter. Total noninterest expense decreased $21 million (8.3 percent) principally due to lower costs related to investments in tax-advantaged projects, lower net shared services expense and lower employee benefits expense, reflecting lower pension and healthcare costs. These decreases were partially offset by higher compensation expense, reflecting the impact of merit increases and higher variable compensation along with increased staffing, and higher professional services expense primarily due to compliance programs and implementation costs of capital investments to support business growth. The provision for credit losses was $7 million (63.6 percent) higher year-over-year primarily due to an unfavorable change in the reserve allocation.

U.S. Bancorp 4Q16 Earnings Conference Call Richard K. Davis Chairman and CEO January 18, 2017 Terry Dolan Vice Chairman and CFO Exhibit 99.2
Forward-looking Statements and Additional Information The following information appears in accordance with the Private Securities Litigation Reform Act of 1995: Today’s presentation contains forward-looking statements about U.S. Bancorp. Statements that are not historical or current facts, including statements about beliefs and expectations, are forward-looking statements and are based on the information available to, and assumptions and estimates made by, management as of the date hereof. These forward-looking statements cover, among other things, anticipated future revenue and expenses and the future plans and prospects of U.S. Bancorp. Forward-looking statements involve inherent risks and uncertainties, and important factors could cause actual results to differ materially from those anticipated. A reversal or slowing of the current economic recovery or another severe contraction could adversely affect U.S. Bancorp’s revenues and the values of its assets and liabilities. Global financial markets could experience a recurrence of significant turbulence, which could reduce the availability of funding to certain financial institutions and lead to a tightening of credit, a reduction of business activity, and increased market volatility. Stress in the commercial real estate markets, as well as a downturn in the residential real estate markets could cause credit losses and deterioration in asset values. In addition, U.S. Bancorp’s business and financial performance is likely to be negatively impacted by recently enacted and future legislation and regulation. U.S. Bancorp’s results could also be adversely affected by deterioration in general business and economic conditions (which could result, in part, from the United Kingdom’s withdrawal from the European Union); changes in interest rates; deterioration in the credit quality of its loan portfolios or in the value of the collateral securing those loans; deterioration in the value of securities held in its investment securities portfolio; legal and regulatory developments; litigation; increased competition from both banks and non-banks; changes in customer behavior and preferences; breaches in data security; effects of mergers and acquisitions and related integration; effects of critical accounting policies and judgments; and management’s ability to effectively manage credit risk, market risk, operational risk, compliance risk, strategic risk, interest rate risk, liquidity risk and reputational risk. For discussion of these and other risks that may cause actual results to differ from expectations, refer to U.S. Bancorp’s Annual Report on Form 10-K for the year ended December 31, 2015, on file with the Securities and Exchange Commission, including the sections entitled “Risk Factors” and “Corporate Risk Profile” contained in Exhibit 13, and all subsequent filings with the Securities and Exchange Commission under Sections 13(a), 13(c), 14 or 15(d) of the Securities Exchange Act of 1934. However, factors other than these also could adversely affect U.S. Bancorp’s results, and the reader should not consider these factors to be a complete set of all potential risks or uncertainties. Forward-looking statements speak only as of the date hereof, and U.S. Bancorp undertakes no obligation to update them in light of new information or future events. This presentation includes non-GAAP financial measures to describe U.S. Bancorp’s performance. The calculations of these measures are provided in the Appendix. These disclosures should not be viewed as a substitute for operating results determined in accordance with GAAP, nor are they necessarily comparable to non-GAAP performance measures that may be presented by other companies.
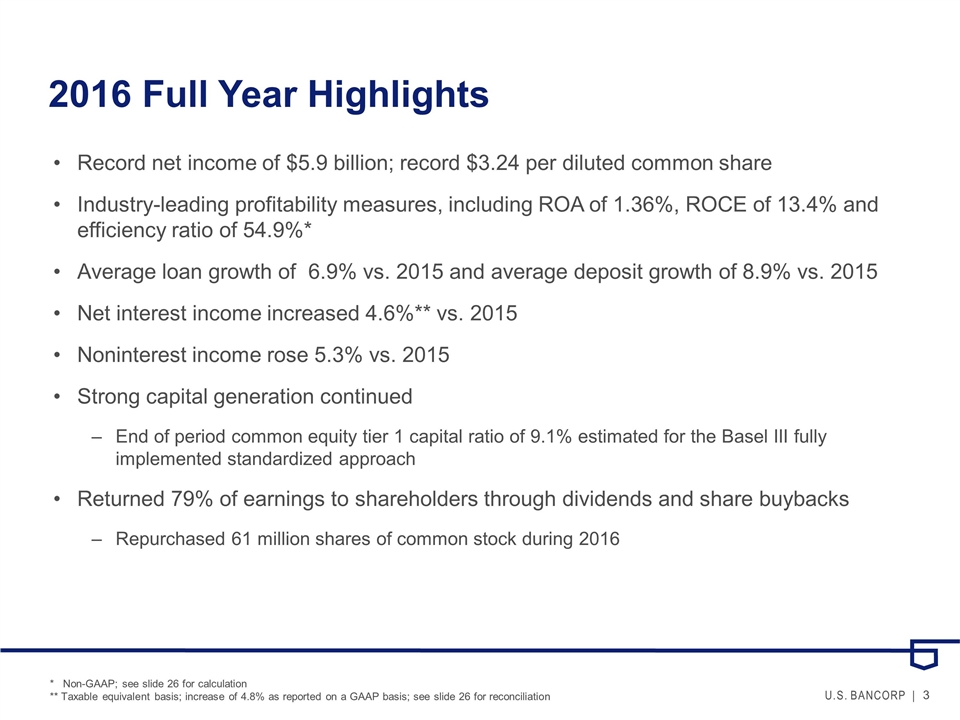
2016 Full Year Highlights Record net income of $5.9 billion; record $3.24 per diluted common share Industry-leading profitability measures, including ROA of 1.36%, ROCE of 13.4% and efficiency ratio of 54.9%* Average loan growth of 6.9% vs. 2015 and average deposit growth of 8.9% vs. 2015 Net interest income increased 4.6%** vs. 2015 Noninterest income rose 5.3% vs. 2015 Strong capital generation continued End of period common equity tier 1 capital ratio of 9.1% estimated for the Basel III fully implemented standardized approach Returned 79% of earnings to shareholders through dividends and share buybacks Repurchased 61 million shares of common stock during 2016 * Non-GAAP; see slide 26 for calculation ** Taxable equivalent basis; increase of 4.8% as reported on a GAAP basis; see slide 26 for reconciliation
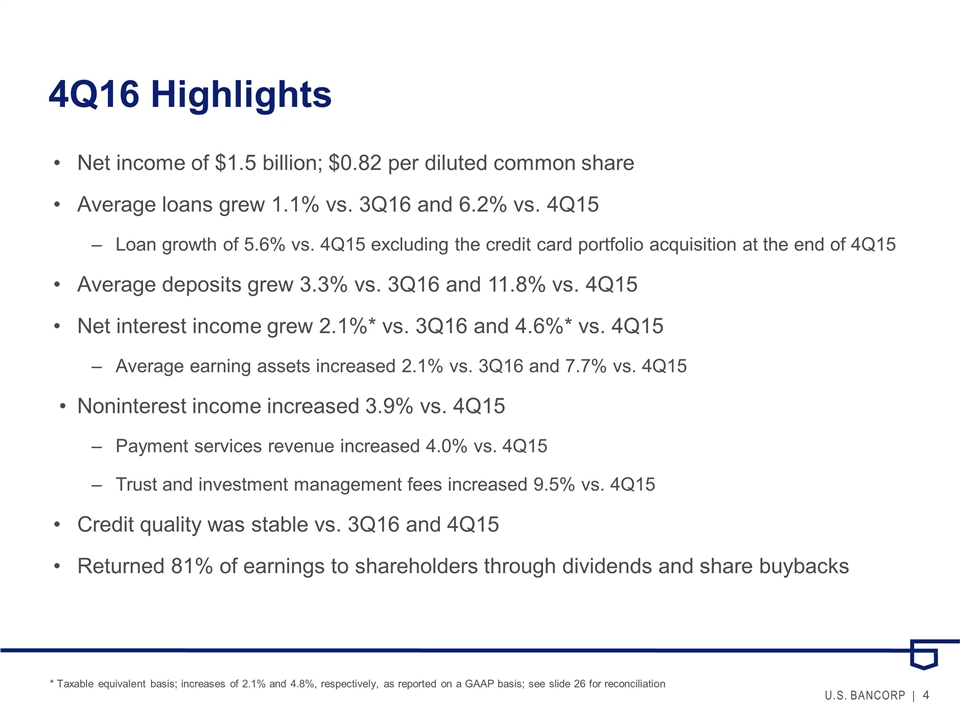
4Q16 Highlights Net income of $1.5 billion; $0.82 per diluted common share Average loans grew 1.1% vs. 3Q16 and 6.2% vs. 4Q15 Loan growth of 5.6% vs. 4Q15 excluding the credit card portfolio acquisition at the end of 4Q15 Average deposits grew 3.3% vs. 3Q16 and 11.8% vs. 4Q15 Net interest income grew 2.1%* vs. 3Q16 and 4.6%* vs. 4Q15 Average earning assets increased 2.1% vs. 3Q16 and 7.7% vs. 4Q15 Noninterest income increased 3.9% vs. 4Q15 Payment services revenue increased 4.0% vs. 4Q15 Trust and investment management fees increased 9.5% vs. 4Q15 Credit quality was stable vs. 3Q16 and 4Q15 Returned 81% of earnings to shareholders through dividends and share buybacks * Taxable equivalent basis; increases of 2.1% and 4.8%, respectively, as reported on a GAAP basis; see slide 26 for reconciliation
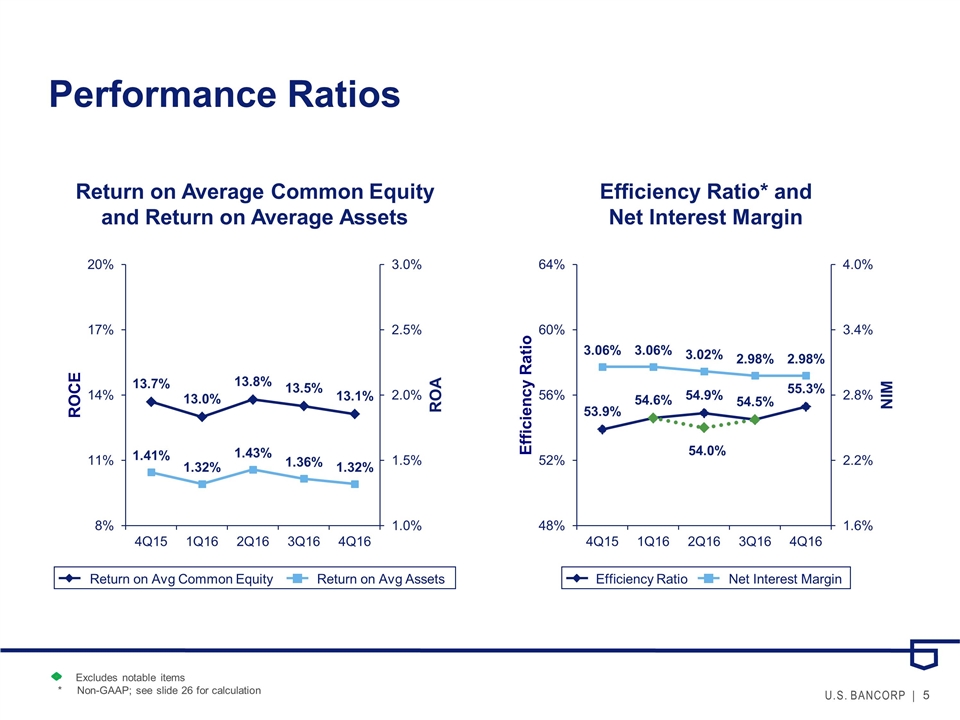
Performance Ratios Return on Average Common Equity and Return on Average Assets Efficiency Ratio* and Net Interest Margin Return on Avg Common Equity Return on Avg Assets Efficiency Ratio Net Interest Margin Excludes notable items * Non-GAAP; see slide 26 for calculation 54.0%
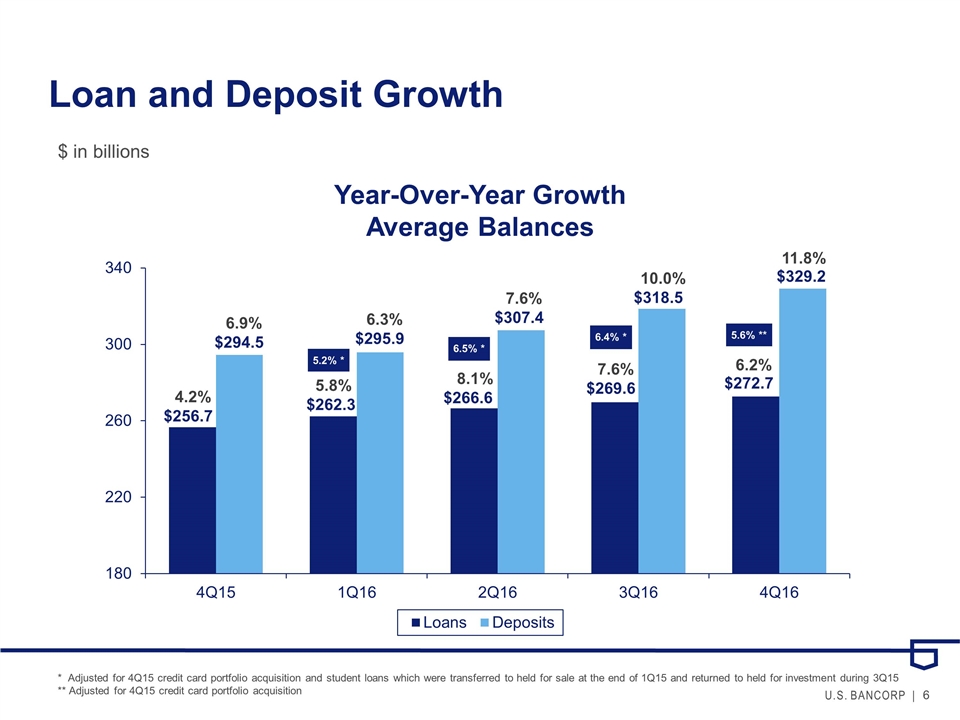
Loan and Deposit Growth Year-Over-Year Growth Average Balances 5.8% $262.3 8.1% $266.6 4.2% $256.7 6.9% $294.5 6.3% $295.9 7.6% $307.4 $ in billions * Adjusted for 4Q15 credit card portfolio acquisition and student loans which were transferred to held for sale at the end of 1Q15 and returned to held for investment during 3Q15 ** Adjusted for 4Q15 credit card portfolio acquisition 5.2% * 10.0% $318.5 7.6% $269.6 5.6% **
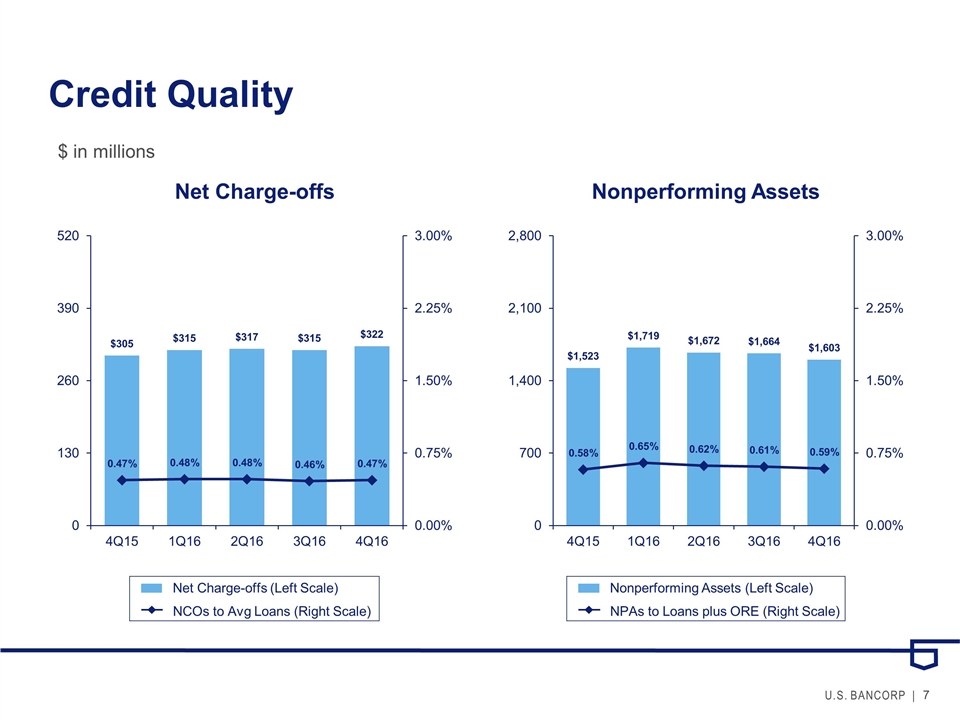
Credit Quality Net Charge-offs Nonperforming Assets Net Charge-offs (Left Scale) NCOs to Avg Loans (Right Scale) Nonperforming Assets (Left Scale) NPAs to Loans plus ORE (Right Scale) $ in millions
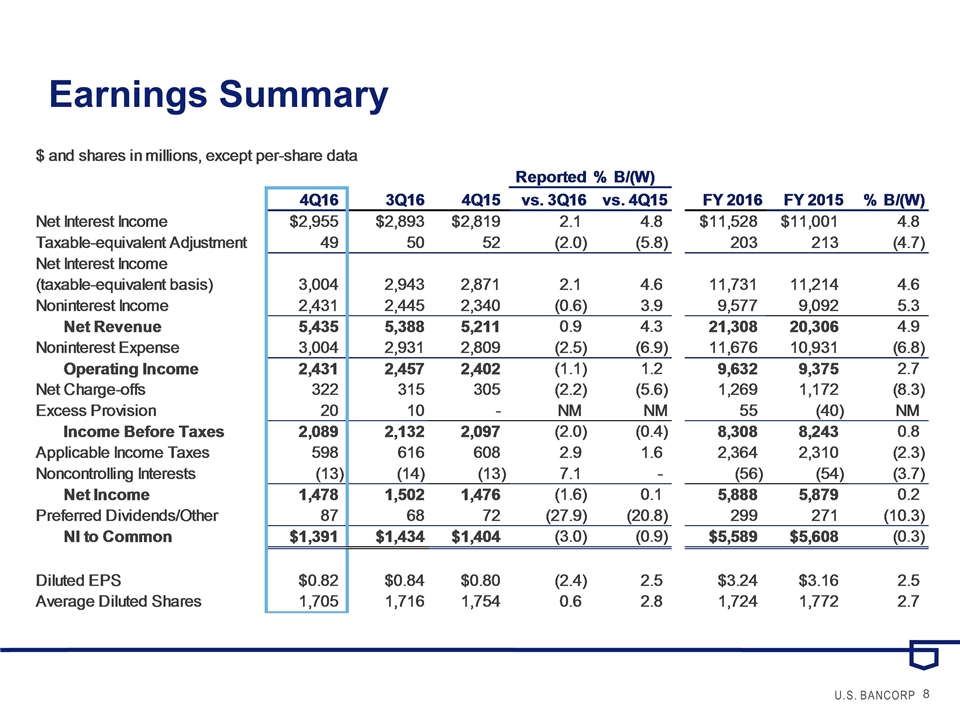
Earnings Summary
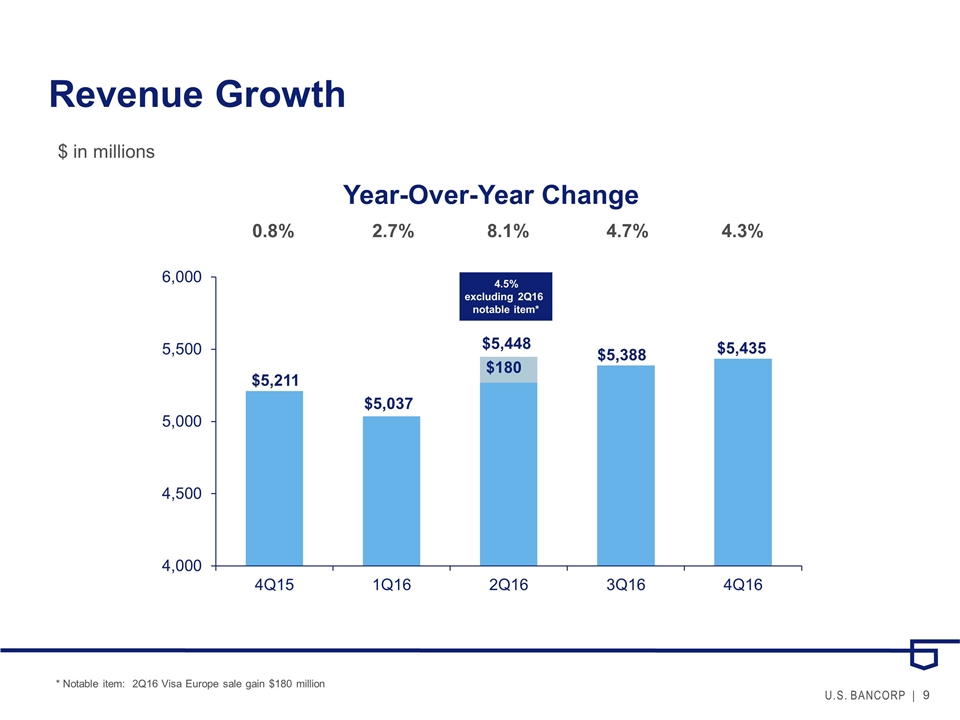
Revenue Growth * Notable item: 2Q16 Visa Europe sale gain $180 million Year-Over-Year Change 0.8% 2.7%8.1% 4.7%4.3% $ in millions 4.5% excluding 2Q16 notable item*
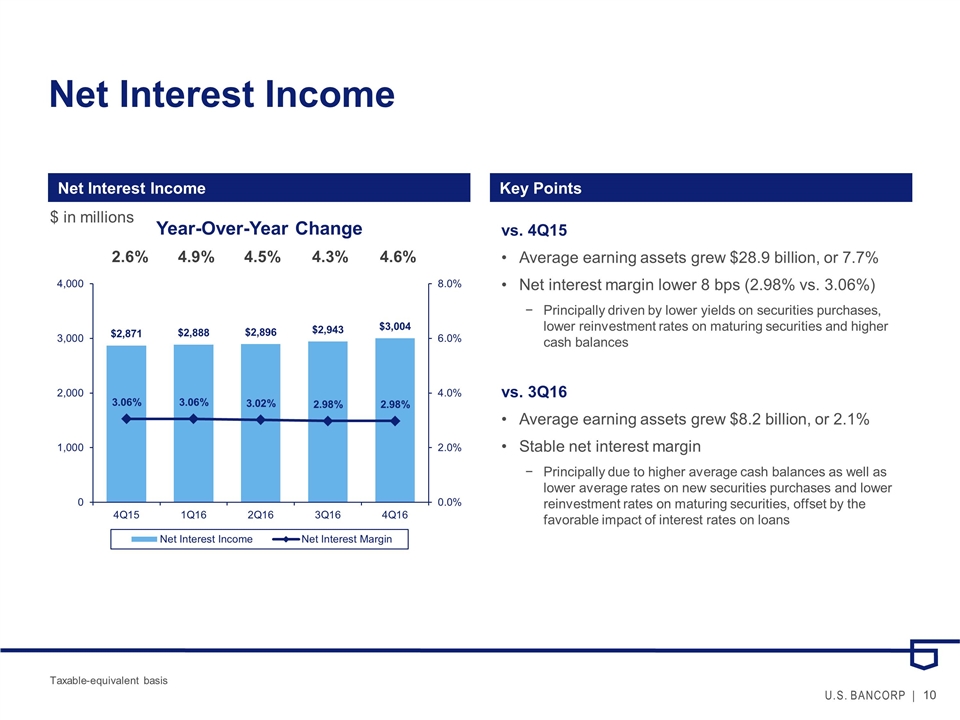
Net Interest Income Net Interest Income Key Points vs. 4Q15 Average earning assets grew $28.9 billion, or 7.7% Net interest margin lower 8 bps (2.98% vs. 3.06%) Principally driven by lower yields on securities purchases, lower reinvestment rates on maturing securities and higher cash balances vs. 3Q16 Average earning assets grew $8.2 billion, or 2.1% Stable net interest margin Principally due to higher average cash balances as well as lower average rates on new securities purchases and lower reinvestment rates on maturing securities, offset by the favorable impact of interest rates on loans Year-Over-Year Change 2.6%4.9%4.5% 4.3% 4.6% $ in millions Taxable-equivalent basis
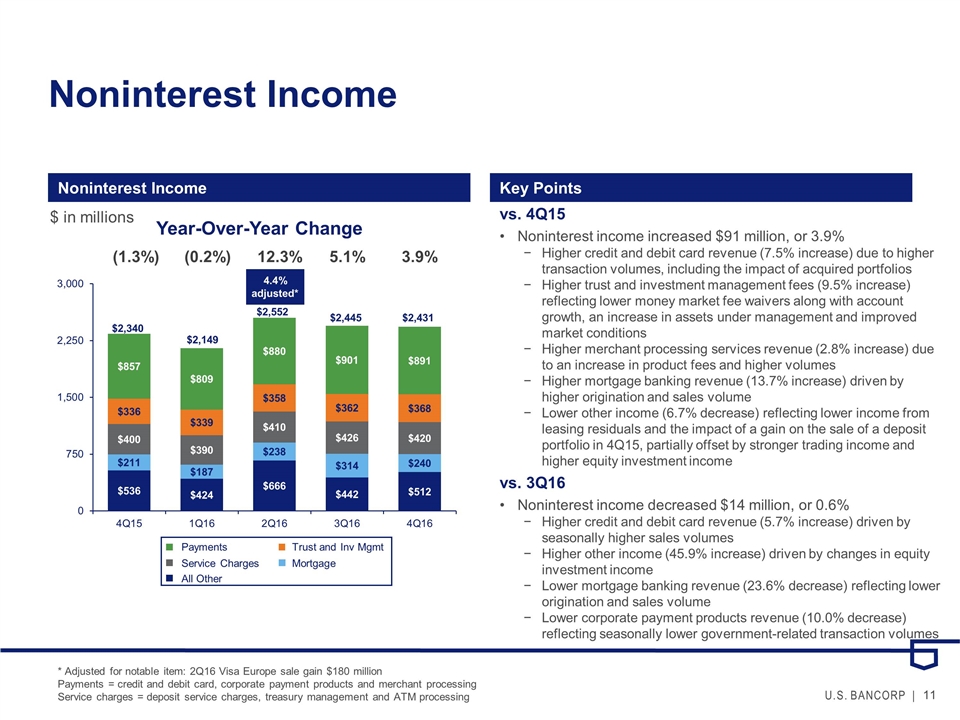
Noninterest Income Noninterest Income Key Points vs. 4Q15 Noninterest income increased $91 million, or 3.9% Higher credit and debit card revenue (7.5% increase) due to higher transaction volumes, including the impact of acquired portfolios Higher trust and investment management fees (9.5% increase) reflecting lower money market fee waivers along with account growth, an increase in assets under management and improved market conditions Higher merchant processing services revenue (2.8% increase) due to an increase in product fees and higher volumes Higher mortgage banking revenue (13.7% increase) driven by higher origination and sales volume Lower other income (6.7% decrease) reflecting lower income from leasing residuals and the impact of a gain on the sale of a deposit portfolio in 4Q15, partially offset by stronger trading income and higher equity investment income vs. 3Q16 Noninterest income decreased $14 million, or 0.6% Higher credit and debit card revenue (5.7% increase) driven by seasonally higher sales volumes Higher other income (45.9% increase) driven by changes in equity investment income Lower mortgage banking revenue (23.6% decrease) reflecting lower origination and sales volume Lower corporate payment products revenue (10.0% decrease) reflecting seasonally lower government-related transaction volumes Year-Over-Year Change (1.3%)(0.2%)12.3% 5.1% 3.9% $2,445 $2,340 $2,149 $2,552 All Other Mortgage Service Charges Trust and Inv Mgmt Payments * Adjusted for notable item: 2Q16 Visa Europe sale gain $180 million Payments = credit and debit card, corporate payment products and merchant processing Service charges = deposit service charges, treasury management and ATM processing $ in millions 4.4% adjusted*
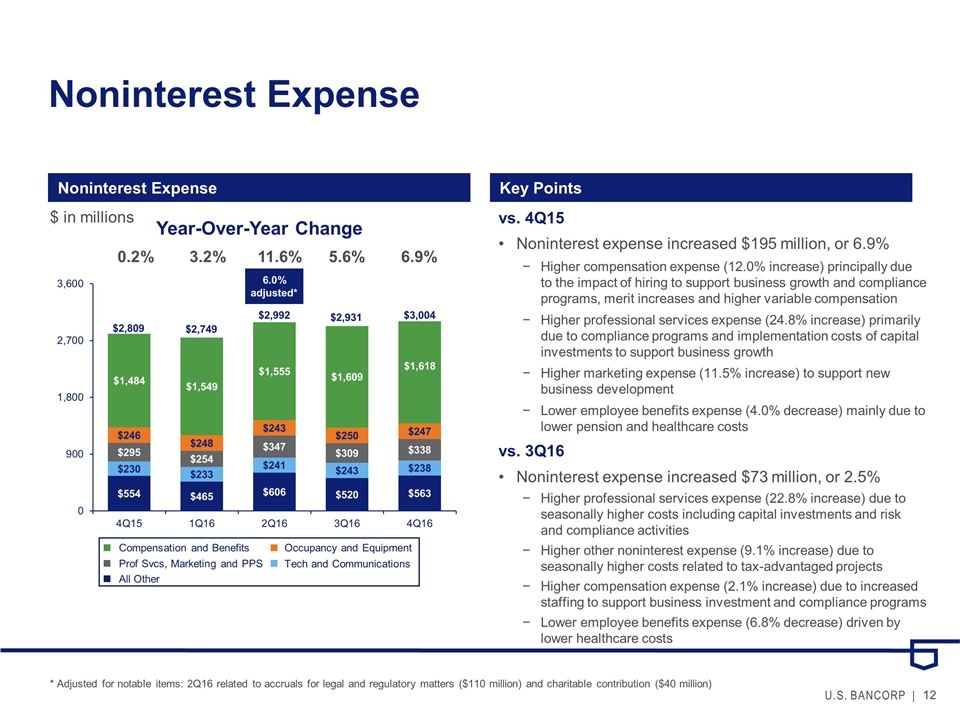
Noninterest Expense Noninterest Expense Key Points vs. 4Q15 Noninterest expense increased $195 million, or 6.9% Higher compensation expense (12.0% increase) principally due to the impact of hiring to support business growth and compliance programs, merit increases and higher variable compensation Higher professional services expense (24.8% increase) primarily due to compliance programs and implementation costs of capital investments to support business growth Higher marketing expense (11.5% increase) to support new business development Lower employee benefits expense (4.0% decrease) mainly due to lower pension and healthcare costs vs. 3Q16 Noninterest expense increased $73 million, or 2.5% Higher professional services expense (22.8% increase) due to seasonally higher costs including capital investments and risk and compliance activities Higher other noninterest expense (9.1% increase) due to seasonally higher costs related to tax-advantaged projects Higher compensation expense (2.1% increase) due to increased staffing to support business investment and compliance programs Lower employee benefits expense (6.8% decrease) driven by lower healthcare costs Year-Over-Year Change 0.2%3.2%11.6% 5.6% 6.9% $2,931 $2,809 $2,749 $2,992 All Other Tech and Communications Prof Svcs, Marketing and PPS Occupancy and Equipment Compensation and Benefits * Adjusted for notable items: 2Q16 related to accruals for legal and regulatory matters ($110 million) and charitable contribution ($40 million) $ in millions 6.0% adjusted*
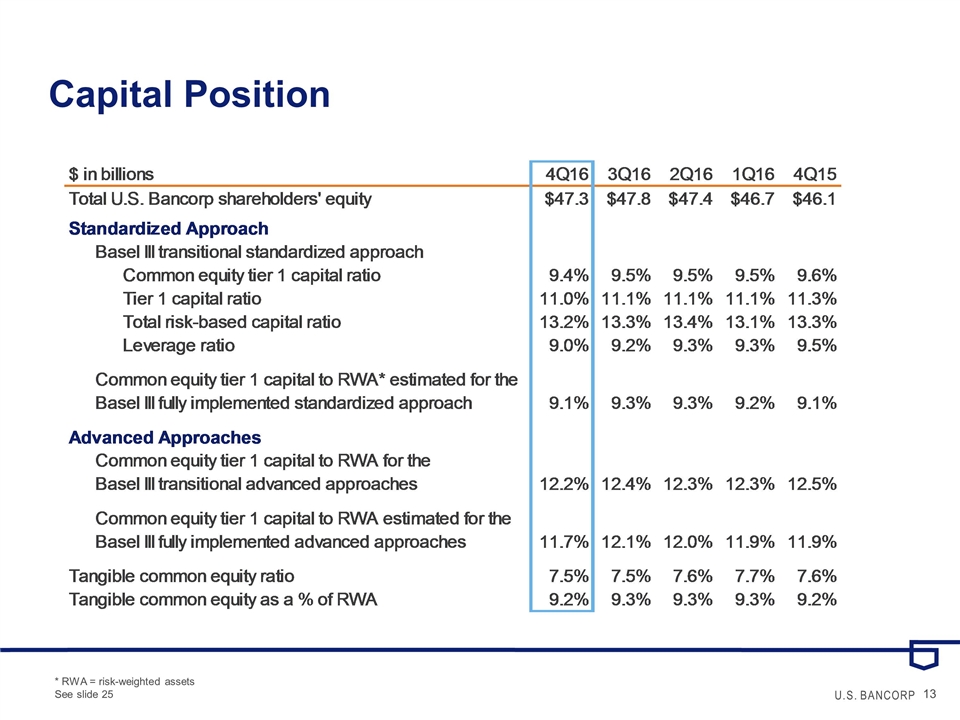
Capital Position * RWA = risk-weighted assets See slide 25
Appendix
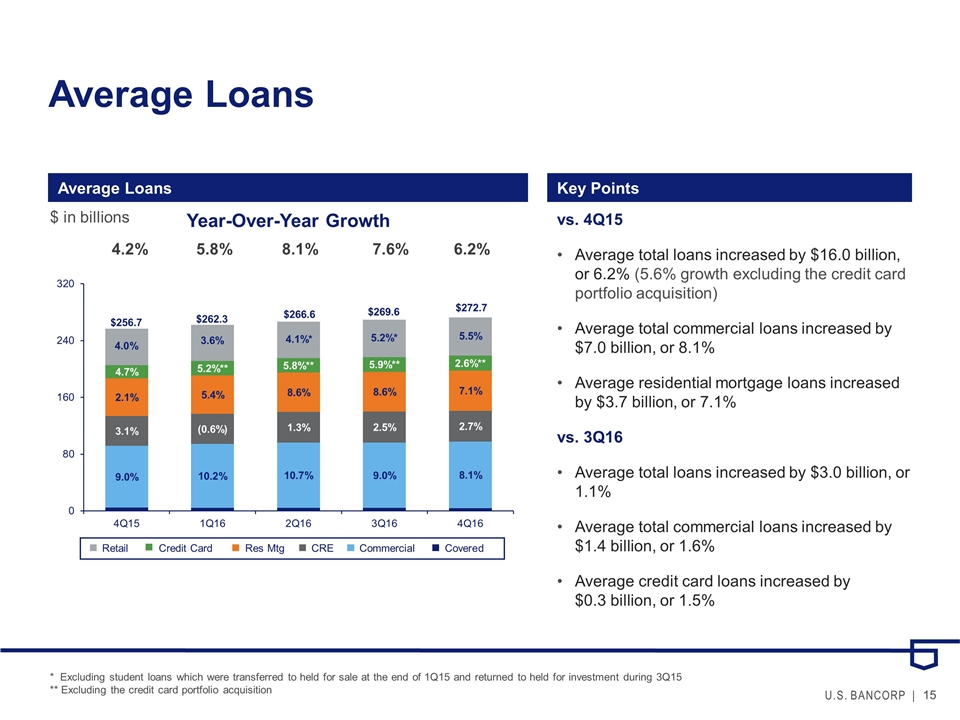
Average Loans Average Loans Key Points vs. 4Q15 Average total loans increased by $16.0 billion, or 6.2% (5.6% growth excluding the credit card portfolio acquisition) Average total commercial loans increased by $7.0 billion, or 8.1% Average residential mortgage loans increased by $3.7 billion, or 7.1% vs. 3Q16 Average total loans increased by $3.0 billion, or 1.1% Average total commercial loans increased by $1.4 billion, or 1.6% Average credit card loans increased by $0.3 billion, or 1.5% Year-Over-Year Growth 4.2%5.8% 8.1% 7.6% 6.2% Covered Commercial CRE Res Mtg Retail Credit Card $269.6 $256.7 $262.3 $266.6 $ in billions * Excluding student loans which were transferred to held for sale at the end of 1Q15 and returned to held for investment during 3Q15 ** Excluding the credit card portfolio acquisition 4.0%
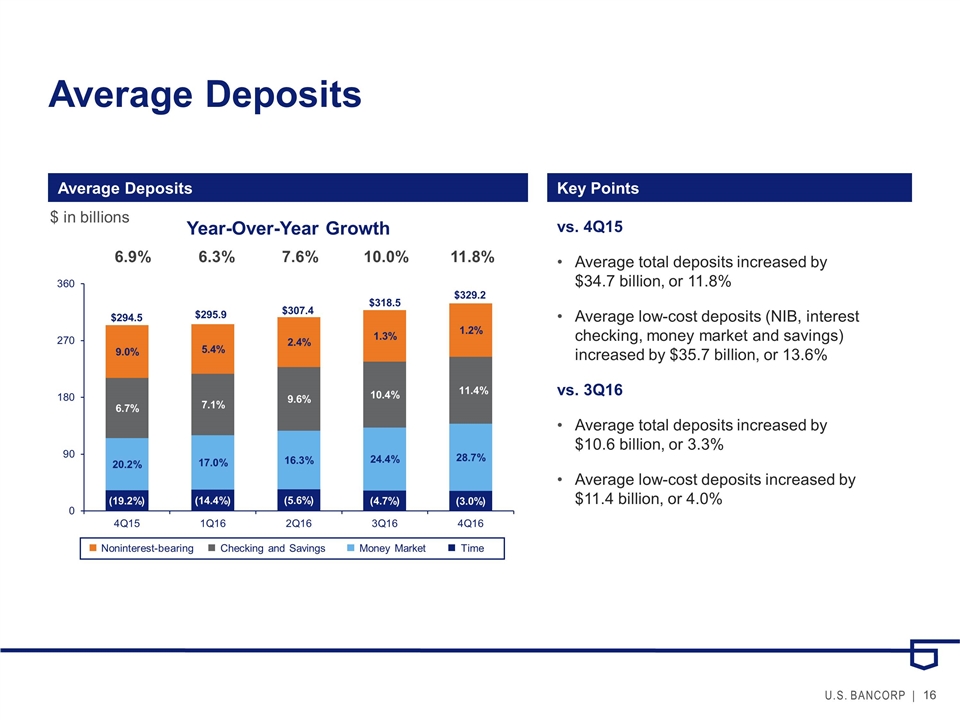
Average Deposits Average Deposits Key Points vs. 4Q15 Average total deposits increased by $34.7 billion, or 11.8% Average low-cost deposits (NIB, interest checking, money market and savings) increased by $35.7 billion, or 13.6% vs. 3Q16 Average total deposits increased by $10.6 billion, or 3.3% Average low-cost deposits increased by $11.4 billion, or 4.0% Year-Over-Year Growth 6.9% 6.3% 7.6% 10.0%11.8% Time Money Market Checking and Savings Noninterest-bearing $294.5 $295.9 $307.4 $318.5 $ in billions $329.2
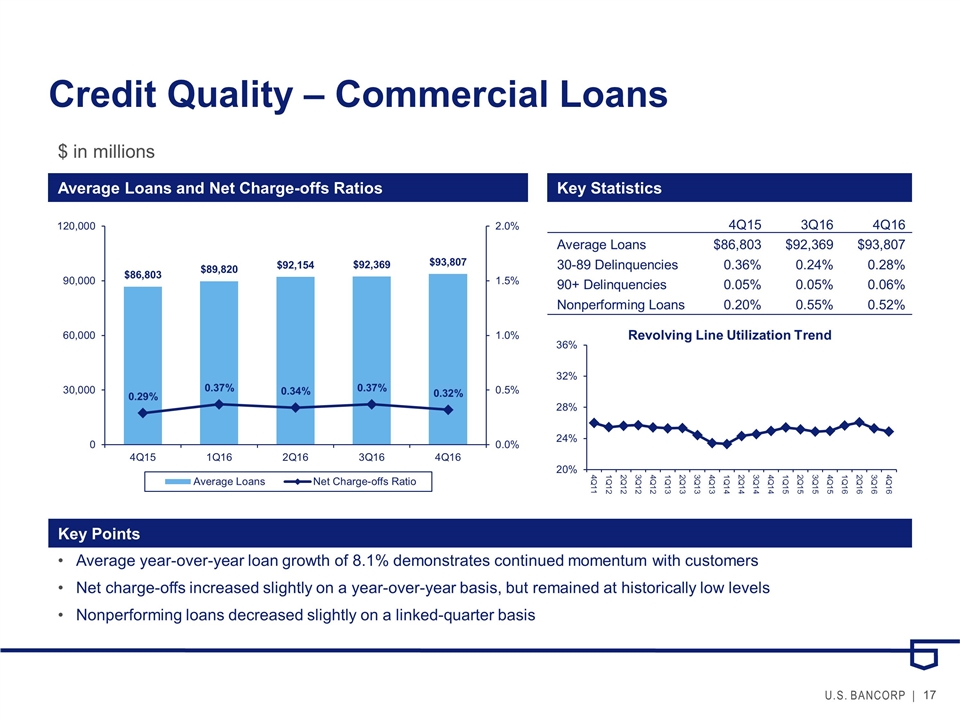
Credit Quality – Commercial Loans Average Loans and Net Charge-offs Ratios Key Statistics Key Points Average year-over-year loan growth of 8.1% demonstrates continued momentum with customers Net charge-offs increased slightly on a year-over-year basis, but remained at historically low levels Nonperforming loans decreased slightly on a linked-quarter basis 4Q153Q164Q16 Average Loans$86,803$92,369$93,807 30-89 Delinquencies0.36%0.24%0.28% 90+ Delinquencies0.05%0.05%0.06% Nonperforming Loans0.20%0.55%0.52% $ in millions
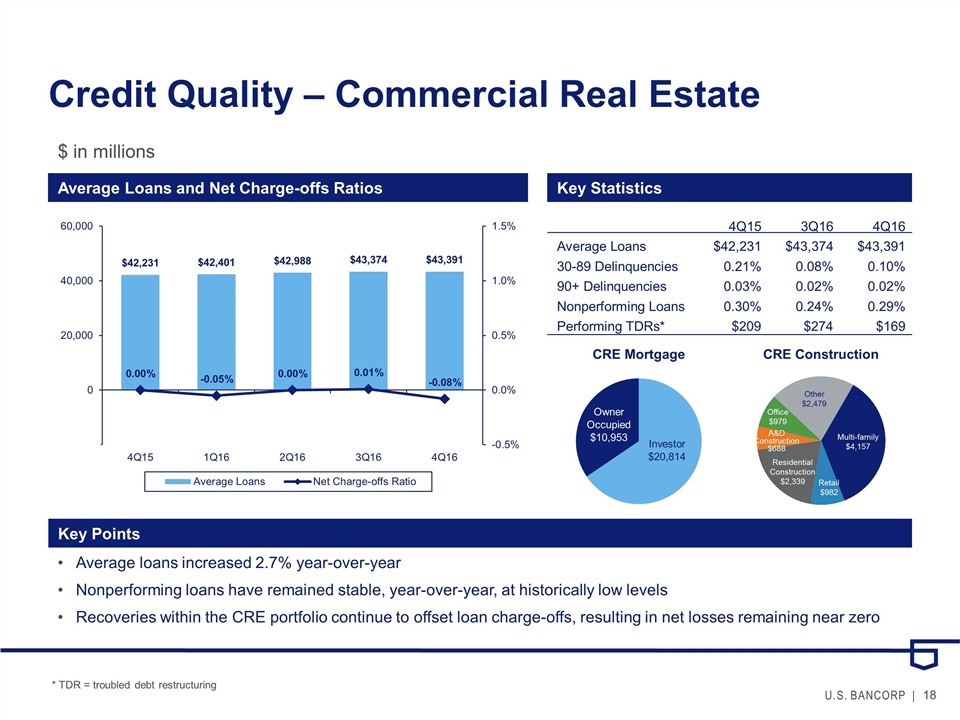
A&D Construction $688 Credit Quality – Commercial Real Estate Average Loans and Net Charge-offs Ratios Key Statistics Key Points Average loans increased 2.7% year-over-year Nonperforming loans have remained stable, year-over-year, at historically low levels Recoveries within the CRE portfolio continue to offset loan charge-offs, resulting in net losses remaining near zero 4Q153Q164Q16 Average Loans$42,231$43,374$43,391 30-89 Delinquencies0.21%0.08%0.10% 90+ Delinquencies0.03%0.02%0.02% Nonperforming Loans0.30%0.24%0.29% Performing TDRs*$209$274$169 $ in millions Investor $20,814 Owner Occupied $10,953 Multi-family $4,157 Retail $982 Residential Construction $2,339 Office $979 Other $2,479 * TDR = troubled debt restructuring
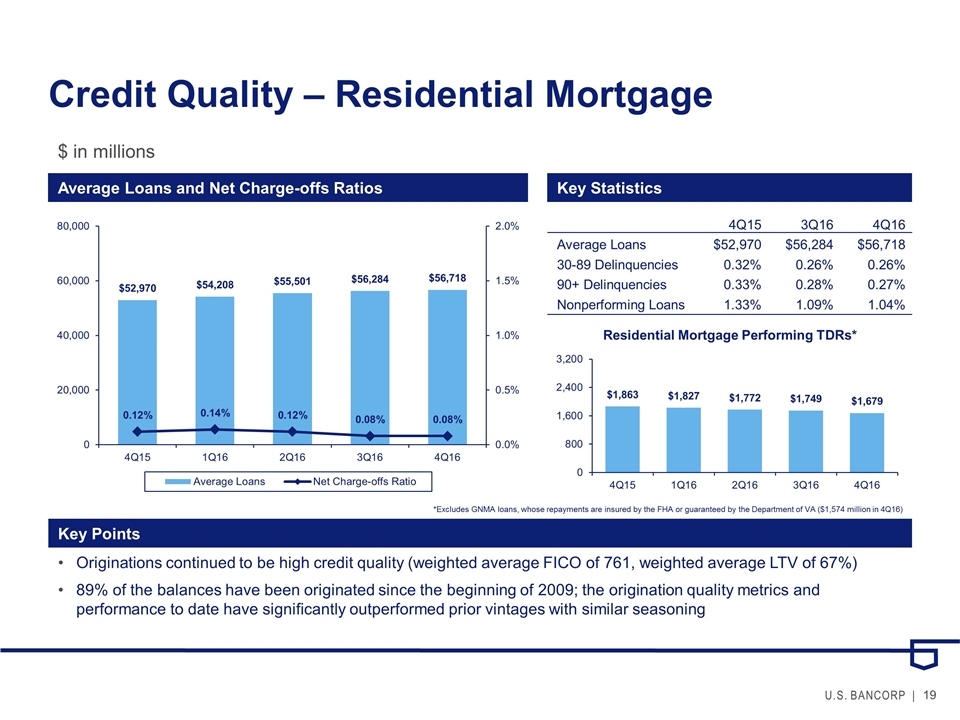
Credit Quality – Residential Mortgage Average Loans and Net Charge-offs Ratios Key Statistics Key Points Originations continued to be high credit quality (weighted average FICO of 761, weighted average LTV of 67%) 89% of the balances have been originated since the beginning of 2009; the origination quality metrics and performance to date have significantly outperformed prior vintages with similar seasoning $ in millions 4Q153Q164Q16 Average Loans$52,970$56,284$56,718 30-89 Delinquencies0.32%0.26%0.26% 90+ Delinquencies0.33%0.28%0.27% Nonperforming Loans1.33%1.09%1.04% *Excludes GNMA loans, whose repayments are insured by the FHA or guaranteed by the Department of VA ($1,574 million in 4Q16)
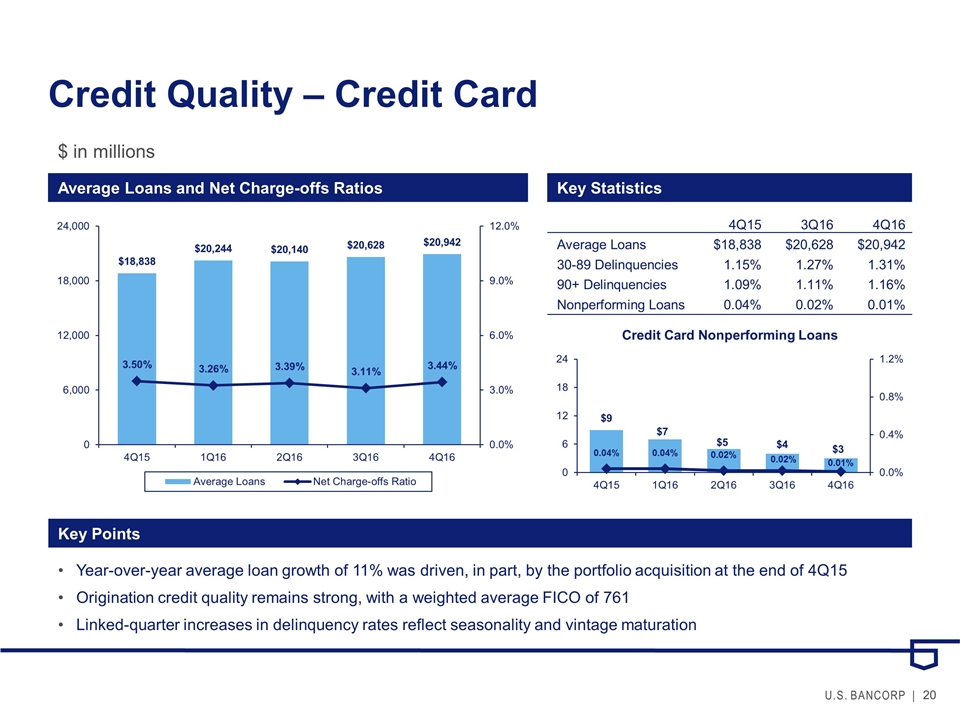
Credit Quality – Credit Card Average Loans and Net Charge-offs Ratios Key Statistics Key Points Year-over-year average loan growth of 11% was driven, in part, by the portfolio acquisition at the end of 4Q15 Origination credit quality remains strong, with a weighted average FICO of 761 Linked-quarter increases in delinquency rates reflect seasonality and vintage maturation $ in millions 4Q153Q164Q16 Average Loans$18,838$20,628$20,942 30-89 Delinquencies1.15%1.27%1.31% 90+ Delinquencies1.09%1.11%1.16% Nonperforming Loans0.04%0.02%0.01%
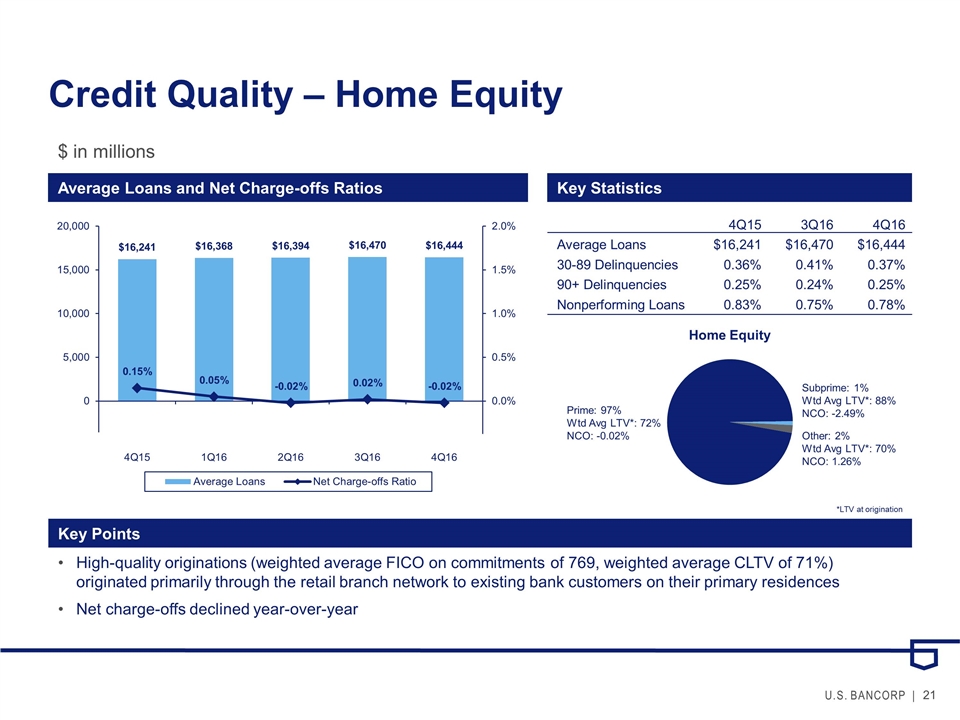
Credit Quality – Home Equity Average Loans and Net Charge-offs Ratios Key Statistics Key Points High-quality originations (weighted average FICO on commitments of 769, weighted average CLTV of 71%) originated primarily through the retail branch network to existing bank customers on their primary residences Net charge-offs declined year-over-year $ in millions 4Q153Q164Q16 Average Loans$16,241$16,470$16,444 30-89 Delinquencies0.36%0.41%0.37% 90+ Delinquencies0.25%0.24%0.25% Nonperforming Loans0.83%0.75%0.78% Subprime: 1% Wtd Avg LTV*: 88% NCO: -2.49% Prime: 97% Wtd Avg LTV*: 72% NCO: -0.02% Other: 2% Wtd Avg LTV*: 70% NCO: 1.26% *LTV at origination
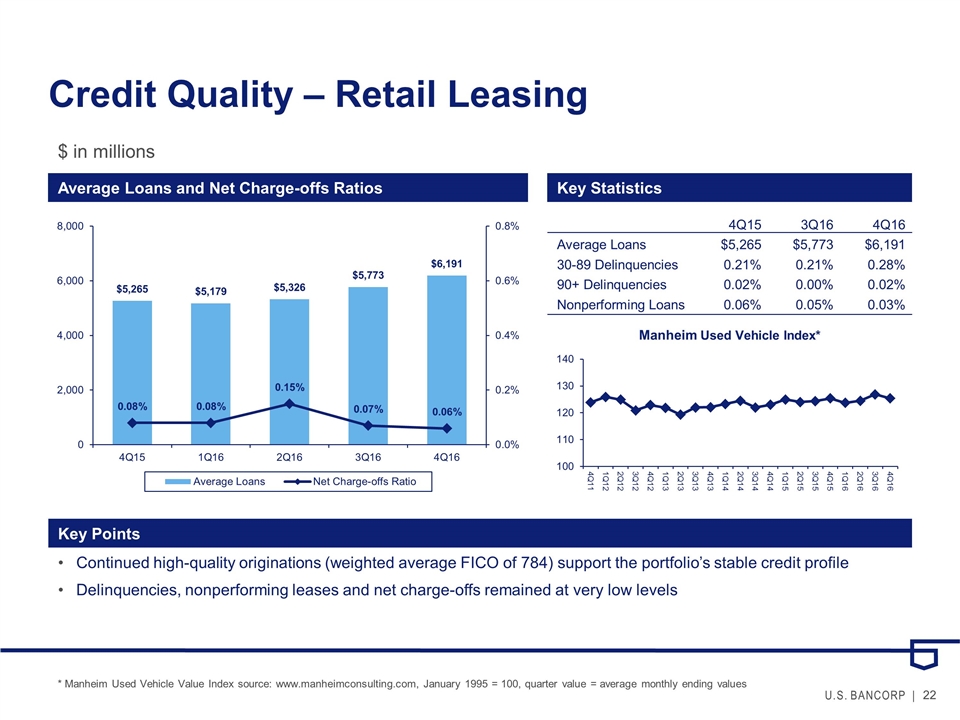
Credit Quality – Retail Leasing Average Loans and Net Charge-offs Ratios Key Statistics Key Points Continued high-quality originations (weighted average FICO of 784) support the portfolio’s stable credit profile Delinquencies, nonperforming leases and net charge-offs remained at very low levels $ in millions 4Q153Q164Q16 Average Loans$5,265$5,773$6,191 30-89 Delinquencies0.21%0.21%0.28% 90+ Delinquencies0.02%0.00%0.02% Nonperforming Loans0.06%0.05%0.03% * Manheim Used Vehicle Value Index source: www.manheimconsulting.com, January 1995 = 100, quarter value = average monthly ending values
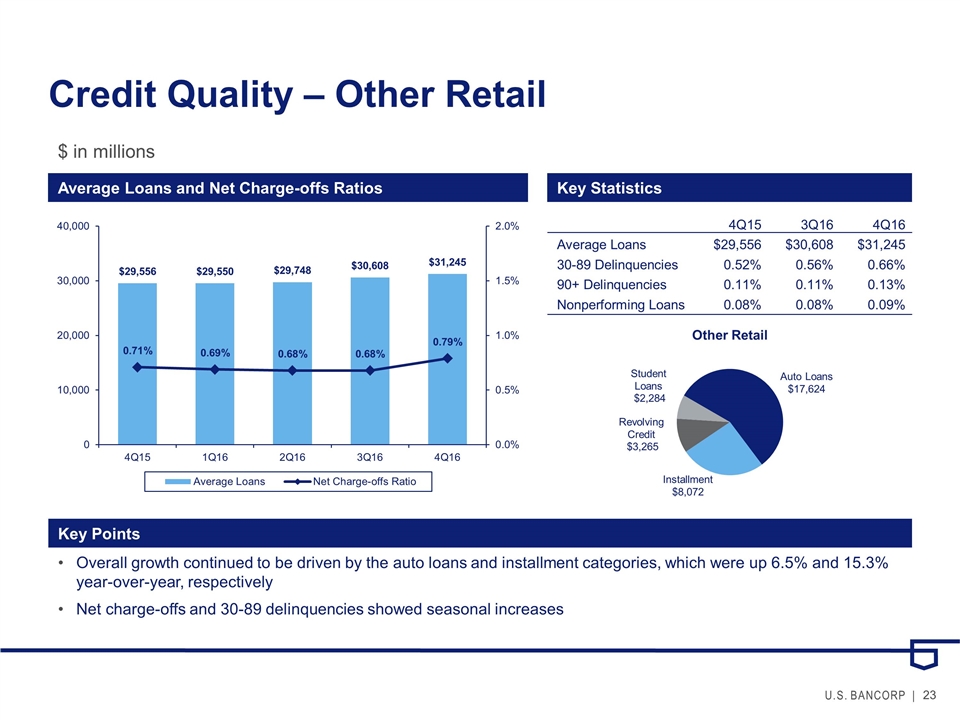
Credit Quality – Other Retail Average Loans and Net Charge-offs Ratios Key Statistics Key Points Overall growth continued to be driven by the auto loans and installment categories, which were up 6.5% and 15.3% year-over-year, respectively Net charge-offs and 30-89 delinquencies showed seasonal increases $ in millions 4Q153Q164Q16 Average Loans$29,556$30,608$31,245 30-89 Delinquencies0.52%0.56%0.66% 90+ Delinquencies0.11%0.11%0.13% Nonperforming Loans0.08%0.08%0.09%
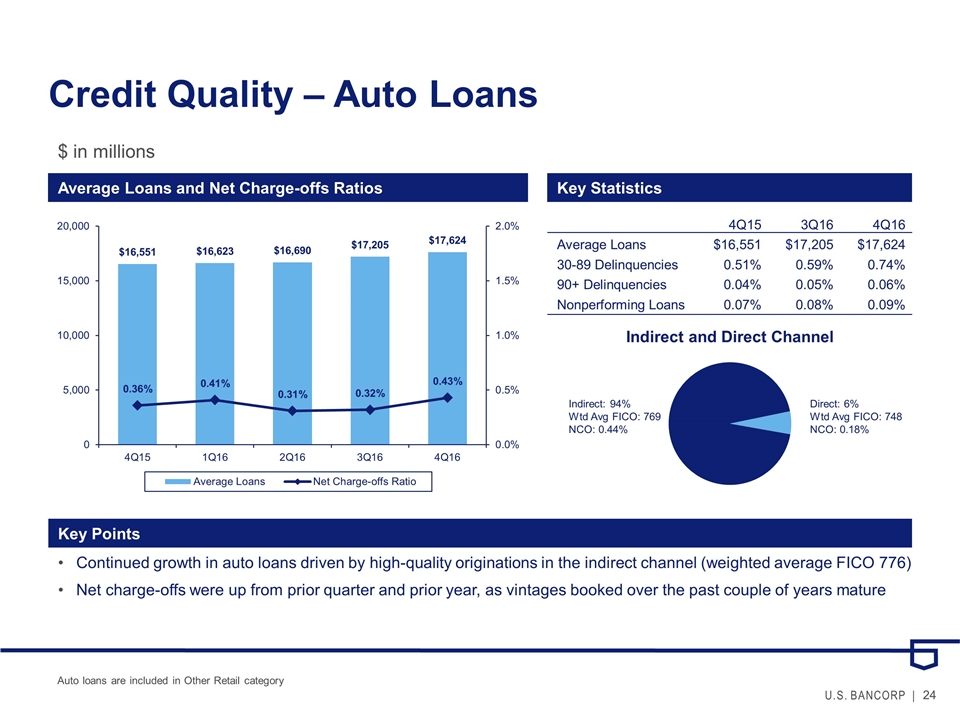
Credit Quality – Auto Loans Average Loans and Net Charge-offs Ratios Key Statistics Key Points Continued growth in auto loans driven by high-quality originations in the indirect channel (weighted average FICO 776) Net charge-offs were up from prior quarter and prior year, as vintages booked over the past couple of years mature $ in millions 4Q153Q164Q16 Average Loans$16,551$17,205$17,624 30-89 Delinquencies0.51%0.59%0.74% 90+ Delinquencies0.04%0.05%0.06% Nonperforming Loans0.07%0.08%0.09% Direct: 6% Wtd Avg FICO: 748 NCO: 0.18% Indirect: 94% Wtd Avg FICO: 769 NCO: 0.44% Auto loans are included in Other Retail category
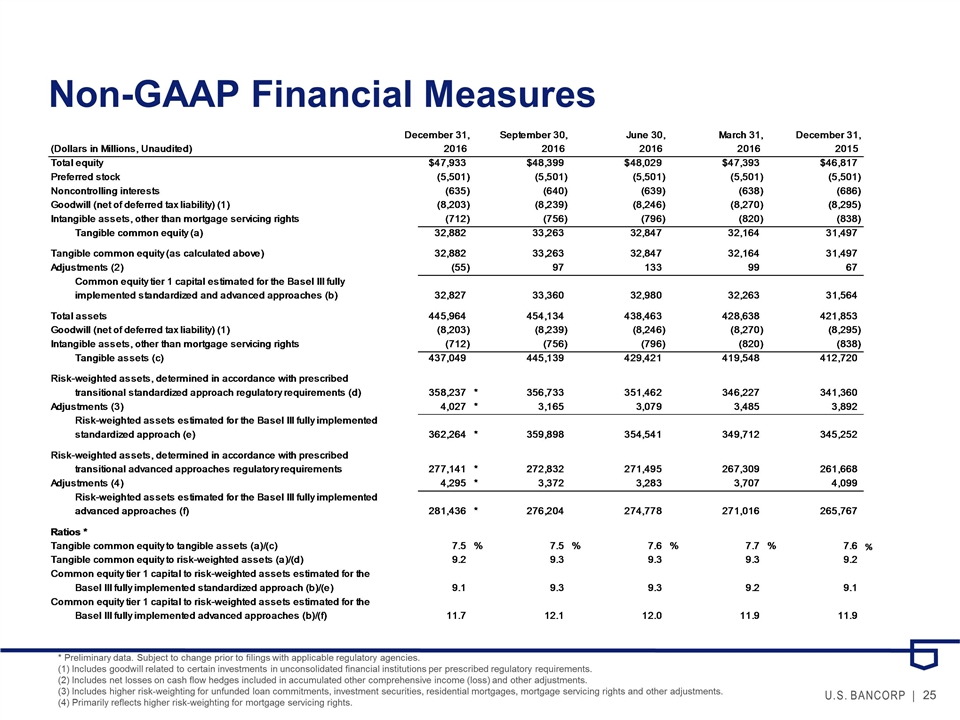
Non-GAAP Financial Measures * Preliminary data. Subject to change prior to filings with applicable regulatory agencies. (1) Includes goodwill related to certain investments in unconsolidated financial institutions per prescribed regulatory requirements. (2) Includes net losses on cash flow hedges included in accumulated other comprehensive income (loss) and other adjustments. (3) Includes higher risk-weighting for unfunded loan commitments, investment securities, residential mortgages, mortgage servicing rights and other adjustments. (4) Primarily reflects higher risk-weighting for mortgage servicing rights.
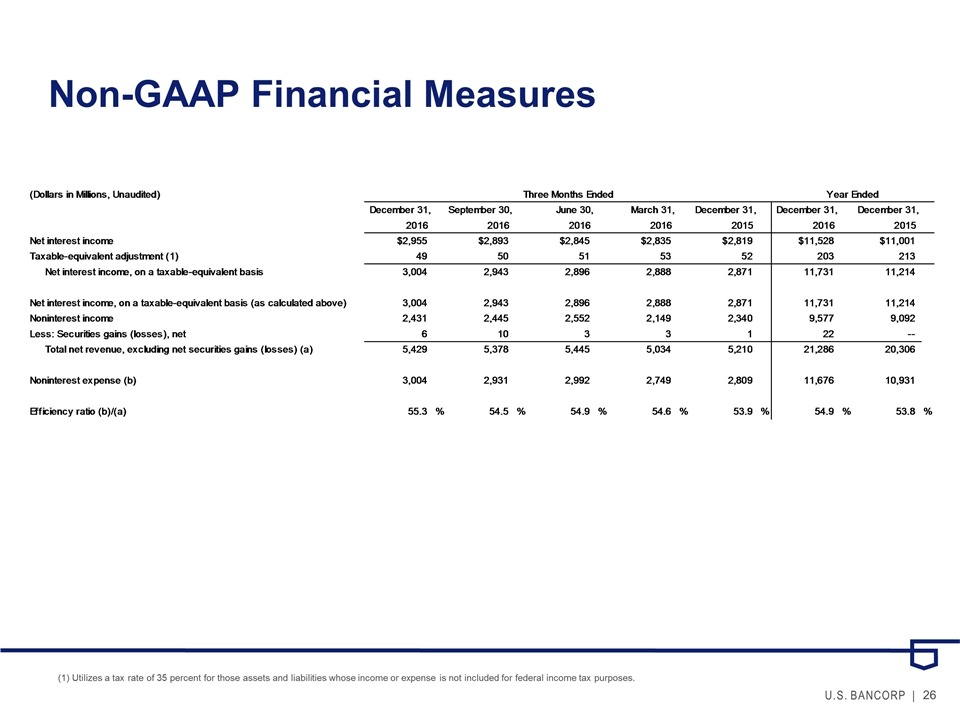
Non-GAAP Financial Measures (1) Utilizes a tax rate of 35 percent for those assets and liabilities whose income or expense is not included for federal income tax purposes.

U.S. Bancorp 4Q16 Earnings Conference Call January 18, 2017
Serious News for Serious Traders! Try StreetInsider.com Premium Free!
You May Also Be Interested In
- Highline Recognizes Three Townships in Michigan’s Sanilac County for being Designated as Smart Rural Communities
- TXODDS Develops Fastest Live Odds API Feeds on the Market, Revolutionizing the Sports Betting Sector
- Voto Latino Announces Honorees for 16th Annual Our Voices Celebration
Create E-mail Alert Related Categories
SEC FilingsSign up for StreetInsider Free!
Receive full access to all new and archived articles, unlimited portfolio tracking, e-mail alerts, custom newswires and RSS feeds - and more!


 Tweet
Tweet Share
Share