Form 8-K Triangle Petroleum Corp For: Sep 08
UNITED STATES
SECURITIES AND EXCHANGE COMMISSION
Washington, D.C. 20549
FORM 8-K
CURRENT REPORT
PURSUANT TO SECTION 13 OR 15(d) OF THE
SECURITIES EXCHANGE ACT OF 1934
Date of Report (Date of earliest event reported): September 8, 2015
TRIANGLE PETROLEUM CORPORATION
(Exact name of registrant as specified in charter)
|
Delaware |
|
001-34945 |
|
98-0430762 |
|
(State or other jurisdiction of |
|
(Commission |
|
(I.R.S. Employer |
|
incorporation or organization) |
|
file number) |
|
Identification No.) |
1200 17th Street, Suite 2600, Denver, CO 80202
(Address of principal executive offices)
Registrant’s telephone number, including area code: (303) 260-7125
Check the appropriate box below if the Form 8-K filing is intended to simultaneously satisfy the filing obligation of the registrant under any of the following provisions:
o Written communications pursuant to Rule 425 under the Securities Act (17 CFR 230.425)
o Soliciting material pursuant to Rule 14a-12 under the Exchange Act (17 CFR 240.14a-12)
o Pre-commencement communications pursuant to Rule 14d-2(b) under the Exchange Act (17 CFR 240.14d-2(b))
o Pre-commencement communications pursuant to Rule 13e-4(c) under the Exchange Act (17 CFR 240.13e-4(c))
Item 2.02 Results of Operations and Financial Condition.
On September 8, 2015, the Company issued a press release announcing its financial results for its fiscal year 2016 second fiscal quarter ended July 31, 2015. A copy of this press release is attached hereto as Exhibit 99.1 and is incorporated herein by reference.
Item 7.01 Regulation FD Disclosure.
On September 8, 2015, the Company posted on its corporate website an updated corporate presentation, which contains non-public information. A copy of this presentation is attached hereto as Exhibit 99.2 and is incorporated herein by reference.
The information in Item 2.02 and Item 7.01 of this Current Report on Form 8-K and in Exhibits 99.1 and 99.2 attached hereto are being furnished and shall not be deemed “filed” for the purposes of Section 18 of the Securities Exchange Act of 1934, as amended, or otherwise subject to the liabilities of that Section. The information in Item 2.02 and Item 7.01 of this Current Report on Form 8-K and in Exhibits 99.1 and 99.2 attached hereto shall not be incorporated by reference into any registration statement or other document filed pursuant to the Securities Act of 1933, as amended, except as shall be expressly set forth by specific reference in any such filing.
Item 9.01 Financial Statements and Exhibits.
(d) Exhibits
|
Exhibit 99.1 |
|
Press Release, dated September 8, 2015. |
|
Exhibit 99.2 |
|
Corporate Presentation, posted on September 8, 2015. |
SIGNATURES
Pursuant to the requirements of the Securities Exchange Act of 1934, the registrant has duly caused this report to be signed on its behalf by the undersigned hereunto duly authorized.
|
Date: September 8, 2015 |
TRIANGLE PETROLEUM CORPORATION | |
|
|
| |
|
|
| |
|
|
By: |
/s/ Justin Bliffen |
|
|
|
Justin Bliffen |
|
|
|
Chief Financial Officer |
Index to Exhibits
|
Exhibit |
|
Description |
|
|
|
|
|
Exhibit 99.1* |
|
Press Release, dated September 8, 2015. |
|
Exhibit 99.2* |
|
Corporate Presentation, posted on September 8, 2015. |
* Filed herewith.
Exhibit 99.1

TRIANGLE PETROLEUM PROVIDES FINANCIAL RESULTS AND OPERATIONAL UPDATE FOR ALL BUSINESS SEGMENTS FOR SECOND QUARTER FISCAL YEAR 2016
DENVER, Colorado, September 8, 2015 — Triangle Petroleum Corporation (“Triangle” or the “Company”) (NYSE MKT: TPLM) today provides an operational update and reports its second quarter fiscal year 2016 financial results for the three-month period ended July 31, 2015 (“Q2 fiscal 2016” or “Q2 FY 2016”).
Second Quarter Highlights for Fiscal Year 2016 (ended July 31, 2015)
· Quarterly production volumes of ~1,242 Mboe (13,500 Boepd)
· Consolidated cash flow from operations (before working capital changes) of $36.1 million and operating cash flow of $40.8 million
· Consolidated adjusted revenue of $126.7 million including $17.0 million of cash receipts from hedge settlements
· Consolidated adjusted-EBITDA of $44.3 million
· 11% quarter over quarter decrease in consolidated cash general and administrative expenses
· $286.7 million of total liquidity as of July 31, 2015, including $45.9 million of cash on hand and available borrowing capacity on the Triangle USA Petroleum (“TUSA”) and RockPile Energy Services (“RockPile”) credit facilities
· TUSA generated $72.3 million of revenue in Q2 FY 2016 including $17.0 million of cash receipts from hedge settlements as compared to $77.6 million of comparable revenue in Q2 FY 2015 (-7% y/y)
· TUSA’s pre-hedge oil price differential declined ~36% q/q to $4.92/Bbl
· Spud 5 gross (4.1 net) and completed 9 gross (6.6 net) operated wells while dropping to a one-rig operated program during Q2 FY 2016
· Released remaining operated rig due to current depressed commodity pricing
· Inventory of 18 gross (16.4 net) operated wells waiting on completion as of July 31, 2015 provides flexibility to manage production and capital spend
· TUSA’s cash operating expenses (LOE, Gathering, Transportation and Processing, production taxes, and G&A) per unit were $19.63/Boe in Q2 FY 2016 compared to $18.55/Boe in Q1 FY 2016 (+6% q/q) and $24.26/Boe in Q2 FY 2015 (-19% y/y)
· RockPile generated $69.4 million of stand-alone revenue in Q2 fiscal 2016 as compared to $102.1 million in Q2 fiscal 2015 (-32% y/y)
· RockPile generated $7.9 million of stand-alone EBITDA during the quarter as efforts to reduce operating and input costs began to offset price concessions passed along to date
· Completed 48 wells in the quarter including 39 for third parties and 9 for TUSA
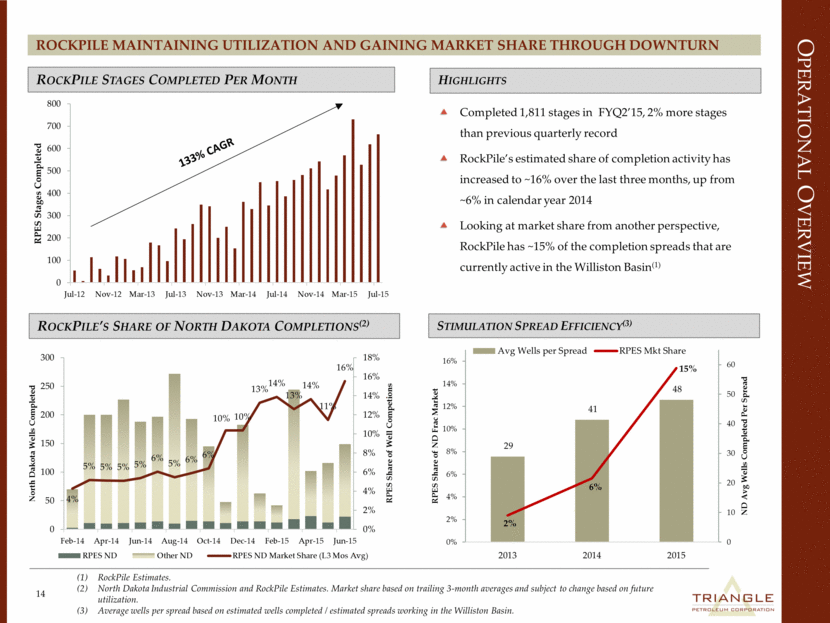
· Completed 1,811 stages (+2% q/q) representing a new quarterly record
Segment Financial Results
Q2 fiscal 2016 stand-alone revenue and Adjusted-EBITDA (reference accompanying “Reconciliation Tables” and “Use of Segment Information and Non-GAAP Measures” disclosures at end of release).
|
Q2 FY 2016 |
|
Revenue |
|
y/y % Change |
|
Adj.-EBITDA |
|
y/y % Change |
| ||
|
E&P |
|
$ |
55.3 |
|
-31 |
% |
$ |
47.9 |
|
-11 |
% |
|
RockPile |
|
$ |
69.4 |
|
-32 |
% |
$ |
7.9 |
|
-72 |
% |
|
Total |
|
$ |
124.7 |
|
-32 |
% |
$ |
55.8 |
|
-33 |
% |
*Dollars in U.S. millions.
*E&P revenue does not include realized hedge settlements.
*Exploration and production operating segment (“E&P”) Adjusted-EBITDA includes all exploration and production related business lines, and does not include TPC (parent company) other revenues and expenses.
Q2 Fiscal 2016 Summary Consolidated Statement of Operations (in thousands)
|
|
|
Quarter Ended July 31, |
| ||||
|
|
|
2014 |
|
2015 |
| ||
|
Revenues |
|
|
|
|
| ||
|
Oil, natural gas and natural gas liquids sales |
|
$ |
80,506 |
|
$ |
55,263 |
|
|
Oilfield services(a) |
|
61,483 |
|
54,470 |
| ||
|
Total revenues |
|
141,989 |
|
109,733 |
| ||
|
Expenses |
|
|
|
|
| ||
|
Lease operating expenses |
|
6,698 |
|
11,369 |
| ||
|
Gathering, transportation and processing |
|
3,733 |
|
6,641 |
| ||
|
Production taxes |
|
8,677 |
|
5,449 |
| ||
|
Depreciation and amortization(a) |
|
26,707 |
|
32,244 |
| ||
|
Impairment of oil and natural gas properties |
|
— |
|
206,000 |
| ||
|
Accretion of asset retirement obligations |
|
40 |
|
90 |
| ||
|
Oilfield services(a) |
|
43,554 |
|
46,719 |
| ||
|
Corporate and other stock-based compensation |
|
1,337 |
|
3,167 |
| ||
|
E&P stock-based compensation |
|
343 |
|
375 |
| ||
|
RockPile stock-based compensation |
|
127 |
|
84 |
| ||
|
Corporate and other cash G&A expenses |
|
2,591 |
|
5,056 |
| ||
|
E&P cash G&A expenses |
|
4,442 |
|
933 |
| ||
|
RockPile cash G&A expenses |
|
5,251 |
|
4,974 |
| ||
|
Total operating expenses |
|
103,500 |
|
323,101 |
| ||
|
|
|
|
|
|
| ||
|
Operating Income (Loss) |
|
38,489 |
|
(213,368 |
) | ||
|
|
|
|
|
|
| ||
|
Interest expense, net |
|
(4,218 |
) |
(9,866 |
) | ||
|
Amortization of deferred loan costs |
|
(1,167 |
) |
(731 |
) | ||
|
Gain on extinguishment of debt |
|
— |
|
1,156 |
| ||
|
Realized commodity derivative gains (losses) |
|
(2,954 |
) |
17,016 |
| ||
|
Unrealized commodity derivative gains (losses) |
|
2,033 |
|
8,033 |
| ||
|
Equity investment income (loss) |
|
190 |
|
1,210 |
| ||
|
Gain (loss) on equity investment derivatives |
|
(7,534 |
) |
4,516 |
| ||
|
Other income(a) |
|
52 |
|
(1,312 |
) | ||
|
Total other income (expense) |
|
(13,598 |
) |
20,022 |
| ||
|
|
|
|
|
|
| ||
|
Income (Loss) Before Income Taxes |
|
24,891 |
|
(193,346 |
) | ||
|
Income tax provision (benefit)(b) |
|
10,339 |
|
— |
| ||
|
Net Income (Loss) Attributable to Common Stockholders |
|
$ |
14,552 |
|
$ |
(193,346 |
) |
|
|
|
|
|
|
| ||
|
Net Income (Loss) per Common Share |
|
|
|
|
| ||
|
Basic |
|
$ |
0.17 |
|
$ |
(2.56 |
) |
|
Diluted(c) |
|
$ |
0.15 |
|
$ |
(2.56 |
) |
|
|
|
|
|
|
| ||
|
Adjusted Net Income (Loss) per Common Share(d) |
|
|
|
|
| ||
|
Basic |
|
$ |
0.21 |
|
$ |
(0.01 |
) |
|
Diluted(c) |
|
$ |
0.18 |
|
$ |
(0.01 |
) |
|
|
|
|
|
|
| ||
|
Weighted Average Common Shares |
|
|
|
|
| ||
|
Basic |
|
86,172 |
|
75,410 |
| ||
|
Diluted |
|
103,774 |
|
75,410 |
| ||
(a) Includes intercompany eliminations; reference Note 3 — Segment Reporting in our Q2 fiscal year 2016 Form 10-Q for additional details
(b) The effective tax rate for the quarter ended July 31, 2014 was approximately 41.5%. Income tax provision is a non-cash expense
(c) Includes interest expense add-back of $1.0 million net of income taxes and amounts capitalized in Q2 fiscal 2015 related to outstanding convertible note
(d) Reference accompanying Reconciliation Tables and Use of Segment Information and Non-GAAP Measures at end of press release for additional detail
Q2 Fiscal 2016 Summary Consolidated Balance Sheet (in thousands)
|
|
|
January 31, 2015 |
|
July 31, 2015 |
| ||
|
Assets |
|
|
|
|
| ||
|
Cash and equivalents |
|
$ |
67,871 |
|
$ |
45,870 |
|
|
Other current assets |
|
241,638 |
|
151,783 |
| ||
|
Net property and equipment |
|
1,261,006 |
|
916,589 |
| ||
|
Other noncurrent assets |
|
84,355 |
|
95,715 |
| ||
|
Total assets |
|
$ |
1,654,870 |
|
$ |
1,209,957 |
|
|
|
|
|
|
|
| ||
|
Liabilities and Stockholders’ Equity |
|
|
|
|
| ||
|
Current liabilities |
|
$ |
271,842 |
|
$ |
190,767 |
|
|
5% convertible note |
|
135,877 |
|
139,295 |
| ||
|
TUSA credit facility |
|
119,272 |
|
172,272 |
| ||
|
TUSA 6.75% notes due July 2022 |
|
429,500 |
|
425,889 |
| ||
|
RockPile credit facility |
|
104,887 |
|
86,920 |
| ||
|
Other notes and mortgages payable |
|
10,102 |
|
12,687 |
| ||
|
Other noncurrent liabilities |
|
38,372 |
|
4,435 |
| ||
|
Total stockholders’ equity |
|
545,018 |
|
177,692 |
| ||
|
Total liabilities and stockholders’ equity |
|
$ |
1,654,870 |
|
$ |
1,209,957 |
|
Q2 Fiscal 2016 Production Volumes and Average Pre-Hedging Realized Prices
|
|
|
Quarter Ended July 31, |
| ||||
|
|
|
2014 |
|
2015 |
| ||
|
Production volumes |
|
|
|
|
| ||
|
Crude oil (Mbbls) |
|
837 |
|
1,015 |
| ||
|
Natural gas (MMcf) |
|
494 |
|
751 |
| ||
|
Natural gas liquids (Mbbls) |
|
51 |
|
102 |
| ||
|
Total barrels of oil equivalent (Mboe) |
|
970 |
|
1,242 |
| ||
|
|
|
|
|
|
| ||
|
Average daily production volumes (Boe/d) |
|
10,543 |
|
13,500 |
| ||
|
|
|
|
|
|
| ||
|
Average realized prices: |
|
|
|
|
| ||
|
Crude oil ($ per Bbl) |
|
$ |
90.78 |
|
$ |
51.71 |
|
|
Natural gas ($ per Mcf) |
|
$ |
5.49 |
|
$ |
2.56 |
|
|
Natural gas liquids ($ per Bbl) |
|
$ |
35.29 |
|
$ |
8.36 |
|
|
Total average realized price ($ per Boe) |
|
$ |
82.94 |
|
$ |
44.50 |
|
Use of Segment Information and Non-GAAP Measures
(1) The Company often provides financial metrics for Triangle’s segments of operation. Revenues for each segment are disclosed in notes to the financial statements contained in the Company’s Form 10-K and Form 10-Q filings, but the sum of those stand-alone revenues differ from Triangle’s consolidated revenues for the corresponding reporting period. Triangle’s consolidated revenues would reflect segment revenues reduced for intercompany sales (i.e. for RockPile services to Triangle’s E&P segment).
Triangle also believes that stand-alone segment revenue assists investors in measuring RockPile’s performance as a stand-alone company without eliminating, on a consolidated basis, certain revenues attributable to services for Triangle’s economic interests in wells operated by Triangle’s E&P segment.
(2) Adjusted-EBITDA represents income before interest expense, income taxes, depreciation and amortization, other non-cash items, and non-recurring items. Adjusted-EBITDA is not a calculation based upon generally accepted accounting principles in the U.S. (“GAAP”). Triangle has presented Adjusted-EBITDA by segment because it regularly reviews Adjusted-EBITDA by segment as a measure of the segment’s operating performance. Triangle also believes Adjusted-EBITDA assists investors in comparing segment performance on a consistent basis without regard to interest expense, income taxes, depreciation and amortization, other non-cash items, and non-recurring items which can vary significantly depending upon many factors.
The total of Adjusted-EBITDA by segment is not indicative of Triangle’s consolidated Adjusted-EBITDA, which reflects other matters such as (i) additional parent company administrative costs, (ii) intercompany eliminations, (iii) paid-in-kind interest expense on the 5% convertible note, and (iv) the use of the equity method, rather than consolidation, for Triangle’s investment in Caliber. The Adjusted-EBITDA measures presented in the “Reconciliation Tables” may not always be comparable to similarly titled measures reported by other companies due to differences in the components of the calculation.
Triangle believes that net income before income taxes is the performance measure calculated and presented in accordance with GAAP that is most directly comparable to Adjusted-EBITDA. Net income before income taxes will be significantly affected by consolidated interest expense and full-cost pool amortization. Such amortization varies with changes in proved reserves, well costs during the year, and future plans in developing proved undeveloped reserves.
(3) Adjusted net income (loss) is defined as net income (loss) applicable to common stockholders adjusted to exclude certain charges or amounts in order to provide users of this financial information with additional meaningful comparisons between current results and the results of prior periods. Triangle presents this measure because (i) it is consistent with the manner in which the Company’s performance is measured relative to the performance of its peers, (ii) this measure is more comparable to earnings estimates provided by securities analysts, and (iii) charges or amounts excluded cannot be reasonably estimated and guidance provided by the Company excludes information regarding these types of items. These adjusted amounts are not a measure of financial performance under GAAP. We believe that net income (loss) is the performance measure calculated and presented in accordance with GAAP that is most directly comparable to adjusted net income (loss).
About Triangle
Triangle (NYSE MKT: TPLM) is an independent energy company with a strategic focus on developing the Bakken Shale and Three Forks formations in the Williston Basin of North Dakota and Montana. For more information, visit Triangle’s website at www.trianglepetroleum.com.
Conference Call Information
As previously announced, Triangle will host a conference call Wednesday, September 9, 2015 at 8:30 AM MT (10:30 AM ET) to provide an operational update and financial results of Triangle’s Q2 fiscal 2016, followed immediately by a question and answer session. A live webcast of the conference call can be accessed by visiting the following link: https://www.webcaster4.com/Webcast/Page/1137/10181. Alternatively, interested parties may dial-in using the conference call number (888) 347-6610. International parties may dial-in using (412) 902-4292. The Company recommends dialing into the conference call at least ten minutes before the scheduled start time. A recording of the conference call will be available through September 16, 2015 at (877) 344-7529 (conference # 10071430). For international participants, the replay dial-in number is (412) 317-0088 (conference # 10071430).
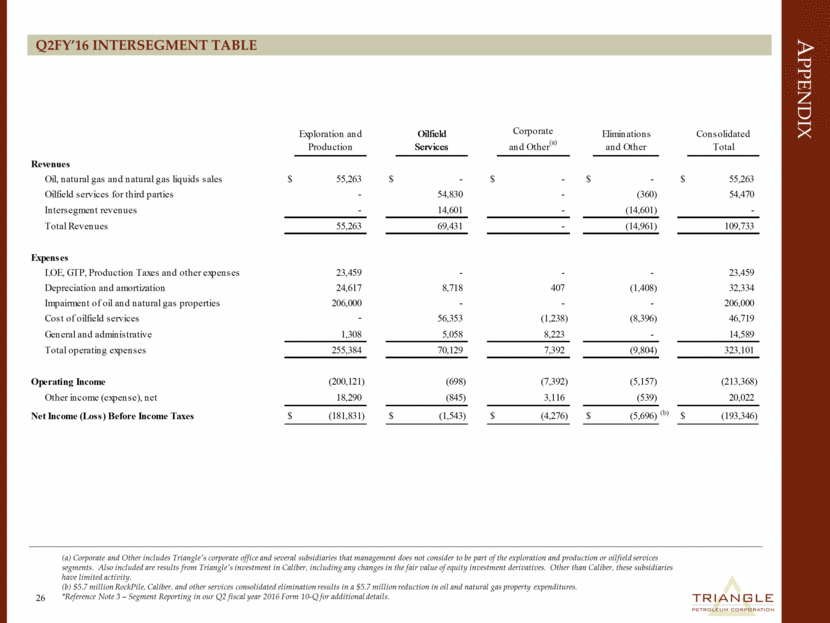
Q2 Fiscal 2016 Segment Income and Elimination (in thousands)
|
|
|
Exploration and |
|
Oilfield |
|
Corporate |
|
Eliminations |
|
Consolidated |
| |||||
|
Revenues |
|
|
|
|
|
|
|
|
|
|
| |||||
|
Oil, natural gas and natural gas liquids sales |
|
$ |
55,263 |
|
$ |
— |
|
$ |
— |
|
$ |
— |
|
$ |
55,263 |
|
|
Oilfield services for third parties |
|
— |
|
54,830 |
|
— |
|
(360 |
) |
54,470 |
| |||||
|
Intersegment revenues |
|
— |
|
14,601 |
|
— |
|
(14,601 |
) |
— |
| |||||
|
Total Revenues |
|
55,263 |
|
69,431 |
|
— |
|
(14,961 |
) |
109,733 |
| |||||
|
|
|
|
|
|
|
|
|
|
|
|
| |||||
|
Expenses |
|
|
|
|
|
|
|
|
|
|
| |||||
|
LOE, GTP, Production Taxes and other expenses |
|
23,459 |
|
— |
|
— |
|
— |
|
23,459 |
| |||||
|
Depreciation and amortization |
|
24,617 |
|
8,718 |
|
407 |
|
(1,408 |
) |
32,334 |
| |||||
|
Impairment of oil and natural gas properties |
|
206,000 |
|
— |
|
— |
|
— |
|
206,000 |
| |||||
|
Cost of oilfield services |
|
— |
|
56,353 |
|
(1,238 |
) |
(8,396 |
) |
46,719 |
| |||||
|
General and administrative |
|
1,308 |
|
5,058 |
|
8,223 |
|
— |
|
14,589 |
| |||||
|
Total operating expenses |
|
255,384 |
|
70,129 |
|
7,392 |
|
(9,804 |
) |
323,101 |
| |||||
|
|
|
|
|
|
|
|
|
|
|
|
| |||||
|
Operating Income |
|
(200,121 |
) |
(698 |
) |
(7,392 |
) |
(5,157 |
) |
(213,368 |
) | |||||
|
Other income (expense), net |
|
18,290 |
|
(845 |
) |
3,116 |
|
(539 |
) |
20,022 |
| |||||
|
Net Income (Loss) Before Income Taxes |
|
$ |
(181,831 |
) |
$ |
(1,543 |
) |
$ |
(4,276 |
) |
$ |
(5,696 |
)(b) |
$ |
(193,346 |
) |
(a) Corporate and Other includes Triangle’s corporate office and several subsidiaries that management does not consider to be part of the exploration and production or oilfield services segments. Also included are results from Triangle’s investment in Caliber, including any changes in the fair value of equity investment derivatives. Other than Caliber, these subsidiaries have limited activity
(b) $5.7 million RockPile, Caliber, and other services consolidated elimination results in a $5.7 million reduction in oil and natural gas property expenditures.
*Reference Note 3 — Segment Reporting in our Q2 fiscal year 2016 Form 10-Q for additional details
Reconciliation Tables (in thousands)
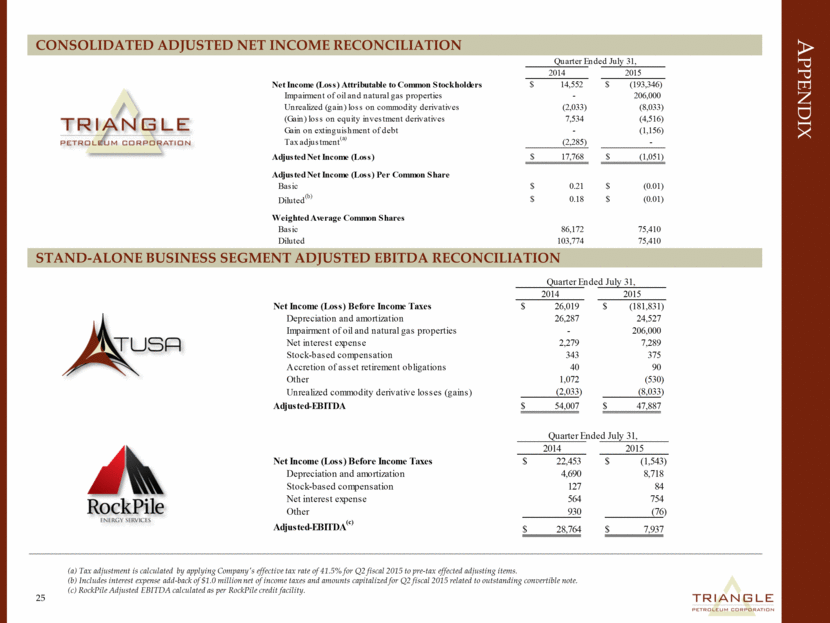
A. Consolidated Adjusted net income per common stockholder (reference disclosure (3) in “Use of Segment Information and Non-GAAP Measures”).
|
|
|
Quarter Ended July 31, |
| ||||
|
|
|
2014 |
|
2015 |
| ||
|
Net Income (Loss) Attributable to Common Stockholders |
|
$ |
14,552 |
|
$ |
(193,346 |
) |
|
Impairment of oil and natural gas properties |
|
— |
|
206,000 |
| ||
|
Unrealized (gain) loss on commodity derivatives |
|
(2,033 |
) |
(8,033 |
) | ||
|
(Gain) loss on equity investment derivatives |
|
7,534 |
|
(4,516 |
) | ||
|
Gain on extinguishment of debt |
|
— |
|
(1,156 |
) | ||
|
Tax adjustment(a) |
|
(2,285 |
) |
— |
| ||
|
Adjusted Net Income (Loss) |
|
$ |
17,768 |
|
$ |
(1,051 |
) |
|
|
|
|
|
|
| ||
|
Adjusted Net Income (Loss) Per Common Share |
|
|
|
|
| ||
|
Basic |
|
$ |
0.21 |
|
$ |
(0.01 |
) |
|
Diluted(b) |
|
$ |
0.18 |
|
$ |
(0.01 |
) |
|
|
|
|
|
|
| ||
|
Weighted Average Common Shares |
|
|
|
|
| ||
|
Basic |
|
86,172 |
|
75,410 |
| ||
|
Diluted |
|
103,774 |
|
75,410 |
| ||
(a) Tax adjustment is calculated by applying Company’s effective tax rate of 41.5% for Q2 fiscal 2015 to pre-tax effected adjusting items
(b) Includes interest expense add-back of $1.0 million net of income taxes and amounts capitalized for Q2 fiscal 2015 related to outstanding convertible note
B. E&P stand-alone Adjusted-EBITDA (reference disclosure (1) and (2) in “Use of Segment Information and Non-GAAP Measures”).
|
|
|
Quarter Ended July 31, |
| ||||
|
|
|
2014 |
|
2015 |
| ||
|
Net Income (Loss) Before Income Taxes |
|
$ |
26,019 |
|
$ |
(181,831 |
) |
|
Depreciation and amortization |
|
26,287 |
|
24,527 |
| ||
|
Impairment of oil and natural gas properties |
|
— |
|
206,000 |
| ||
|
Net interest expense |
|
2,279 |
|
7,289 |
| ||
|
Stock-based compensation |
|
343 |
|
375 |
| ||
|
Accretion of asset retirement obligations |
|
40 |
|
90 |
| ||
|
Other |
|
1,072 |
|
(530 |
) | ||
|
Unrealized commodity derivative losses (gains) |
|
(2,033 |
) |
(8,033 |
) | ||
|
Adjusted-EBITDA |
|
$ |
54,007 |
|
$ |
47,887 |
|
C. Oilfield Services stand-alone Adjusted-EBITDA (reference disclosure (1) and (2) in “Use of Segment Information and Non-GAAP Measures”).
|
|
|
Quarter Ended July 31, |
| ||||
|
|
|
2014 |
|
2015 |
| ||
|
Net Income (Loss) Before Income Taxes |
|
$ |
22,453 |
|
$ |
(1,543 |
) |
|
Depreciation and amortization |
|
4,690 |
|
8,718 |
| ||
|
Stock-based compensation |
|
127 |
|
84 |
| ||
|
Net interest expense |
|
564 |
|
754 |
| ||
|
Other |
|
930 |
|
(76 |
) | ||
|
Adjusted-EBITDA(c) |
|
$ |
28,764 |
|
$ |
7,937 |
|
*RockPile Adjusted-EBITDA calculated per RockPile credit facility
Forward-Looking Statements Disclosure
The information presented in this press release may contain “forward-looking statements” within the meaning of the Private Securities Litigation Reform Act of 1995. All statements, other than statements of historical facts, included in this press release that address activities, events or developments that the Company expects, believes or anticipates will or may occur in the future are forward-looking statements. These forward-looking statements are not guarantees of future performance and are subject to risks and uncertainties that could cause actual results to differ materially from the results contemplated by the forward-looking statements. Factors that could cause actual results to differ materially from the results contemplated by the forward-looking statements include, but are not limited to, the risks discussed in the Company’s annual report on Form 10-K and its other filings with the Securities and Exchange Commission. The forward-looking statements in this press release are made as of the date of this press release, and the Company undertakes no obligation to update any forward-looking statement as a result of new information, future developments, or otherwise.
Contact
Triangle Petroleum Corporation
Joe Magner, Vice President, Capital Markets
303-260-7125
[email protected]
Exhibit 99.2
|
|
Corporate Presentation September 2015 |
|
|
Forward Looking Statements The information presented in this presentation may contain "forward-looking statements" within the meaning of the Private Securities Litigation Reform Act of 1995. All statements, other than statements of historical facts, included in this presentation that address activities, events or developments that the Company expects, believes or anticipates will or may occur in the future are forward-looking statements. These forward-looking statements are not guarantees of future performance and are subject to risks and uncertainties that could cause actual results to differ materially from the results contemplated by the forward-looking statements. Factors that could cause actual results to differ materially from the results contemplated by the forward-looking statements include, but are not limited to, the risks discussed in the Company's annual report on Form 10-K and its other filings with the Securities and Exchange Commission. The forward-looking statements in this presentation are made as of the date of this presentation, and the Company undertakes no obligation to update any forward-looking statement as a result of new information, future developments, or otherwise. |
|
|
Table of Contents Business Overview Financial Overview 8 Appendix 4 Operational Overview 16 22 |
|
|
Business Overview |
|
|
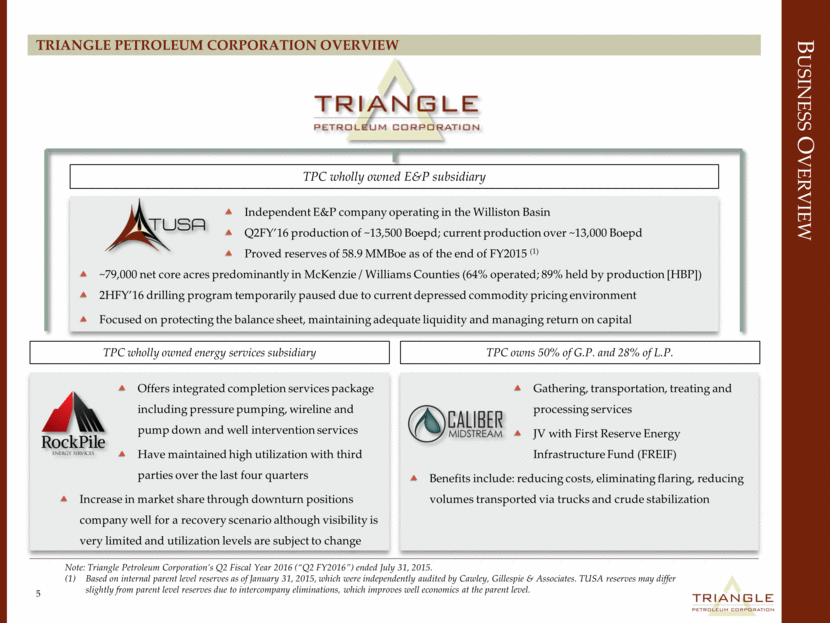
Gathering, transportation, treating and processing services JV with First Reserve Energy Infrastructure Fund (FREIF) Benefits include: reducing costs, eliminating flaring, reducing volumes transported via trucks and crude stabilization TPC wholly owned energy services subsidiary TPC wholly owned E&P subsidiary Business Overview Triangle Petroleum Corporation OVERVIEW 5 Offers integrated completion services package including pressure pumping, wireline and pump down and well intervention services Have maintained high utilization with third parties over the last four quarters Increase in market share through downturn positions company well for a recovery scenario although visibility is very limited and utilization levels are subject to change Independent E&P company operating in the Williston Basin Q2FY’16 production of ~13,500 Boepd; current production over ~13,000 Boepd Proved reserves of 58.9 MMBoe as of the end of FY2015 (1) ~79,000 net core acres predominantly in McKenzie / Williams Counties (64% operated; 89% held by production [HBP]) 2HFY’16 drilling program temporarily paused due to current depressed commodity pricing environment Focused on protecting the balance sheet, maintaining adequate liquidity and managing return on capital Note: Triangle Petroleum Corporation’s Q2 Fiscal Year 2016 (“Q2 FY2016”) ended July 31, 2015. Based on internal parent level reserves as of January 31, 2015, which were independently audited by Cawley, Gillespie & Associates. TUSA reserves may differ slightly from parent level reserves due to intercompany eliminations, which improves well economics at the parent level. TPC owns 50% of G.P. and 28% of L.P. |
|
|
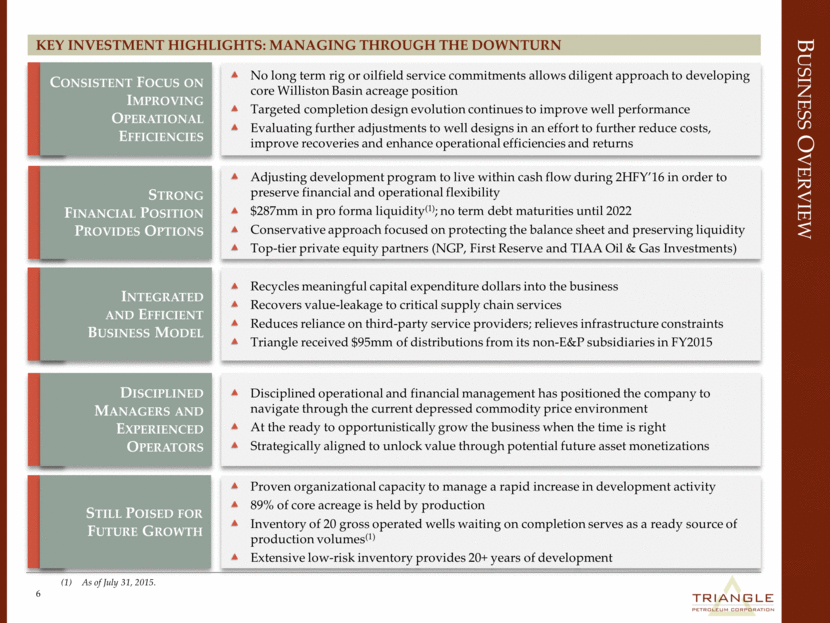
Strong Financial Position Provides Options Key Investment Highlights: Managing Through the Downturn 6 As of July 31, 2015. Proven organizational capacity to manage a rapid increase in development activity 89% of core acreage is held by production Inventory of 20 gross operated wells waiting on completion serves as a ready source of production volumes(1) Extensive low-risk inventory provides 20+ years of development Recycles meaningful capital expenditure dollars into the business Recovers value-leakage to critical supply chain services Reduces reliance on third-party service providers; relieves infrastructure constraints Triangle received $95mm of distributions from its non-E&P subsidiaries in FY2015 Integrated and Efficient Business Model Adjusting development program to live within cash flow during 2HFY’16 in order to preserve financial and operational flexibility $287mm in pro forma liquidity(1); no term debt maturities until 2022 Conservative approach focused on protecting the balance sheet and preserving liquidity Top-tier private equity partners (NGP, First Reserve and TIAA Oil & Gas Investments) Disciplined operational and financial management has positioned the company to navigate through the current depressed commodity price environment At the ready to opportunistically grow the business when the time is right Strategically aligned to unlock value through potential future asset monetizations No long term rig or oilfield service commitments allows diligent approach to developing core Williston Basin acreage position Targeted completion design evolution continues to improve well performance Evaluating further adjustments to well designs in an effort to further reduce costs, improve recoveries and enhance operational efficiencies and returns Still Poised for Future Growth Business Overview Disciplined Managers and Experienced Operators Consistent Focus on Improving Operational Efficiencies |
|
|
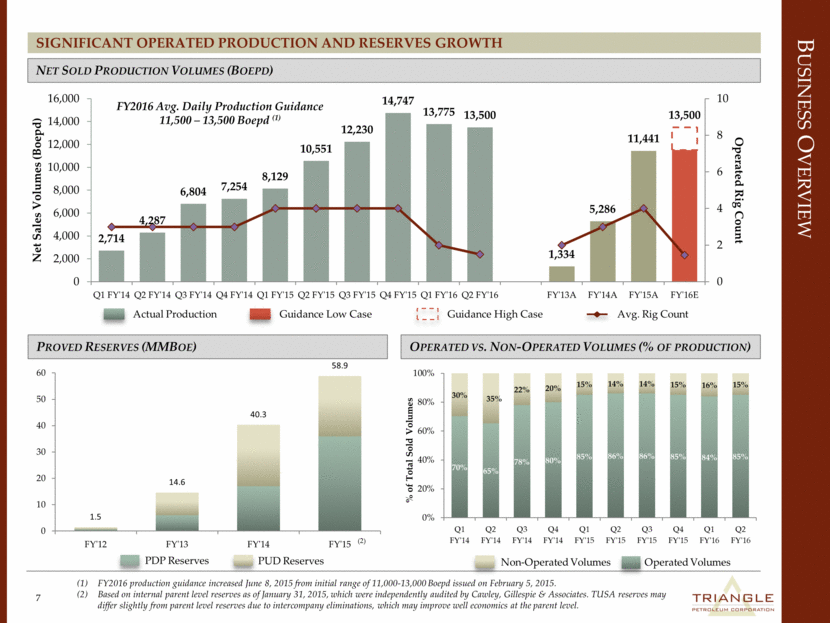
PDP Reserves PUD Reserves Operated vs. Non-Operated Volumes (% of production) Significant Operated Production and Reserves Growth 7 Net Sold Production Volumes (Boepd) FY2016 production guidance increased June 8, 2015 from initial range of 11,000-13,000 Boepd issued on February 5, 2015. Based on internal parent level reserves as of January 31, 2015, which were independently audited by Cawley, Gillespie & Associates. TUSA reserves may differ slightly from parent level reserves due to intercompany eliminations, which may improve well economics at the parent level. Actual Production Business Overview FY2016 Avg. Daily Production Guidance 11,500 – 13,500 Boepd (1) Proved Reserves (MMBoe) Guidance Low Case Guidance High Case Avg. Rig Count Non-Operated Volumes Operated Volumes (2) 1.5 14.6 40.3 58.9 0 10 20 30 40 50 60 FY'12 FY'13 FY'14 FY'15 2,714 4,287 6,804 7,254 8,129 10,551 12,230 14,747 13,775 13,500 1,334 5,286 11,441 13,500 0 2 4 6 8 10 0 2,000 4,000 6,000 8,000 10,000 12,000 14,000 16,000 Q1 FY'14 Q2 FY'14 Q3 FY'14 Q4 FY'14 Q1 FY'15 Q2 FY'15 Q3 FY'15 Q4 FY'15 Q1 FY'16 Q2 FY'16 FY'13A FY'14A FY'15A FY'16E Operated Rig Count Net Sales Volumes (Boepd) 70% 65% 78% 80% 85% 86% 86% 85% 84% 85% 30% 35% 22% 20% 15% 14% 14% 15% 16% 15% 0% 20% 40% 60% 80% 100% Q1 FY'14 Q2 FY'14 Q3 FY'14 Q4 FY'14 Q1 FY'15 Q2 FY'15 Q3 FY'15 Q4 FY'15 Q1 FY'16 Q2 FY'16 % of Total Sold Volumes |
|
|
Operational Overview |
|
|
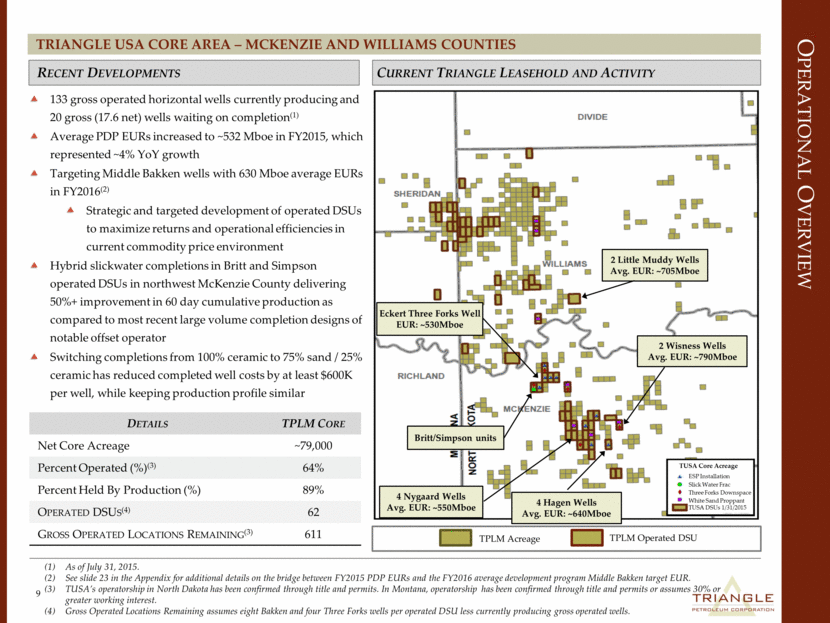
Operational Overview Triangle USA Core Area – McKenzie and Williams Counties 9 As of July 31, 2015. See slide 23 in the Appendix for additional details on the bridge between FY2015 PDP EURs and the FY2016 average development program Middle Bakken target EUR. TUSA’s operatorship in North Dakota has been confirmed through title and permits. In Montana, operatorship has been confirmed through title and permits or assumes 30% or greater working interest. Gross Operated Locations Remaining assumes eight Bakken and four Three Forks wells per operated DSU less currently producing gross operated wells. Recent Developments 133 gross operated horizontal wells currently producing and 20 gross (17.6 net) wells waiting on completion(1) Average PDP EURs increased to ~532 Mboe in FY2015, which represented ~4% YoY growth Targeting Middle Bakken wells with 630 Mboe average EURs in FY2016(2) Strategic and targeted development of operated DSUs to maximize returns and operational efficiencies in current commodity price environment Hybrid slickwater completions in Britt and Simpson operated DSUs in northwest McKenzie County delivering 50%+ improvement in 60 day cumulative production as compared to most recent large volume completion designs of notable offset operator Switching completions from 100% ceramic to 75% sand / 25% ceramic has reduced completed well costs by at least $600K per well, while keeping production profile similar Current Triangle Leasehold and Activity Details TPLM Core Net Core Acreage ~79,000 Percent Operated (%)(3) 64% Percent Held By Production (%) 89% Operated DSUs(4) 62 Gross Operated Locations Remaining(3) 611 TPLM Acreage TPLM Operated DSU 2 Little Muddy Wells Avg. EUR: ~705Mboe 2 Wisness Wells Avg. EUR: ~790Mboe 4 Hagen Wells Avg. EUR: ~640Mboe 4 Nygaard Wells Avg. EUR: ~550Mboe Eckert Three Forks Well EUR: ~530Mboe ESP Installation Slick Water Frac Three Forks Downspace White Sand Proppant TUSA DSUs 1/31/2015 TUSA Core Acreage Britt/Simpson units |
|
|
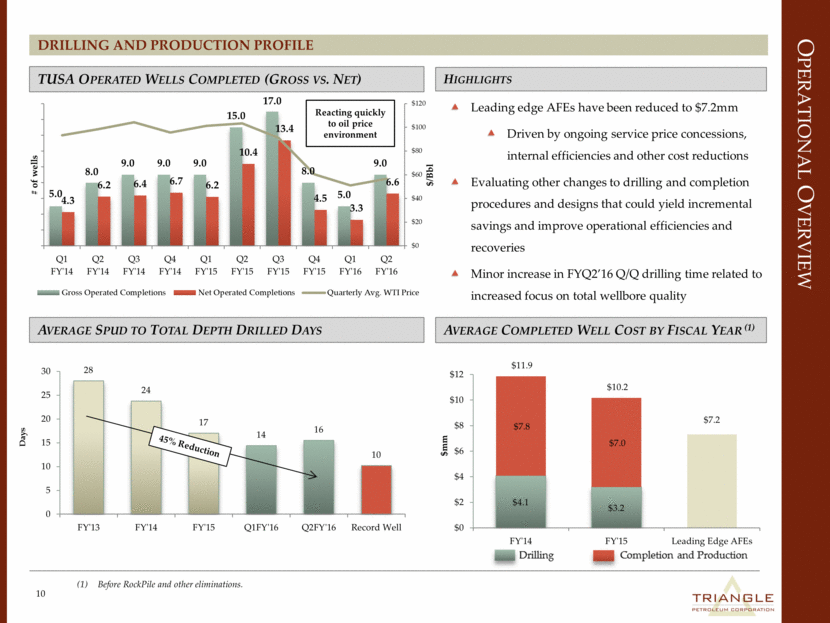
Operational Overview Drilling and Production Profile 10 Before RockPile and other eliminations. TUSA Operated Wells Completed (Gross vs. Net) Average Completed Well Cost by Fiscal Year (1) Leading edge AFEs have been reduced to $7.2mm Driven by ongoing service price concessions, internal efficiencies and other cost reductions Evaluating other changes to drilling and completion procedures and designs that could yield incremental savings and improve operational efficiencies and recoveries Minor increase in FYQ2’16 Q/Q drilling time related to increased focus on total wellbore quality Highlights Average Spud to Total Depth Drilled Days 45% Reduction Reacting quickly to oil price environment $/Bbl $4.1 $3.2 $7.8 $7.0 $11.9 $10.2 $7.2 $0 $2 $4 $6 $8 $10 $12 FY'14 FY'15 Leading Edge AFEs $mm 28 24 17 14 16 10 0 5 10 15 20 25 30 FY'13 FY'14 FY'15 Q1FY'16 Q2FY'16 Record Well Days 5.0 8.0 9.0 9.0 9.0 15.0 17.0 8.0 5.0 9.0 4.3 6.2 6.4 6.7 6.2 10.4 13.4 4.5 3.3 6.6 $0 $20 $40 $60 $80 $100 $120 0 2 4 6 8 10 12 14 16 18 Q1 FY'14 Q2 FY'14 Q3 FY'14 Q4 FY'14 Q1 FY'15 Q2 FY'15 Q3 FY'15 Q4 FY'15 Q1 FY'16 Q2 FY'16 # of wells Gross Operated Completions Net Operated Completions Quarterly Avg. WTI Price |
|
|
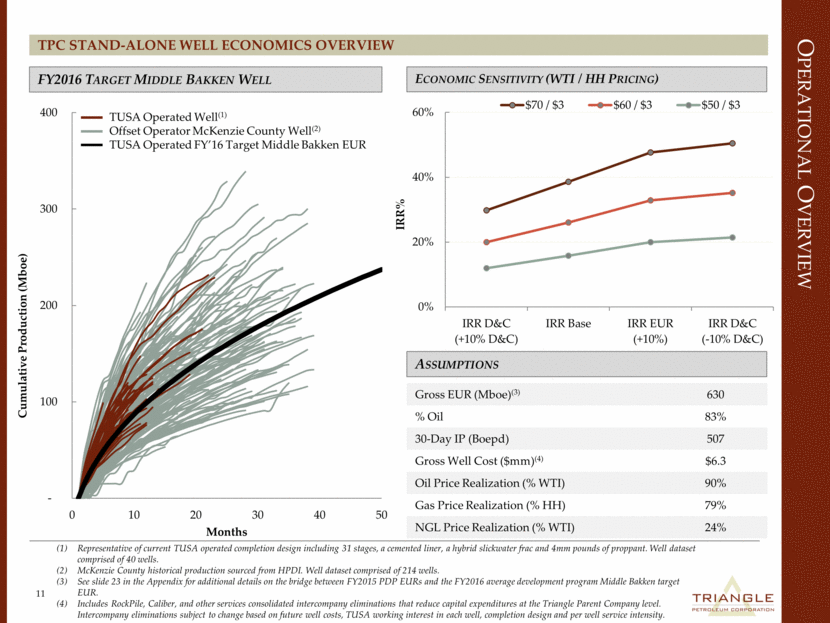
Operational Overview TPC Stand-alone Well Economics Overview 11 Representative of current TUSA operated completion design including 31 stages, a cemented liner, a hybrid slickwater frac and 4mm pounds of proppant. Well dataset comprised of 40 wells. McKenzie County historical production sourced from HPDI. Well dataset comprised of 214 wells. See slide 23 in the Appendix for additional details on the bridge between FY2015 PDP EURs and the FY2016 average development program Middle Bakken target EUR. Includes RockPile, Caliber, and other services consolidated intercompany eliminations that reduce capital expenditures at the Triangle Parent Company level. Intercompany eliminations subject to change based on future well costs, TUSA working interest in each well, completion design and per well service intensity. FY2016 Target Middle Bakken Well Assumptions Economic Sensitivity (WTI / HH Pricing) Gross EUR (Mboe)(3) 630 % Oil 83% 30-Day IP (Boepd) 507 Gross Well Cost ($mm)(4) $6.3 Oil Price Realization (% WTI) 90% Gas Price Realization (% HH) 79% NGL Price Realization (% WTI) 24% TUSA Operated Well(1) Offset Operator McKenzie County Well(2) TUSA Operated FY’16 Target Middle Bakken EUR - 100 200 300 400 0 10 20 30 40 50 Cumulative Production (Mboe) Months 0% 20% 40% 60% IRR D&C (-10% D&C) IRR EUR (+10%) IRR Base IRR D&C (+10% D&C) IRR% $70 / $3 $60 / $3 $50 / $3 |
|
|
ROCKPILE ENERGY SERVICES RockPile Energy Services, LLC is focused on providing “Best in Class” pressure pumping and ancillary services in the Williston Basin LEVERAGING REPUTATION & MAINTAINING FOCUS GROSS WELLS COMPLETED “Best in Class” execution driving critical volume with existing clients, opening up access to new clients and creating opportunities for geographic diversification Triangle Wells 3rd Party Wells Horsepower 50 >80% of work performed for third parties during 45 FY Q2’16 vs. ~56% in FY Q2’15 40 35 110 100 90 80 70 Q2 FY’16 was a record in terms of the number of stages completed, which was up 2% Q/Q Continued focus on cost reduction is yielding 30 25 20 15 1 4 5 10 19 10 19 26 37 16 17 15 17 50 39 60 50 40 30 20 significant results and RockPile’s costs are on par or5 1 5 6 5 8 09 9 9 8 5 9 10 0 superior to most of our major competitors Q2 Q3 Q4 Q1 Q2 Q3 Q4 Q1 Q2 Q3 Q4 Q1 Q2 However, intense competitive pressure has resulted in unsustainable pricing. And while major input costs have fallen significantly, these reductions have not kept pace with pricing and design changes so margins are still compressed The near term Williston Basin completion services market outlook remains challenging but leading edge indicators with clients have begun to improve FY 13 FY 13 FY 13 FY 14 FY 14 FY 14 FY 14 FY 15 FY 15 FY 15 FY 15 FY 16 FY 16 Simultaneous operations – 1) drilling operations, 2) Caliber piping freshwater provisions, 3) Workover rigs returning 2 wells to production and 4) operational production facilities 12 |
|
|
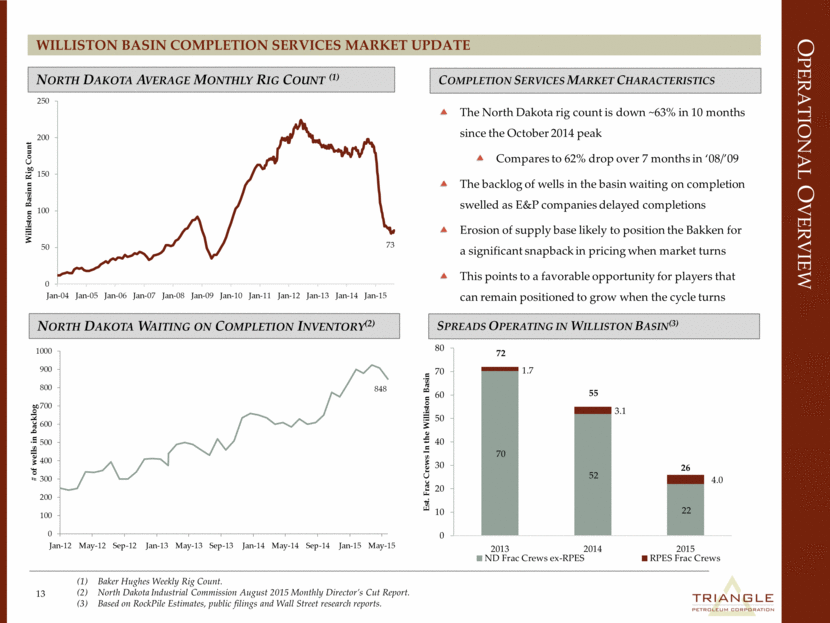
Operational Overview WILLISTON BASIN COMPLETION Services MARKET UPDATE 13 Baker Hughes Weekly Rig Count. North Dakota Industrial Commission August 2015 Monthly Director’s Cut Report. Based on RockPile Estimates, public filings and Wall Street research reports. North Dakota Average Monthly Rig Count (1) North Dakota Waiting on Completion Inventory(2) 9 The North Dakota rig count is down ~63% in 10 months since the October 2014 peak Compares to 62% drop over 7 months in ‘08/’09 The backlog of wells in the basin waiting on completion swelled as E&P companies delayed completions Erosion of supply base likely to position the Bakken for a significant snapback in pricing when market turns This points to a favorable opportunity for players that can remain positioned to grow when the cycle turns Spreads Operating in Williston Basin(3) Completion Services Market Characteristics 70 52 22 1.7 3.1 4.0 72 55 26 0 10 20 30 40 50 60 70 80 2013 2014 2015 Est. Frac Crews In the Williston Basin ND Frac Crews ex-RPES RPES Frac Crews 848 0 100 200 300 400 500 600 700 800 900 1000 Jan-12 May-12 Sep-12 Jan-13 May-13 Sep-13 Jan-14 May-14 Sep-14 Jan-15 May-15 # of wells in backlog 73 0 50 100 150 200 250 Jan-04 Jan-05 Jan-06 Jan-07 Jan-08 Jan-09 Jan-10 Jan-11 Jan-12 Jan-13 Jan-14 Jan-15 Williston Basinn Rig Count |
|
|
Operational Overview RockPile Maintaining utilization and gaining market share through downturn 14 RockPile Estimates. North Dakota Industrial Commission and RockPile Estimates. Market share based on trailing 3-month averages and subject to change based on future utilization. Average wells per spread based on estimated wells completed / estimated spreads working in the Williston Basin. RockPile Stages Completed Per Month RockPile’s Share of North Dakota Completions(2) 9 Completed 1,811 stages in FYQ2’15, 2% more stages than previous quarterly record RockPile’s estimated share of completion activity has increased to ~16% over the last three months, up from ~6% in calendar year 2014 Looking at market share from another perspective, RockPile has ~15% of the completion spreads that are currently active in the Williston Basin(1) Stimulation Spread Efficiency(3) Highlights 4% 5% 5% 5% 5% 6% 5% 6% 6% 10% 10% 13% 14% 13% 14% 11% 16% 0% 2% 4% 6% 8% 10% 12% 14% 16% 18% 0 50 100 150 200 250 300 Feb-14 Apr-14 Jun-14 Aug-14 Oct-14 Dec-14 Feb-15 Apr-15 Jun-15 RPES Share of Well Competions North Dakota Wells Completed RPES ND Other ND RPES ND Market Share (L3 Mos Avg) 29 41 48 2% 6% 15% 0 10 20 30 40 50 60 0% 2% 4% 6% 8% 10% 12% 14% 16% 2013 2014 2015 ND Avg Wells Completed Per Spread RPES Share of ND Frac Market Avg Wells per Spread RPES Mkt Share 0 100 200 300 400 500 600 700 800 Jul-12 Nov-12 Mar-13 Jul-13 Nov-13 Mar-14 Jul-14 Nov-14 Mar-15 Jul-15 RPES Stages Completed |
|
|
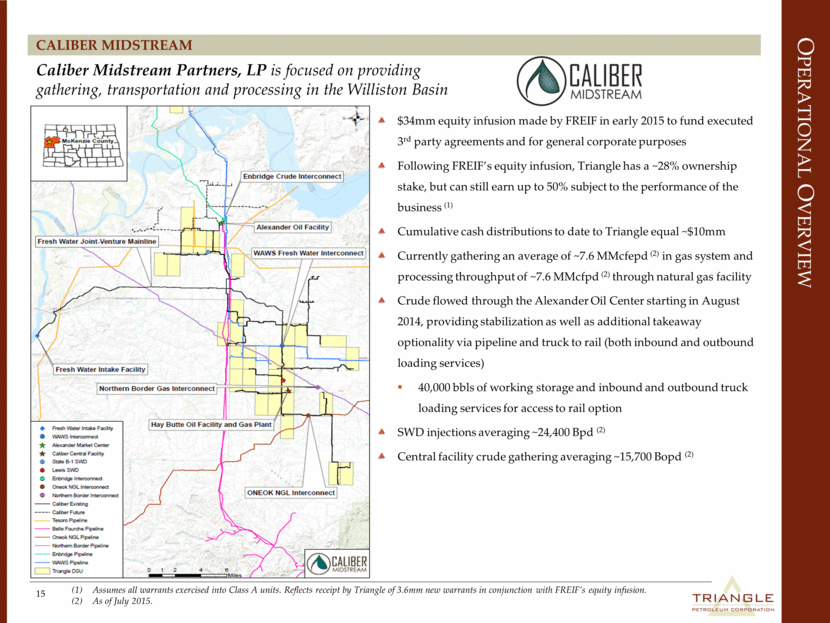
Operational Overview Caliber Midstream 15 Assumes all warrants exercised into Class A units. Reflects receipt by Triangle of 3.6mm new warrants in conjunction with FREIF’s equity infusion. As of July 2015. Caliber Midstream Partners, LP is focused on providing gathering, transportation and processing in the Williston Basin $34mm equity infusion made by FREIF in early 2015 to fund executed 3rd party agreements and for general corporate purposes Following FREIF’s equity infusion, Triangle has a ~28% ownership stake, but can still earn up to 50% subject to the performance of the business (1) Cumulative cash distributions to date to Triangle equal ~$10mm Currently gathering an average of ~7.6 MMcfepd (2) in gas system and processing throughput of ~7.6 MMcfpd (2) through natural gas facility Crude flowed through the Alexander Oil Center starting in August 2014, providing stabilization as well as additional takeaway optionality via pipeline and truck to rail (both inbound and outbound loading services) 40,000 bbls of working storage and inbound and outbound truck loading services for access to rail option SWD injections averaging ~24,400 Bpd (2) Central facility crude gathering averaging ~15,700 Bopd (2) |
|
|
Financial Overview |
|
|
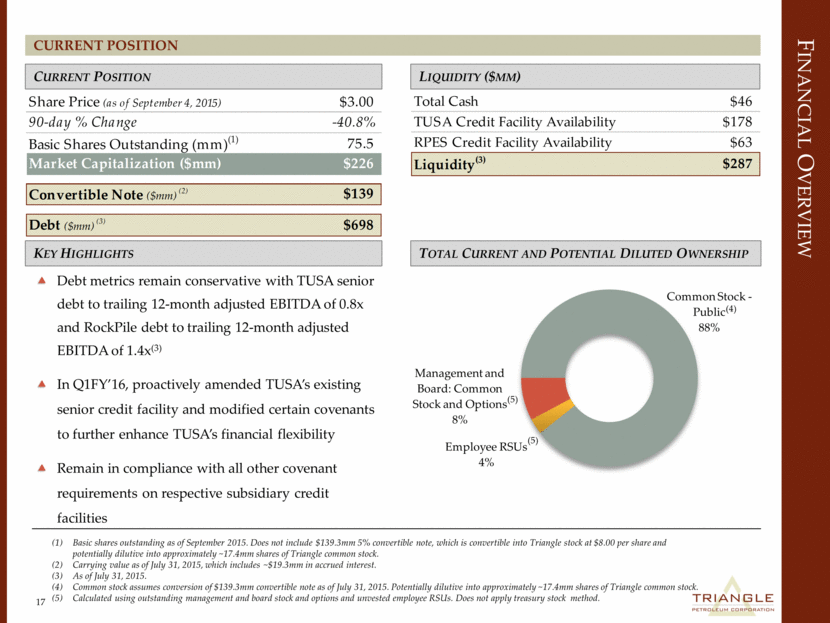
Financial Overview Current Position 17 Basic shares outstanding as of September 2015. Does not include $139.3mm 5% convertible note, which is convertible into Triangle stock at $8.00 per share and potentially dilutive into approximately ~17.4mm shares of Triangle common stock. Carrying value as of July 31, 2015, which includes ~$19.3mm in accrued interest. As of July 31, 2015. Common stock assumes conversion of $139.3mm convertible note as of July 31, 2015. Potentially dilutive into approximately ~17.4mm shares of Triangle common stock. Calculated using outstanding management and board stock and options and unvested employee RSUs. Does not apply treasury stock method. Liquidity ($mm) Total Current and Potential Diluted Ownership Key Highlights Debt metrics remain conservative with TUSA senior debt to trailing 12-month adjusted EBITDA of 0.8x and RockPile debt to trailing 12-month adjusted EBITDA of 1.4x(3) In Q1FY’16, proactively amended TUSA’s existing senior credit facility and modified certain covenants to further enhance TUSA’s financial flexibility Remain in compliance with all other covenant requirements on respective subsidiary credit facilities (4) (5) (5) Current Position Common Stock - Public 88% Employee RSUs 4% Management and Board: Common Stock and Options 8% Total Cash $46 TUSA Credit Facility Availability $178 RPES Credit Facility Availability $63 Liquidity (3) $287 Share Price (as of September 4, 2015) $3.00 90-day % Change -40.8% Basic Shares Outstanding (mm) (1) 75.5 Market Capitalization ($mm) $226 Convertible Note ($mm) (2) $139 Debt ($mm) (3) $698 |
|
|
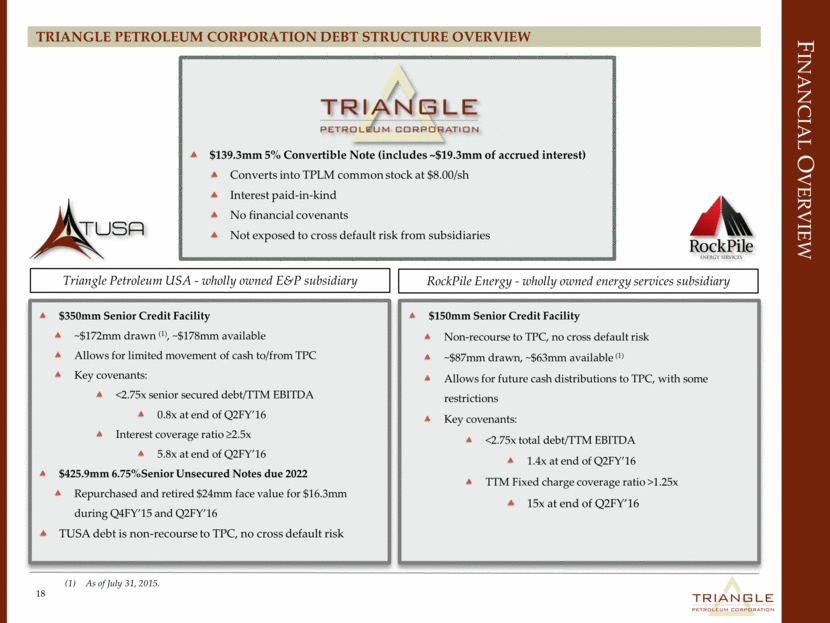
$150mm Senior Credit Facility Non-recourse to TPC, no cross default risk ~$87mm drawn, ~$63mm available (1) Allows for future cash distributions to TPC, with some restrictions Key covenants: <2.75x total debt/TTM EBITDA 1.4x at end of Q2FY’16 TTM Fixed charge coverage ratio >1.25x 15x at end of Q2FY’16 $139.3mm 5% Convertible Note (includes ~$19.3mm of accrued interest) Converts into TPLM common stock at $8.00/sh Interest paid-in-kind No financial covenants Not exposed to cross default risk from subsidiaries RockPile Energy - wholly owned energy services subsidiary Triangle Petroleum USA - wholly owned E&P subsidiary Financial Overview Triangle Petroleum Corporation debt structure OVERVIEW 18 $350mm Senior Credit Facility ~$172mm drawn (1), ~$178mm available Allows for limited movement of cash to/from TPC Key covenants: <2.75x senior secured debt/TTM EBITDA 0.8x at end of Q2FY’16 Interest coverage ratio >2.5x 5.8x at end of Q2FY’16 $425.9mm 6.75%Senior Unsecured Notes due 2022 Repurchased and retired $24mm face value for $16.3mm during Q4FY’15 and Q2FY’16 TUSA debt is non-recourse to TPC, no cross default risk As of July 31, 2015. |
|
|
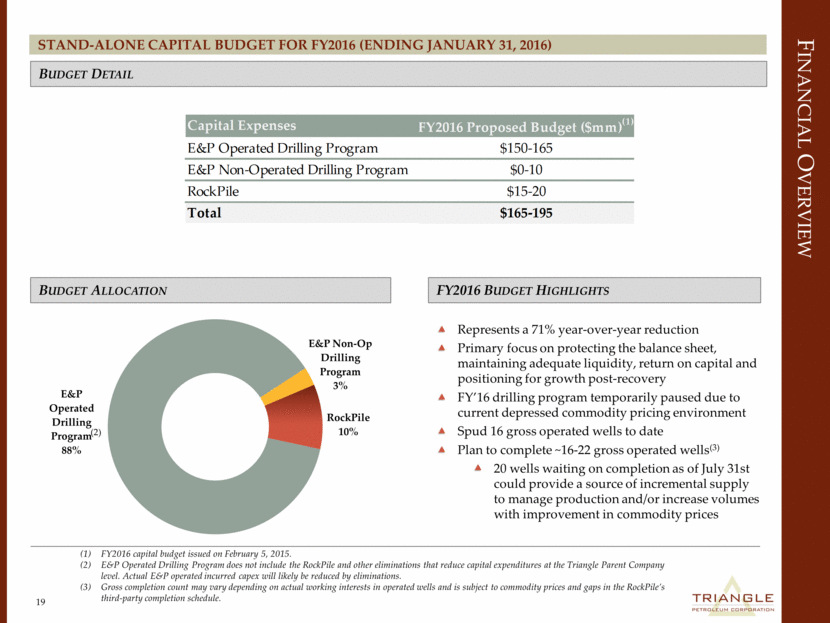
Financial Overview Stand-alone Capital Budget for FY2016 (ending January 31, 2016) 19 FY2016 capital budget issued on February 5, 2015. E&P Operated Drilling Program does not include the RockPile and other eliminations that reduce capital expenditures at the Triangle Parent Company level. Actual E&P operated incurred capex will likely be reduced by eliminations. Gross completion count may vary depending on actual working interests in operated wells and is subject to commodity prices and gaps in the RockPile’s third-party completion schedule. Budget Detail FY2016 Budget Highlights Represents a 71% year-over-year reduction Primary focus on protecting the balance sheet, maintaining adequate liquidity, return on capital and positioning for growth post-recovery FY’16 drilling program temporarily paused due to current depressed commodity pricing environment Spud 16 gross operated wells to date Plan to complete ~16-22 gross operated wells(3) 20 wells waiting on completion as of July 31st could provide a source of incremental supply to manage production and/or increase volumes with improvement in commodity prices Budget Allocation (2) Capital Expenses FY2016 Proposed Budget ($mm) (1) E&P Operated Drilling Program $150-165 E&P Non-Operated Drilling Program $0-10 RockPile $15-20 Total $165-195 E&P Operated Drilling Program 88% E&P Non - Op Drilling Program 3% RockPile 10% |
|
|
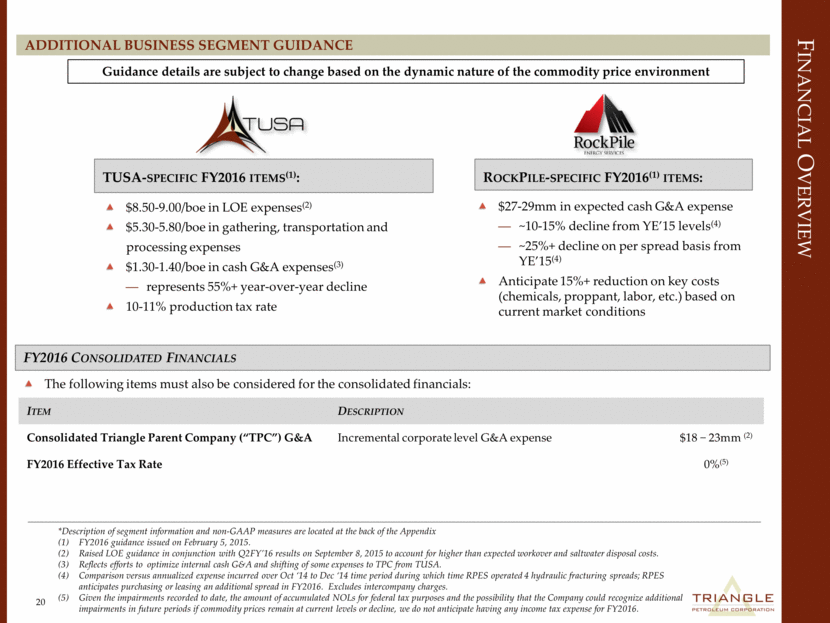
Financial Overview additional Business Segment Guidance 20 *Description of segment information and non-GAAP measures are located at the back of the Appendix FY2016 guidance issued on February 5, 2015. Raised LOE guidance in conjunction with Q2FY’16 results on September 8, 2015 to account for higher than expected workover and saltwater disposal costs. Reflects efforts to optimize internal cash G&A and shifting of some expenses to TPC from TUSA. Comparison versus annualized expense incurred over Oct ‘14 to Dec ‘14 time period during which time RPES operated 4 hydraulic fracturing spreads; RPES anticipates purchasing or leasing an additional spread in FY2016. Excludes intercompany charges. Given the impairments recorded to date, the amount of accumulated NOLs for federal tax purposes and the possibility that the Company could recognize additional impairments in future periods if commodity prices remain at current levels or decline, we do not anticipate having any income tax expense for FY2016. FY2016 Consolidated Financials The following items must also be considered for the consolidated financials: Item Description Consolidated Triangle Parent Company (“TPC”) G&A Incremental corporate level G&A expense $18 - 23mm (2) FY2016 Effective Tax Rate 0%(5) TUSA-specific FY2016 items(1): RockPile-specific FY2016(1) items: $8.50-9.00/boe in LOE expenses(2) $5.30-5.80/boe in gathering, transportation and processing expenses $1.30-1.40/boe in cash G&A expenses(3) represents 55%+ year-over-year decline 10-11% production tax rate $27-29mm in expected cash G&A expense ~10-15% decline from YE’15 levels(4) ~25%+ decline on per spread basis from YE’15(4) Anticipate 15%+ reduction on key costs (chemicals, proppant, labor, etc.) based on current market conditions Guidance details are subject to change based on the dynamic nature of the commodity price environment |
|
|
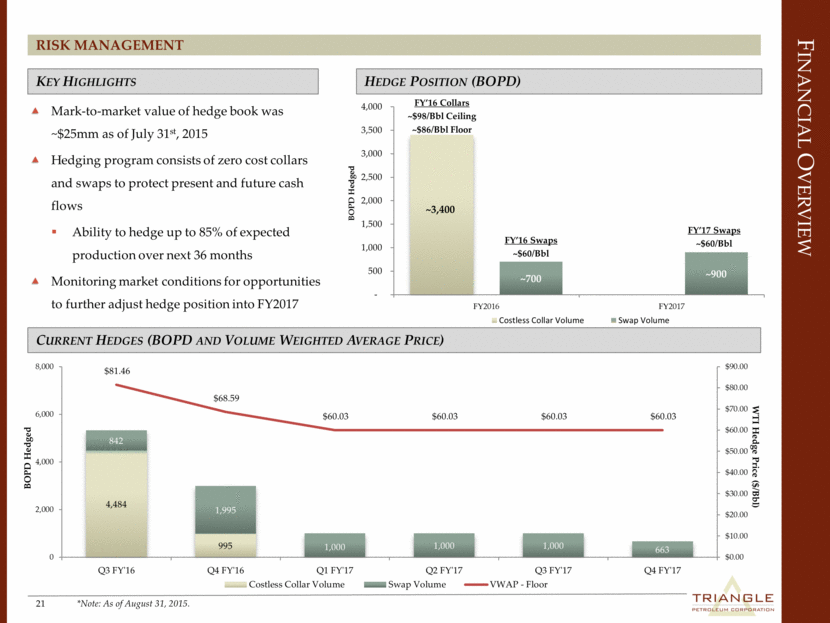
Risk Management 21 Mark-to-market value of hedge book was ~$25mm as of July 31st, 2015 Hedging program consists of zero cost collars and swaps to protect present and future cash flows Ability to hedge up to 85% of expected production over next 36 months Monitoring market conditions for opportunities to further adjust hedge position into FY2017 Financial Overview Hedge Position (BOPD) Current Hedges (BOPD and Volume Weighted Average Price) Key Highlights *Note: As of August 31, 2015. FY’16 Collars ~$98/Bbl Ceiling ~$86/Bbl Floor FY’16 Swaps ~$60/Bbl FY’17 Swaps ~$60/Bbl BOPD Hedged BOPD Hedged WTI Hedge Price ($/Bbl) ~3,400 ~700 ~900 - 500 1,000 1,500 2,000 2,500 3,000 3,500 4,000 FY2016 FY2017 Costless Collar Volume Swap Volume 4,484 995 842 1,995 1,000 1,000 1,000 663 $81.46 $68.59 $60.03 $60.03 $60.03 $60.03 $0.00 $10.00 $20.00 $30.00 $40.00 $50.00 $60.00 $70.00 $80.00 $90.00 0 2,000 4,000 6,000 8,000 Q3 FY'16 Q4 FY'16 Q1 FY'17 Q2 FY'17 Q3 FY'17 Q4 FY'17 Costless Collar Volume Swap Volume VWAP - Floor |
|
|
Appendix TUSA FY2016 EUR Bridge Historical Financials Reconciliations and Segment Information |
|
|
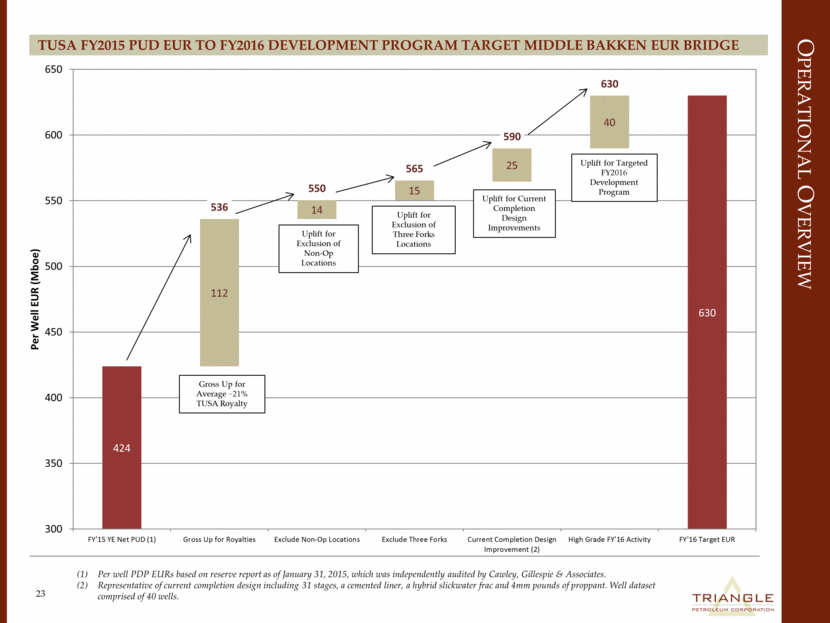
Operational Overview TUSA FY2015 PUD EUR to FY2016 DEVELOPMENT PROGRAM TARGET MIDDLE BAKKEN EUR Bridge 23 Per well PDP EURs based on reserve report as of January 31, 2015, which was independently audited by Cawley, Gillespie & Associates. Representative of current completion design including 31 stages, a cemented liner, a hybrid slickwater frac and 4mm pounds of proppant. Well dataset comprised of 40 wells. Uplift for Exclusion of Non-Op Locations Gross Up for Average ~21% TUSA Royalty Uplift for Current Completion Design Improvements Uplift for Targeted FY2016 Development Program Uplift for Exclusion of Three Forks Locations 424 630 112 14 15 25 40 536 550 565 590 630 300 350 400 450 500 550 600 650 FY'15 YE Net PUD (1) Gross Up for Royalties Exclude Non-Op Locations Exclude Three Forks Current Completion Design Improvement (2) High Grade FY'16 Activity FY'16 Target EUR Per Well EUR (Mboe) |
|
|
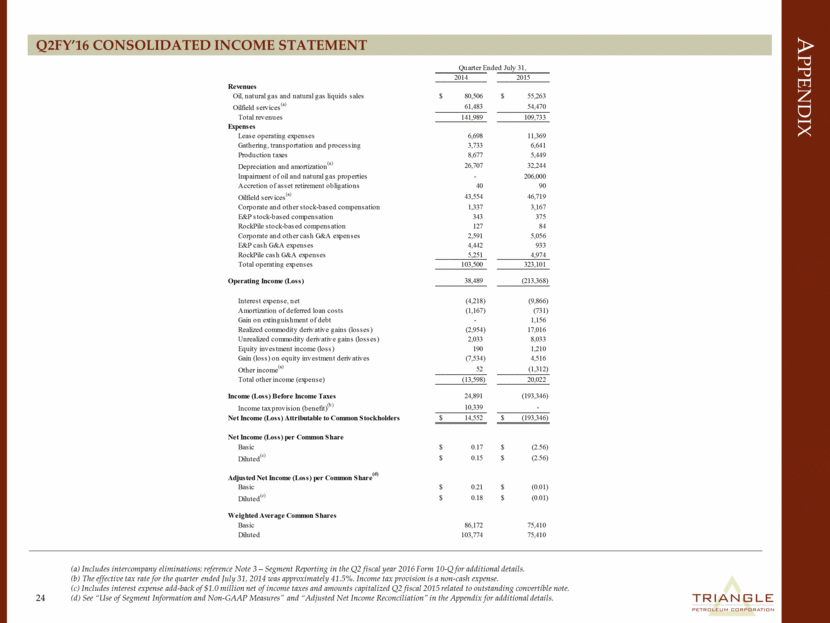
Appendix Q2FY’16 Consolidated Income Statement 24 (a) Includes intercompany eliminations; reference Note 3 – Segment Reporting in the Q2 fiscal year 2016 Form 10-Q for additional details. (b) The effective tax rate for the quarter ended July 31, 2014 was approximately 41.5%. Income tax provision is a non-cash expense. (c) Includes interest expense add-back of $1.0 million net of income taxes and amounts capitalized Q2 fiscal 2015 related to outstanding convertible note. (d) See “Use of Segment Information and Non-GAAP Measures” and “Adjusted Net Income Reconciliation” in the Appendix for additional details. Quarter Ended July 31, Quarter Ended April 30, 2014 2015 Revenues Oil, natural gas and natural gas liquids sales 80,506 $ 55,263 $ Oilfield services (a) 61,483 54,470 Total revenues 141,989 109,733 Expenses Lease operating expenses 6,698 11,369 Gathering, transportation and processing 3,733 6,641 Production taxes 8,677 5,449 Depreciation and amortization (a) 26,707 32,244 Impairment of oil and natural gas properties - 206,000 Accretion of asset retirement obligations 40 90 Oilfield services (a) 43,554 46,719 Corporate and other stock-based compensation 1,337 3,167 E&P stock-based compensation 343 375 RockPile stock-based compensation 127 84 Corporate and other cash G&A expenses 2,591 5,056 E&P cash G&A expenses 4,442 933 RockPile cash G&A expenses 5,251 4,974 Total operating expenses 103,500 323,101 Operating Income (Loss) 38,489 (213,368) Interest expense, net (4,218) (9,866) Amortization of deferred loan costs (1,167) (731) Gain on extinguishment of debt - 1,156 Realized commodity derivative gains (losses) (2,954) 17,016 Unrealized commodity derivative gains (losses) 2,033 8,033 Equity investment income (loss) 190 1,210 Gain (loss) on equity investment derivatives (7,534) 4,516 Other income (a) 52 (1,312) Total other income (expense) (13,598) 20,022 Income (Loss) Before Income Taxes 24,891 (193,346) Income tax provision (benefit) (b) 10,339 - Net Income (Loss) Attributable to Common Stockholders 14,552 $ (193,346) $ Net Income (Loss) per Common Share Basic 0.17 $ (2.56) $ Diluted (c) 0.15 $ (2.56) $ Adjusted Net Income (Loss) per Common Share (d) Basic 0.21 $ (0.01) $ Diluted (c) 0.18 $ (0.01) $ Weighted Average Common Shares Basic 86,172 75,410 Diluted 103,774 75,410 |
|
|
Appendix Consolidated Adjusted Net Income Reconciliation Stand-Alone Business Segment Adjusted EBITDA Reconciliation 25 (a) Tax adjustment is calculated by applying Company's effective tax rate of 41.5% for Q2 fiscal 2015 to pre-tax effected adjusting items. (b) Includes interest expense add-back of $1.0 million net of income taxes and amounts capitalized for Q2 fiscal 2015 related to outstanding convertible note. (c) RockPile Adjusted EBITDA calculated as per RockPile credit facility. Quarter Ended July 31, Quarter Ended April 30, 2014 2015 Net Income (Loss) Attributable to Common Stockholders $ 14,552 $ (193,346) Impairment of oil and natural gas properties - 206,000 Unrealized (gain) loss on commodity derivatives (2,033) (8,033) (Gain) loss on equity investment derivatives 7,534 (4,516) Gain on extinguishment of debt - (1,156) Tax adjustment (a) (2,285) - Adjusted Net Income (Loss) 17,768 $ (1,051) $ Adjusted Net Income (Loss) Per Common Share Basic 0.21 $ (0.01) $ Diluted (b) 0.18 $ (0.01) $ Weighted Average Common Shares Basic 86,172 75,410 Diluted 103,774 75,410 Quarter Ended July 31, Quarter Ended April 30, 2014 2015 Net Income (Loss) Before Income Taxes 26,019 $ (181,831) $ Depreciation and amortization 26,287 24,527 Impairment of oil and natural gas properties - 206,000 Net interest expense 2,279 7,289 Stock-based compensation 343 375 Accretion of asset retirement obligations 40 90 Other 1,072 (530) Unrealized commodity derivative losses (gains) (2,033) (8,033) Adjusted-EBITDA 54,007 $ 47,887 $ Quarter Ended July 31, Quarter Ended April 30, 2014 2015 Net Income (Loss) Before Income Taxes 22,453 $ (1,543) $ Depreciation and amortization 4,690 8,718 Stock-based compensation 127 84 Net interest expense 564 754 Other 930 (76) Adjusted-EBITDA (c) 28,764 $ 7,937 $ |
|
|
Appendix Q2FY’16 Intersegment Table 26 (a) Corporate and Other includes Triangle's corporate office and several subsidiaries that management does not consider to be part of the exploration and production or oilfield services segments. Also included are results from Triangle's investment in Caliber, including any changes in the fair value of equity investment derivatives. Other than Caliber, these subsidiaries have limited activity. (b) $5.7 million RockPile, Caliber, and other services consolidated elimination results in a $5.7 million reduction in oil and natural gas property expenditures. *Reference Note 3 – Segment Reporting in our Q2 fiscal year 2016 Form 10-Q for additional details. Exploration and Production Oilfield Services Corporate and Other (a) Eliminations and Other Consolidated Total Revenues Oil, natural gas and natural gas liquids sales $ 55,263 $ - $ - $ - $ 55,263 Oilfield services for third parties - 54,830 - (360) 54,470 Intersegment revenues - 14,601 - (14,601) - Total Revenues 55,263 69,431 - (14,961) 109,733 Expenses LOE, GTP, Production Taxes and other expenses 23,459 - - - 23,459 Depreciation and amortization 24,617 8,718 407 (1,408) 32,334 Impairment of oil and natural gas properties 206,000 - - - 206,000 Cost of oilfield services - 56,353 (1,238) (8,396) 46,719 General and administrative 1,308 5,058 8,223 - 14,589 Total operating expenses 255,384 70,129 7,392 (9,804) 323,101 Operating Income (200,121) (698) (7,392) (5,157) (213,368) Other income (expense), net 18,290 (845) 3,116 (539) 20,022 Net Income (Loss) Before Income Taxes $ (181,831) $ (1,543) $ (4,276) $ (5,696) (b) $ (193,346) |
|
|
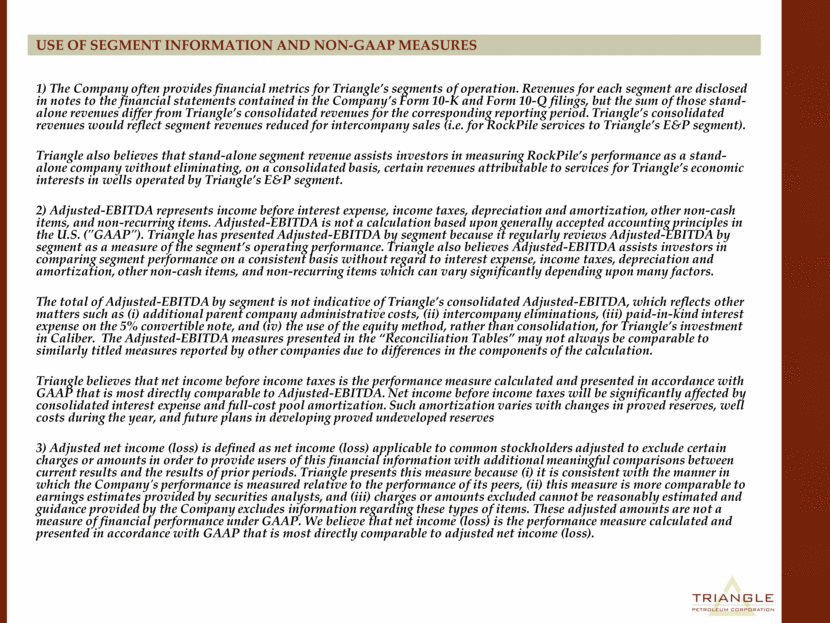
Use of Segment Information and Non-GAAP Measures 1) The Company often provides financial metrics for Triangle’s segments of operation. Revenues for each segment are disclosed in notes to the financial statements contained in the Company’s Form 10-K and Form 10-Q filings, but the sum of those stand-alone revenues differ from Triangle’s consolidated revenues for the corresponding reporting period. Triangle’s consolidated revenues would reflect segment revenues reduced for intercompany sales (i.e. for RockPile services to Triangle’s E&P segment). Triangle also believes that stand-alone segment revenue assists investors in measuring RockPile’s performance as a stand-alone company without eliminating, on a consolidated basis, certain revenues attributable to services for Triangle’s economic interests in wells operated by Triangle’s E&P segment. 2) Adjusted-EBITDA represents income before interest expense, income taxes, depreciation and amortization, other non-cash items, and non-recurring items. Adjusted-EBITDA is not a calculation based upon generally accepted accounting principles in the U.S. ("GAAP"). Triangle has presented Adjusted-EBITDA by segment because it regularly reviews Adjusted-EBITDA by segment as a measure of the segment’s operating performance. Triangle also believes Adjusted-EBITDA assists investors in comparing segment performance on a consistent basis without regard to interest expense, income taxes, depreciation and amortization, other non-cash items, and non-recurring items which can vary significantly depending upon many factors. The total of Adjusted-EBITDA by segment is not indicative of Triangle’s consolidated Adjusted-EBITDA, which reflects other matters such as (i) additional parent company administrative costs, (ii) intercompany eliminations, (iii) paid-in-kind interest expense on the 5% convertible note, and (iv) the use of the equity method, rather than consolidation, for Triangle’s investment in Caliber. The Adjusted-EBITDA measures presented in the “Reconciliation Tables” may not always be comparable to similarly titled measures reported by other companies due to differences in the components of the calculation. Triangle believes that net income before income taxes is the performance measure calculated and presented in accordance with GAAP that is most directly comparable to Adjusted-EBITDA. Net income before income taxes will be significantly affected by consolidated interest expense and full-cost pool amortization. Such amortization varies with changes in proved reserves, well costs during the year, and future plans in developing proved undeveloped reserves 3) Adjusted net income (loss) is defined as net income (loss) applicable to common stockholders adjusted to exclude certain charges or amounts in order to provide users of this financial information with additional meaningful comparisons between current results and the results of prior periods. Triangle presents this measure because (i) it is consistent with the manner in which the Company's performance is measured relative to the performance of its peers, (ii) this measure is more comparable to earnings estimates provided by securities analysts, and (iii) charges or amounts excluded cannot be reasonably estimated and guidance provided by the Company excludes information regarding these types of items. These adjusted amounts are not a measure of financial performance under GAAP. We believe that net income (loss) is the performance measure calculated and presented in accordance with GAAP that is most directly comparable to adjusted net income (loss). |
Serious News for Serious Traders! Try StreetInsider.com Premium Free!
You May Also Be Interested In
- Green Technology and Sustainability Market Propelled by Environmental Concerns and Imperative for Sustainable Development
- Connected Toys Market is to Soar USD 41.5 billion by 2031, Propelled by Growing Demand for Interactive and Educational Toys
- Labor & Employment Partner Lisa Patmore Joins Dorsey in London
Create E-mail Alert Related Categories
SEC FilingsSign up for StreetInsider Free!
Receive full access to all new and archived articles, unlimited portfolio tracking, e-mail alerts, custom newswires and RSS feeds - and more!


 Tweet
Tweet Share
Share
