

Form 8-K TRANSCAT INC For: Oct 26
 Tweet
Tweet Share
ShareUNITED STATES
SECURITIES AND EXCHANGE
COMMISSION
Washington, D.C. 20549
FORM 8-K
CURRENT REPORT
Pursuant to Section 13 or 15(d)
of the Securities Exchange Act of 1934
| Date of Report (Date of earliest event reported) | October 26, 2015 |
| Transcat, Inc. |
| (Exact name of registrant as specified in its charter) |
| Ohio | 000-03905 | 16-0874418 |
| (State or other jurisdiction | (Commission | (IRS Employer |
| of incorporation) | File Number) | Identification No.) |
| 35 Vantage Point Drive, Rochester, New York | 14624 |
| (Address of principal executive offices) | (Zip Code) |
| Registrant's telephone number, including area code | 585-352-7777 |
| (Former name or former address, if changed since last report) |
Check the appropriate box below if the Form 8-K filing is intended to simultaneously satisfy the filing obligation of the registrant under any of the following provisions:
[ ] Written communications pursuant to Rule 425 under the Securities Act (17 CFR 230.425)
[ ] Soliciting material pursuant to Rule 14a-12 under the Exchange Act (17 CFR 240.14a-12)
[ ] Pre-commencement communications pursuant to Rule 14d-2(b) under the Exchange Act (17 CFR 240.14d-2(b))
[ ] Pre-commencement communications pursuant to Rule 13e-4(c) under the Exchange Act (17 CFR 240.13e-4(c))
Item 2.02 Results of Operations and Financial Condition.
On October 26, 2015, Transcat, Inc. (the “Company”) issued a press release announcing its financial results for its fiscal year 2016 second quarter ended September 26, 2015. The press release is attached to this Form 8-K as Exhibit 99.1.
In addition, on October 27, 2015, the Company posted slides to the Investor Relations section of its website that will accompany the Company’s earnings conference call and webcast at 11:00 a.m. Eastern Time on October 27, 2015. The slides are attached to this Form 8-K as Exhibit 99.2.
The information furnished pursuant to this Item 2.02, including Exhibit 99.1 and Exhibit 99.2, shall not be deemed “filed” for purposes of Section 18 of the Securities Exchange Act of 1934, as amended (the “Exchange Act”) or otherwise subject to the liabilities under such section and shall not be deemed to be incorporated by reference into any filing of the Company under the Securities Act of 1933, as amended, or the Exchange Act.
Item 9.01 Financial Statements and Exhibits.
(d) Exhibits.
| Exhibit No. | Description | ||
| 99.1 | Transcat, Inc. Press Release dated October 26, 2015 | ||
| 99.2 | Slides for the October 27, 2015 Earnings Conference Call and Webcast |
SIGNATURES
Pursuant to the requirements of the Securities Exchange Act of 1934, the registrant has duly caused this report to be signed on its behalf by the undersigned hereunto duly authorized.
| TRANSCAT, INC. | |||
| Dated: | October 27, 2015 | By: | /s/ John J. Zimmer |
| John J. Zimmer | |||
| Senior Vice President of Finance and Chief Financial Officer |
Exhibit 99.1
|
NEWS RELEASE |
IMMEDIATE RELEASE
Transcat Reports Second Quarter Fiscal 2016 Results
| ● |
Realized strong operating leverage in Service segment: operating
income up 26.0% on 12.7% segment revenue growth |
| ● | Service segment revenue growth offset by
lower Distribution segment sales |
|
○Distribution sales impacted by oil &
gas industry
| |
| ● | Expanded life science market position in
Southern California with acquisition of Anmar Metrology,
Inc. |
| ● | Generated $5.3 million of cash from operations in year-to-date period |
ROCHESTER, NY, October 26, 2015 – Transcat, Inc. (NASDAQ: TRNS) (“Transcat” or the “Company”), a leading provider of accredited calibration and compliance services and distributor of professional grade handheld test, measurement and control instrumentation, today reported financial results for its second quarter ended September 26, 2015. Included in the reported results are those of five acquisitions over the last twelve months.
Lee D. Rudow, President and CEO, commented, “Our Service segment performed to plan in the quarter with double-digit revenue growth and operating margin expansion, demonstrating strong operating leverage for the segment. However, we experienced a significant downturn in our Distribution segment due to the decline in the oil & gas industry combined with the strength of the U.S. dollar. We remain focused on initiatives to improve the performance of our Distribution segment and expect to continue to grow sales and gain market share in our higher-margin Service segment, both organically and through acquisitions.”
Second Quarter Fiscal 2016 Review (Results are compared with the second quarter of fiscal 2015)
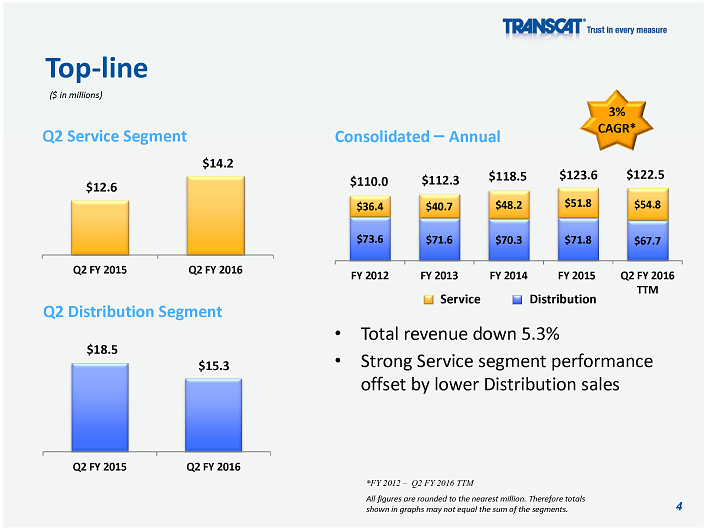
Second quarter consolidated revenue was $29.5 million, down $1.6 million, or 5.3%, over the prior-year period. Service segment revenue grew $1.6 million, or 12.7%, offset by a $3.2 million, or 17.4%, decline in Distribution segment sales.
Second quarter consolidated gross profit declined 2.7% to $6.7 million. As a percentage of total revenue, gross profit was 22.9%, an improvement of 60 basis points over the prior fiscal year period.
Second quarter consolidated operating income fell $0.1 million to $1.4 million. The year-over-year decline was driven by reduced volume in the Distribution segment, which was not fully offset by the operating leverage achieved on Service segment revenue growth. Net income was $0.9 million, a 2.2% increase over the prior-year period. Diluted earnings per share were $0.12, consistent with the prior-year period.
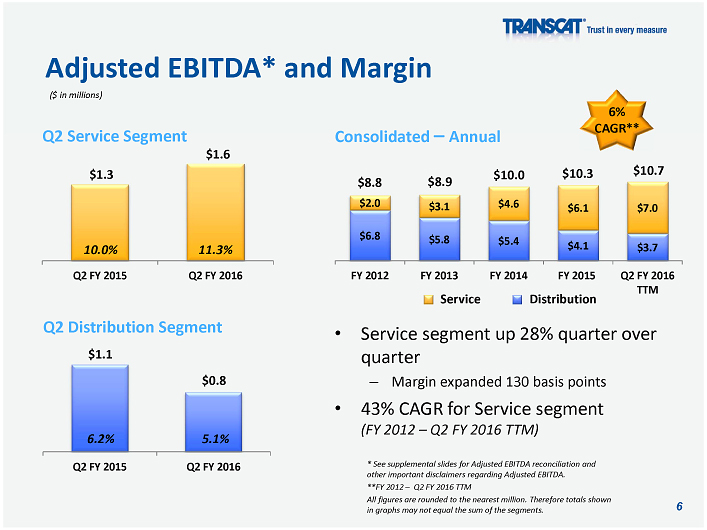
Adjusted EBITDA was $2.4 million, consistent with the second quarter of 2015. Adjusted EBITDA as a percent of total revenue improved 40 basis points to 8.1%. See Note 1 on page 4 for a description of this non-GAAP financial measure and page 9 for the Adjusted EBITDA Reconciliation table.
Transcat Reports Second
Quarter Fiscal 2016 Results
October 26, 2015
Page 2 of 11
Service segment revenue and operating margin expanded
The Service segment represents the Company’s accredited calibration and compliance services business (48% of total revenue for the second quarter of fiscal 2016)
| ● | Combined organic and acquisition-related
revenue growth drove the Service segment revenue increase of 12.7%, or
$1.6 million, to a record second quarter of $14.2 million. |
| ● | Service segment gross profit improved $0.2
million, or 5.8%, to $3.5 million. Gross margin for the segment was 24.4%,
down from 26.0% in the prior-year period. |
| ● | Operating income increased 26.0% to $0.8
million, and segment operating margin expanded 60 basis points to 5.9%.
Operating leverage in the quarter was 10.8%. Operating leverage is
defined as the year-over-year change in Service segment operating income
divided by the year-over-year change in Service segment revenue.
|
| ● | Service segment contribution margin grew 9.5% to $1.8 million from $1.7 million in the prior fiscal year period. Adjusted EBITDA increased 27.6%, or $0.3 million, to $1.6 million. As a percentage of Service segment revenue, Adjusted EBITDA was 11.3%, a 130 basis point improvement over the second quarter of 2015. See Note 1 on page 4 for descriptions of these non-GAAP financial measures and pages 9 and 10 for the Adjusted EBITDA Reconciliation table and the contribution margin calculation in the Additional Information – Business Segment Data table. |
Distribution segment sales declined; Gross margin improved with vendor rebates
The Distribution segment represents the Company’s distribution of professional grade handheld test, measurement and control instrumentation business (52% of total revenue for the second quarter of fiscal 2016)
| ● | Distribution sales declined $3.2 million, or
17.4%, to $15.3 million in the second quarter, primarily due to market
weakness in the oil & gas and related industries and weaker sales to
customers impacted by the strength of the U.S. dollar. |
| ● | Distribution segment gross profit was $3.3
million, down $0.4 million, or 10.3%. Gross margin was 21.4%, a 70 basis
point improvement from the prior-year period. Vendor rebates accounted for
190 basis points of segment gross margin in the quarter. |
| ● | Reduced Distribution segment operating costs
partially offset the year-over-year decline in segment gross profit,
resulting in segment operating income of $0.5 million, a decrease of $0.3
million from the second quarter of fiscal 2015. |
| ● | Contribution margin for the Distribution segment was $1.7 million, down $0.4 million from the prior-year period. Adjusted EBITDA was $0.8 million, down from $1.1 million in the second quarter of fiscal 2015. See Note 1 on page 4 for descriptions of these non-GAAP financial measures and pages 9 and 10 for the Adjusted EBITDA Reconciliation table and contribution margin calculation in the Additional Information – Business Segment Data table. |
Six-Month Review
Total revenue was $59.1 million for the first six months of fiscal 2016, a 1.8% decline from $60.2 million in the prior fiscal year period. Consolidated gross profit was $13.8 million, a $0.2 million improvement from the first half of fiscal 2015. Gross margin increased 70 basis points to 23.3%, primarily due to increased Distribution segment vendor rebates.
Transcat Reports Second
Quarter Fiscal 2016 Results
October 26, 2015
Page 3 of 11
Service Segment:
| ● |
Revenue for the first
half of fiscal 2016 increased 12.1% to $27.7 million, driven by organic
and acquisition-related growth. On a trailing twelve-month basis, Service
segment revenue was $54.8 million, an increase of 10.2% when compared with
the corresponding trailing twelve-month period of fiscal 2015. The Company
believes that trailing twelve-month data is more indicative of the
long-term progress of the Service segment. |
| ● |
Service segment gross margin was 25.2% in the first six months of fiscal 2016, consistent with the prior fiscal year period. On a trailing twelve-month basis, Service segment gross margin was 27.2%, an increase of 80 basis points when compared with the corresponding twelve-month period of fiscal 2015. |
Distribution Segment:
| ● |
Sales in the first half
of fiscal 2016 declined 11.5% to $31.4 million. |
| ● |
Year-to-date Distribution segment gross margin increased 90 basis points from the prior-year period. The improvement in gross margin was aided by increased vendor rebates, which accounted for 160 basis points of segment gross margin in the first six months of fiscal 2016. |
As a percentage of total revenue, consolidated operating expenses were 19.2%, up from 18.8% in the same period of fiscal 2015. Fiscal 2016 year-to-date operating income improved 5.4%, or $0.1 million, to $2.4 million. Net income was $1.5 million, or $0.21 per diluted share, in the first six months of fiscal 2016 compared with $1.3 million, or $0.18 per diluted share, in the prior fiscal year period.
Adjusted EBITDA was $4.4 million in the first six months of fiscal 2016 compared with $3.9 million for the same period in fiscal 2015, an increase of 11.6%. See Note 1 on page 4 for a description of this non-GAAP financial measure and page 9 for the Adjusted EBITDA Reconciliation table.
Strong Balance Sheet Supports Growth Strategy
As of September 26, 2015, the Company had $17.5 million in availability under its secured revolving credit facility.
Capital expenditures in the first six months of fiscal 2016 were $2.7 million, up from $1.8 million in the first six months of fiscal 2015, and were primarily for expanded Service segment capabilities and assets for the Company’s rental business. The Company expects total capital expenditures to be approximately $4.0 million in fiscal 2016.
Outlook
Mr. Rudow concluded, “We expect to continue to successfully execute our strategy for the Service segment and look for it to deliver double-digit top-line segment growth in fiscal 2016. Given the challenging market conditions in our Distribution segment, consolidated operating income growth for fiscal 2016 is now expected to be in the low double-digits.
“Looking beyond this fiscal year, we remain confident in the opportunities presented by our Service segment, both on the new business and acquisition front. With the recent acquisition of Anmar Metrology, we strengthened our presence in Southern California, which has a significant concentration of life sciences and aerospace companies, prime customers for our services. We are also optimistic that our new instrument rental service, enhanced web platform and the further leveraging of cross-sell opportunities between our two segments will drive improvements in the contribution from our Distribution segment, which generates strong cash flow. Long term, Transcat is in an excellent position to advance our market position as a leader in calibration and compliance services.”
Webcast and Conference Call
Transcat will host a conference call and webcast on Tuesday, October 27, 2015 at 11:00 a.m. ET. Management will review the financial and operating results for the quarter, as well as the Company’s strategy and outlook. A question and answer session will follow the formal discussion. The review will be accompanied by a slide presentation which will be available at www.transcat.com/investor-relations.
The conference call can be accessed by calling (201) 689-8471. Alternatively, the webcast can be monitored at www.transcat.com/investor-relations.
Transcat Reports Second
Quarter Fiscal 2016 Results
October 26, 2015
Page 4 of 11
A telephonic replay will be available from 2:00 p.m. ET the day of the call through Tuesday, November 3, 2015. To listen to the archived call, dial (858) 384-5517 and enter conference ID number 13621118, or access the webcast replay at www.transcat.com/investor-relations. A transcript will also be posted to the website, once available.
NOTE 1 – Non-GAAP Financial Measures
In addition to reporting net income, a U.S. generally accepted accounting principle (“GAAP”) measure, we present Adjusted EBITDA (earnings before interest, income taxes, depreciation and amortization, other income and expenses, and non-cash stock compensation expense), which is a non-GAAP measure. The Company believes Adjusted EBITDA allows investors to view its performance in a manner similar to the methods used by management and provides additional insight into its operating results. Adjusted EBITDA is not calculated through the application of GAAP and is not the required form of disclosure by the Securities and Exchange Commission. As such, it should not be considered as a substitute for the GAAP measure of net income and, therefore, should not be used in isolation of, but in conjunction with, the GAAP measure. The use of any non-GAAP measure may produce results that vary from the GAAP measure and may not be comparable to a similarly defined non-GAAP measure used by other companies. See the attached Adjusted EBITDA Reconciliation table on page 9.
Contribution margin, a non-GAAP financial measure, consists of gross profit less selling, marketing and warehouse expenses. We believe contribution margin provides management and users of the financial statements information about our ability to cover our operating costs, such as technology and general and administrative expenses. Contribution margin is used in addition to and in conjunction with results presented in accordance with GAAP and should not be relied upon to the exclusion of GAAP financial measures. The material limitation associated with the use of contribution margin is that it is an incomplete measure of profitability as it does not include all operating expenses or non-operating income and expenses. Management compensates for these limitations when using this measure by looking at other GAAP measures, such as operating income (loss) and net income (loss). For further details on contribution margin, see the calculation of this non-GAAP financial measure and the reconciliation of contribution margin to gross profit in the Additional Information – Business Segment Data tables on page 10 and 11.
ABOUT TRANSCAT
Transcat, Inc. is a leading provider of accredited calibration and compliance services, including analytical instrument qualifications, equipment and process validation. The Company is focused on providing best-in-class calibration analytics to highly regulated industries, particularly life science, including pharmaceuticals, medical device manufacturing and biotechnology. Transcat performs over 250,000 specialized technical services annually through a variety of delivery options, including permanent and periodic on-site services, mobile calibration services and in-house services (often accompanied by pick-up and delivery). The in-house services are offered through 20 Calibration Service Centers strategically located across the United States, Puerto Rico and Canada. The breadth and depth of measurement parameters addressed by Transcat’s ISO/IEC 17025 scopes of accreditation are believed to be the best in the industry. Transcat also answers the call with cGMP and GLP compliant services.
In addition, Transcat operates as a leading distributor of professional grade handheld test, measurement and control instrumentation, marketing more than 100,000 premier and proprietary brand instruments to approximately 22,000 customers.
Transcat’s growth strategy is to leverage its service capabilities, strong brand and leading distribution platform to drive organic sales growth and to expand its addressable calibration market through acquisitions and capability investments to further realize the inherent leverage of its business model.
More information about Transcat can be found on its website at: Transcat.com.
Transcat Reports Second
Quarter Fiscal 2016 Results
October 26, 2015
Page 5 of 11
Safe Harbor
Statement
This press release contains
forward-looking statements within the meaning of the Private Securities
Litigation Reform Act of 1995. Forward-looking statements are not statements of
historical fact and thus are subject to risks, uncertainties and assumptions
that often are identified by words such as “expects,” “estimates,” “projects,”
“anticipates,” “believes,” “could,” and other similar words. All statements
addressing operating performance, events, or developments that Transcat, Inc.
expects or anticipates will occur in the future, including but not limited to
statements relating to anticipated revenue, profit margins, sales operations,
capital expenditures, cash flows, operating income, growth strategy, potential
acquisitions, market position, customer preferences and changes in market
conditions in the industries in which Transcat operates are forward-looking
statements. Forward-looking statements should be evaluated in light of important
risk factors and uncertainties. These risk factors and uncertainties are more
fully described in Transcat’s Annual and Quarterly Reports filed with the
Securities and Exchange Commission, including under the heading entitled “Risk
Factors.” Should one or more of these risks or uncertainties materialize, or
should any of the Company’s underlying assumptions prove incorrect, actual
results may vary materially from those currently anticipated. In addition, undue
reliance should not be placed on the Company’s forward-looking statements.
Except as required by law, the Company disclaims any obligation to update or
publicly announce any revisions to any of the forward-looking statements
contained in this press release.
For more information contact:
John J. Zimmer, Chief
Financial Officer
Phone: (585) 352-7777
Email: [email protected]
-OR-
Deborah K. Pawlowski,
Investor Relations
Phone: (716) 843-3908
Email: [email protected]
FINANCIAL TABLES FOLLOW.
Transcat Reports Second
Quarter Fiscal 2016 Results
October 26, 2015
Page 6 of 11
TRANSCAT, INC.
CONSOLIDATED STATEMENTS OF INCOME
(In
Thousands, Except Per Share Amounts)
| (Unaudited) | (Unaudited) | ||||||||||||||||||
| Second Quarter Ended | Six Months Ended | ||||||||||||||||||
| September 26, | September 27, | September 26, | September 27, | ||||||||||||||||
| 2015 | 2014 | 2015 | 2014 | ||||||||||||||||
| Service Revenue | $ | 14,190 | $ | 12,595 | $ | 27,725 | $ | 24,733 | |||||||||||
| Distribution Sales | 15,286 | 18,516 | 31,421 | 35,497 | |||||||||||||||
| Total Revenue | 29,476 | 31,111 | 59,146 | 60,230 | |||||||||||||||
| Cost of Service Revenue | 10,729 | 9,323 | 20,733 | 18,524 | |||||||||||||||
| Cost of Distribution Sales | 12,010 | 14,862 | 24,614 | 28,111 | |||||||||||||||
| Total Cost of Revenue | 22,739 | 24,185 | 45,347 | 46,635 | |||||||||||||||
| Gross Profit | 6,737 | 6,926 | 13,799 | 13,595 | |||||||||||||||
| Selling, Marketing and Warehouse | |||||||||||||||||||
| Expenses | 3,229 | 3,169 | 6,769 | 6,904 | |||||||||||||||
| Administrative Expenses | 2,138 | 2,241 | 4,633 | 4,416 | |||||||||||||||
| Total Operating Expenses | 5,367 | 5,410 | 11,402 | 11,320 | |||||||||||||||
| Operating Income | 1,370 | 1,516 | 2,397 | 2,275 | |||||||||||||||
| Interest and Other Expense, net | 36 | 138 | 131 | 183 | |||||||||||||||
| Income Before Income Taxes | 1,334 | 1,378 | 2,266 | 2,092 | |||||||||||||||
| Provision for Income Taxes | 456 | 519 | 787 | 788 | |||||||||||||||
| Net Income | $ | 878 | $ | 859 | $ | 1,479 | $ | 1,304 | |||||||||||
| Basic Earnings Per Share | $ | 0.13 | $ | 0.13 | $ | 0.22 | $ | 0.19 | |||||||||||
| Average Shares Outstanding | 6,886 | 6,802 | 6,868 | 6,772 | |||||||||||||||
| Diluted Earnings Per Share | $ | 0.12 | $ | 0.12 | $ | 0.21 | $ | 0.18 | |||||||||||
| Average Shares Outstanding | 7,119 | 7,056 | 7,135 | 7,050 | |||||||||||||||
Transcat Reports Second
Quarter Fiscal 2016 Results
October 26, 2015
Page 7 of 11
TRANSCAT, INC.
CONSOLIDATED BALANCE
SHEETS
(In Thousands, Except
Share and Per Share Amounts)
| (Unaudited) | ||||||||||||
| September 26, | March 28, | |||||||||||
| 2015 | 2015 | |||||||||||
| ASSETS | ||||||||||||
| Current Assets: | ||||||||||||
| Cash | $ | 163 | $ | 65 | ||||||||
| Accounts Receivable, less allowance for doubtful accounts of $103 | ||||||||||||
| and $111 as of September 26, 2015 and March 28, 2015, | ||||||||||||
| respectively | 15,004 | 16,899 | ||||||||||
| Other Receivables | 1,355 | 1,171 | ||||||||||
| Inventory, net | 6,269 | 6,750 | ||||||||||
| Prepaid Expenses and Other Current Assets | 1,461 | 1,209 | ||||||||||
| Deferred Tax Assets | 986 | 1,048 | ||||||||||
| Total Current Assets | 25,238 | 27,142 | ||||||||||
| Property and Equipment, net | 11,419 | 9,397 | ||||||||||
| Goodwill | 22,652 | 20,923 | ||||||||||
| Intangible Assets, net | 4,172 | 3,554 | ||||||||||
| Other Assets | 959 | 1,133 | ||||||||||
| Total Assets | $ | 64,440 | $ | 62,149 | ||||||||
| LIABILITIES AND SHAREHOLDERS' EQUITY | ||||||||||||
| Current Liabilities: | ||||||||||||
| Accounts Payable | $ | 8,438 | $ | 7,695 | ||||||||
| Accrued Compensation and Other Liabilities | 4,318 | 4,195 | ||||||||||
| Income Taxes Payable | - | 43 | ||||||||||
| Total Current Liabilities | 12,756 | 11,933 | ||||||||||
| Long-Term Debt | 11,984 | 12,168 | ||||||||||
| Deferred Tax Liabilities | 1,782 | 1,684 | ||||||||||
| Other Liabilities | 1,922 | 2,046 | ||||||||||
| Total Liabilities | 28,444 | 27,831 | ||||||||||
| Shareholders' Equity: | ||||||||||||
| Common Stock, par value $0.50 per share, 30,000,000 shares authorized; | ||||||||||||
| 6,895,703 and 6,835,828 shares issued and outstanding | ||||||||||||
| as of September 26, 2015 and March 28, 2015, respectively | 3,448 | 3,418 | ||||||||||
| Capital in Excess of Par Value | 12,764 | 12,289 | ||||||||||
| Accumulated Other Comprehensive Loss | (387 | ) | (143 | ) | ||||||||
| Retained Earnings | 20,171 | 18,754 | ||||||||||
| Total Shareholders' Equity | 35,996 | 34,318 | ||||||||||
| Total Liabilities and Shareholders' Equity | $ | 64,440 | $ | 62,149 | ||||||||
Transcat Reports Second
Quarter Fiscal 2016 Results
October 26, 2015
Page 8 of 11
TRANSCAT, INC.
CONSOLIDATED STATEMENTS OF
CASH FLOWS
(In Thousands)
| (Unaudited) | ||||||||||||
| Six Months Ended | ||||||||||||
| September 26, | September 27, | |||||||||||
| 2015 | 2014 | |||||||||||
| Cash Flows from Operating Activities: | ||||||||||||
| Net Income | $ | 1,479 | $ | 1,304 | ||||||||
| Adjustments to Reconcile Net Income to Net Cash | ||||||||||||
| Provided by (Used in) Operating Activities: | ||||||||||||
| Loss on Disposal of Property and Equipment | 34 | 4 | ||||||||||
| Deferred Income Taxes | (33 | ) | 409 | |||||||||
| Depreciation and Amortization | 1,742 | 1,371 | ||||||||||
| Provision for Accounts Receivable and Inventory | ||||||||||||
| Reserves | 83 | 48 | ||||||||||
| Stock-Based Compensation Expense | 280 | 389 | ||||||||||
| Changes in Assets and Liabilities: | ||||||||||||
| Accounts Receivable and Other Receivables | 1,839 | 241 | ||||||||||
| Inventory | 459 | (1,345 | ) | |||||||||
| Prepaid Expenses and Other Assets | (146 | ) | (871 | ) | ||||||||
| Accounts Payable | (309 | ) | 1,026 | |||||||||
| Accrued Compensation and Other Liabilities | (580 | ) | (2,081 | ) | ||||||||
| Income Taxes Payable | 466 | (906 | ) | |||||||||
| Net Cash Provided by (Used in) Operating Activities | 5,314 | (411 | ) | |||||||||
| Cash Flows from Investing Activities: | ||||||||||||
| Purchases of Property and Equipment, net | (2,723 | ) | (1,832 | ) | ||||||||
| Business Acquisitions, net of cash acquired | (2,918 | ) | (6,681 | ) | ||||||||
| Net Cash Used in Investing Activities | (5,641 | ) | (8,513 | ) | ||||||||
| Cash Flows from Financing Activities: | ||||||||||||
| (Repayment of) Proceeds from Revolving Credit Facility, net | (184 | ) | 8,734 | |||||||||
| Issuance of Common Stock | 234 | 327 | ||||||||||
| Repurchase of Common Stock | (71 | ) | (71 | ) | ||||||||
| Net Cash (Used in) Provided by Financing Activities | (21 | ) | 8,990 | |||||||||
| Effect of Exchange Rate Changes on Cash | 446 | 174 | ||||||||||
| Net Increase in Cash | 98 | 240 | ||||||||||
| Cash at Beginning of Period | 65 | 23 | ||||||||||
| Cash at End of Period | $ | 163 | $ | 263 | ||||||||
Transcat Reports Second
Quarter Fiscal 2016 Results
October 26, 2015
Page 9 of
11
TRANSCAT,
INC.
Adjusted EBITDA Reconciliation
Table
(Dollars in thousands)
(Unaudited)
| FY2016 | |||||||||||||||||||||||
| Q1 | Q2 | Q3 | Q4 | YTD | |||||||||||||||||||
| Net Income | $ | 601 | $ | 878 | $ | 1,479 | |||||||||||||||||
| + Interest Expense | 51 | 48 | 99 | ||||||||||||||||||||
| + Other Expense / (Income) | 44 | (12 | ) | 32 | |||||||||||||||||||
| + Tax Provision | 331 | 456 | 787 | ||||||||||||||||||||
| Operating Income | $ | 1,027 | $ | 1,370 | $ | - | $ | - | $ | 2,397 | |||||||||||||
| + Depreciation & Amortization | 840 | 902 | 1,742 | ||||||||||||||||||||
| + Other (Expense) / Income | (44 | ) | 12 | (32 | ) | ||||||||||||||||||
| + Noncash Stock Compensation | 171 | 109 | 280 | ||||||||||||||||||||
| Adjusted EBITDA | $ | 1,994 | $ | 2,393 | $ | - | $ | - | $ | 4,387 | |||||||||||||
| Segment Breakdown | |||||||||||||||||||||||
| Service Operating Income | $ | 646 | $ | 839 | $ | 1,485 | |||||||||||||||||
| + Depreciation & Amortization | 680 | 717 | 1,397 | ||||||||||||||||||||
| + Other (Expense) / Income | (39 | ) | 1 | (38 | ) | ||||||||||||||||||
| + Noncash Stock Compensation | 85 | 51 | 136 | ||||||||||||||||||||
| Service Adjusted EBITDA | $ | 1,372 | $ | 1,608 | $ | - | $ | - | $ | 2,980 | |||||||||||||
| Distribution Operating Income | $ | 381 | $ | 531 | $ | 912 | |||||||||||||||||
| + Depreciation & Amortization | 160 | 185 | 345 | ||||||||||||||||||||
| + Other (Expense) / Income | (5 | ) | 11 | 6 | |||||||||||||||||||
| + Noncash Stock Compensation | 86 | 58 | 144 | ||||||||||||||||||||
| Distribution Adjusted EBITDA | $ | 622 | $ | 785 | $ | - | $ | - | $ | 1,407 | |||||||||||||
| FY2015 | |||||||||||||||||||||||
| Q1 | Q2 | Q3 | Q4 | YTD | |||||||||||||||||||
| Net Income | $ | 445 | $ | 859 | $ | 813 | $ | 1,909 | $ | 4,026 | |||||||||||||
| + Interest Expense | 31 | 47 | 77 | 79 | 234 | ||||||||||||||||||
| + Other Expense / (Income) | 14 | 91 | 6 | - | 111 | ||||||||||||||||||
| + Tax Provision | 269 | 519 | 481 | 1,128 | 2,397 | ||||||||||||||||||
| Operating Income | $ | 759 | $ | 1,516 | $ | 1,377 | $ | 3,116 | $ | 6,768 | |||||||||||||
| + Depreciation & Amortization | 624 | 747 | 897 | 822 | 3,090 | ||||||||||||||||||
| + Other (Expense) / Income | (14 | ) | (91 | ) | (6 | ) | 1 | (111 | ) | ||||||||||||||
| + Noncash Stock Compensation | 155 | 234 | 85 | 33 | 507 | ||||||||||||||||||
| Adjusted EBITDA | $ | 1,524 | $ | 2,406 | $ | 2,353 | $ | 3,971 | $ | 10,254 | |||||||||||||
| Segment Breakdown | |||||||||||||||||||||||
| Service Operating Income | $ | 267 | $ | 665 | $ | 562 | $ | 2,199 | $ | 3,693 | |||||||||||||
| + Depreciation & Amortization | 488 | 577 | 676 | 621 | 2,362 | ||||||||||||||||||
| + Other (Expense) / Income | (15 | ) | (85 | ) | (33 | ) | (5 | ) | (138 | ) | |||||||||||||
| + Noncash Stock Compensation | 72 | 103 | 39 | 10 | 224 | ||||||||||||||||||
| Service Adjusted EBITDA | $ | 812 | $ | 1,260 | $ | 1,244 | $ | 2,825 | $ | 6,141 | |||||||||||||
| Distribution Operating Income | $ | 492 | $ | 851 | $ | 815 | $ | 917 | $ | 3,075 | |||||||||||||
| + Depreciation & Amortization | 136 | 170 | 221 | 201 | 728 | ||||||||||||||||||
| + Other (Expense) / Income | 1 | (6 | ) | 27 | 5 | 27 | |||||||||||||||||
| + Noncash Stock Compensation | 83 | 131 | 46 | 23 | 283 | ||||||||||||||||||
| Distribution Adjusted EBITDA | $ | 712 | $ | 1,146 | $ | 1,109 | $ | 1,146 | $ | 4,113 | |||||||||||||
Transcat Reports Second
Quarter Fiscal 2016 Results
October 26, 2015
Page 10 of 11
TRANSCAT, INC.
Additional Information -
Business Segment Data
(Dollars in thousands)
(Unaudited)
| Change | |||||||||||||||||||||||
| SERVICE | FY 2016 Q2 | FY 2015 Q2 | $'s | % | |||||||||||||||||||
| Service Revenue | $ | 14,190 | $ | 12,595 | $ | 1,595 | 12.7 | % | |||||||||||||||
| Cost of Revenue | $ | 10,729 | $ | 9,323 | $ | 1,406 | 15.1 | % | |||||||||||||||
| Gross Profit | $ | 3,461 | $ | 3,272 | $ | 189 | 5.8 | % | |||||||||||||||
| Gross Margin | 24.4 | % | 26.0 | % | |||||||||||||||||||
| Selling, Marketing & Warehouse | |||||||||||||||||||||||
| Expenses | $ | 1,641 | $ | 1,610 | $ | 31 | 1.9 | % | |||||||||||||||
| Contribution Margin | $ | 1,820 | $ | 1,662 | $ | 158 | 9.5 | % | |||||||||||||||
| % of Revenue | 12.8 | % | 13.2 | % | |||||||||||||||||||
| Administrative Expense | $ | 982 | $ | 997 | $ | (15 | ) | (1.5 | %) | ||||||||||||||
| Operating Income | $ | 838 | $ | 665 | $ | 173 | 26.0 | % | |||||||||||||||
| % of Revenue | 5.9 | % | 5.3 | % | |||||||||||||||||||
| Change | |||||||||||||||||||||||
| DISTRIBUTION | FY 2016 Q2 | FY 2015 Q2 | $'s | % | |||||||||||||||||||
| Distribution Sales | $ | 15,286 | $ | 18,516 | $ | (3,230 | ) | (17.4 | %) | ||||||||||||||
| Cost of Sales | $ | 12,010 | $ | 14,862 | $ | (2,852 | ) | (19.2 | %) | ||||||||||||||
| Gross Profit | $ | 3,276 | $ | 3,654 | $ | (378 | ) | (10.3 | %) | ||||||||||||||
| Gross Margin | 21.4 | % | 19.7 | % | |||||||||||||||||||
| Selling, Marketing & Warehouse | |||||||||||||||||||||||
| Expenses | $ | 1,588 | $ | 1,559 | $ | 29 | 1.9 | % | |||||||||||||||
| Contribution Margin | $ | 1,688 | $ | 2,095 | $ | (407 | ) | (19.4 | %) | ||||||||||||||
| % of Sales | 11.0 | % | 11.3 | % | |||||||||||||||||||
| Administrative Expense | $ | 1,156 | $ | 1,244 | $ | (88 | ) | (7.1 | %) | ||||||||||||||
| Operating Income | $ | 532 | $ | 851 | $ | (319 | ) | (37.5 | %) | ||||||||||||||
| % of Sales | 3.5 | % | 4.6 | % | |||||||||||||||||||
| Change | |||||||||||||||||||||||
| TOTAL | FY 2016 Q2 | FY 2015 Q2 | $'s | % | |||||||||||||||||||
| Total Revenue | $ | 29,476 | $ | 31,111 | $ | (1,635 | ) | (5.3 | %) | ||||||||||||||
| Total Cost of Revenue | $ | 22,739 | $ | 24,185 | $ | (1,446 | ) | (6.0 | %) | ||||||||||||||
| Gross Profit | $ | 6,737 | $ | 6,926 | $ | (189 | ) | (2.7 | %) | ||||||||||||||
| Gross Margin | 22.9 | % | 22.3 | % | |||||||||||||||||||
| Selling, Marketing & Warehouse | |||||||||||||||||||||||
| Expenses | $ | 3,229 | $ | 3,169 | $ | 60 | 1.9 | % | |||||||||||||||
| Contribution Margin | $ | 3,508 | $ | 3,757 | $ | (249 | ) | (6.6 | %) | ||||||||||||||
| % of Revenue | 11.9 | % | 12.1 | % | |||||||||||||||||||
| Administrative Expense | $ | 2,138 | $ | 2,241 | $ | (103 | ) | (4.6 | %) | ||||||||||||||
| Operating Income | $ | 1,370 | $ | 1,516 | $ | (146 | ) | (9.6 | %) | ||||||||||||||
| % of Revenue | 4.6 | % | 4.9 | % | |||||||||||||||||||
Transcat Reports Second
Quarter Fiscal 2016 Results
October 26, 2015
Page 11 of 11
TRANSCAT, INC.
Additional Information -
Business Segment Data
(Dollars in thousands)
(Unaudited)
| FY 2016 | FY 2015 | Change | |||||||||||||||||||||
| SERVICE | YTD | YTD | $'s | % | |||||||||||||||||||
| Service Revenue | $ | 27,725 | $ | 24,733 | $ | 2,992 | 12.1 | % | |||||||||||||||
| Cost of Revenue | $ | 20,733 | $ | 18,524 | $ | 2,209 | 11.9 | % | |||||||||||||||
| Gross Profit | $ | 6,992 | $ | 6,209 | $ | 783 | 12.6 | % | |||||||||||||||
| Gross Margin | 25.2 | % | 25.1 | % | |||||||||||||||||||
| Selling, Marketing & Warehouse | |||||||||||||||||||||||
| Expenses | $ | 3,304 | $ | 3,296 | $ | 8 | 0.2 | % | |||||||||||||||
| Contribution Margin | $ | 3,688 | $ | 2,913 | $ | 775 | 26.6 | % | |||||||||||||||
| % of Revenue | 13.3 | % | 11.8 | % | |||||||||||||||||||
| Administrative Expense | $ | 2,204 | $ | 1,981 | $ | 223 | 11.3 | % | |||||||||||||||
| Operating Income | $ | 1,484 | $ | 932 | $ | 552 | 59.2 | % | |||||||||||||||
| % of Revenue | 5.4 | % | 3.8 | % | |||||||||||||||||||
| FY 2016 | FY 2015 | Change | |||||||||||||||||||||
| DISTRIBUTION | YTD | YTD | $'s | % | |||||||||||||||||||
| Distribution Sales | $ | 31,421 | $ | 35,497 | $ | (4,076 | ) | (11.5 | %) | ||||||||||||||
| Cost of Sales | $ | 24,614 | $ | 28,111 | $ | (3,497 | ) | (12.4 | %) | ||||||||||||||
| Gross Profit | $ | 6,807 | $ | 7,386 | $ | (579 | ) | (7.8 | %) | ||||||||||||||
| Gross Margin | 21.7 | % | 20.8 | % | |||||||||||||||||||
| Selling, Marketing & Warehouse | |||||||||||||||||||||||
| Expenses | $ | 3,465 | $ | 3,608 | $ | (143 | ) | (4.0 | %) | ||||||||||||||
| Contribution Margin | $ | 3,342 | $ | 3,778 | $ | (436 | ) | (11.5 | %) | ||||||||||||||
| % of Sales | 10.6 | % | 10.6 | % | |||||||||||||||||||
| Administrative Expense | $ | 2,429 | $ | 2,435 | $ | (6 | ) | (0.2 | %) | ||||||||||||||
| Operating Income | $ | 913 | $ | 1,343 | $ | (430 | ) | (32.0 | %) | ||||||||||||||
| % of Sales | 2.9 | % | 3.8 | % | |||||||||||||||||||
| FY 2016 | FY 2015 | Change | |||||||||||||||||||||
| TOTAL | YTD | YTD | $'s | % | |||||||||||||||||||
| Total Revenue | $ | 59,146 | $ | 60,230 | $ | (1,084 | ) | (1.8 | %) | ||||||||||||||
| Total Cost of Revenue | $ | 45,347 | $ | 46,635 | $ | (1,288 | ) | (2.8 | %) | ||||||||||||||
| Gross Profit | $ | 13,799 | $ | 13,595 | $ | 204 | 1.5 | % | |||||||||||||||
| Gross Margin | 23.3 | % | 22.6 | % | |||||||||||||||||||
| Selling, Marketing & Warehouse | |||||||||||||||||||||||
| Expenses | $ | 6,769 | $ | 6,904 | $ | (135 | ) | (2.0 | %) | ||||||||||||||
| Contribution Margin | $ | 7,030 | $ | 6,691 | $ | 339 | 5.1 | % | |||||||||||||||
| % of Revenue | 11.9 | % | 11.1 | % | |||||||||||||||||||
| Administrative Expense | $ | 4,633 | $ | 4,416 | $ | 217 | 4.9 | % | |||||||||||||||
| Operating Income | $ | 2,397 | $ | 2,275 | $ | 122 | 5.4 | % | |||||||||||||||
| % of Revenue | 4.1 | % | 3.8 | % | |||||||||||||||||||
Exhibit 99.2


Serious News for Serious Traders! Try StreetInsider.com Premium Free!
You May Also Be Interested In
- Transcat Inc. (TRNS) PT Raised to $125 at Oppenheimer
- Global CIOs geared up to scale AI but organizations aren’t as ready
- Wright Electric Announces First Steps of Electric Propulsion Testing
Create E-mail Alert Related Categories
SEC FilingsSign up for StreetInsider Free!
Receive full access to all new and archived articles, unlimited portfolio tracking, e-mail alerts, custom newswires and RSS feeds - and more!
