Form 8-K TIER REIT INC For: May 14
UNITED STATES
SECURITIES AND EXCHANGE COMMISSION
Washington, D.C. 20549
FORM 8-K
CURRENT REPORT
Pursuant to Section 13 or 15(d) of the Securities Exchange Act of 1934
Date of Report (Date of earliest event reported): May 14, 2015
TIER REIT, Inc.
(Exact Name of Registrant as Specified in Its Charter)
|
Maryland |
|
000-51293 |
|
68-0509956 |
|
(State or other jurisdiction of |
|
(Commission File Number)
|
|
(I.R.S. Employer |
17300 Dallas Parkway, Suite 1010, Dallas, Texas
75248
(Address of principal executive offices)
(Zip Code)
(972) 931-4300
(Registrant’s telephone number, including area code)
None
(Former name or former address, if changed since last report)
Check the appropriate box below if the Form 8-K filing is intended to simultaneously satisfy the filing obligation of the registrant under any of the following provisions:
o Written communications pursuant to Rule 425 under the Securities Act (17 CFR 230.425)
o Soliciting material pursuant to Rule 14a-12 under the Exchange Act (17 CFR 240.14a-12)
o Pre-commencement communications pursuant to Rule 14d-2(b) under the Exchange Act (17 CFR 240.14d-2(b))
o Pre-commencement communications pursuant to Rule 13e-4(c) under the Exchange Act (17 CFR 240.13e-4(c))
Item 7.01 Regulation FD.
On May 14, 2015, TIER REIT, Inc., a Maryland corporation (which may be referred to herein as the “Registrant,” “we,” “our” or “us”), first used the presentation attached hereto as Exhibit 99.1 in connection with a conference call with stockholders and financial advisors to review first quarter 2015 results. The information included in Item 7.01 of this Current Report on Form 8-K, including Exhibit 99.1, is being furnished and shall not be deemed “filed” for purposes of Section 18 of the Securities Exchange Act of 1934, as amended, or otherwise subject to the liabilities of that section, nor shall such information be deemed incorporated by reference in any filing under the Securities Act of 1933, as amended, or the Securities Exchange Act of 1934, as amended.
The presentation materials include information about Modified Funds from Operations (“MFFO”) and Same Store Cash Net Operating Income (“Same Store Cash NOI”). In order to derive MFFO, we begin with Funds from Operations (“FFO”), which is a non-GAAP financial measure that is widely recognized as a measure of REIT operating performance. FFO is defined by the National Association of Real Estate Investment Trusts (“NAREIT”) in the April 2002 “White Paper on Funds From Operations” as net income (loss), computed in accordance with accounting principles generally accepted in the United State of America (“GAAP”), excluding extraordinary items, as defined by GAAP, gains (or losses) from sales of property and impairments of depreciable real estate (including impairments of investments in unconsolidated joint ventures and partnerships which resulted from measurable decreases in the fair value of the depreciable real estate held by the joint venture or partnership), plus depreciation and amortization on real estate assets, and after related adjustments for unconsolidated partnerships, joint ventures and subsidiaries, and noncontrolling interests.
Since FFO was promulgated, several new accounting pronouncements have been issued, such that the presentation of FFO alone to be insufficient to evaluate operating performance. Accordingly, in addition to FFO, we use MFFO, as defined by the Investment Program Association (“IPA”). The IPA definition of MFFO excludes from FFO the following items:
(1) acquisition fees and expenses;
(2) straight-line rent amounts, both income and expense;
(3) amortization of above- or below-market intangible lease assets and liabilities;
(4) amortization of discounts and premiums on debt investments;
(5) impairment charges on real estate related assets to the extent not already excluded from net income in the calculation of FFO, such as impairments of non-depreciable properties, loans receivable, and equity and debt investments;
(6) gains or losses from the early extinguishment of debt;
(7) gains or losses on the extinguishment or sales of hedges, foreign exchange, securities, and other derivative holdings except where the trading of such instruments is a fundamental attribute of our operations;
(8) gains or losses related to fair value adjustments for interest rate swaps and other derivatives not qualifying for hedge accounting, foreign exchange holdings, and other securities;
(9) gains or losses related to consolidation from, or deconsolidation to, equity accounting;
(10) gains or losses related to contingent purchase price adjustments; and
(11) adjustments related to the above items for unconsolidated entities in the application of equity accounting.
The determination of whether impairment charges have been incurred is based partly on anticipated operating performance and hold periods. Estimated undiscounted cash flows from a property, derived from estimated future net rental and lease revenues, net proceeds on the sale of the property, and certain other ancillary cash flows are taken into account in determining whether an impairment charge has been incurred. While impairment charges for depreciable real estate are excluded from net income (loss) in the calculation of FFO and impairment charges for other real estate related assets are excluded in the calculation of MFFO as described above, impairments reflect a decline in the value of the applicable property that we may not recover.
Historical cost accounting for real estate assets in accordance with GAAP implicitly assumes that the value of real estate and intangibles diminishes predictably over time. Since real estate values have historically risen or fallen with market conditions, many industry investors and analysts have considered the presentation of operating results for real estate companies that use historical cost accounting alone to be insufficient. As a result, we believe that the use of MFFO, together with the required GAAP presentation, provides a more complete understanding of our performance because it excludes the adjustments in FFO and MFFO outlined above. Factors that impact MFFO include fixed costs, lower yields on cash held in accounts, income from portfolio properties and other portfolio assets, interest rates on debt financing, and operating expenses. When compared period over period, MFFO reflects the impact on operations from trends in occupancy rates, rental rates, operating costs, development activities, general and administrative expenses, and interest costs that are not immediately apparent from net income. We believe fluctuations in MFFO are indicative of changes and potential changes in operating activities.
Accordingly, we believe that MFFO can be a useful metric in assessing the sustainability of operating performance. MFFO is also more comparable in evaluating our performance over time. We also believe that MFFO is a recognized measure of sustainable operating performance by the real estate industry and is useful in comparing the sustainability of our operating performance with the sustainability of the operating performance of other real estate companies that do not have a similar level of involvement in acquisition activities or are not similarly affected by impairments and other non-operating charges. By providing MFFO, we believe we are presenting useful information in the analysis of long-term operating activities.
MFFO should neither be considered as an alternative to net income (loss), nor as an indication of our liquidity, nor is it indicative of funds available to fund our cash needs, including our ability to make distributions. Additionally, the exclusion of impairments limits the usefulness of MFFO as an historical operating performance measure since an impairment charge indicates that operating performance has been permanently affected. MFFO is not a useful measure in evaluating net asset value because impairments are taken into account in determining net asset value but not in determining MFFO. MFFO is a non-GAAP measurement and should be reviewed in connection with other GAAP measurements. Our MFFO attributable to common stockholders as presented may not be comparable to amounts calculated by other REITs that do not define FFO in accordance with the current NAREIT definition or MFFO in accordance with the current IPA definition or that interpret the definitions differently.
The following section presents our calculations of FFO attributable to common stockholders and MFFO attributable to common stockholders for the three months ended March 31, 2015 and December 31, 2014 (in thousands, except per share amounts):
|
|
|
Three Months Ended |
| ||||
|
|
|
March 31, 2015 |
|
December 31, 2014 |
| ||
|
|
|
|
|
|
| ||
|
Net income (loss) |
|
$ |
(5,902 |
) |
$ |
47,809 |
|
|
Net (income) loss attributable to noncontrolling interests |
|
10 |
|
(77 |
) | ||
|
Accretion of Series A Convertible Preferred Stock |
|
— |
|
(1,926 |
) | ||
|
Adjustments (1): |
|
|
|
|
| ||
|
Real estate depreciation and amortization from consolidated properties |
|
30,022 |
|
37,181 |
| ||
|
Real estate depreciation and amortization from unconsolidated properties |
|
1,287 |
|
1,307 |
| ||
|
Impairment of depreciable real estate assets |
|
132 |
|
4,940 |
| ||
|
Gain on sale of depreciable real estate |
|
(8,606 |
) |
(86,195 |
) | ||
|
Noncontrolling interests (OP units & vested restricted stock units) share of above adjustments |
|
(39 |
) |
68 |
| ||
|
FFO attributable to common stockholders |
|
$ |
16,904 |
|
$ |
3,107 |
|
|
|
|
|
|
|
| ||
|
Adjustments (1) (2): |
|
|
|
|
| ||
|
Acquisition expenses |
|
2 |
|
86 |
| ||
|
Straight-line rent adjustments |
|
(2,850 |
) |
(3,141 |
) | ||
|
Amortization of above- and below-market rents, net |
|
(1,289 |
) |
(1,244 |
) | ||
|
Loss on early extinguishment of debt |
|
36 |
|
14,616 |
| ||
|
Noncontrolling interests (OP units & vested restricted stock units) share of above adjustments |
|
7 |
|
(17 |
) | ||
|
MFFO attributable to common stockholders |
|
$ |
12,810 |
|
$ |
13,407 |
|
|
|
|
|
|
|
| ||
|
Weighted average common shares outstanding - basic |
|
299,349 |
|
299,264 |
| ||
|
Weighted average common shares outstanding - diluted (3) |
|
300,396 |
|
299,976 |
| ||
|
|
|
|
|
|
| ||
|
Net income (loss) per common share - basic and diluted (3) |
|
$ |
(0.02 |
) |
$ |
0.15 |
|
|
FFO per common share - basic and diluted |
|
$ |
0.06 |
|
$ |
0.01 |
|
|
MFFO per common share - basic and diluted |
|
$ |
0.04 |
|
$ |
0.04 |
|
(1) Reflects the adjustments of continuing operations, as well as discontinued operations.
(2) Includes adjustments for unconsolidated properties.
(3) There are no dilutive securities for purposes of calculating the net income (loss) per common share.
Same Store GAAP NOI is equal to rental revenue, less lease termination fee income, property operating expenses (excluding tenant improvement demolition costs), real estate taxes, and property management expenses for our same store properties and is considered a non-GAAP financial measure. Same Store Cash NOI is equal to Same Store GAAP NOI less non-cash revenue items including straight-line rent adjustments and the amortization of above- and below-market rent. The same store properties include our consolidated operating properties owned and operated for the entirety of the current and comparable periods, and excludes properties classified as held for sale before January 1, 2015. We view Same Store GAAP NOI and Same Store Cash NOI as important measures of the operating performance of our properties because they allow us to compare operating results of consolidated properties owned and operating for the entirety of the current and comparable periods and therefore eliminate variations caused by acquisitions or dispositions during the periods under review.
Same Store GAAP NOI and Same Store Cash NOI presented by us may not be comparable to Same Store GAAP NOI or Same Store Cash NOI reported by other REITs that do not define Same Store GAAP NOI or Same Store Cash NOI exactly as we do. We believe that in order to facilitate a clear understanding of our operating results, Same Store GAAP NOI and Same Store Cash NOI should be examined in conjunction with net income (loss) as presented in our consolidated financial statements and notes thereto. Same Store GAAP NOI and Same Store Cash NOI should not be considered as
alternatives to net income (loss) as an indication of our performance or to cash flows as a measure of liquidity or our ability to make distributions.
The table below presents our Same Store GAAP NOI and Same Store Cash NOI with a reconciliation to net loss for the three months ended March 31, 2015 and 2014 (in thousands). The same store properties for this comparison consist of 29 properties and 10.6 million square feet.
|
|
|
Three Months Ended |
| ||||
|
|
|
March 31, 2015 |
|
March 31, 2014 |
| ||
|
Same Store Revenue: |
|
|
|
|
| ||
|
Revenues: |
|
|
|
|
| ||
|
Total revenue |
|
$ |
69,990 |
|
$ |
67,065 |
|
|
Less: Lease termination fees |
|
545 |
|
120 |
| ||
|
|
|
69,445 |
|
66,945 |
| ||
|
|
|
|
|
|
| ||
|
Same Store Expenses: |
|
|
|
|
| ||
|
Property operating expenses (less tenant improvement demolition costs) |
|
22,687 |
|
23,309 |
| ||
|
Real estate taxes |
|
10,605 |
|
9,585 |
| ||
|
Property management fees |
|
2,185 |
|
2,034 |
| ||
|
Property Expenses |
|
35,477 |
|
34,928 |
| ||
|
Same Store GAAP NOI |
|
33,968 |
|
32,017 |
| ||
|
|
|
|
|
|
| ||
|
Less: |
|
|
|
|
| ||
|
Straight-line rent revenue adjustment |
|
1,297 |
|
1,439 |
| ||
|
Above/below market rent amortization |
|
1,008 |
|
1,018 |
| ||
|
Same Store Cash NOI |
|
$ |
31,663 |
|
$ |
29,560 |
|
|
|
|
|
|
|
| ||
|
Reconciliation of net loss to Same Store GAAP NOI and Same Store Cash NOI: |
|
|
|
|
| ||
|
Net loss |
|
$ |
(5,902 |
) |
$ |
(29,657 |
) |
|
Adjustments: |
|
|
|
|
| ||
|
Interest expense |
|
15,787 |
|
15,847 |
| ||
|
Asset impairment losses |
|
132 |
|
— |
| ||
|
Tenant improvement demolition costs |
|
52 |
|
746 |
| ||
|
General & administrative |
|
6,412 |
|
4,695 |
| ||
|
Acquisition expense |
|
2 |
|
— |
| ||
|
Real estate depreciation and amortization |
|
30,022 |
|
28,161 |
| ||
|
Interest and other income |
|
(146 |
) |
(249 |
) | ||
|
Loss on early extinguishment of debt |
|
36 |
|
— |
| ||
|
Provision (benefit) for income taxes |
|
(76 |
) |
68 |
| ||
|
Equity in operations of investments |
|
(243 |
) |
(88 |
) | ||
|
(Income) loss from discontinued operations |
|
(1,305 |
) |
12,991 |
| ||
|
Gain on sale of assets |
|
(8,606 |
) |
— |
| ||
|
Net operating income of non same store properties |
|
(1,652 |
) |
(377 |
) | ||
|
Lease termination fees |
|
(545 |
) |
(120 |
) | ||
|
Same Store GAAP NOI |
|
33,968 |
|
32,017 |
| ||
|
Straight-line rent revenue adjustment |
|
(1,297 |
) |
(1,439 |
) | ||
|
Above/below market rent amortization & lease incentives |
|
(1,008 |
) |
(1,018 |
) | ||
|
Same Store Cash NOI |
|
$ |
31,663 |
|
$ |
29,560 |
|
Item 9.01. Financial Statements and Exhibits.
(d) Exhibits.
99.1 TIER REIT, Inc. — First Quarter 2015 Conference Call Presentation
SIGNATURE
Pursuant to the requirements of the Securities Exchange Act of 1934, the Registrant has duly caused this report to be signed on its behalf by the undersigned thereunto duly authorized.
|
|
|
TIER REIT, INC. |
|
|
|
|
|
|
|
|
|
Dated: May 14, 2015 |
By: |
/s/ Telisa Webb Schelin |
|
|
|
Telisa Webb Schelin |
|
|
|
Senior Vice President — Legal, General Counsel & Secretary |
Exhibit Index
|
Exhibit |
|
Description |
|
99.1 |
|
TIER REIT, Inc. — First Quarter 2015 Conference Call Presentation |
Exhibit 99.1
|
|
First Quarter 2015 Conference Call May 14, 2015 5950 Sherry Lane Dallas, TX One & Two BriarLake Plaza Houston, TX |
|
|
Forward-Looking Statements This presentation contains forward-looking statements, including discussion and analysis of the financial condition of us and our subsidiaries and other matters. These forward-looking statements are not historical facts but are the intent, belief or current expectations of our management based on their knowledge and understanding of our business and industry. Words such as “may,” “anticipates,” “expects,” “intends,” “plans,” “believes,” “seeks,” “estimates,” “would,” “could,” “should”, “objectives”, “strategies,” “goals,” and variations of these words and similar expressions are intended to identify forward-looking statements. We intend that such forward-looking statements be subject to the safe harbor provisions created by Section 27A of the Securities Act of 1933 and Section 21E of the Securities Exchange Act of 1934. These statements are not guarantees of future performance and are subject to risks, uncertainties and other factors, some of which are beyond our control, are difficult to predict and could cause actual results to differ materially from those expressed or forecasted in the forward-looking statements. Forward-looking statements that were true at the time made may ultimately prove to be incorrect or false. We caution you not to place undue reliance on forward-looking statements, which reflect our management's view only as of the date of this presentation. We undertake no obligation to update or revise forward-looking statements to reflect changed assumptions, the occurrence of unanticipated events or changes to future operating results. |
|
|
Factors that could cause actual results to differ materially from any forward-looking statements made in the presentation include but are not limited to: market and economic challenges experienced by the U.S. economy or real estate industry as a whole and the local economic conditions in the markets in which our properties are located; our ability to renew expiring leases and lease vacant spaces at favorable rates or at all; the inability of tenants to continue paying their rent obligations due to bankruptcy, insolvency or a general downturn in their business; the availability of cash flow from operating activities to fund distributions and capital expenditures; our ability to raise capital in the future by issuing additional equity or debt securities, selling our assets or otherwise to fund our future capital needs; our ability to strategically acquire or dispose of assets on favorable terms, or at all; our level of debt and the terms and limitations imposed on us by our debt agreements; our ability to retain our executive officers and other key personnel; conflicts of interest and competing demands faced by certain of our directors; unfavorable changes in laws or regulations impacting our business or our assets; and factors that could affect our ability to qualify as a real estate investment trust. The forward-looking statements should be read in light of these and other risk factors identified in the “Risk Factors” section of our Annual Report on Form 10-K for the year ended December 31, 2014, and our Quarterly Report on Form 10-Q for the quarter ended March 31, 2015, as filed with the Securities and Exchange Commission. Forward-Looking Statements |
|
|
Forward-Looking Statements CoStar Disclaimer The modeling, projections, analyses, and other forward-looking information prepared by CoStar Portfolio Strategy, LLC (“CoStar”) and presented herein are based on financial and other information from public and proprietary sources, as well as various assumptions concerning future events and circumstances that are speculative, uncertain and subject to change without notice. Actual results and events may differ materially from the projections presented. All CoStar materials set forth herein (“CoStar Materials”) speak only as of the date referenced and may have materially changed since such date. CoStar does not purport that the CoStar Materials herein are comprehensive, and, while they are believed to be accurate, the CoStar Materials are not guaranteed to be free from error, omission or misstatement. CoStar has no obligation to update any of the CoStar Materials included in this document. All CoStar Materials are provided “as is,” without any guarantees, representations or warranties of any kind, including implied warranties of merchantability, non-infringement, title and fitness for a particular purpose. To the maximum extent permitted by law, CoStar disclaims any and all liability in the event any CoStar Materials prove to be inaccurate, incomplete or unreliable. CoStar does not sponsor, endorse, offer or promote an investment in the securities of TIER REIT, Inc. You should not construe any of the CoStar Materials as investment, tax, accounting or legal advice. |
|
|
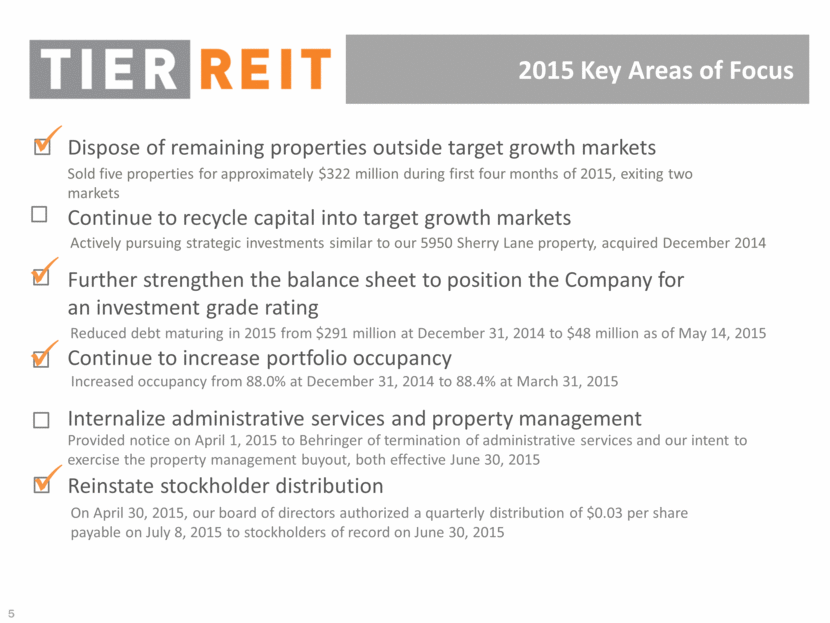
2015 Key Areas of Focus Continue to recycle capital into target growth markets Further strengthen the balance sheet to position the Company for an investment grade rating Continue to increase portfolio occupancy Dispose of remaining properties outside target growth markets Internalize administrative services and property management Reinstate stockholder distribution Sold five properties for approximately $322 million during first four months of 2015, exiting two markets Actively pursuing strategic investments similar to our 5950 Sherry Lane property, acquired December 2014 Reduced debt maturing in 2015 from $291 million at December 31, 2014 to $48 million as of May 14, 2015 Increased occupancy from 88.0% at December 31, 2014 to 88.4% at March 31, 2015 Provided notice on April 1, 2015 to Behringer of termination of administrative services and our intent to exercise the property management buyout, both effective June 30, 2015 On April 30, 2015, our board of directors authorized a quarterly distribution of $0.03 per share payable on July 8, 2015 to stockholders of record on June 30, 2015 |
|
|
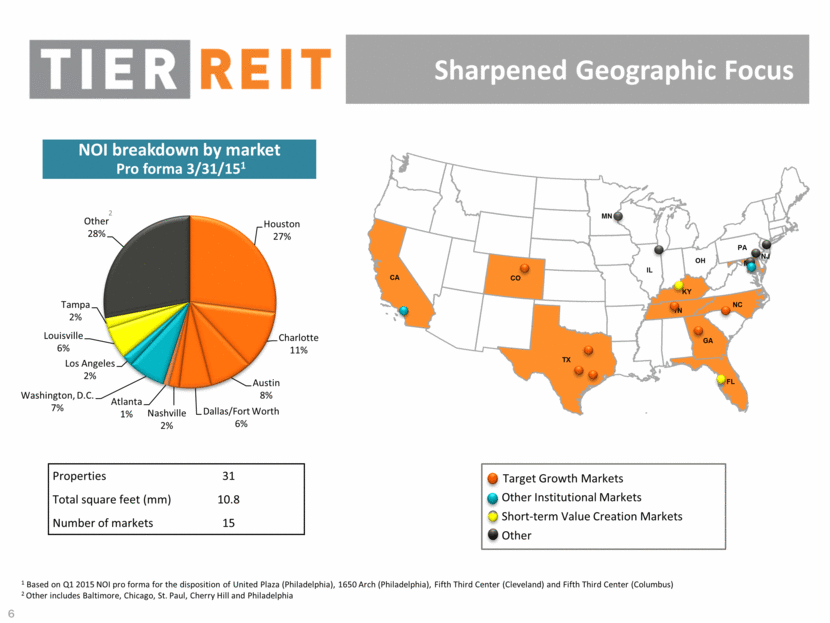
Sharpened Geographic Focus Target Growth Markets Other Institutional Markets Short-term Value Creation Markets Other NJ OH IL MN CA FL GA KY MD NC PA TN TX CO Properties 31 Total square feet (mm) 10.8 Number of markets 15 NOI breakdown by market Pro forma 3/31/151 1 Based on Q1 2015 NOI pro forma for the disposition of United Plaza (Philadelphia), 1650 Arch (Philadelphia), Fifth Third Center (Cleveland) and Fifth Third Center (Columbus) 2 Other includes Baltimore, Chicago, St. Paul, Cherry Hill and Philadelphia 2 Houston 27% Charlotte 11% Austin 8% Dallas/Fort Worth 6% Nashville 2% Atlanta 1% Washington, D.C. 7% Los Angeles 2% Louisville 6% Tampa 2% Other 28% |
|
|
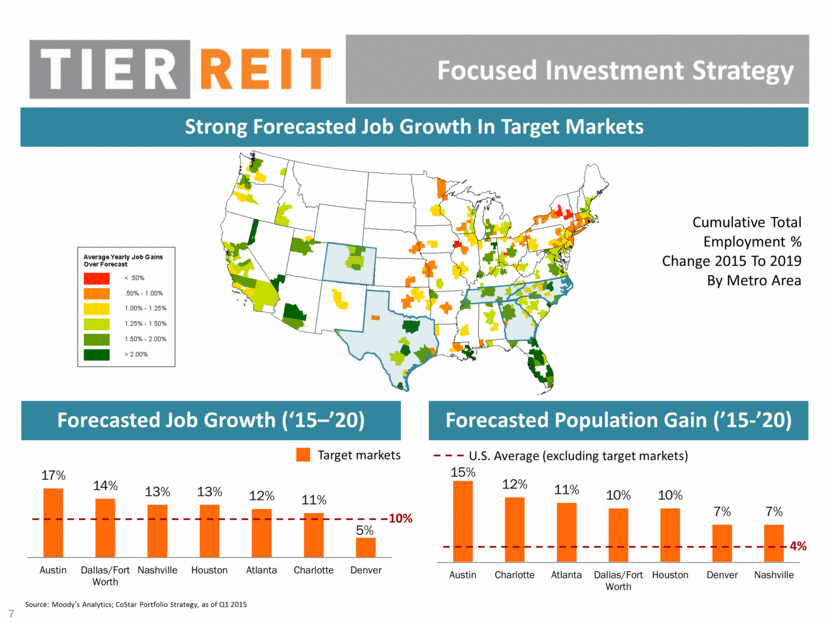
Source: Moody’s Analytics; CoStar Portfolio Strategy, as of Q1 2015 Cumulative Total Employment % Change 2015 To 2019 By Metro Area Focused Investment Strategy Forecasted Job Growth (‘15–’20) 10% U.S. Average (excluding target markets) Target markets Strong Forecasted Job Growth In Target Markets Forecasted Population Gain (’15-’20) 4% 17% 14% 13% 13% 12% 11% 5% Austin Dallas/Fort Worth Nashville Houston Atlanta Charlotte Denver 15% 12% 11% 10% 10% 7% 7% Austin Charlotte Atlanta Dallas/Fort Worth Houston Denver Nashville |
|
|
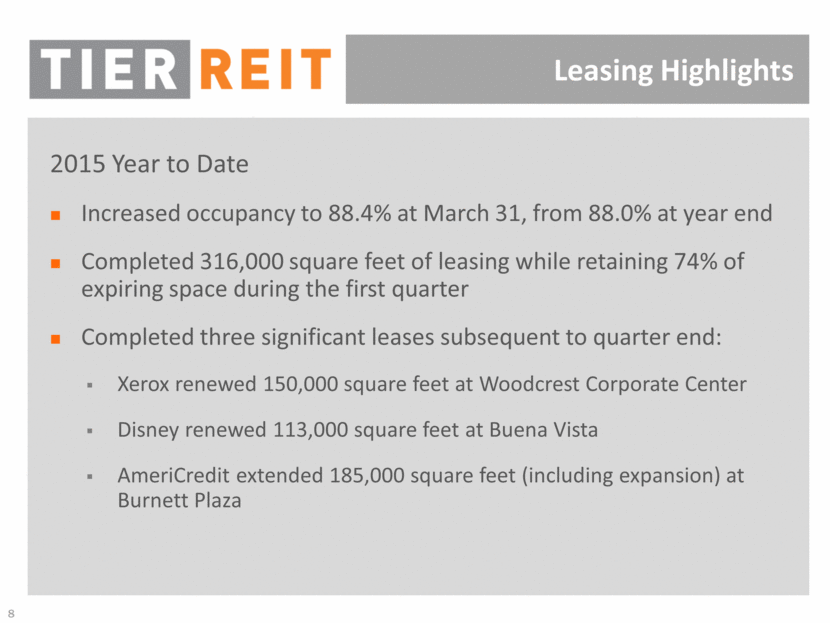
Leasing Highlights 2015 Year to Date Increased occupancy to 88.4% at March 31, from 88.0% at year end Completed 316,000 square feet of leasing while retaining 74% of expiring space during the first quarter Completed three significant leases subsequent to quarter end: Xerox renewed 150,000 square feet at Woodcrest Corporate Center Disney renewed 113,000 square feet at Buena Vista AmeriCredit extended 185,000 square feet (including expansion) at Burnett Plaza |
|
|
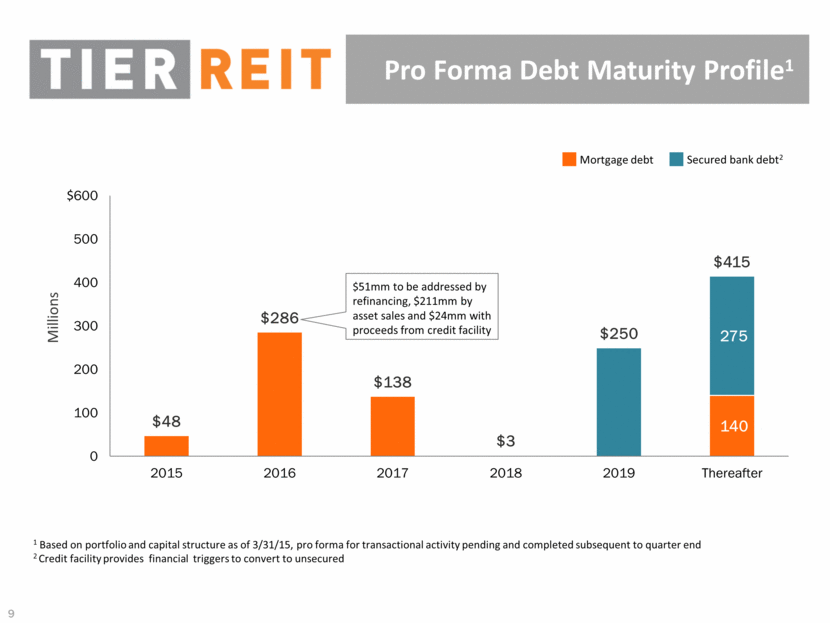
Pro Forma Debt Maturity Profile1 $51mm to be addressed by refinancing, $211mm by asset sales and $24mm with proceeds from credit facility Mortgage debt Secured bank debt2 $ 1 Based on portfolio and capital structure as of 3/31/15, pro forma for transactional activity pending and completed subsequent to quarter end 2 Credit facility provides financial triggers to convert to unsecured Millions 140 275 $48 $286 $138 $3 $250 $415 0 100 200 300 400 500 600 2015 2016 2017 2018 2019 Thereafter |
|
|
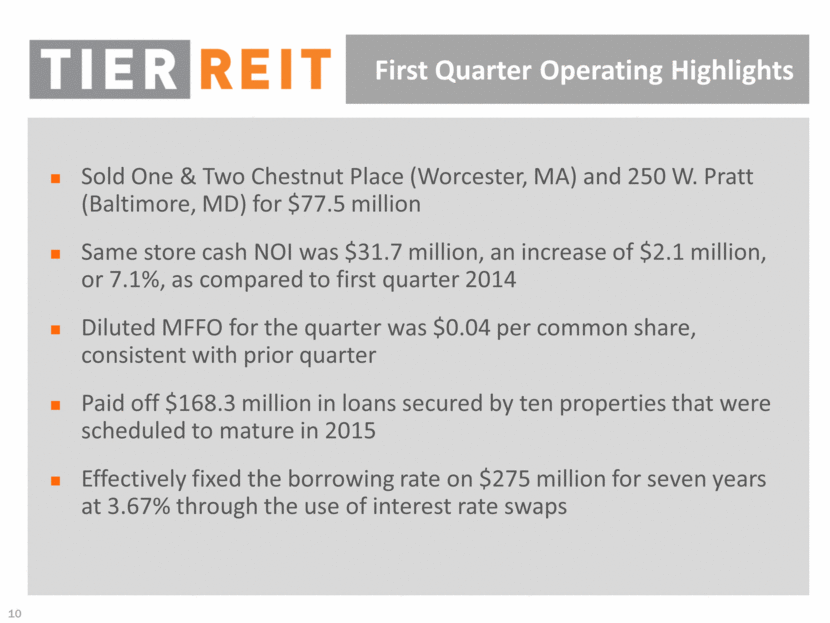
First Quarter Operating Highlights Sold One & Two Chestnut Place (Worcester, MA) and 250 W. Pratt (Baltimore, MD) for $77.5 million Same store cash NOI was $31.7 million, an increase of $2.1 million, or 7.1%, as compared to first quarter 2014 Diluted MFFO for the quarter was $0.04 per common share, consistent with prior quarter Paid off $168.3 million in loans secured by ten properties that were scheduled to mature in 2015 Effectively fixed the borrowing rate on $275 million for seven years at 3.67% through the use of interest rate swaps |
|
|
Positioned for Long-Term Success Focused investment strategy High-quality, Class A office portfolio Significant identifiable embedded growth Flexible balance sheet Experienced management team |
|
|
Playback Information An audio link for a playback of today’s call will be on our website at www.tierreit.com/ir Today’s presentation has been filed with the SEC on Form 8-K and is available on our website at www.tierreit.com/ir under the SEC Filings heading Please check our website for Second Quarter Conference Call details, and sign up at www.tierreit.com/ir for conference call information and other timely communications |
|
|
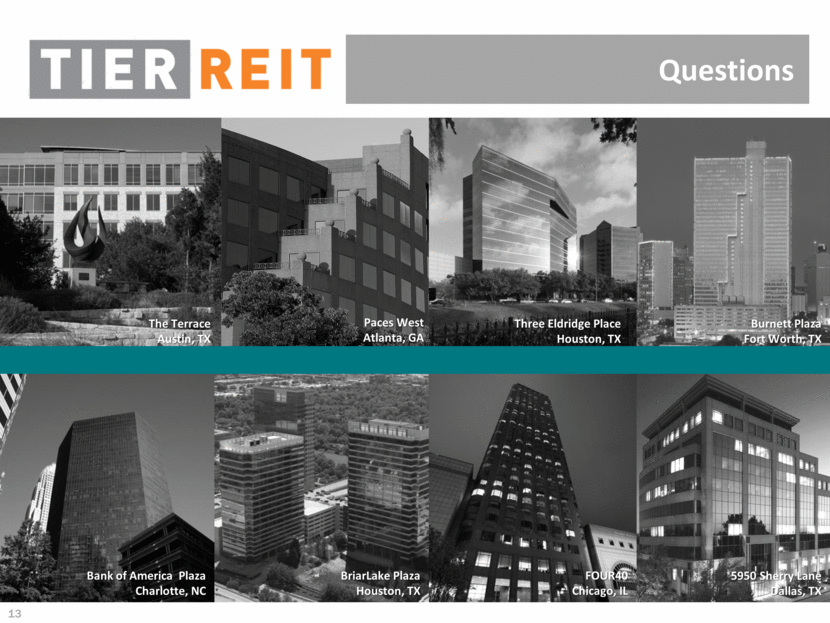
Questions Paces West Atlanta, GA The Terrace Austin, TX Burnett Plaza Fort Worth, TX Three Eldridge Place Houston, TX FOUR40 Chicago, IL 5950 Sherry Lane Dallas, TX BriarLake Plaza Houston, TX Bank of America Plaza Charlotte, NC |
|
|
Playback Information An audio link for a playback of today’s call will be on our website at www.tierreit.com/ir Today’s presentation has been filed with the SEC on Form 8-K and is available on our website at www.tierreit.com/ir under the SEC Filings heading Please check our website for Second Quarter Conference Call details, and sign up at www.tierreit.com/ir for conference call information and other timely communications |
Serious News for Serious Traders! Try StreetInsider.com Premium Free!
You May Also Be Interested In
- ZYUS Life Sciences Receives United States Patent No. 11,963,943 Covering Pain Management
- First BanCorp. Announces Earnings for the Quarter Ended March 31, 2024
- Canter Resources Commences 10-Hole Drill Program at the Columbus Lithium-Boron Project in Nevada
Create E-mail Alert Related Categories
SEC FilingsSign up for StreetInsider Free!
Receive full access to all new and archived articles, unlimited portfolio tracking, e-mail alerts, custom newswires and RSS feeds - and more!


 Tweet
Tweet Share
Share

