Form 8-K TIER REIT INC For: Jul 07
UNITED STATES
SECURITIES AND EXCHANGE COMMISSION
Washington, D.C. 20549
FORM 8-K
CURRENT REPORT
PURSUANT TO SECTION 13 OR 15(d) OF THE SECURITIES EXCHANGE ACT OF
1934
Date of Report (Date of earliest event reported): July 7, 2015
TIER REIT, Inc.
(Exact Name of Registrant as Specified in Its Charter)
|
Maryland |
|
000-51293 |
|
68-0509956 |
|
(State or other jurisdiction of incorporation |
|
(Commission File Number) |
|
(I.R.S. Employer |
17300 Dallas Parkway, Suite 1010, Dallas, Texas
75248
(Address of principal executive offices)
(Zip Code)
(972) 483-2400
(Registrant’s telephone number, including area code)
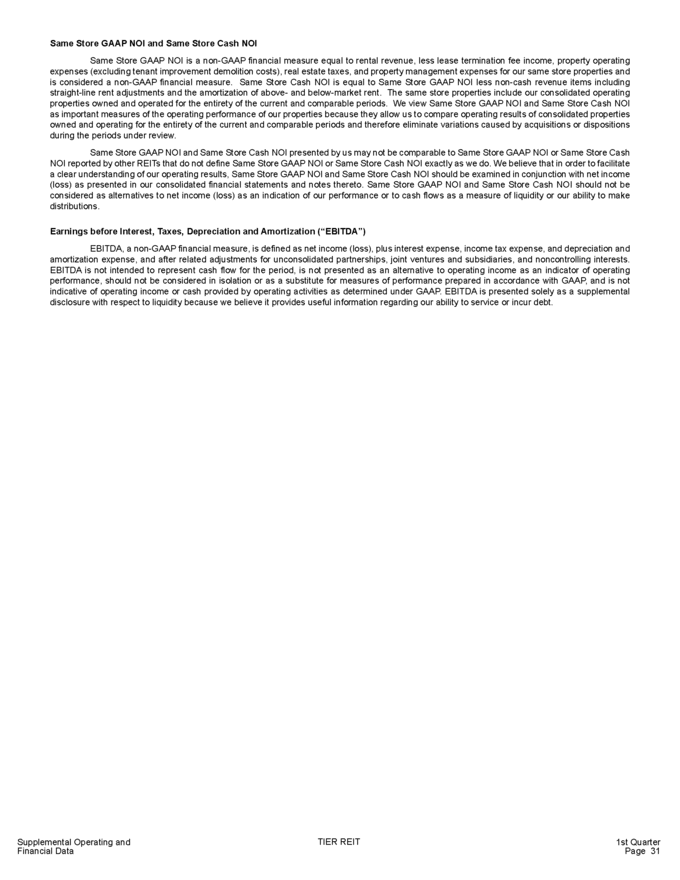
None
(Former name or former address, if changed since last report)
Check the appropriate box below if the Form 8-K filing is intended to simultaneously satisfy the filing obligation of the registrant under any of the following provisions:
o Written communications pursuant to Rule 425 under the Securities Act (17 CFR 230.425)
o Soliciting material pursuant to Rule 14a-12 under the Exchange Act (17 CFR 240.14a-12)
o Pre-commencement communications pursuant to Rule 14d-2(b) under the Exchange Act (17 CFR 240.14d-2(b))
x Pre-commencement communications pursuant to Rule 13e-4(c) under the Exchange Act (17 CFR 240.13e-4(c))
Item 2.02 Results of Operations and Financial Condition
On July 7, 2015, TIER REIT, Inc. (the “Company”) released supplemental information regarding its financial results and operations for the quarter ended March 31, 2015, by posting to its website its First Quarter 2015 Supplemental Operating and Financial Data, which is included as Exhibit 99.1 to this report and is incorporated herein by reference.
The information included in this Item 2.02, including Exhibit 99.1, is being furnished pursuant to Item 2.02 of Form 8-K and shall not be deemed “filed” for purposes of Section 18 of the Securities Exchange Act of 1934, as amended (the “Exchange Act”), or otherwise subject to liabilities of that section, nor shall the information be deemed incorporated by reference into any filing under the Securities Act of 1933, as amended (the “Securities Act”), or the Exchange Act.
Item 7.01 Regulation FD Disclosure
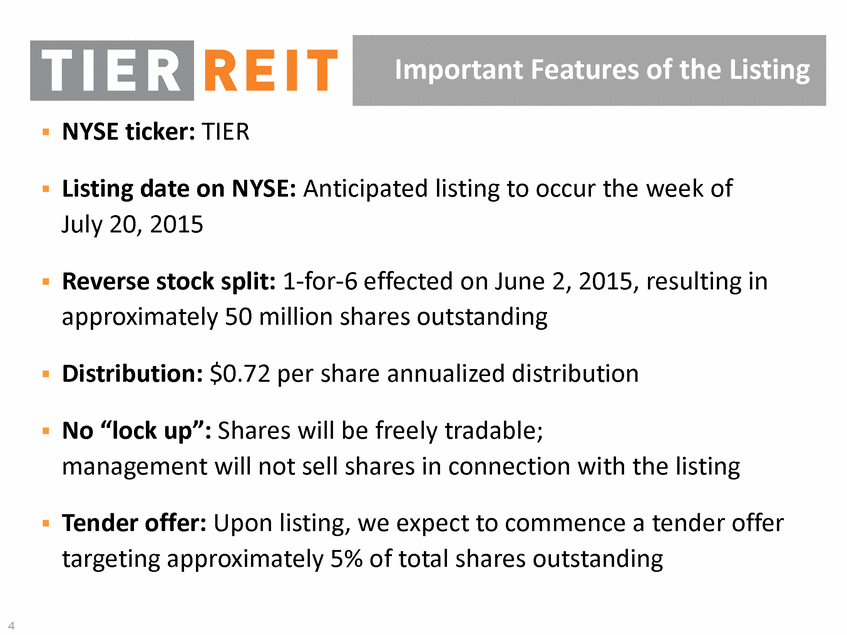
Attached to this Form 8-K as Exhibit 99.2 is a letter to stockholders issued by the Company on July 7, 2015, announcing the Company’s expectation to list its common stock on the New York Stock Exchange (the “NYSE”) under the ticker symbol “TIER” on or about July 23, 2015, with completion of the expected listing subject to certain conditions. A copy of the materials the Company intends to use in investor presentations beginning July 13, 2015, is attached to this Form 8-K as Exhibits 99.3 and 99.4. These materials and a video of a presentation to the investment community are available on the Company’s website at www.tierreit.com.
On July 7, 2015, the Company issued a press release with respect to the appointment of Richard I. Gilchrist as Chairman of the Board. A copy of the press release is attached as Exhibit 99.5 to this Form 8-K.
The information in this Item 7.01, including Exhibits 99.2, 99.3, 99.4 and 99.5, is being furnished pursuant to Item 7.01 of Form 8-K and shall not be deemed “filed” for purposes of Section 18 of the Exchange Act, or otherwise subject to the liabilities of that section, nor shall the information be deemed incorporated by reference in any filing under the Securities Act or the Exchange Act.
Item 8.01 Other Events
In conjunction with the expected NYSE listing on or about July 23, 2015, the Company also announced today that it expects to commence a modified “Dutch Auction” tender offer (subject to all appropriate filings with the Securities and Exchange Commission (the “SEC”)) to purchase shares of its common stock. The Company expects to allow stockholders to tender all or a portion of their shares, but if the tender offer is oversubscribed, shares will be accepted on a prorated basis. The Company anticipates funding the expected tender offer and all related fees and expenses with available cash and/or borrowings available under its existing credit facility. Tender offer documents with information about this expected tender offer, including detailed instructions on how to tender shares will be published and mailed to all stockholders of record when the tender offer commences.
Important Information
This Current Report on Form 8-K is for informational purposes only and is not an offer to buy or the solicitation of an offer to sell any securities of the Company. The tender offer will be made only pursuant to an offer to purchase, letter of transmittal and related materials that the Company intends to distribute to its stockholders and file with the SEC. The full details of the tender offer, including complete instructions on how to tender shares, will be included in the offer to purchase, the letter of transmittal and other related materials, which the Company will distribute to stockholders and file with the SEC upon commencement of the expected tender offer. If the tender offer is commenced as expected, stockholders will be urged to carefully read the offer to purchase, the letter of transmittal and other related materials when they become available, as they will contain important information, including the terms and conditions of the tender offer. If the tender offer is commenced as expected, stockholders will be able to obtain free copies of the offer to purchase, the letter of transmittal and other related materials that the Company files with the SEC at the SEC’s website at www.sec.gov or by calling the information agent for the contemplated tender offer, which will be identified in the materials filed with the SEC at the commencement of the expected tender offer. In addition, stockholders will be able to obtain free copies of the Company’s filings with the SEC from the Company’s website at www.tierreit.com/ir.
Forward Looking Statements
This Current Report on Form 8-K contains forward-looking statements relating to the business and financial outlook of TIER REIT, Inc. that are based on the Company’s current expectations, estimates, forecasts and projections and are not guarantees of future performance. These forward-looking statements include discussion and analysis of the financial condition of the Company and its subsidiaries, including its ability to rent space on favorable terms, its ability to address debt maturities and fund its capital requirements, its intentions to sell certain properties, the value of its assets, its anticipated capital expenditures, the amount and timing of any anticipated future cash distributions to its stockholders, and other matters. Words such as “may,” “anticipates,” “expects,” “intends,” “plans,” “believes,” “seeks,” “estimates,” “would,” “could,” “should,” “objectives,” “strategies,” “goals,” and variations of these words and similar expressions are intended to identify forward-looking statements. Actual results may differ materially from those expressed in these forward-looking statements, and stockholders should not place undue reliance on any such statements. Factors that could cause actual results to vary materially from those expressed in forward-looking statements include changes in real estate conditions and in the capital markets, the Company’s ability to complete the listing of its shares of common stock on the NYSE in a timely manner or at all, the Company’s ability to complete the anticipated tender offer in a timely manner or at all, the price at which shares of the Company’s common stock may trade on the NYSE, which may be higher or lower than the purchase price in the anticipated tender offer, as well as the risk factors included in the Company’s Annual Report on Form 10-K for the fiscal year ended December 31, 2014 and Quarterly Report on Form 10-Q for the fiscal quarter ended March 31, 2015. Forward-looking statements in this Current Report on Form 8-K speak only as of the date on which such statements were made, and the Company undertakes no obligation to update any such statements that may become untrue because of subsequent events.
Item 9.01 Financial Statements and Exhibits
(d) Exhibits.
|
Exhibit No. |
|
Description |
|
|
|
|
|
99.1 |
|
Supplemental Operating and Financial Data for the quarter ended March 31, 2015 |
|
99.2 |
|
Letter to Stockholders, dated July 7, 2015 |
|
99.3 |
|
Investor Presentation |
|
99.4 |
|
Portfolio Summary |
|
99.5 |
|
Press Release, dated July 7, 2015 |
SIGNATURE
Pursuant to the requirements of the Securities Exchange Act of 1934, the Registrant has duly caused this report to be signed on its behalf by the undersigned thereunto duly authorized.
|
|
TIER REIT, INC. | |
|
|
|
|
|
|
|
|
|
Dated: July 7, 2015 |
By: |
/s/ Telisa Webb Schelin |
|
|
|
Telisa Webb Schelin |
|
|
|
Chief Legal Officer, Executive Vice President |
|
|
|
& Secretary |
Exhibit Index
|
Exhibit No. |
|
Description |
|
|
|
|
|
99.1 |
|
Supplemental Operating and Financial Data for the quarter ended March 31, 2015 |
|
99.2 |
|
Letter to Stockholders, dated July 7, 2015 |
|
99.3 |
|
Investor Presentation |
|
99.4 |
|
Portfolio Summary |
|
99.5 |
|
Press Release, dated July 7, 2015 |
|
|
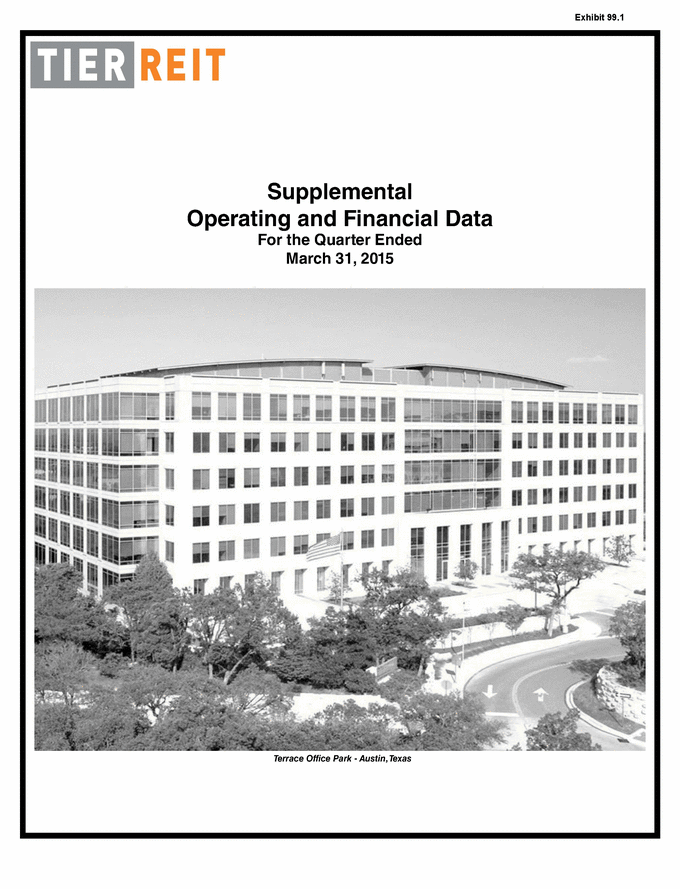
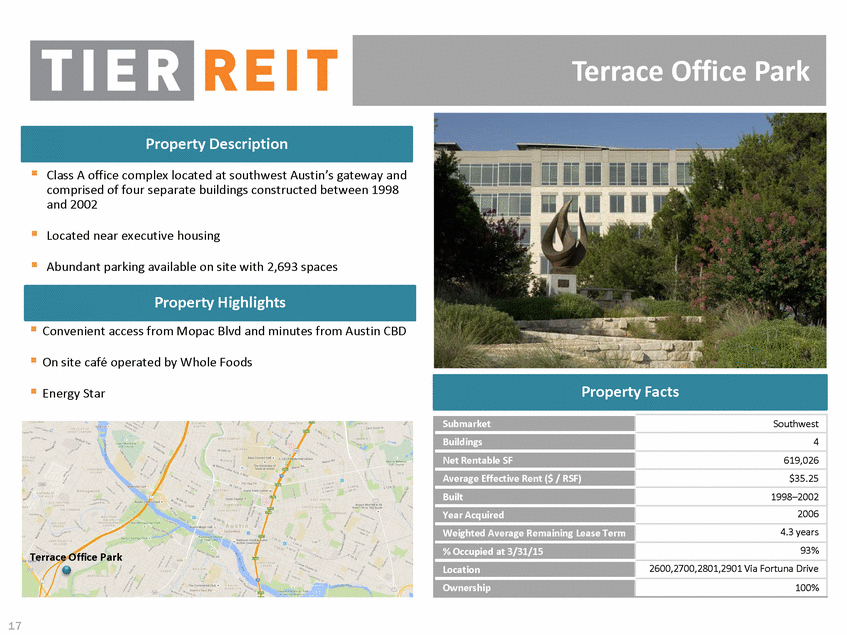
Exhibit 99.1 Supplemental Operating and Financial Data For the Quarter Ended March 31, 2015 Terrace Office Park - Austin, Texas |
|
|
Supplemental Operating and Financial Data For the Quarter Ended March 31, 2015 About the Company TIER REIT, Inc. is a self-managed, Dallas, Texas-based real estate investment trust whose goal is to maximize total return to stockholders through the combination of stock appreciation and income derived from a sustainable distribution. TIER’s investment strategy is to acquire, develop, and operate a portfolio of best-in-class office properties in select markets across the U.S. that consistently lead the nation in population and office-using employment growth. As of March 31, 2015, we owned interests in 34 operating office properties, one recently developed non-operating office property and one retail property, located in 17 markets throughout the United States with a total of 14.1 million rentable square feet. Senior Management Scott W. FordhamChief Executive Officer and President Dallas E. LucasChief Financial Officer and Treasurer William J. ReisterChief Investment Officer and Executive Vice President Telisa Webb SchelinChief Legal Officer, Executive Vice President and Secretary James E. SharpChief Accounting Officer and Executive Vice President Where to Get More Information: Kelly SargentVice President - Investor Relations By Phone: (972) 483-2400 By Email: [email protected] By Mail: 17300 Dallas Parkway, Suite 1010 Dallas, Texas 75248 after August 31, 2015, please contact us at our new address: 5950 Sherry Lane, Suite 700 Dallas, Texas 75225 Website: www.tierreit.com |
|
|
Supplemental Operating and Financial Data For the Quarter Ended March 31, 2015 Table of Contents: Overview and Highlights Overview .................................................................................................................1 Financial Highlights .................................................................................................2-3 Consolidated Balance Sheets .................................................................................4 Consolidated Statements of Operations .................................................................5 Consolidated Statements of Discontinued Operations ............................................6 Calculation of FFO, MFFO, and FAD ......................................................................7 Calculation of EBITDA ............................................................................................8 Joint Venture Financial Summary ...........................................................................9 Same Store Analysis ...............................................................................................10 Schedule of Properties Owned ...............................................................................11 Net Operating Income by Market ............................................................................12 Net Asset Value Summary ......................................................................................13 Selected Non-Stabilized Properties ........................................................................14 Significant Tenants ..................................................................................................15 Industry Diversification ............................................................................................16 Leasing Leasing Activity .......................................................................................................17-18 Lease Expirations ...................................................................................................19-20 Occupancy Trends ..................................................................................................21 Capital Expenditures Leasing Cost Analysis .............................................................................................22 Leasing Cost Trend Analysis...................................................................................23 Development, Leasing, and Capital Expenditures Summary ..................................24 Other Information Summary of Land Held for Future Development .....................................................25 Acquisition and Disposition Activities ......................................................................26 Summary of Financing ............................................................................................27 Principal Payments by Year ....................................................................................28 Definitions of Non-GAAP Financial Measures ........................................................29-31 Forward Looking Statements This supplemental operating and financial data report contains forward-looking statements relating to the business and financial outlook of TIER REIT, Inc. that are based on current expectations, estimates, forecasts and projections and are not guarantees of future performance. Statements contained herein may be impacted by a number of risks and uncertainties, including the company’s ability to rent space on favorable terms, its ability to address debt maturities and fund its capital requirements, the value of its assets, its anticipated capital expenditures, and other matters. Actual results may differ materially from those expressed in these forward-looking statements, and you should not place undue reliance on any such statements. A number of important factors could cause actual results to differ materially from the forward-looking statements contained in this document, as well as other factors described in the Risk Factors section of TIER REIT, Inc.’s Annual Report on Form 10-K for the year ended December 31, 2014 and subsequent Quarterly Report on Form 10-Q for the quarter ended March 31, 2015. Forward-looking statements in this document speak only as of the date on which such statements were made, and we undertake no obligation to update any such statements that may become untrue because of subsequent events. |
|
|
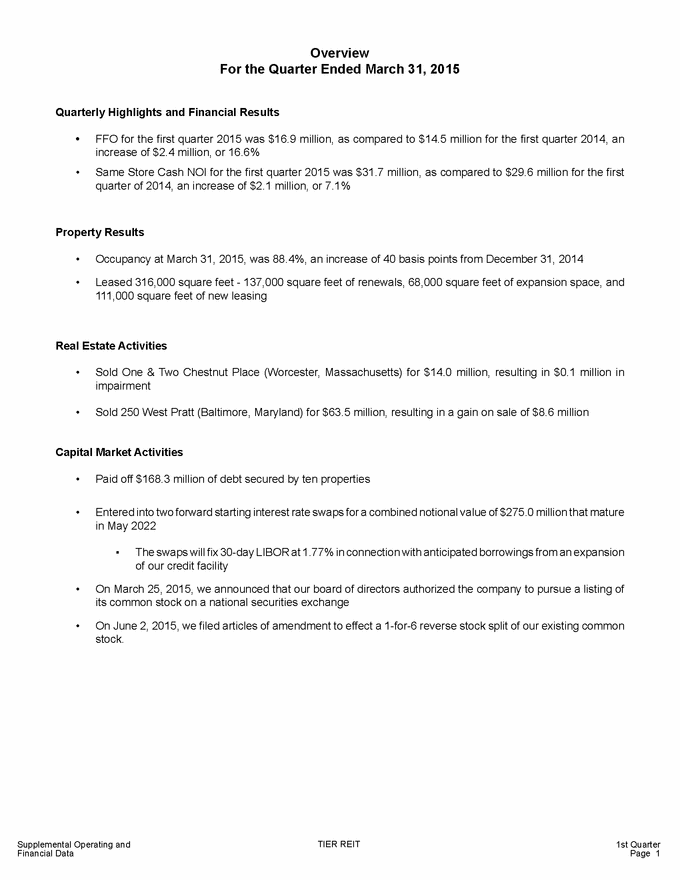
Overview For the Quarter Ended March 31, 2015 Quarterly Highlights and Financial Results • FFO for the first quarter 2015 was $16.9 million, as compared to $14.5 million for the first quarter 2014, an increase of $2.4 million, or 16.6% Same Store Cash NOI for the first quarter 2015 was $31.7 million, as compared to $29.6 million for the first quarter of 2014, an increase of $2.1 million, or 7.1% • Property Results • Occupancy at March 31, 2015, was 88.4%, an increase of 40 basis points from December 31, 2014 • Leased 316,000 square feet - 137,000 square feet of renewals, 68,000 square feet of expansion space, and 111,000 square feet of new leasing Real Estate Activities • Sold One & Two Chestnut Place (Worcester, Massachusetts) for $14.0 million, resulting in $0.1 million in impairment • Sold 250 West Pratt (Baltimore, Maryland) for $63.5 million, resulting in a gain on sale of $8.6 million Capital Market Activities • Paid off $168.3 million of debt secured by ten properties • Entered into two forward starting interest rate swaps for a combined notional value of $275.0 million that mature in May 2022 The swaps will fix 30-day LIBOR at 1.77% in connection with anticipated borrowings from an expansion of our credit facility • On March 25, 2015, we announced that our board of directors authorized the company to pursue a listing of its common stock on a national securities exchange • On June 2, 2015, we filed articles of amendment to effect a 1-for-6 reverse stock split of our existing common stock. Supplemental Operating and Financial Data TIER REIT 1st Quarter Page 1 |
|
|
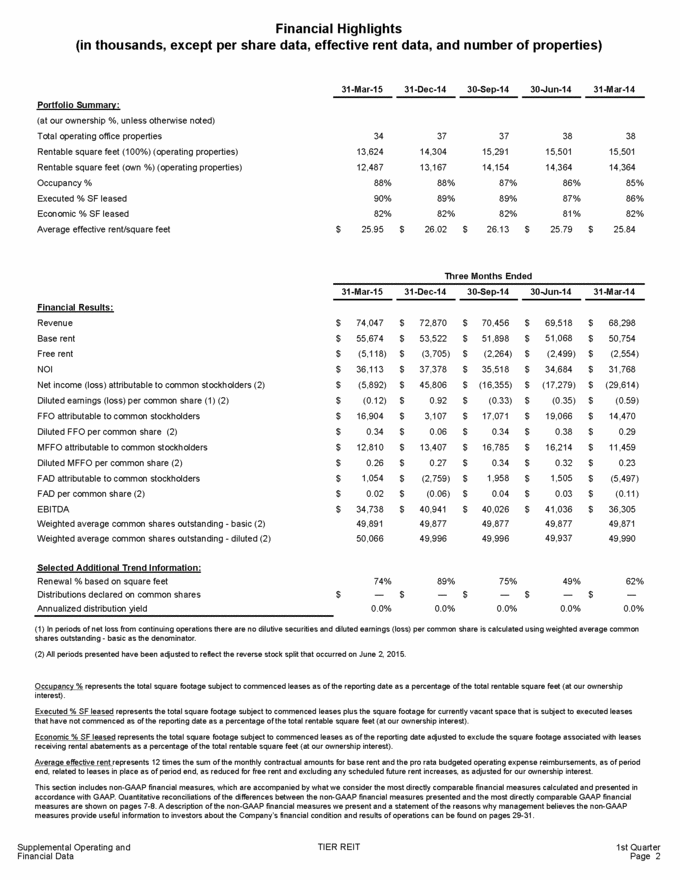
Financial Highlights (in thousands, except per share data, effective rent data, and number of properties) 31-Mar-15 31-Dec-14 30-Sep-14 30-Jun-14 31-Mar-14 Portfolio Summary: (at our ownership %, unless otherwise noted) Total operating office properties Rentable square feet (100%) (operating properties) Rentable square feet (own %) (operating properties) Occupancy % Executed % SF leased Economic % SF leased Average effective rent/square feet 34 13,624 12,487 88% 90% 82% 25.95 37 14,304 13,167 88% 89% 82% 26.02 37 15,291 14,154 87% 89% 82% 26.13 38 15,501 14,364 86% 87% 81% 25.79 38 15,501 14,364 85% 86% 82% 25.84 $ $ $ $ $ Three Months Ended 31-Mar-15 31-Dec-14 30-Sep-14 30-Jun-14 31-Mar-14 Financial Results: Revenue Base rent Free rent NOI Net income (loss) attributable to common stockholders (2) Diluted earnings (loss) per common share (1) (2) FFO attributable to common stockholders Diluted FFO per common share (2) MFFO attributable to common stockholders Diluted MFFO per common share (2) FAD attributable to common stockholders FAD per common share (2) EBITDA Weighted average common shares outstanding - basic (2) Weighted average common shares outstanding - diluted (2) $ $ $ $ $ $ $ $ $ $ $ $ $ 74,047 55,674 (5,118) 36,113 (5,892) (0.12) 16,904 0.34 12,810 0.26 1,054 0.02 34,738 49,891 50,066 $ $ $ $ $ $ $ $ $ $ $ $ $ 72,870 53,522 (3,705) 37,378 45,806 0.92 3,107 0.06 13,407 0.27 (2,759) (0.06) 40,941 49,877 49,996 $ $ $ $ $ $ $ $ $ $ $ $ $ 70,456 51,898 (2,264) 35,518 (16,355) (0.33) 17,071 0.34 16,785 0.34 1,958 0.04 40,026 49,877 49,996 $ $ $ $ $ $ $ $ $ $ $ $ $ 69,518 51,068 (2,499) 34,684 (17,279) (0.35) 19,066 0.38 16,214 0.32 1,505 0.03 41,036 49,877 49,937 $ $ $ $ $ $ $ $ $ $ $ $ $ 68,298 50,754 (2,554) 31,768 (29,614) (0.59) 14,470 0.29 11,459 0.23 (5,497) (0.11) 36,305 49,871 49,990 Selected Additional Trend Information: Renewal % based on square feet Distributions declared on common shares Annualized distribution yield 74% — 0.0% 89% — 0.0% 75% — 0.0% 49% — 0.0% 62% — 0.0% $ $ $ $ $ (1) In periods of net loss from continuing operations there are no dilutive securities and diluted earnings (loss) per common share is calculated using weighted average common shares outstanding - basic as the denominator. (2) All periods presented have been adjusted to reflect the reverse stock split that occurred on June 2, 2015. Occupancy % represents the total square footage subject to commenced leases as of the reporting date as a percentage of the total rentable square feet (at our ownership interest). Executed % SF leased represents the total square footage subject to commenced leases plus the square footage for currently vacant space that is subject to executed leases that have not commenced as of the reporting date as a percentage of the total rentable square feet (at our ownership interest). Economic % SF leased represents the total square footage subject to commenced leases as of the reporting date adjusted to exclude the square footage associated with leases receiving rental abatements as a percentage of the total rentable square feet (at our ownership interest). Average effective rent represents 12 times the sum of the monthly contractual amounts for base rent and the pro rata budgeted operating expense reimbursements, as of period end, related to leases in place as of period end, as reduced for free rent and excluding any scheduled future rent increases, as adjusted for our ownership interest. This section includes non-GAAP financial measures, which are accompanied by what we consider the most directly comparable financial measures calculated and presented in accordance with GAAP. Quantitative reconciliations of the differences between the non-GAAP financial measures presented and the most directly comparable GAAP financial measures are shown on pages 7-8. A description of the non-GAAP financial measures we present and a statement of the reasons why management believes the non-GAAP measures provide useful information to investors about the Company’s financial condition and results of operations can be found on pages 29-31. TIER REIT Supplemental Operating and Financial Data 1st Quarter Page 2 |
|
|
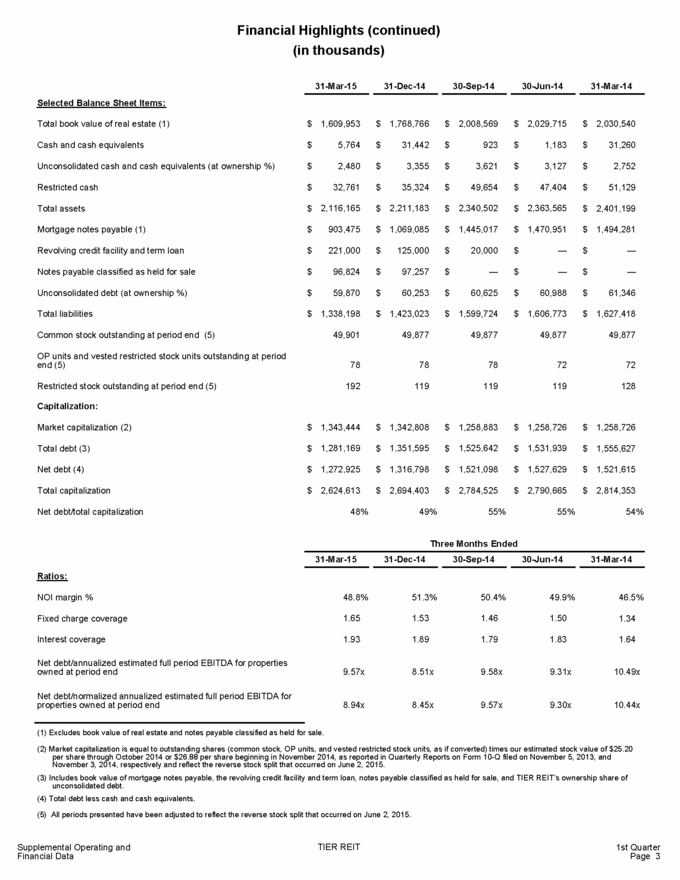
Financial Highlights (continued) (in thousands) 31-Mar-15 31-Dec-14 30-Sep-14 30-Jun-14 31-Mar-14 Selected Balance Sheet Items: Total book value of real estate (1) $ 1,609,953 $ 1,768,766 $ 2,008,569 $ 2,029,715 $ 2,030,540 Cash and cash equivalents $ 5,764 $ 31,442 $ 923 $ 1,183 $ 31,260 Unconsolidated cash and cash equivalents (at ownership %) $ 2,480 $ 3,355 $ 3,621 $ 3,127 $ 2,752 Restricted cash $ 32,761 $ 35,324 $ 49,654 $ 47,404 $ 51,129 Total assets $ 2,116,165 $ 2,211,183 $ 2,340,502 $ 2,363,565 $ 2,401,199 Mortgage notes payable (1) $ 903,475 $ 1,069,085 $ 1,445,017 $ 1,470,951 $ 1,494,281 Revolving credit facility and term loan $ 221,000 $ 125,000 $ 20,000 $ — $ — Notes payable classified as held for sale $ 96,824 $ 97,257 $ — $ — $ — Unconsolidated debt (at ownership %) $ 59,870 $ 60,253 $ 60,625 $ 60,988 $ 61,346 Total liabilities $ 1,338,198 $ 1,423,023 $ 1,599,724 $ 1,606,773 $ 1,627,418 Common stock outstanding at period end (5) 49,901 49,877 49,877 49,877 49,877 OP units and vested restricted stock units outstanding at period end (5) 78 78 78 72 72 Restricted stock outstanding at period end (5) 192 119 119 119 128 Capitalization: Market capitalization (2) $ 1,343,444 $ 1,342,808 $ 1,258,883 $ 1,258,726 $ 1,258,726 Total debt (3) $ 1,281,169 $ 1,351,595 $ 1,525,642 $ 1,531,939 $ 1,555,627 Net debt (4) $ 1,272,925 $ 1,316,798 $ 1,521,098 $ 1,527,629 $ 1,521,615 Total capitalization $ 2,624,613 $ 2,694,403 $ 2,784,525 $ 2,790,665 $ 2,814,353 Net debt/total capitalization 48% 49% 55% 55% 54% Three Months Ended 31-Mar-15 31-Dec-14 30-Sep-14 30-Jun-14 31-Mar-14 Ratios: NOI margin % 48.8% 51.3% 50.4% 49.9% 46.5% Fixed charge coverage 1.65 1.53 1.46 1.50 1.34 Interest coverage 1.93 1.89 1.79 1.83 1.64 Net debt/annualized estimated full period EBITDA for properties owned at period end 9.57x 8.51x 9.58x 9.31x 10.49x Net debt/normalized annualized estimated full period EBITDA for properties owned at period end 8.94x 8.45x 9.57x 9.30x 10.44x (1) Excludes book value of real estate and notes payable classified as held for sale. (2) Market capitalization is equal to outstanding shares (common stock, OP units, and vested restricted stock units, as if converted) times our estimated stock value of $25.20 per share through October 2014 or $26.88 per share beginning in November 2014, as reported in Quarterly Reports on Form 10-Q filed on November 5, 2013, and November 3, 2014, respectively and reflect the reverse stock split that occurred on June 2, 2015. (3) Includes book value of mortgage notes payable, the revolving credit facility and term loan, notes payable classified as held for sale, and TIER REIT’s ownership share of unconsolidated debt. (4) Total debt less cash and cash equivalents. (5) All periods presented have been adjusted to reflect the reverse stock split that occurred on June 2, 2015. TIER REIT Supplemental Operating and Financial Data 1st Quarter Page 3 |
|
|
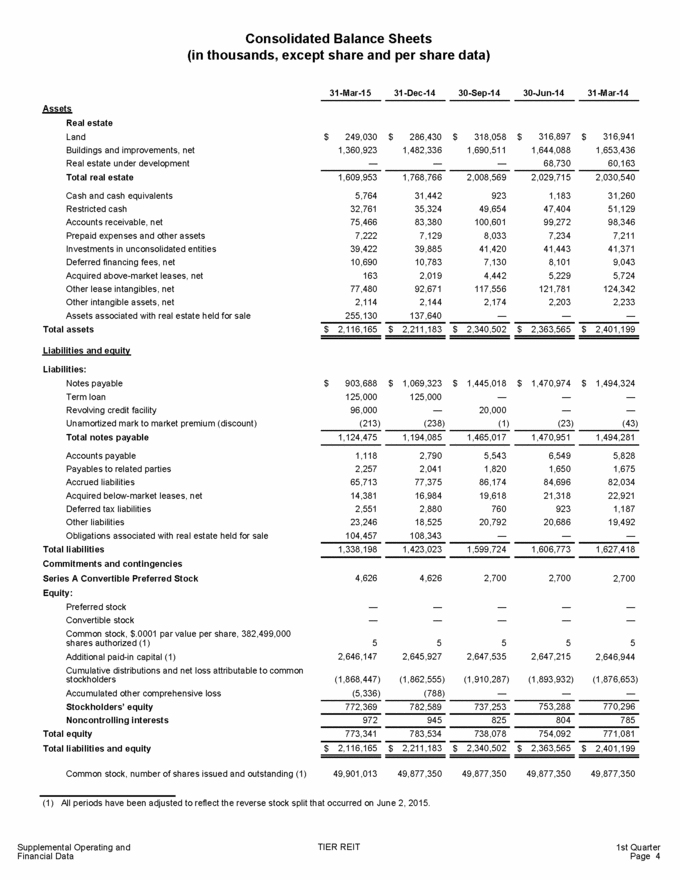
Consolidated Balance Sheets (in thousands, except share and per share data) 31-Mar-15 31-Dec-14 30-Sep-14 30-Jun-14 31-Mar-14 Assets Real estate Land Buildings and improvements, net Real estate under development Total real estate Cash and cash equivalents Restricted cash Accounts receivable, net Prepaid expenses and other assets Investments in unconsolidated entities Deferred financing fees, net Acquired above-market leases, net Other lease intangibles, net Other intangible assets, net Assets associated with real estate held for sale Total assets $ 249,030 1,360,923 — $ 286,430 1,482,336 — $ 318,058 1,690,511 — $ 316,897 1,644,088 68,730 $ 316,941 1,653,436 60,163 1,609,953 5,764 32,761 75,466 7,222 39,422 10,690 163 77,480 2,114 255,130 1,768,766 31,442 35,324 83,380 7,129 39,885 10,783 2,019 92,671 2,144 137,640 2,008,569 923 49,654 100,601 8,033 41,420 7,130 4,442 117,556 2,174 — 2,029,715 1,183 47,404 99,272 7,234 41,443 8,101 5,229 121,781 2,203 — 2,030,540 31,260 51,129 98,346 7,211 41,371 9,043 5,724 124,342 2,233 — $ 2,116,165 $ 2,211,183 $ 2,340,502 $ 2,363,565 $ 2,401,199 Liabilities and equity Liabilities: Notes payable Term loan Revolving credit facility Unamortized mark to market premium (discount) Total notes payable Accounts payable Payables to related parties Accrued liabilities Acquired below-market leases, net Deferred tax liabilities Other liabilities Obligations associated with real estate held for sale Total liabilities Commitments and contingencies Series A Convertible Preferred Stock Equity: Preferred stock Convertible stock Common stock, $.0001 par value per share, 382,499,000 shares authorized (1) Additional paid-in capital (1) Cumulative distributions and net loss attributable to common stockholders Accumulated other comprehensive loss Stockholders’ equity Noncontrolling interests Total equity Total liabilities and equity $ 903,688 125,000 96,000 (213) $ 1,069,323 125,000 — (238) $ 1,445,018 — 20,000 (1) $ 1,470,974 — — (23) $ 1,494,324 — — (43) 1,124,475 1,194,085 1,465,017 1,470,951 1,494,281 1,118 2,257 65,713 14,381 2,551 23,246 104,457 2,790 2,041 77,375 16,984 2,880 18,525 108,343 5,543 1,820 86,174 19,618 760 20,792 — 6,549 1,650 84,696 21,318 923 20,686 — 5,828 1,675 82,034 22,921 1,187 19,492 — 1,338,198 1,423,023 1,599,724 1,606,773 1,627,418 4,626 4,626 2,700 2,700 2,700 — — — — — — — — — — 5 2,646,147 5 2,645,927 5 2,647,535 5 2,647,215 5 2,646,944 (1,868,447) (5,336) (1,862,555) (788) (1,910,287) — (1,893,932) — (1,876,653) — 772,369 782,589 737,253 753,288 770,296 972 945 825 804 785 773,341 783,534 738,078 754,092 771,081 $ 2,116,165 $ 2,211,183 $ 2,340,502 $ 2,363,565 $ 2,401,199 Common stock, number of shares issued and outstanding (1) 49,901,013 49,877,350 49,877,350 49,877,350 49,877,350 (1) All periods have been adjusted to reflect the reverse stock split that occurred on June 2, 2015. TIER REIT Supplemental Operating and Financial Data 1st Quarter Page 4 |
|
|
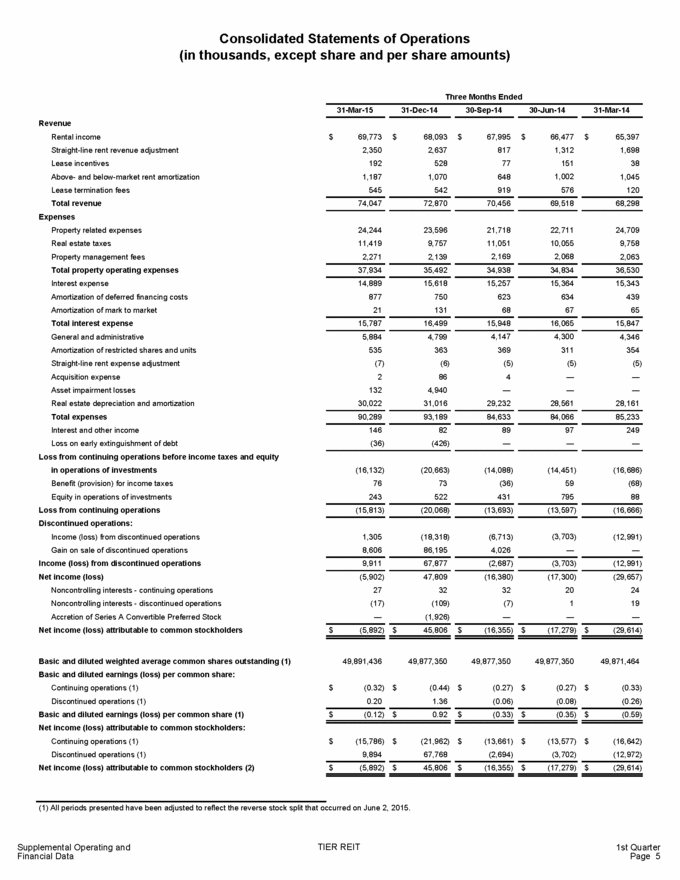
Consolidated Statements of Operations (in thousands, except share and per share amounts) Three Months Ended 31-Mar-15 31-Dec-14 30-Sep-14 30-Jun-14 31-Mar-14 Revenue Rental income Straight-line rent revenue adjustment Lease incentives Above-and below-market rent amortization Lease termination fees Total revenue Expenses Property related expenses Real estate taxes Property management fees Total property operating expenses Interest expense Amortization of deferred financing costs Amortization of mark to market Total interest expense General and administrative Amortization of restricted shares and units Straight-line rent expense adjustment Acquisition expense Asset impairment losses Real estate depreciation and amortization Total expenses Interest and other income Loss on early extinguishment of debt Loss from continuing operations before income taxes and equity in operations of investments Benefit (provision) for income taxes Equity in operations of investments Loss from continuing operations Discontinued operations: Income (loss) from discontinued operations Gain on sale of discontinued operations Income (loss) from discontinued operations Net income (loss) Noncontrolling interests - continuing operations Noncontrolling interests - discontinued operations Accretion of Series A Convertible Preferred Stock Net income (loss) attributable to common stockholders $ 69,773 2,350 192 1,187 545 $ 68,093 2,637 528 1,070 542 $ 67,995 817 77 648 919 $ 66,477 1,312 151 1,002 576 $ 65,397 1,698 38 1,045 120 74,047 72,870 70,456 69,518 68,298 24,244 11,419 2,271 23,596 9,757 2,139 21,718 11,051 2,169 22,711 10,055 2,068 24,709 9,758 2,063 37,934 35,492 34,938 34,834 36,530 14,889 877 21 15,618 750 131 15,257 623 68 15,364 634 67 15,343 439 65 15,787 16,499 15,948 16,065 15,847 5,884 535 (7) 2 132 30,022 4,799 363 (6) 86 4,940 31,016 4,147 369 (5) 4 — 29,232 4,300 311 (5) — — 28,561 4,346 354 (5) — — 28,161 90,289 93,189 84,633 84,066 85,233 146 (36) 82 (426) 89 — 97 — 249 — (16,132) 76 243 (20,663) 73 522 (14,088) (36) 431 (14,451) 59 795 (16,686) (68) 88 (15,813) (20,068) (13,693) (13,597) (16,666) 1,305 8,606 (18,318) 86,195 (6,713) 4,026 (3,703) — (12,991) — 9,911 67,877 (2,687) (3,703) (12,991) (5,902) 27 (17) — 47,809 32 (109) (1,926) (16,380) 32 (7) — (17,300) 20 1 — (29,657) 24 19 — $ (5,892) $ 45,806 $ (16,355) $ (17,279) $ (29,614) Basic and diluted weighted average common shares outstanding (1) Basic and diluted earnings (loss) per common share: Continuing operations (1) Discontinued operations (1) Basic and diluted earnings (loss) per common share (1) Net income (loss) attributable to common stockholders: Continuing operations (1) Discontinued operations (1) Net income (loss) attributable to common stockholders (2) 49,891,436 49,877,350 49,877,350 49,877,350 49,871,464 $ (0.32) 0.20 $ (0.44) 1.36 $ (0.27) (0.06) $ (0.27) (0.08) $ (0.33) (0.26) $ (0.12) $ 0.92 $ (0.33) $ (0.35) $ (0.59) $ (15,786) 9,894 $ (21,962) 67,768 $ (13,661) (2,694) $ (13,577) (3,702) $ (16,642) (12,972) $ (5,892) $ 45,806 $ (16,355) $ (17,279) $ (29,614) (1) All periods presented have been adjusted to reflect the reverse stock split that occurred on June 2, 2015. TIER REIT Supplemental Operating and Financial Data 1st Quarter Page 5 |
|
|
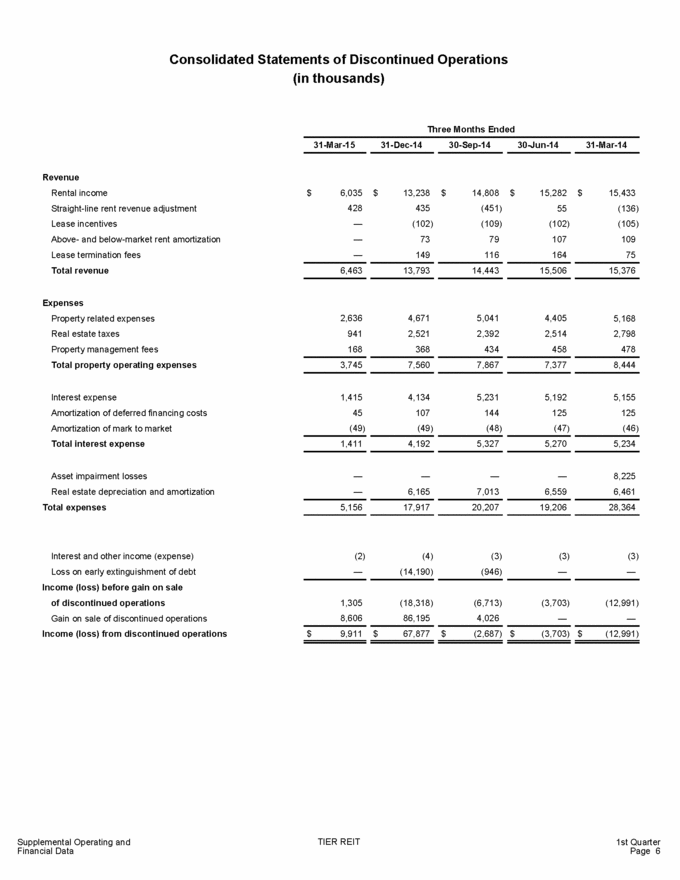
Consolidated Statements of Discontinued Operations (in thousands) Three Months Ended 31-Mar-15 31-Dec-14 30-Sep-14 30-Jun-14 31-Mar-14 Revenue Rental income Straight-line rent revenue adjustment Lease incentives Above-and below-market rent amortization Lease termination fees Total revenue $ 6,035 428 — — — $ 13,238 435 (102) 73 149 $ 14,808 (451) (109) 79 116 $ 15,282 55 (102) 107 164 $ 15,433 (136) (105) 109 75 6,463 13,793 14,443 15,506 15,376 Expenses Property related expenses Real estate taxes Property management fees Total property operating expenses 2,636 941 168 4,671 2,521 368 5,041 2,392 434 4,405 2,514 458 5,168 2,798 478 3,745 7,560 7,867 7,377 8,444 Interest expense Amortization of deferred financing costs Amortization of mark to market Total interest expense 1,415 45 (49) 4,134 107 (49) 5,231 144 (48) 5,192 125 (47) 5,155 125 (46) 1,411 4,192 5,327 5,270 5,234 Asset impairment losses Real estate depreciation and amortization Total expenses — — — 6,165 — 7,013 — 6,559 8,225 6,461 5,156 17,917 20,207 19,206 28,364 Interest and other income (expense) Loss on early extinguishment of debt Income (loss) before gain on sale of discontinued operations Gain on sale of discontinued operations Income (loss) from discontinued operations (2) — (4) (14,190) (3) (946) (3) — (3) — 1,305 8,606 (18,318) 86,195 (6,713) 4,026 (3,703) — (12,991) — $ 9,911 $ 67,877 $ (2,687) $ (3,703) $ (12,991) Supplemental Operating and Financial Data TIER REIT 1st Quarter Page 6 |
|
|
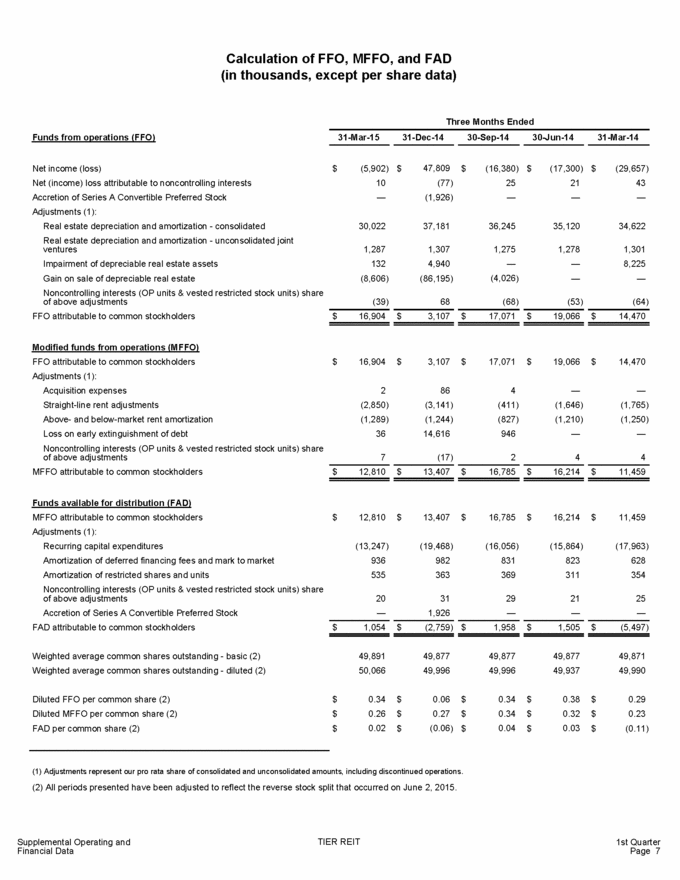
Calculation of FFO, MFFO, and FAD (in thousands, except per share data) Three Months Ended Funds from operations (FFO) 31-Mar-15 31-Dec-14 30-Sep-14 30-Jun-14 31-Mar-14 Net income (loss) Net (income) loss attributable to noncontrolling interests Accretion of Series A Convertible Preferred Stock Adjustments (1): Real estate depreciation and amortization - consolidated Real estate depreciation and amortization - unconsolidated joint ventures Impairment of depreciable real estate assets Gain on sale of depreciable real estate Noncontrolling interests (OP units & vested restricted stock units) share of above adjustments FFO attributable to common stockholders $ (5,902) 10 — $ 47,809 (77) (1,926) $ (16,380) 25 — $ (17,300) 21 — $ (29,657) 43 — 30,022 37,181 36,245 35,120 34,622 1,287 132 (8,606) 1,307 4,940 (86,195) 1,275 — (4,026) 1,278 — — 1,301 8,225 — (39) 68 (68) (53) (64) $ 16,904 $ 3,107 $ 17,071 $ 19,066 $ 14,470 Modified funds from operations (MFFO) FFO attributable to common stockholders Adjustments (1): Acquisition expenses Straight-line rent adjustments Above-and below-market rent amortization Loss on early extinguishment of debt Noncontrolling interests (OP units & vested restricted stock units) share of above adjustments MFFO attributable to common stockholders $ 16,904 $ 3,107 $ 17,071 $ 19,066 $ 14,470 2 (2,850) (1,289) 36 86 (3,141) (1,244) 14,616 4 (411) (827) 946 — (1,646) (1,210) — — (1,765) (1,250) — 7 (17) 2 4 4 $ 12,810 $ 13,407 $ 16,785 $ 16,214 $ 11,459 Funds available for distribution (FAD) MFFO attributable to common stockholders Adjustments (1): Recurring capital expenditures Amortization of deferred financing fees and mark to market Amortization of restricted shares and units Noncontrolling interests (OP units & vested restricted stock units) share of above adjustments Accretion of Series A Convertible Preferred Stock FAD attributable to common stockholders $ 12,810 $ 13,407 $ 16,785 $ 16,214 $ 11,459 (13,247) 936 535 (19,468) 982 363 (16,056) 831 369 (15,864) 823 311 (17,963) 628 354 20 — 31 1,926 29 — 21 — 25 — $ 1,054 $ (2,759) $ 1,958 $ 1,505 $ (5,497) Weighted average common shares outstanding - basic (2) Weighted average common shares outstanding - diluted (2) 49,891 50,066 49,877 49,996 49,877 49,996 49,877 49,937 49,871 49,990 Diluted FFO per common share (2) Diluted MFFO per common share (2) FAD per common share (2) $ $ $ 0.34 0.26 0.02 $ $ $ 0.06 0.27 (0.06) $ $ $ 0.34 0.34 0.04 $ $ $ 0.38 0.32 0.03 $ $ $ 0.29 0.23 (0.11) (1) Adjustments represent our pro rata share of consolidated and unconsolidated amounts, including discontinued operations. (2) All periods presented have been adjusted to reflect the reverse stock split that occurred on June 2, 2015. Supplemental Operating and Financial Data TIER REIT 1st Quarter Page 7 |
|
|
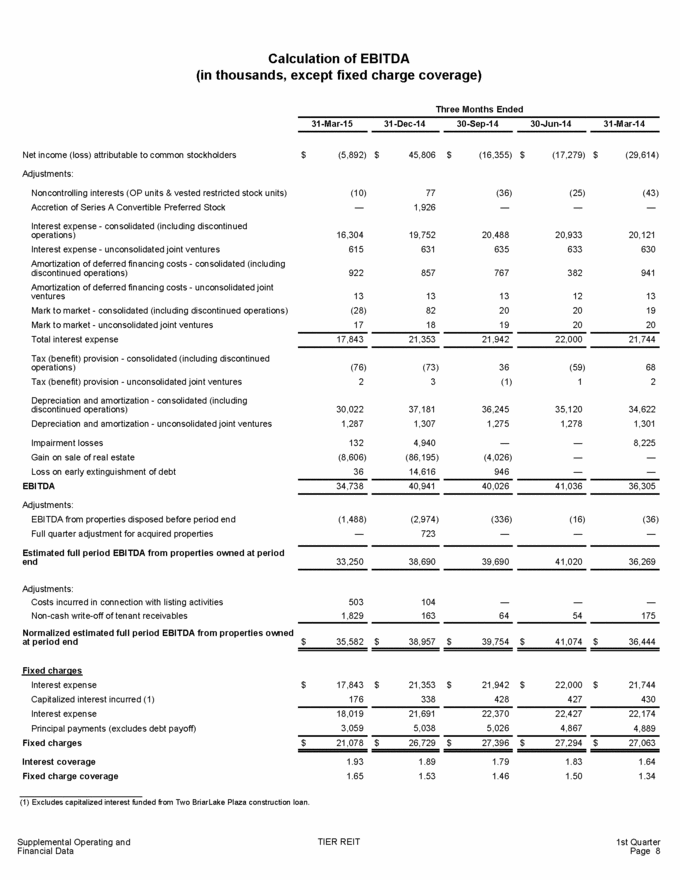
Calculation of EBITDA (in thousands, except fixed charge coverage) Three Months Ended 31-Mar-15 31-Dec-14 30-Sep-14 30-Jun-14 31-Mar-14 Net income (loss) attributable to common stockholders $ (5,892) $ 45,806 $ (16,355) $ (17,279) $ (29,614) Adjustments: Noncontrolling interests (OP units & vested restricted stock units) Accretion of Series A Convertible Preferred Stock (10) — 77 1,926 (36) — (25) — (43) — Interest expense - consolidated (including discontinued operations) Interest expense - unconsolidated joint ventures Amortization of deferred financing costs - consolidated (including discontinued operations) Amortization of deferred financing costs - unconsolidated joint ventures Mark to market - consolidated (including discontinued operations) Mark to market - unconsolidated joint ventures Total interest expense 16,304 615 19,752 631 20,488 635 20,933 633 20,121 630 922 857 767 382 941 13 (28) 17 13 82 18 13 20 19 12 20 20 13 19 20 17,843 21,353 21,942 22,000 21,744 Tax (benefit) provision - consolidated (including discontinued operations) Tax (benefit) provision - unconsolidated joint ventures (76) 2 (73) 3 36 (1) (59) 1 68 2 Depreciation and amortization - consolidated (including discontinued operations) Depreciation and amortization - unconsolidated joint ventures 30,022 1,287 37,181 1,307 36,245 1,275 35,120 1,278 34,622 1,301 Impairment losses Gain on sale of real estate Loss on early extinguishment of debt EBITDA 132 (8,606) 36 4,940 (86,195) 14,616 — (4,026) 946 — — — 8,225 — — 34,738 40,941 40,026 41,036 36,305 Adjustments: EBITDA from properties disposed before period end Full quarter adjustment for acquired properties (1,488) — (2,974) 723 (336) — (16) — (36) — Estimated full period EBITDA from properties owned at period end 33,250 38,690 39,690 41,020 36,269 Adjustments: Costs incurred in connection with listing activities Non-cash write-off of tenant receivables Normalized estimated full period EBITDA from properties owned at period end 503 1,829 104 163 — 64 — 54 — 175 $ 35,582 $ 38,957 $ 39,754 $ 41,074 $ 36,444 Fixed charges Interest expense Capitalized interest incurred (1) Interest expense Principal payments (excludes debt payoff) Fixed charges $ 17,843 176 $ 21,353 338 $ 21,942 428 $ 22,000 427 $ 21,744 430 18,019 3,059 21,691 5,038 22,370 5,026 22,427 4,867 22,174 4,889 $ 21,078 $ 26,729 $ 27,396 $ 27,294 $ 27,063 Interest coverage Fixed charge coverage 1.93 1.65 1.89 1.53 1.79 1.46 1.83 1.50 1.64 1.34 (1) Excludes capitalized interest funded from Two BriarLake Plaza construction loan. Supplemental Operating and Financial Data TIER REIT 1st Quarter Page 8 |
|
|
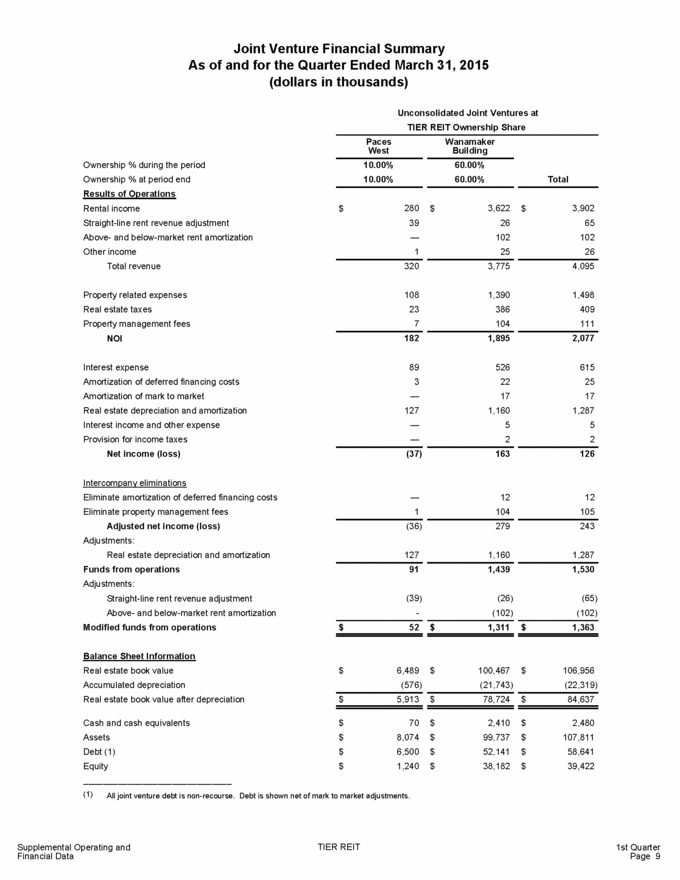
Joint Venture Financial Summary As of and for the Quarter Ended March 31, 2015 (dollars in thousands) Unconsolidated Joint Ventures at TIER REIT Ownership Share Paces West Wanamaker Building Ownership % during the period Ownership % at period end Results of Operations 10.00% 10.00% 60.00% 60.00% Total Rental income Straight-line rent revenue adjustment Above-and below-market rent amortization Other income Total revenue $ 280 39 — 1 $ 3,622 26 102 25 $ 3,902 65 102 26 320 3,775 4,095 Property related expenses Real estate taxes Property management fees NOI 108 23 7 1,390 386 104 1,498 409 111 182 1,895 2,077 Interest expense Amortization of deferred financing costs Amortization of mark to market Real estate depreciation and amortization Interest income and other expense Provision for income taxes Net income (loss) 89 3 — 127 — — 526 22 17 1,160 5 2 615 25 17 1,287 5 2 (37) 163 126 Intercompany eliminations Eliminate amortization of deferred financing costs Eliminate property management fees Adjusted net income (loss) Adjustments: Real estate depreciation and amortization Funds from operations Adjustments: Straight-line rent revenue adjustment Above-and below-market rent amortization Modified funds from operations — 1 12 104 12 105 (36) 279 243 127 1,160 1,287 91 1,439 1,530 (39) - (26) (102) (65) (102) $ 52 $ 1,311 $ 1,363 Balance Sheet Information Real estate book value Accumulated depreciation Real estate book value after depreciation $ 6,489 (576) $ 100,467 (21,743) $ 106,956 (22,319) $ 5,913 $ 78,724 $ 84,637 Cash and cash equivalents Assets Debt (1) Equity $ $ $ $ 70 8,074 6,500 1,240 $ $ $ $ 2,410 99,737 52,141 38,182 $ $ $ $ 2,480 107,811 58,641 39,422 (1) All joint venture debt is non-recourse. Debt is shown net of mark to market adjustments. TIER REIT Supplemental Operating and Financial Data 1st Quarter Page 9 |
|
|
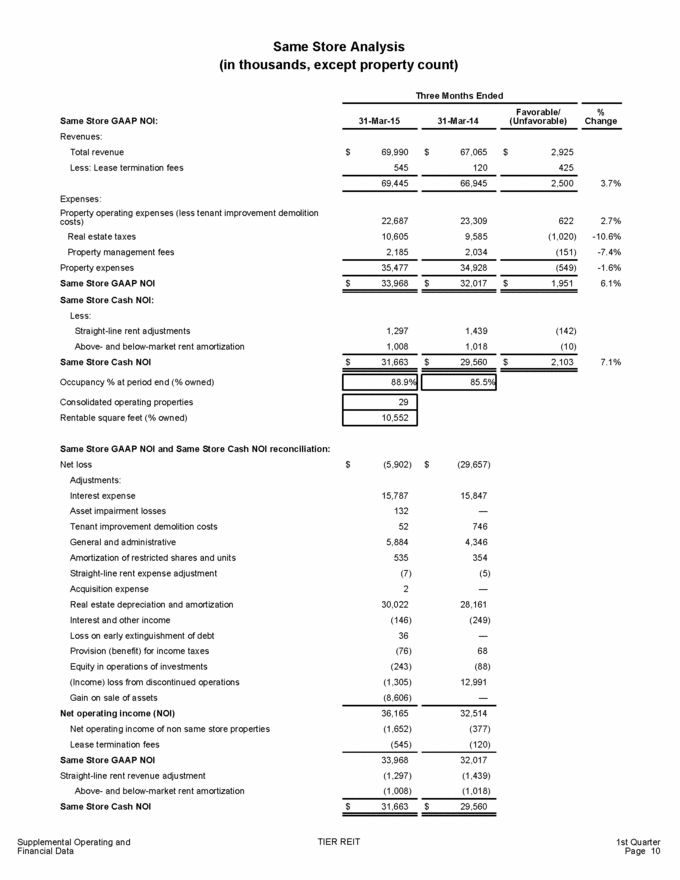
Same Store Analysis (in thousands, except property count) Three Months Ended Favorable/ (Unfavorable) % Change Same Store GAAP NOI: Revenues: Total revenue Less: Lease termination fees 31-Mar-15 31-Mar-14 $ 69,990 545 $ 67,065 120 $ 2,925 425 69,445 66,945 2,500 3.7% Expenses: Property operating expenses (less tenant improvement demolition costs) Real estate taxes Property management fees Property expenses Same Store GAAP NOI Same Store Cash NOI: Less: Straight-line rent adjustments Above-and below-market rent amortization Same Store Cash NOI 22,687 10,605 2,185 23,309 9,585 2,034 622 (1,020) (151) 2.7% -10.6% -7.4% -1.6% 6.1% 35,477 34,928 (549) $ 33,968 $ 32,017 $ 1,951 1,297 1,008 1,439 1,018 (142) (10) $ 31,663 $ 29,560 $ 2,103 7.1% Occupancy % at period end (% owned) Consolidated operating properties Rentable square feet (% owned) Same Store GAAP NOI and Same Store Cash NOI reconciliation: Net loss Adjustments: Interest expense Asset impairment losses Tenant improvement demolition costs General and administrative Amortization of restricted shares and units Straight-line rent expense adjustment Acquisition expense Real estate depreciation and amortization Interest and other income Loss on early extinguishment of debt Provision (benefit) for income taxes Equity in operations of investments (Income) loss from discontinued operations Gain on sale of assets Net operating income (NOI) Net operating income of non same store properties Lease termination fees Same Store GAAP NOI Straight-line rent revenue adjustment Above-and below-market rent amortization Same Store Cash NOI $ (5,902) $ (29,657) 15,787 132 52 5,884 535 (7) 2 30,022 (146) 36 (76) (243) (1,305) (8,606) 15,847 — 746 4,346 354 (5) — 28,161 (249) — 68 (88) 12,991 — 36,165 (1,652) (545) 32,514 (377) (120) 33,968 (1,297) (1,008) 32,017 (1,439) (1,018) $ 31,663 $ 29,560 Supplemental Operating and Financial Data TIER REIT 1st Quarter Page 10 29 10,552 85.5% 88.9% |
|
|
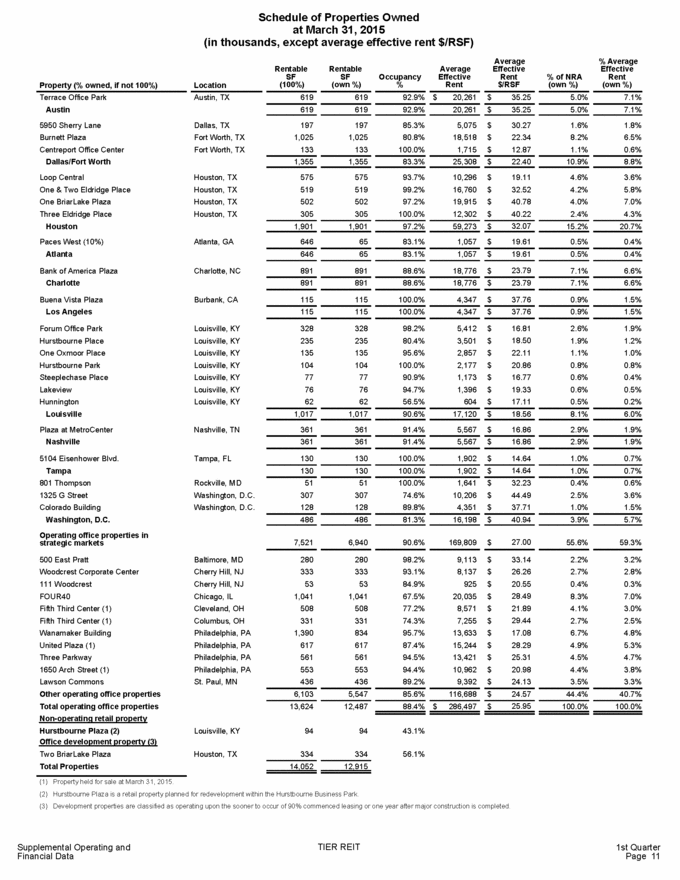
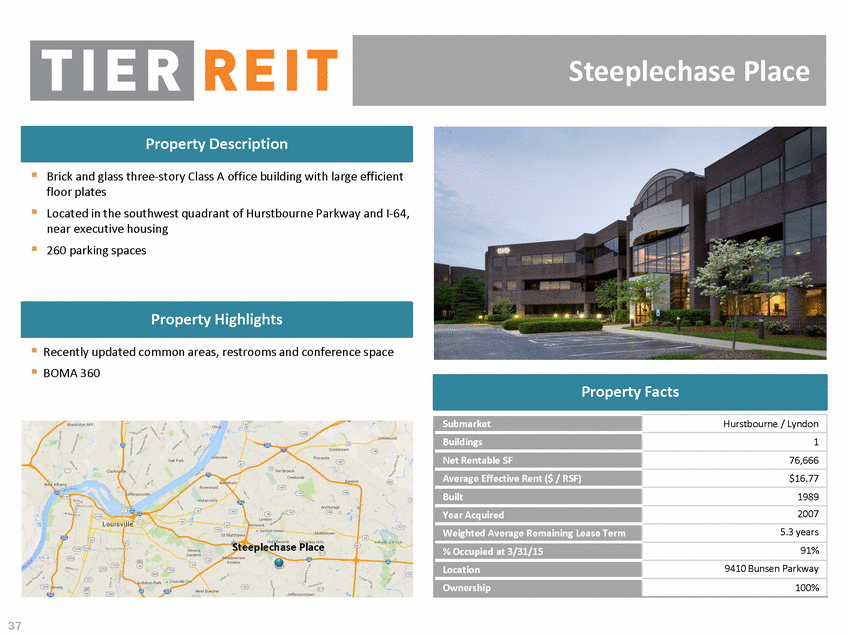
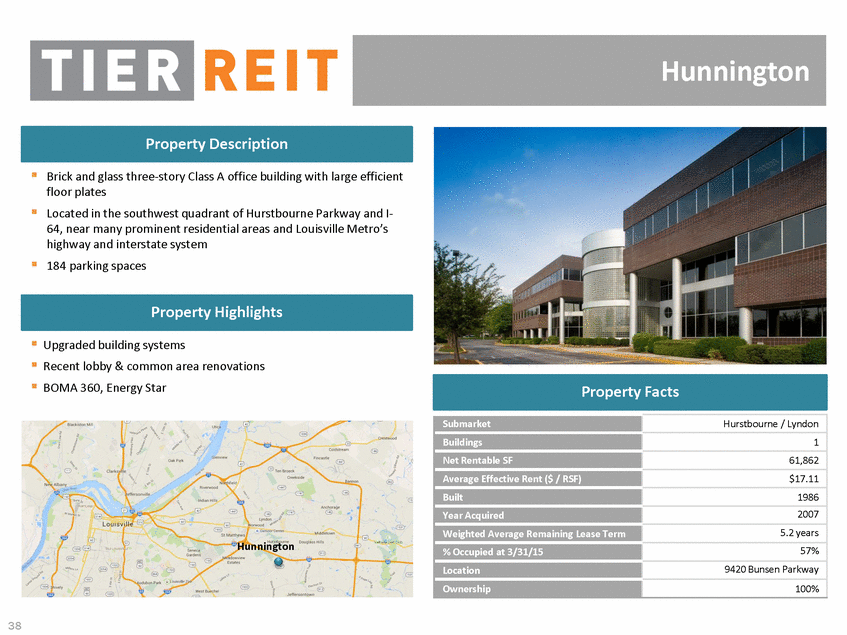
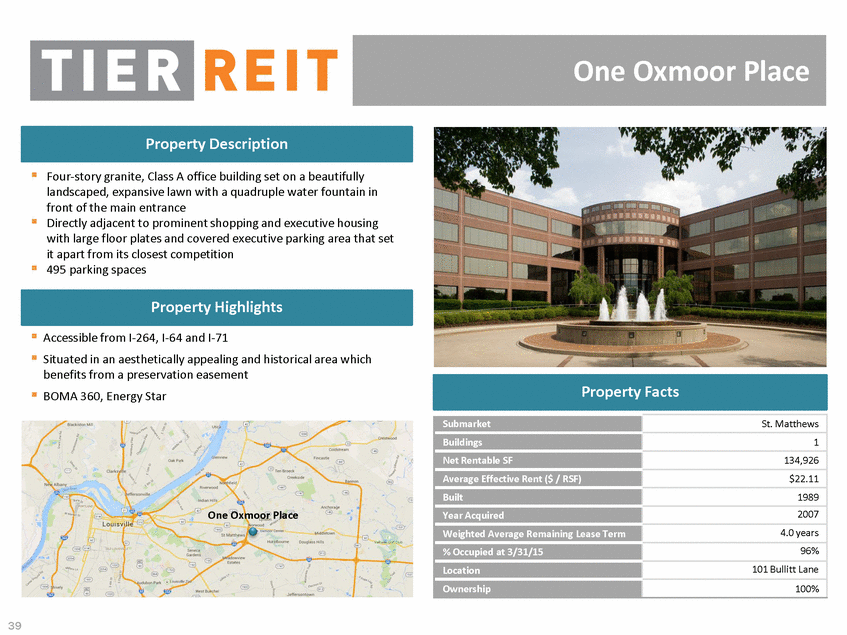
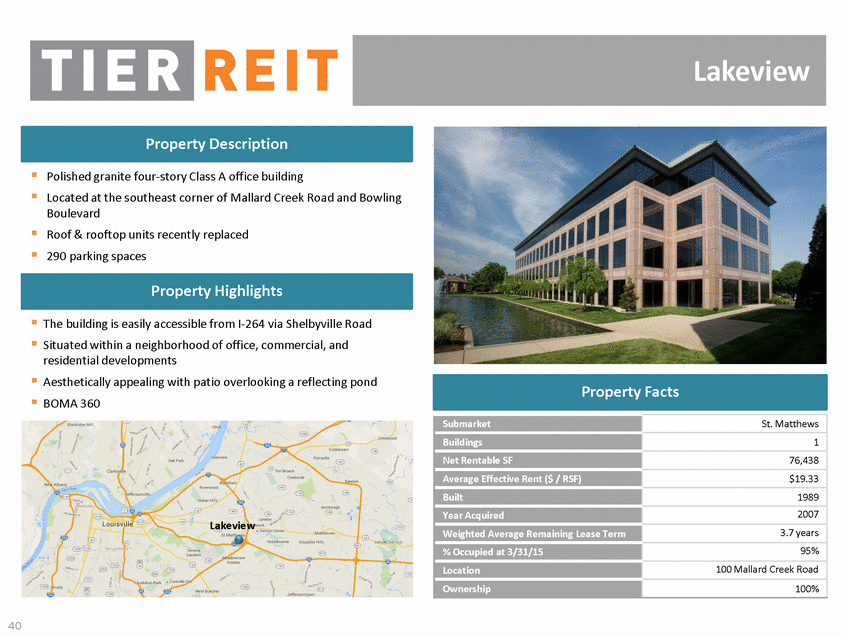
Schedule of Properties Owned at March 31, 2015 (in thousands, except average effective rent $/RSF) Average Effective Rent $/RSF % Average Effective Rent (own %) Rentable SF (100%) Rentable SF (own %) Average Effective Rent Occupancy % % of NRA (own %) Property (% owned, if not 100%) Location Terrace Office Park Austin 5950 Sherry Lane Burnett Plaza Centreport Office Center Dallas/Fort Worth Loop Central One & Two Eldridge Place One BriarLake Plaza Three Eldridge Place Houston Paces West (10%) Atlanta Austin, TX 619 619 92.9% $ 20,261 $ 35.25 5.0% 7.1% 619 619 92.9% 20,261 $ 35.25 5.0% 7.1% Dallas, TX Fort Worth, TX Fort Worth, TX 197 1,025 133 197 1,025 133 85.3% 80.8% 100.0% 5,075 18,518 1,715 $ $ $ 30.27 22.34 12.87 1.6% 8.2% 1.1% 1.8% 6.5% 0.6% 1,355 1,355 83.3% 25,308 $ 22.40 10.9% 8.8% Houston, TX Houston, TX Houston, TX Houston, TX 575 519 502 305 575 519 502 305 93.7% 99.2% 97.2% 100.0% 10,296 16,760 19,915 12,302 $ $ $ $ 19.11 32.52 40.78 40.22 4.6% 4.2% 4.0% 2.4% 3.6% 5.8% 7.0% 4.3% 1,901 1,901 97.2% 59,273 $ 32.07 15.2% 20.7% Atlanta, GA 646 65 83.1% 1,057 $ 19.61 0.5% 0.4% 646 65 83.1% 1,057 $ 19.61 0.5% 0.4% Bank of America Plaza Charlotte Charlotte, NC 891 891 88.6% 18,776 $ 23.79 7.1% 6.6% 891 891 88.6% 18,776 $ 23.79 7.1% 6.6% Buena Vista Plaza Los Angeles Burbank, CA 115 115 100.0% 4,347 $ 37.76 0.9% 1.5% 115 115 100.0% 4,347 $ 37.76 0.9% 1.5% Forum Office Park Hurstbourne Place One Oxmoor Place Hurstbourne Park Steeplechase Place Lakeview Hunnington Louisville Plaza at MetroCenter Nashville Louisville, KY Louisville, KY Louisville, KY Louisville, KY Louisville, KY Louisville, KY Louisville, KY 328 235 135 104 77 76 62 328 235 135 104 77 76 62 98.2% 80.4% 95.6% 100.0% 90.9% 94.7% 56.5% 5,412 3,501 2,857 2,177 1,173 1,396 604 $ $ $ $ $ $ $ 16.81 18.50 22.11 20.86 16.77 19.33 17.11 2.6% 1.9% 1.1% 0.8% 0.6% 0.6% 0.5% 1.9% 1.2% 1.0% 0.8% 0.4% 0.5% 0.2% 1,017 1,017 90.6% 17,120 $ 18.56 8.1% 6.0% Nashville, TN 361 361 91.4% 5,567 $ 16.86 2.9% 1.9% 361 361 91.4% 5,567 $ 16.86 2.9% 1.9% 5104 Eisenhower Blvd. Tampa 801 Thompson 1325 G Street Colorado Building Washington, D.C. Operating office properties in strategic markets Tampa, FL 130 130 100.0% 1,902 $ 14.64 1.0% 0.7% 130 130 100.0% 1,902 $ 14.64 1.0% 0.7% Rockville, MD Washington, D.C. Washington, D.C. 51 307 128 51 307 128 100.0% 74.6% 89.8% 1,641 10,206 4,351 $ $ $ 32.23 44.49 37.71 0.4% 2.5% 1.0% 0.6% 3.6% 1.5% 486 486 81.3% 16,198 $ 40.94 3.9% 5.7% 7,521 6,940 90.6% 169,809 $ 27.00 55.6% 59.3% 500 East Pratt Woodcrest Corporate Center 111 Woodcrest FOUR40 Fifth Third Center (1) Fifth Third Center (1) Wanamaker Building United Plaza (1) Three Parkway 1650 Arch Street (1) Lawson Commons Other operating office properties Total operating office properties Non-operating retail property Baltimore, MD Cherry Hill, NJ Cherry Hill, NJ Chicago, IL Cleveland, OH Columbus, OH Philadelphia, PA Philadelphia, PA Philadelphia, PA Philadelphia, PA St. Paul, MN 280 333 53 1,041 508 331 1,390 617 561 553 436 280 333 53 1,041 508 331 834 617 561 553 436 98.2% 93.1% 84.9% 67.5% 77.2% 74.3% 95.7% 87.4% 94.5% 94.4% 89.2% 9,113 8,137 925 20,035 8,571 7,255 13,633 15,244 13,421 10,962 9,392 $ $ $ $ $ $ $ $ $ $ $ 33.14 26.26 20.55 28.49 21.89 29.44 17.08 28.29 25.31 20.98 24.13 2.2% 2.7% 0.4% 8.3% 4.1% 2.7% 6.7% 4.9% 4.5% 4.4% 3.5% 3.2% 2.8% 0.3% 7.0% 3.0% 2.5% 4.8% 5.3% 4.7% 3.8% 3.3% 6,103 5,547 85.6% 116,688 $ 24.57 44.4% 40.7% 13,624 12,487 88.4% $ 286,497 $ 25.95 100.0% 100.0% Hurstbourne Plaza (2) Office development property (3) Louisville, KY 94 94 43.1% Two BriarLake Plaza Total Properties Houston, TX 334 334 56.1% 14,052 12,915 (1) (2) (3) Property held for sale at March 31, 2015. Hurstbourne Plaza is a retail property planned for redevelopment within the Hurstbourne Business Park. Development properties are classified as operating upon the sooner to occur of 90% commenced leasing or one year after major construction is completed. TIER REIT Supplemental Operating and Financial Data 1st Quarter Page 11 |
|
|
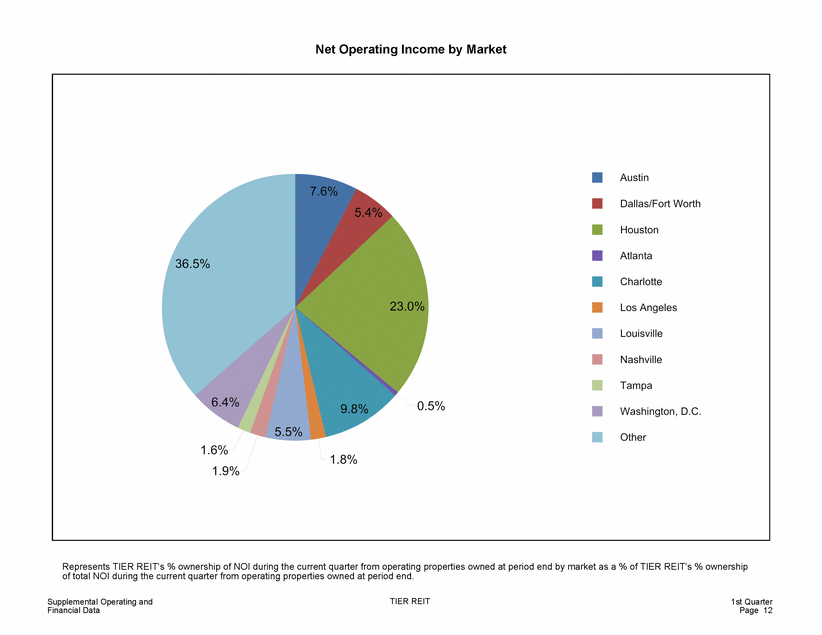
Net Operating Income by Market • • • • • Dallas/Fort Worth Atlanta Los Angeles Nashville Washington, D.C. 1.6% 1.8% Represents TIER REIT's % ownership of NOI during the current quarter from operating properties owned at period end by market as a % of TIER REIT's % ownership of total NOI during the current quarter from operating properties owned at period end. TIER REIT Supplemental Operating and Financial Data 1st Quarter Page 12 • Austin • Houston • Charlotte • Louisville • Tampa • Other 1.9% |
|
|
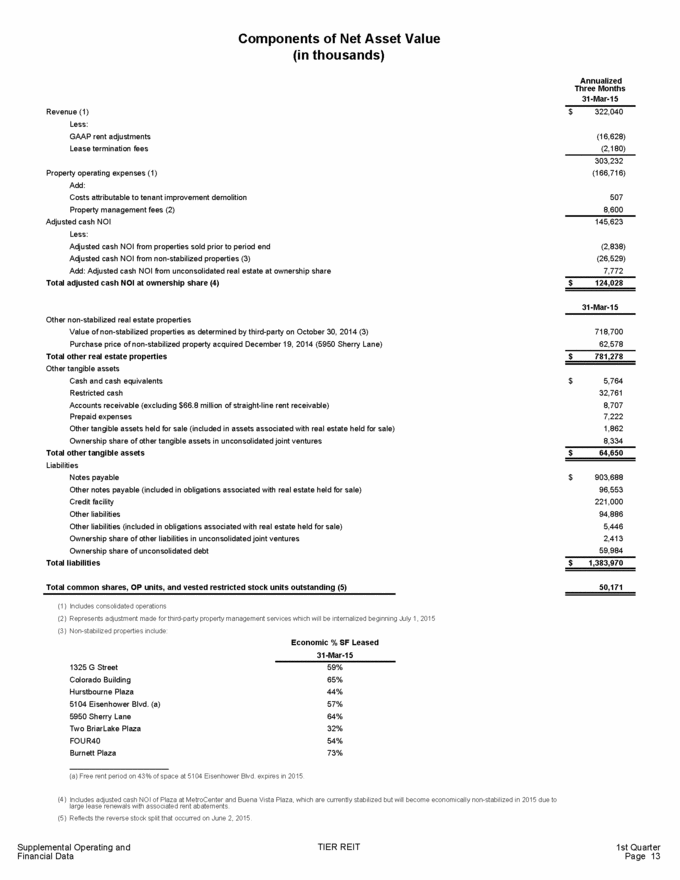
Components of Net Asset Value (in thousands) Annualized Three Months 31-Mar-15 Revenue (1) Less: GAAP rent adjustments Lease termination fees $ 322,040 (16,628) (2,180) 303,232 (166,716) Property operating expenses (1) Add: Costs attributable to tenant improvement demolition Property management fees (2) Adjusted cash NOI Less: Adjusted cash NOI from properties sold prior to period end Adjusted cash NOI from non-stabilized properties (3) Add: Adjusted cash NOI from unconsolidated real estate at ownership share Total adjusted cash NOI at ownership share (4) 507 8,600 145,623 (2,838) (26,529) 7,772 $ 124,028 31-Mar-15 Other non-stabilized real estate properties Value of non-stabilized properties as determined by third-party on October 30, 2014 (3) Purchase price of non-stabilized property acquired December 19, 2014 (5950 Sherry Lane) Total other real estate properties Other tangible assets Cash and cash equivalents Restricted cash Accounts receivable (excluding $66.8 million of straight-line rent receivable) Prepaid expenses Other tangible assets held for sale (included in assets associated with real estate held for sale) Ownership share of other tangible assets in unconsolidated joint ventures Total other tangible assets Liabilities Notes payable Other notes payable (included in obligations associated with real estate held for sale) Credit facility Other liabilities Other liabilities (included in obligations associated with real estate held for sale) Ownership share of other liabilities in unconsolidated joint ventures Ownership share of unconsolidated debt Total liabilities 718,700 62,578 $ 781,278 $ 5,764 32,761 8,707 7,222 1,862 8,334 $ 64,650 $ 903,688 96,553 221,000 94,886 5,446 2,413 59,984 $ 1,383,970 Total common shares, OP units, and vested restricted stock units outstanding (5) 50,171 (1) Includes consolidated operations (2) Represents adjustment made for third-party property management services which will be internalized beginning July 1, 2015 (3) Non-stabilized properties include: Economic % SF Leased 31-Mar-15 1325 G Street Colorado Building Hurstbourne Plaza 5104 Eisenhower Blvd. (a) 5950 Sherry Lane Two BriarLake Plaza FOUR40 Burnett Plaza 59% 65% 44% 57% 64% 32% 54% 73% (a) Free rent period on 43% of space at 5104 Eisenhower Blvd. expires in 2015. (4) Includes adjusted cash NOI of Plaza at MetroCenter and Buena Vista Plaza, which are currently stabilized but will become economically non-stabilized in 2015 due to large lease renewals with associated rent abatements. (5) Reflects the reverse stock split that occurred on June 2, 2015. TIER REIT Supplemental Operating and Financial Data 1st Quarter Page 13 |
|
|
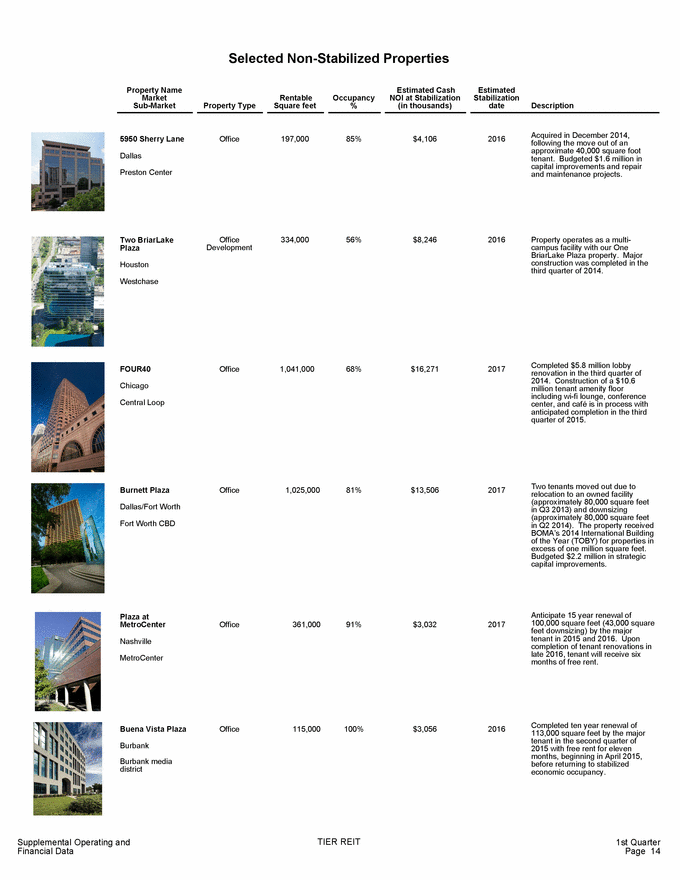
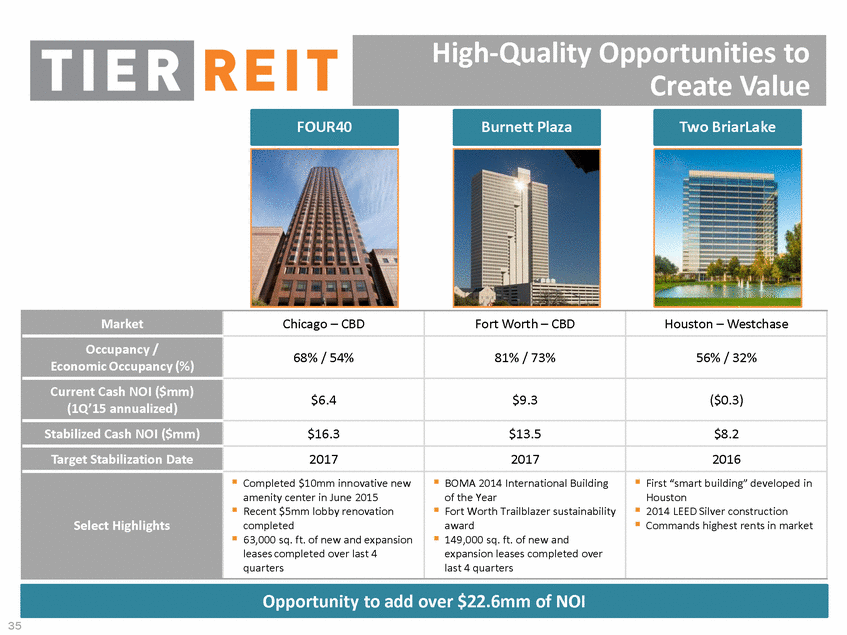
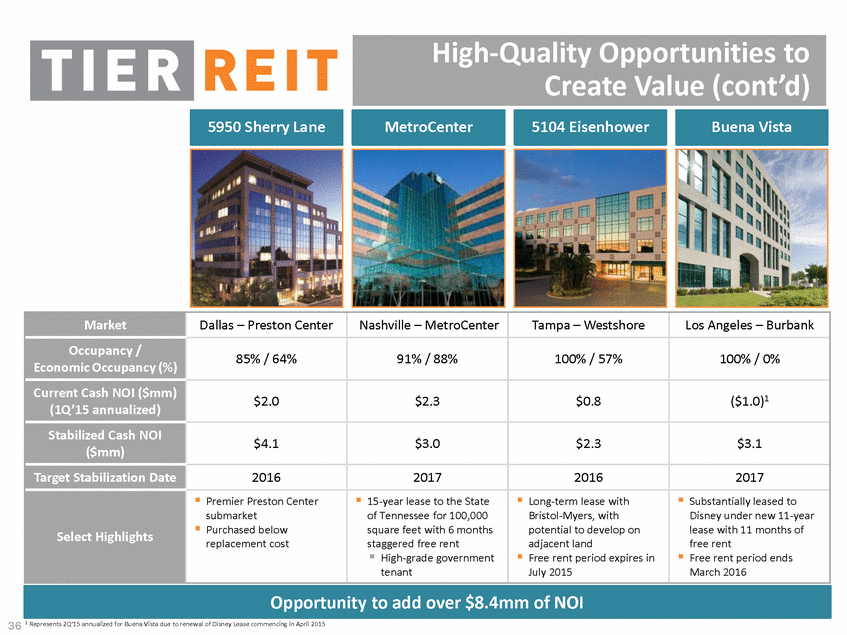
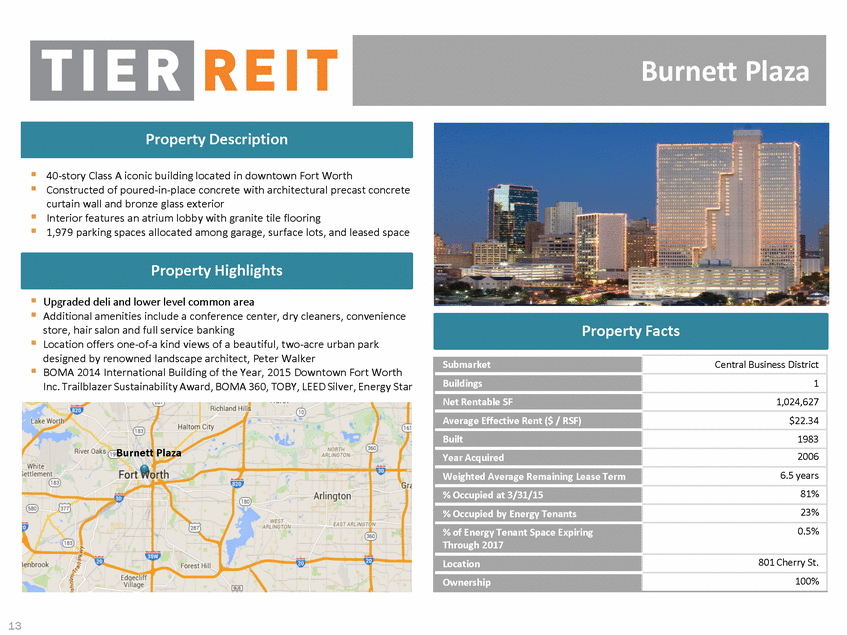
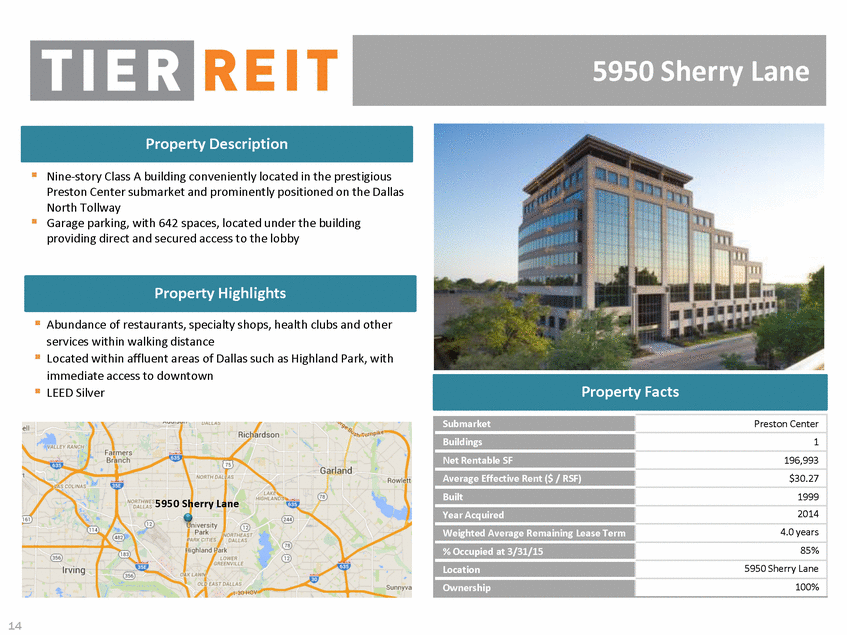
Selected Non-Stabilized Properties Property Name Market Sub-Market Estimated Cash NOI at Stabilization (in thousands) Estimated Stabilization date Rentable Square feet Occupancy % Property Type Description Acquired in December 2014, 5950 Sherry Lane Office 197,000 85% $4,106 2016 following the move out of an approximate 40,000 square foot Dallas tenant. Budgeted $1.6 million in capital improvements and repair and maintenance projects. Preston Center Office Development 334,000 56% $8,246 2016 Property operates as a multi-Two BriarLake Plaza campus facility with our One BriarLake Plaza property. Major construction was completed in the third quarter of 2014. Houston Westchase Completed $5.8 million lobby FOUR40 Office 1,041,000 68% $16,271 2017 renovation in the third quarter of 2014. Construction of a $10.6 Chicago million tenant amenity floor including wi-fi lounge, conference Central Loop center, and café is in process with anticipated completion in the third quarter of 2015. Two tenants moved out due to Burnett Plaza Office 1,025,000 81% $13,506 2017 relocation to an owned facility (approximately 80,000 square feet in Q3 2013) and downsizing Dallas/Fort Worth (approximately 80,000 square feet Fort Worth CBD in Q2 2014). The property received BOMA’s 2014 International Building of the Year (TOBY) for properties in excess of one million square feet. Budgeted $2.2 million in strategic capital improvements. Anticipate 15 year renewal of Plaza at MetroCenter 100,000 square feet (43,000 square feet downsizing) by the major tenant in 2015 and 2016. Upon completion of tenant renovations in late 2016, tenant will receive six months of free rent. Office 361,000 91% $3,032 2017 Nashville MetroCenter Completed ten year renewal of 113,000 square feet by the major tenant in the second quarter of 2015 with free rent for eleven months, beginning in April 2015, before returning to stabilized economic occupancy. Buena Vista Plaza Office 115,000 100% $3,056 2016 Burbank Burbank media district Supplemental Operating and Financial Data TIER REIT 1st Quarter Page 14 |
|
|
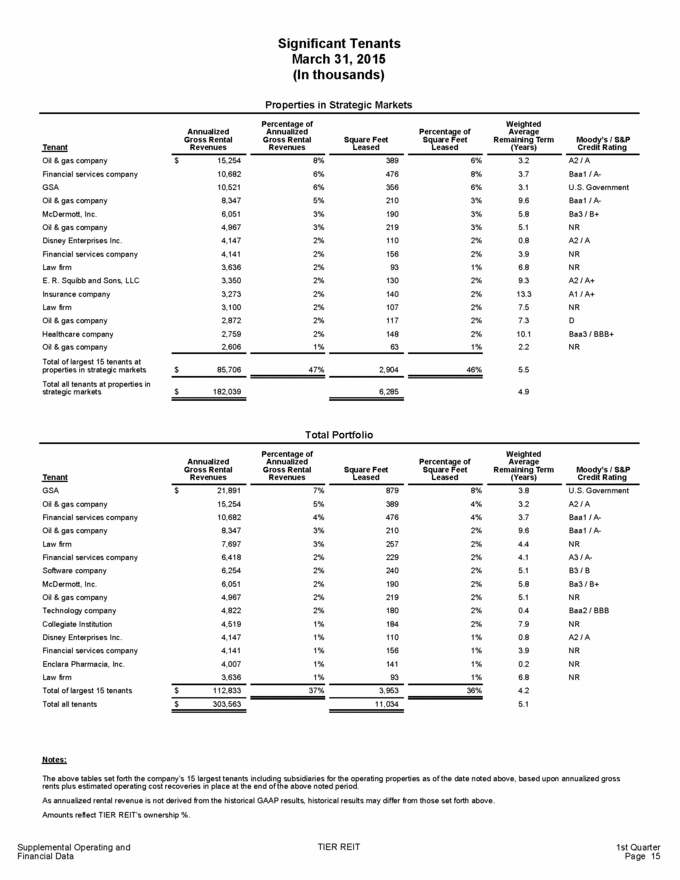
Significant Tenants March 31, 2015 (In thousands) Properties in Strategic Markets Percentage of Annualized Gross Rental Revenues Weighted Annualized Gross Rental Revenues Percentage of Square Feet Leased Average Remaining Term (Years) Square Feet Leased Moody’s / S&P Credit Rating Tenant Oil & gas company Financial services company GSA Oil & gas company McDermott, Inc. Oil & gas company Disney Enterprises Inc. Financial services company Law firm E. R. Squibb and Sons, LLC Insurance company Law firm Oil & gas company Healthcare company Oil & gas company $ 15,254 10,682 10,521 8,347 6,051 4,967 4,147 4,141 3,636 3,350 3,273 3,100 2,872 2,759 2,606 8% 6% 6% 5% 3% 3% 2% 2% 2% 2% 2% 2% 2% 2% 1% 389 476 356 210 190 219 110 156 93 130 140 107 117 148 63 6% 8% 6% 3% 3% 3% 2% 2% 1% 2% 2% 2% 2% 2% 1% 3.2 3.7 3.1 9.6 5.8 5.1 0.8 3.9 6.8 9.3 13.3 7.5 7.3 10.1 2.2 A2 / A Baa1 / A-U.S. Government Baa1 / A-Ba3 / B+ NR A2 / A NR NR A2 / A+ A1 / A+ NR D Baa3 / BBB+ NR Total of largest 15 tenants at properties in strategic markets Total all tenants at properties in strategic markets $ 85,706 47% 2,904 46% 5.5 $ 182,039 6,285 4.9 Total Portfolio Percentage of Annualized Gross Rental Revenues Weighted Annualized Gross Rental Revenues Percentage of Square Feet Leased Average Remaining Term (Years) Square Feet Leased Moody’s / S&P Credit Rating Tenant GSA Oil & gas company Financial services company Oil & gas company Law firm Financial services company Software company McDermott, Inc. Oil & gas company Technology company Collegiate Institution Disney Enterprises Inc. Financial services company Enclara Pharmacia, Inc. Law firm Total of largest 15 tenants Total all tenants $ 21,891 15,254 10,682 8,347 7,697 6,418 6,254 6,051 4,967 4,822 4,519 4,147 4,141 4,007 3,636 7% 5% 4% 3% 3% 2% 2% 2% 2% 2% 1% 1% 1% 1% 1% 879 389 476 210 257 229 240 190 219 180 184 110 156 141 93 8% 4% 4% 2% 2% 2% 2% 2% 2% 2% 2% 1% 1% 1% 1% 3.8 3.2 3.7 9.6 4.4 4.1 5.1 5.8 5.1 0.4 7.9 0.8 3.9 0.2 6.8 4.2 5.1 U.S. Government A2 / A Baa1 / A-Baa1 / A-NR A3 / A-B3 / B Ba3 / B+ NR Baa2 / BBB NR A2 / A NR NR NR $ 112,833 37% 3,953 36% $ 303,563 11,034 Notes: The above tables set forth the company’s 15 largest tenants including subsidiaries for the operating properties as of the date noted above, based upon annualized gross rents plus estimated operating cost recoveries in place at the end of the above noted period. As annualized rental revenue is not derived from the historical GAAP results, historical results may differ from those set forth above. Amounts reflect TIER REIT’s ownership %. TIER REIT Supplemental Operating and Financial Data 1st Quarter Page 15 |
|
|
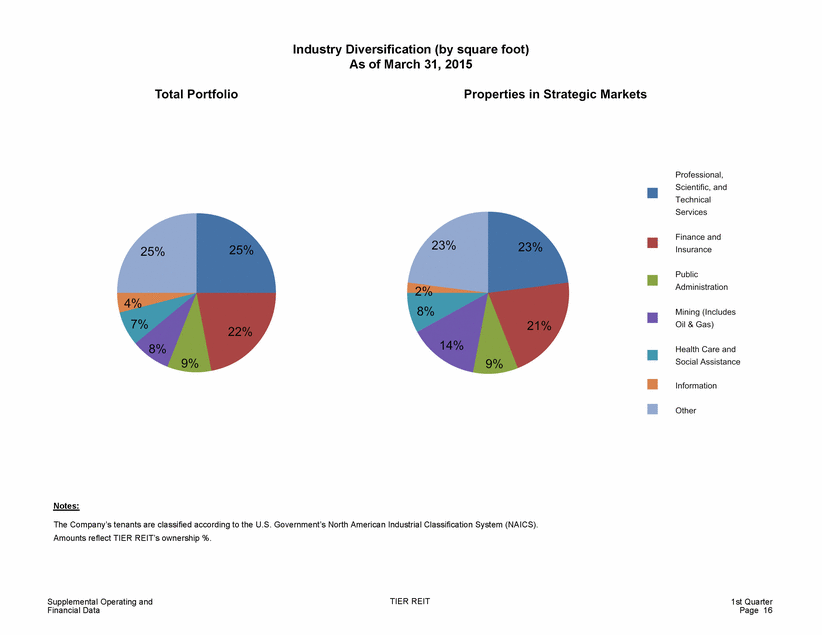
Industry Diversification (by square foot) As of March 31, 2015 Notes: The Company’s tenants are classified according to the U.S. Government’s North American Industrial Classification System (NAICS). Amounts reflect TIER REIT’s ownership %. Supplemental Operating and Financial Data TIER REIT 1st Quarter Page 16 |
|
|
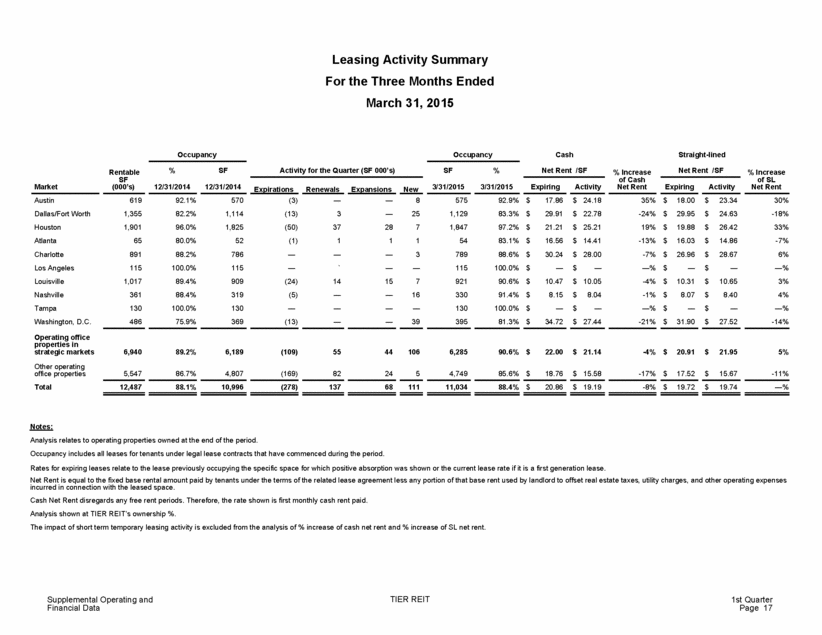
Leasing Activity Summary For the Three Months Ended March 31, 2015 Occupancy Occupancy Cash Straight-lined % SF Activity for the Quarter (SF 000’s) SF % Net Rent /SF Net Rent /SF Rentable SF (000’s) % Increase of Cash Net Rent % Increase of SL Net Rent Market 12/31/2014 12/31/2014 3/31/2015 3/31/2015 Expiring Activity Expiring Activity Expirations Renewals Expansions New Austin Dallas/Fort Worth Houston Atlanta Charlotte Los Angeles Louisville Nashville Tampa Washington, D.C. 619 1,355 1,901 65 891 115 1,017 361 130 486 92.1% 82.2% 96.0% 80.0% 88.2% 100.0% 89.4% 88.4% 100.0% 75.9% 570 1,114 1,825 52 786 115 909 319 130 369 (3) (13) (50) (1) — — (24) (5) — (13) — 3 37 1 — ` 14 — — — — — 28 1 — — 15 — — — 8 25 7 1 3 — 7 16 — 39 575 1,129 1,847 54 789 115 921 330 130 395 92.9% 83.3% 97.2% 83.1% 88.6% 100.0% 90.6% 91.4% 100.0% 81.3% $ $ $ $ $ $ $ $ $ $ 17.86 29.91 21.21 16.56 30.24 — 10.47 8.15 — 34.72 $ $ $ $ $ $ $ $ $ $ 24.18 22.78 25.21 14.41 28.00 — 10.05 8.04 — 27.44 35% -24% 19% -13% -7% —% -4% -1% —% -21% $ $ $ $ $ $ $ $ $ $ 18.00 29.95 19.88 16.03 26.96 — 10.31 8.07 — 31.90 $ $ $ $ $ $ $ $ $ $ 23.34 24.63 26.42 14.86 28.67 — 10.65 8.40 — 27.52 30% -18% 33% -7% 6% —% 3% 4% —% -14% Operating office properties in strategic markets Other operating office properties Total 6,940 89.2% 6,189 (109) 55 44 106 6,285 90.6% $ 22.00 $ 21.14 -4% $ 20.91 $ 21.95 5% 5,547 86.7% 4,807 (169) 82 24 5 4,749 85.6% $ 18.76 $ 15.58 -17% $ 17.52 $ 15.67 -11% 12,487 88.1% 10,996 (278) 137 68 111 11,034 88.4% $ 20.86 $ 19.19 -8% $ 19.72 $ 19.74 —% Notes: Analysis relates to operating properties owned at the end of the period. Occupancy includes all leases for tenants under legal lease contracts that have commenced during the period. Rates for expiring leases relate to the lease previously occupying the specific space for which positive absorption was shown or the current lease rate if it is a first generation lease. Net Rent is equal to the fixed base rental amount paid by tenants under the terms of the related lease agreement less any portion of that base rent used by landlord to offset real estate taxes, utility charges, and other operating expenses incurred in connection with the leased space. Cash Net Rent disregards any free rent periods. Therefore, the rate shown is first monthly cash rent paid. Analysis shown at TIER REIT’s ownership %. The impact of short term temporary leasing activity is excluded from the analysis of % increase of cash net rent and % increase of SL net rent. Supplemental Operating and Financial Data TIER REIT 1st Quarter Page 17 |
|
|
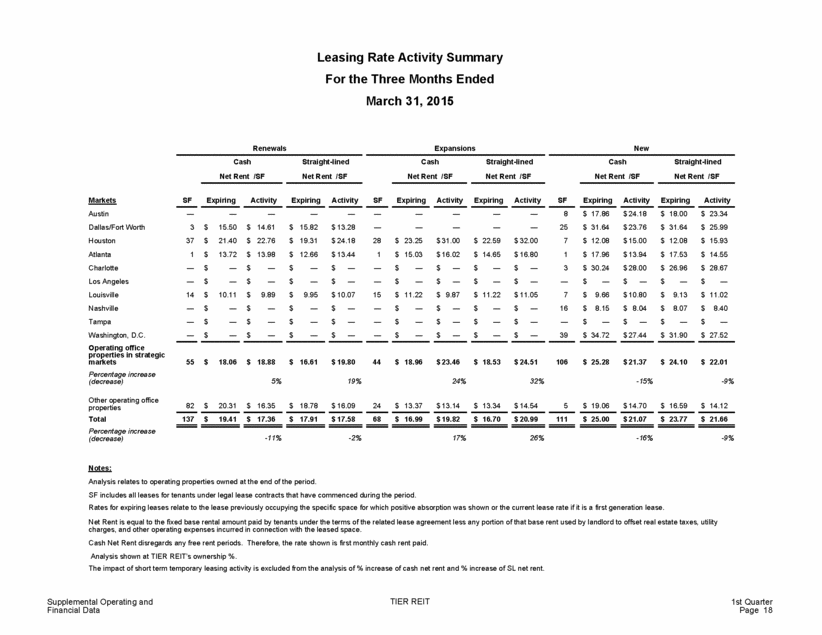
Leasing Rate Activity Summary For the Three Months Ended March 31, 2015 Renewals Expansions New Cash Net Rent /SF Straight-lined Net Rent /SF Cash Net Rent /SF Straight-lined Net Rent /SF Cash Net Rent /SF Straight-lined Net Rent /SF Markets Austin Dallas/Fort Worth Houston Atlanta Charlotte Los Angeles Louisville Nashville Tampa Washington, D.C. Operating office properties in strategic markets Percentage increase (decrease) SF Expiring Activity Expiring Activity SF Expiring Activity Expiring Activity SF Expiring Activity Expiring Activity — 3 37 1 — — 14 — — — — 15.50 21.40 13.72 — — 10.11 — — — — 14.61 22.76 13.98 — — 9.89 — — — — 15.82 19.31 12.66 — — 9.95 — — — — $ 13.28 $ 24.18 $ 13.44 $— $— $ 10.07 — — 28 1 — — 15 — — — — — 23.25 15.03 — — 11.22 — — — — — $ 31.00 $ 16.02 — — $ 22.59 $ 14.65 — — $ 32.00 $ 16.80 $— $— $ 11.05 8 25 7 1 3 — 7 16 — 39 $ 17.86 $ 31.64 $ 12.08 $ 17.96 $ 30.24 $ 24.18 $ 23.76 $ 15.00 $ 13.94 $ 28.00 $— $ 10.80 $ 8.04 $— $ 27.44 $ 18.00 $ 31.64 $ 12.08 $ 17.53 $ 26.96 $ 23.34 $ 25.99 $ 15.93 $ 14.55 $ 28.67 $ $ $ $ $ $ $ $ $ $ $ $ $ $ $ $ $ $ $ $ $ $ $ $ $ $ $ $ $ $ $ $ $ $ $ $ $ $ $ $ $ — — 9.87 — — — $ $ — — $ $ $ $ — 9.66 8.15 — $ $ $ $ — 9.13 8.07 — $ — $ 11.22 $ 11.02 $ 8.40 $ $ $ — — — $ $ $ — — — $ $ $ — — — $ — $ 34.72 $ 31.90 $ 27.52 55 $ 18.06 $ 18.88 $ 16.61 $ 19.80 44 $ 18.96 $ 23.46 $ 18.53 $ 24.51 106 $ 25.28 $ 21.37 $ 24.10 $ 22.01 5% 19% 24% 32% -15% -9% Other operating office properties Total Percentage increase (decrease) 82 $ 20.31 $ 16.35 $ 18.78 $ 16.09 24 $ 13.37 $ 13.14 $ 13.34 $ 14.54 5 $ 19.06 $ 14.70 $ 16.59 $ 14.12 137 $ 19.41 $ 17.36 $ 17.91 $ 17.58 68 $ 16.99 $ 19.82 $ 16.70 $ 20.99 111 $ 25.00 $ 21.07 $ 23.77 $ 21.66 -11% -2% 17% 26% -16% -9% Notes: Analysis relates to operating properties owned at the end of the period. SF includes all leases for tenants under legal lease contracts that have commenced during the period. Rates for expiring leases relate to the lease previously occupying the specific space for which positive absorption was shown or the current lease rate if it is a first generation lease. Net Rent is equal to the fixed base rental amount paid by tenants under the terms of the related lease agreement less any portion of that base rent used by landlord to offset real estate taxes, utility charges, and other operating expenses incurred in connection with the leased space. Cash Net Rent disregards any free rent periods. Therefore, the rate shown is first monthly cash rent paid. Analysis shown at TIER REIT’s ownership %. The impact of short term temporary leasing activity is excluded from the analysis of % increase of cash net rent and % increase of SL net rent. Supplemental Operating and Financial Data TIER REIT 1st Quarter Page 18 |
|
|
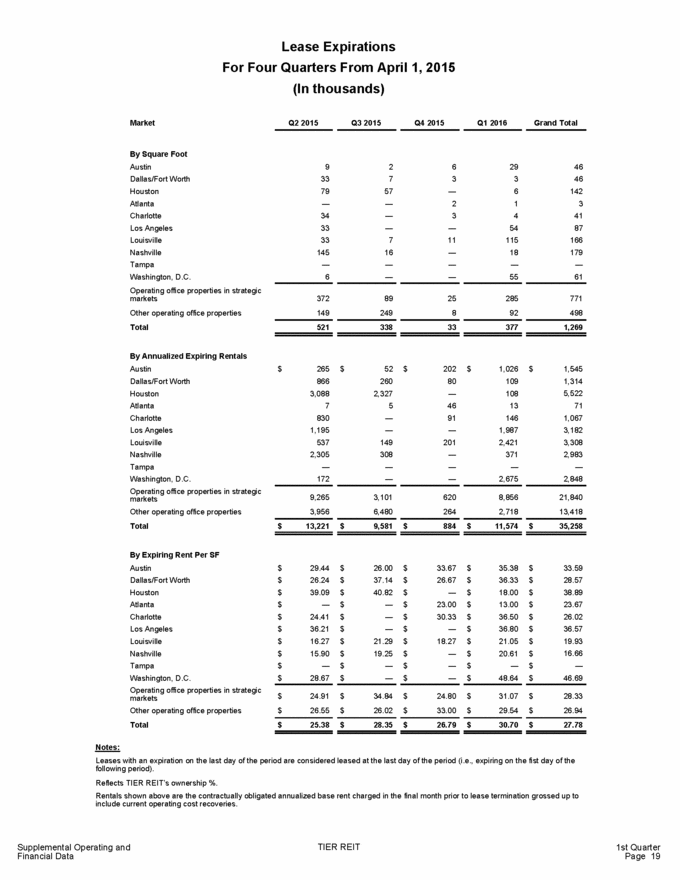
Lease Expirations For Four Quarters From April 1, 2015 (In thousands) Market Q2 2015 Q3 2015 Q4 2015 Q1 2016 Grand Total By Square Foot Austin Dallas/Fort Worth Houston Atlanta Charlotte Los Angeles Louisville Nashville Tampa Washington, D.C. Operating office properties in strategic markets Other operating office properties Total 9 33 79 — 34 33 33 145 — 6 2 7 57 — — — 7 16 — — 6 3 — 2 3 — 11 — — — 29 3 6 1 4 54 115 18 — 55 46 46 142 3 41 87 166 179 — 61 372 149 89 249 25 8 285 92 771 498 521 338 33 377 1,269 By Annualized Expiring Rentals Austin Dallas/Fort Worth Houston Atlanta Charlotte Los Angeles Louisville Nashville Tampa Washington, D.C. Operating office properties in strategic markets Other operating office properties Total $ 265 866 3,088 7 830 1,195 537 2,305 — 172 $ 52 260 2,327 5 — — 149 308 — — $ 202 80 — 46 91 — 201 — — — $ 1,026 109 108 13 146 1,987 2,421 371 — 2,675 $ 1,545 1,314 5,522 71 1,067 3,182 3,308 2,983 — 2,848 9,265 3,956 3,101 6,480 620 264 8,856 2,718 21,840 13,418 $ 13,221 $ 9,581 $ 884 $ 11,574 $ 35,258 By Expiring Rent Per SF Austin Dallas/Fort Worth Houston Atlanta Charlotte Los Angeles Louisville Nashville Tampa Washington, D.C. Operating office properties in strategic markets Other operating office properties Total $ $ $ $ $ $ $ $ $ $ 29.44 26.24 39.09 — 24.41 36.21 16.27 15.90 — 28.67 $ $ $ $ $ $ $ $ $ $ 26.00 37.14 40.82 — — — 21.29 19.25 — — $ $ $ $ $ $ $ $ $ $ 33.67 26.67 — 23.00 30.33 — 18.27 — — — $ $ $ $ $ $ $ $ $ $ 35.38 36.33 18.00 13.00 36.50 36.80 21.05 20.61 — 48.64 $ $ $ $ $ $ $ $ $ $ 33.59 28.57 38.89 23.67 26.02 36.57 19.93 16.66 — 46.69 $ $ 24.91 26.55 $ $ 34.84 26.02 $ $ 24.80 33.00 $ $ 31.07 29.54 $ $ 28.33 26.94 $ 25.38 $ 28.35 $ 26.79 $ 30.70 $ 27.78 Notes: Leases with an expiration on the last day of the period are considered leased at the last day of the period (i.e., expiring on the fist day of the following period). Reflects TIER REIT’s ownership %. Rentals shown above are the contractually obligated annualized base rent charged in the final month prior to lease termination grossed up to include current operating cost recoveries. TIER REIT Supplemental Operating and Financial Data 1st Quarter Page 19 |
|
|
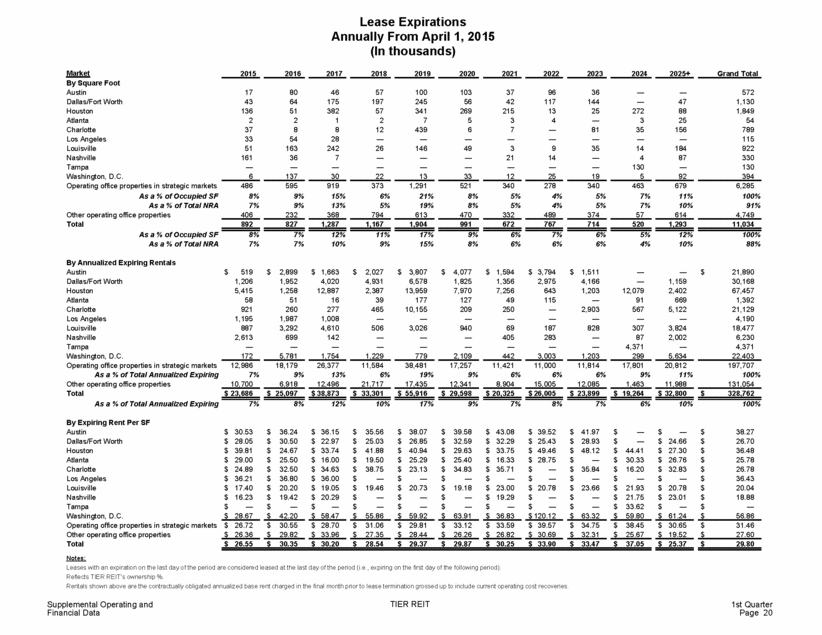
Lease Expirations Annually From April 1, 2015 (In thousands) Market By Square Foot Austin Dallas/Fort Worth Houston Atlanta Charlotte Los Angeles Louisville Nashville Tampa Washington, D.C. Operating office properties in strategic markets As a % of Occupied SF As a % of Total NRA Other operating office properties Total As a % of Occupied SF As a % of Total NRA 2015 2016 2017 2018 2019 2020 2021 2022 2023 2024 2025+ Grand Total 17 43 136 2 37 33 51 161 — 80 64 51 2 8 54 163 36 — 46 175 382 1 8 28 242 7 — 57 197 57 2 12 — 26 — — 100 245 341 7 439 — 146 — — 103 56 269 5 6 — 49 — — 37 42 215 3 7 — 3 21 — 96 117 13 4 — — 9 14 — 36 144 25 — 81 — 35 — — — — 272 3 35 — 14 4 130 — 47 88 25 156 — 184 87 — 572 1,130 1,849 54 789 115 922 330 130 6 137 30 22 13 33 12 25 19 5 92 394 486 8% 7% 595 9% 9% 919 15% 13% 373 6% 5% 1,291 21% 19% 521 8% 8% 340 5% 5% 278 4% 4% 340 5% 5% 463 7% 7% 679 11% 10% 6,285 100% 91% 406 232 368 794 613 470 332 489 374 57 614 4,749 892 827 1,287 1,167 1,904 991 672 767 714 520 1,293 11,034 8% 7% 7% 7% 12% 10% 11% 9% 17% 15% 9% 8% 6% 6% 7% 6% 6% 6% 5% 4% 12% 10% 100% 88% By Annualized Expiring Rentals Austin Dallas/Fort Worth Houston Atlanta Charlotte Los Angeles Louisville Nashville Tampa Washington, D.C. $ 519 1,206 5,415 58 921 1,195 887 2,613 — $ 2,899 1,952 1,258 51 260 1,987 3,292 699 — $ 1,663 4,020 12,887 16 277 1,008 4,610 142 — $ 2,027 4,931 2,387 39 465 — 506 — — $ 3,807 6,578 13,959 177 10,155 — 3,026 — — $ 4,077 1,825 7,970 127 209 — 940 — — $ 1,594 1,356 7,256 49 250 — 69 405 — $ 3,794 2,975 643 115 — — 187 283 — $ 1,511 4,166 1,203 — 2,903 — 828 — — — — 12,079 91 567 — 307 87 4,371 — 1,159 2,402 669 5,122 — 3,824 2,002 — $ 21,890 30,168 67,457 1,392 21,129 4,190 18,477 6,230 4,371 172 5,781 1,754 1,229 779 2,109 442 3,003 1,203 299 5,634 22,403 Operating office properties in strategic markets12,986 18,179 9% 26,377 13% 11,584 6% 38,481 19% 17,257 9% 11,421 6% 11,000 6% 11,814 6% 17,801 9% 20,812 11% 197,707 100% As a % of Total Annualized Expiring Other operating office properties Total As a % of Total Annualized Expiring 7% 10,700 6,918 12,496 21,717 17,435 12,341 8,904 15,005 12,085 1,463 11,988 131,054 $ 23,686 $ 25,097 $ 38,873 $ 33,301 $ 55,916 $ 29,598 $ 20,325 $ 26,005 $ 23,899 $ 19,264 $ 32,800 $ 328,762 7% 8% 12% 10% 17% 9% 7% 8% 7% 6% 10% 100% By Expiring Rent Per SF Austin Dallas/Fort Worth Houston Atlanta Charlotte Los Angeles Louisville Nashville Tampa Washington, D.C. $ $ $ $ $ $ $ $ $ 30.53 28.05 39.81 29.00 24.89 36.21 17.40 16.23 — $ $ $ $ $ $ $ $ $ 36.24 30.50 24.67 25.50 32.50 36.80 20.20 19.42 — $ $ $ $ $ $ $ $ $ 36.15 22.97 33.74 16.00 34.63 36.00 19.05 20.29 — $ $ $ $ $ $ $ $ $ 35.56 25.03 41.88 19.50 38.75 — 19.46 — — $ $ $ $ $ $ $ $ $ 38.07 26.85 40.94 25.29 23.13 — 20.73 — — $ $ $ $ $ $ $ $ $ 39.58 32.59 29.63 25.40 34.83 — 19.18 — — $ $ $ $ $ $ $ $ $ 43.08 32.29 33.75 16.33 35.71 — 23.00 19.29 — $ $ $ $ $ $ $ $ $ 39.52 25.43 49.46 28.75 — — 20.78 — — $ $ $ $ $ $ $ $ $ 41.97 28.93 48.12 — 35.84 — 23.66 — — $ $ $ $ $ $ $ $ $ — — 44.41 30.33 16.20 — 21.93 21.75 33.62 $ $ $ $ $ $ $ $ $ — 24.66 27.30 26.76 32.83 — 20.78 23.01 — $ $ $ $ $ $ $ $ $ 38.27 26.70 36.48 25.78 26.78 36.43 20.04 18.88 — $ 28.67 $ 42.20 $ 58.47 $ 55.86 $ 59.92 $ 63.91 $ 36.83 $ 120.12 $ 63.32 $ 59.80 $ 61.24 $ 56.86 Operating office properties in strategic markets $ 26.72 $ 30.55 $ 28.70 $ 31.06 $ 29.81 $ 33.12 $ 33.59 $ 39.57 $ 34.75 $ 38.45 $ 30.65 $ 31.46 Other operating office properties Total Notes: $ 26.36 $ 29.82 $ 33.96 $ 27.35 $ 28.44 $ 26.26 $ 26.82 $ 30.69 $ 32.31 $ 25.67 $ 19.52 $ 27.60 $ 26.55 $ 30.35 $ 30.20 $ 28.54 $ 29.37 $ 29.87 $ 30.25 $ 33.90 $ 33.47 $ 37.05 $ 25.37 $ 29.80 Leases with an expiration on the last day of the period are considered leased at the last day of the period (i.e., expiring on the first day of the following period). Reflects TIER REIT’s ownership %. Rentals shown above are the contractually obligated annualized base rent charged in the final month prior to lease termination grossed up to include current operating cost recoveries. TIER REIT Supplemental Operating and Financial Data 1st Quarter Page 20 |
|
|
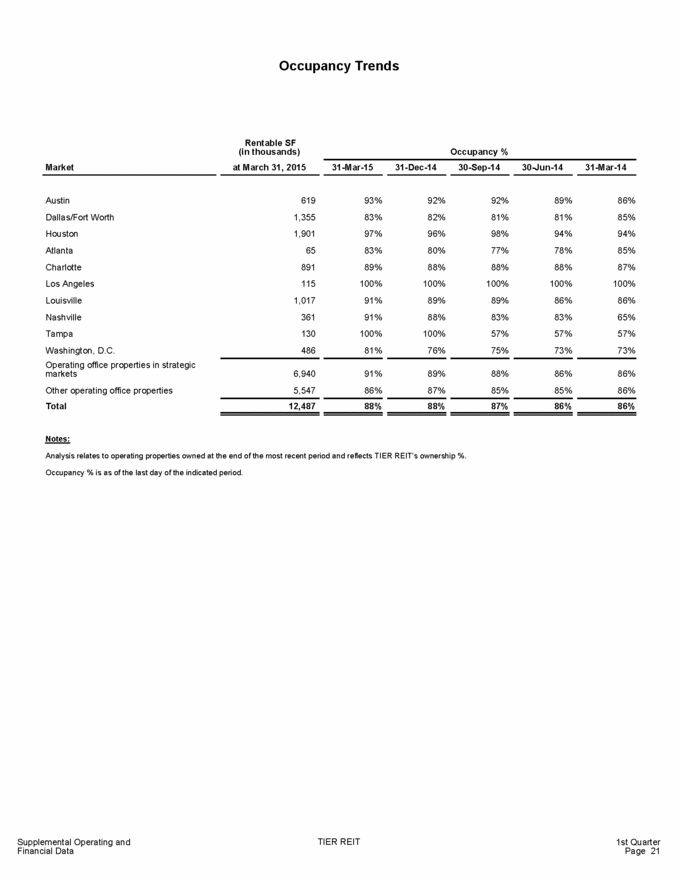
Occupancy Trends Rentable SF (in thousands) at March 31, 2015 Occupancy % Market 31-Mar-15 31-Dec-14 30-Sep-14 30-Jun-14 31-Mar-14 Austin Dallas/Fort Worth Houston Atlanta Charlotte Los Angeles Louisville Nashville Tampa Washington, D.C. Operating office properties in strategic markets Other operating office properties Total 619 1,355 1,901 65 891 115 1,017 361 130 486 93% 83% 97% 83% 89% 100% 91% 91% 100% 81% 92% 82% 96% 80% 88% 100% 89% 88% 100% 76% 92% 81% 98% 77% 88% 100% 89% 83% 57% 75% 89% 81% 94% 78% 88% 100% 86% 83% 57% 73% 86% 85% 94% 85% 87% 100% 86% 65% 57% 73% 6,940 5,547 91% 86% 89% 87% 88% 85% 86% 85% 86% 86% 12,487 88% 88% 87% 86% 86% Notes: Analysis relates to operating properties owned at the end of the most recent period and reflects TIER REIT’s ownership %. Occupancy % is as of the last day of the indicated period. Supplemental Operating and Financial Data TIER REIT 1st Quarter Page 21 |
|
|
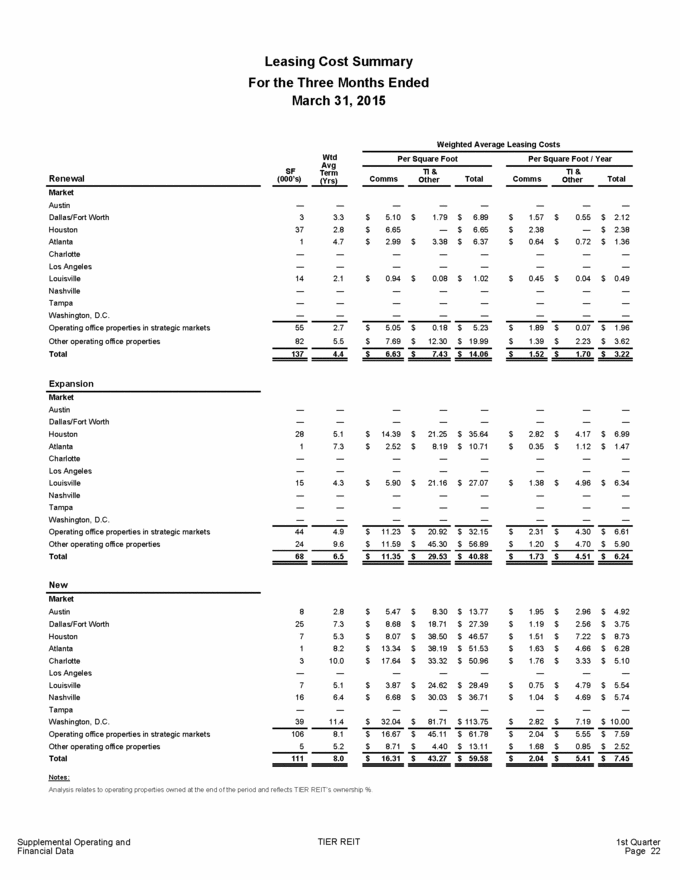
Leasing Cost Summary For the Three Months Ended March 31, 2015 Weighted Average Leasing Costs Wtd Per Square Foot Per Square Foot / Year Avg SF (000’s) TI & Other TI & Other Term (Yrs) Renewal Comms Total Comms Total Market Austin Dallas/Fort Worth Houston Atlanta Charlotte Los Angeles Louisville Nashville Tampa Washington, D.C. Operating office properties in strategic markets Other operating office properties Total — 3 37 1 — — 14 — — — — 3.3 2.8 4.7 — — 2.1 — — — — 5.10 6.65 2.99 — — 0.94 — — — — 1.79 — 3.38 — — 0.08 — — — — 6.89 6.65 6.37 — — 1.02 — — — — 1.57 2.38 0.64 — — 0.45 — — — — 0.55 — 0.72 — — 0.04 — — — — 2.12 2.38 1.36 — — 0.49 — — — $ $ $ $ $ $ $ $ $ $ $ $ $ $ $ $ $ $ $ $ $ $ 55 82 2.7 5.5 $ $ 5.05 7.69 $ $ 0.18 12.30 $ $ 5.23 19.99 $ $ 1.89 1.39 $ $ 0.07 2.23 $ $ 1.96 3.62 137 4.4 $ 6.63 $ 7.43 $ 14.06 $ 1.52 $ 1.70 $ 3.22 Expansion Market Austin Dallas/Fort Worth Houston Atlanta Charlotte Los Angeles Louisville Nashville Tampa Washington, D.C. Operating office properties in strategic markets Other operating office properties Total — — 28 1 — — 15 — — — — — 5.1 7.3 — — 4.3 — — — — — 14.39 2.52 — — 5.90 — — — — — 21.25 8.19 — — 21.16 — — — — — 35.64 10.71 — — 27.07 — — — — — 2.82 0.35 — — 1.38 — — — — — 4.17 1.12 — — 4.96 — — — — — 6.99 1.47 — — 6.34 — — — $ $ $ $ $ $ $ $ $ $ $ $ $ $ $ $ $ $ 44 24 4.9 9.6 $ $ 11.23 11.59 $ $ 20.92 45.30 $ $ 32.15 56.89 $ $ 2.31 1.20 $ $ 4.30 4.70 $ $ 6.61 5.90 68 6.5 $ 11.35 $ 29.53 $ 40.88 $ 1.73 $ 4.51 $ 6.24 New Market Austin Dallas/Fort Worth Houston Atlanta Charlotte Los Angeles Louisville Nashville Tampa Washington, D.C. Operating office properties in strategic markets Other operating office properties Total 8 25 7 1 3 — 7 16 — 39 2.8 7.3 5.3 8.2 10.0 — 5.1 6.4 — 11.4 $ $ $ $ $ 5.47 8.68 8.07 13.34 17.64 — 3.87 6.68 — 32.04 $ $ $ $ $ 8.30 18.71 38.50 38.19 33.32 — 24.62 30.03 — 81.71 $ $ $ $ $ 13.77 27.39 46.57 51.53 50.96 — 28.49 36.71 — $ $ $ $ $ 1.95 1.19 1.51 1.63 1.76 — 0.75 1.04 — 2.82 $ $ $ $ $ 2.96 2.56 7.22 4.66 3.33 — 4.79 4.69 — 7.19 $ $ $ $ $ 4.92 3.75 8.73 6.28 5.10 — 5.54 5.74 — $ $ $ $ $ $ $ $ $ $ $ $ $ $ $ 113.75 $ $ $ 10.00 106 5 8.1 5.2 $ $ 16.67 8.71 $ $ 45.11 4.40 $ $ 61.78 13.11 $ $ 2.04 1.68 $ $ 5.55 0.85 $ $ 7.59 2.52 111 8.0 $ 16.31 $ 43.27 $ 59.58 $ 2.04 $ 5.41 $ 7.45 Notes: Analysis relates to operating properties owned at the end of the period and reflects TIER REIT’s ownership %. Supplemental Operating and Financial Data TIER REIT 1st Quarter Page 22 |
|
|
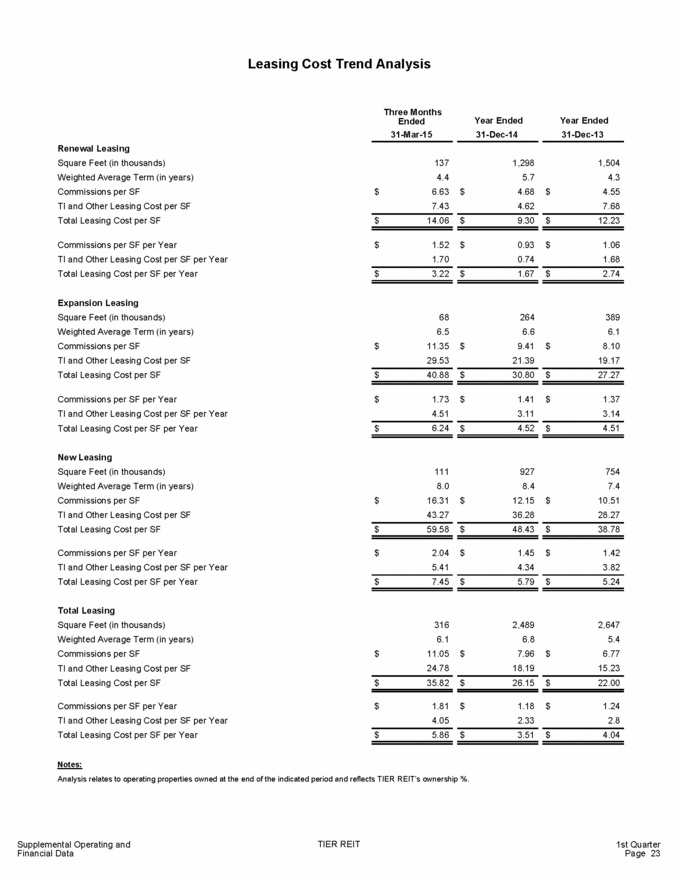
Leasing Cost Trend Analysis Three Months Ended 31-Mar-15 Year Ended 31-Dec-14 Year Ended 31-Dec-13 Renewal Leasing Square Feet (in thousands) Weighted Average Term (in years) Commissions per SF TI and Other Leasing Cost per SF Total Leasing Cost per SF 137 4.4 6.63 7.43 1,298 5.7 4.68 4.62 1,504 4.3 4.55 7.68 $ $ $ $ 14.06 $ 9.30 $ 12.23 Commissions per SF per Year TI and Other Leasing Cost per SF per Year Total Leasing Cost per SF per Year $ 1.52 1.70 $ 0.93 0.74 $ 1.06 1.68 $ 3.22 $ 1.67 $ 2.74 Expansion Leasing Square Feet (in thousands) Weighted Average Term (in years) Commissions per SF TI and Other Leasing Cost per SF Total Leasing Cost per SF 68 6.5 11.35 29.53 264 6.6 9.41 21.39 389 6.1 8.10 19.17 $ $ $ $ 40.88 $ 30.80 $ 27.27 Commissions per SF per Year TI and Other Leasing Cost per SF per Year Total Leasing Cost per SF per Year $ 1.73 4.51 $ 1.41 3.11 $ 1.37 3.14 $ 6.24 $ 4.52 $ 4.51 New Leasing Square Feet (in thousands) Weighted Average Term (in years) Commissions per SF TI and Other Leasing Cost per SF Total Leasing Cost per SF 111 8.0 16.31 43.27 927 8.4 12.15 36.28 754 7.4 10.51 28.27 $ $ $ $ 59.58 $ 48.43 $ 38.78 Commissions per SF per Year TI and Other Leasing Cost per SF per Year Total Leasing Cost per SF per Year $ 2.04 5.41 $ 1.45 4.34 $ 1.42 3.82 $ 7.45 $ 5.79 $ 5.24 Total Leasing Square Feet (in thousands) Weighted Average Term (in years) Commissions per SF TI and Other Leasing Cost per SF Total Leasing Cost per SF 316 6.1 11.05 24.78 2,489 6.8 7.96 18.19 2,647 5.4 6.77 15.23 $ $ $ $ 35.82 $ 26.15 $ 22.00 Commissions per SF per Year TI and Other Leasing Cost per SF per Year Total Leasing Cost per SF per Year $ 1.81 4.05 $ 1.18 2.33 $ 1.24 2.8 $ 5.86 $ 3.51 $ 4.04 Notes: Analysis relates to operating properties owned at the end of the indicated period and reflects TIER REIT’s ownership %. Supplemental Operating and Financial Data TIER REIT 1st Quarter Page 23 |
|
|
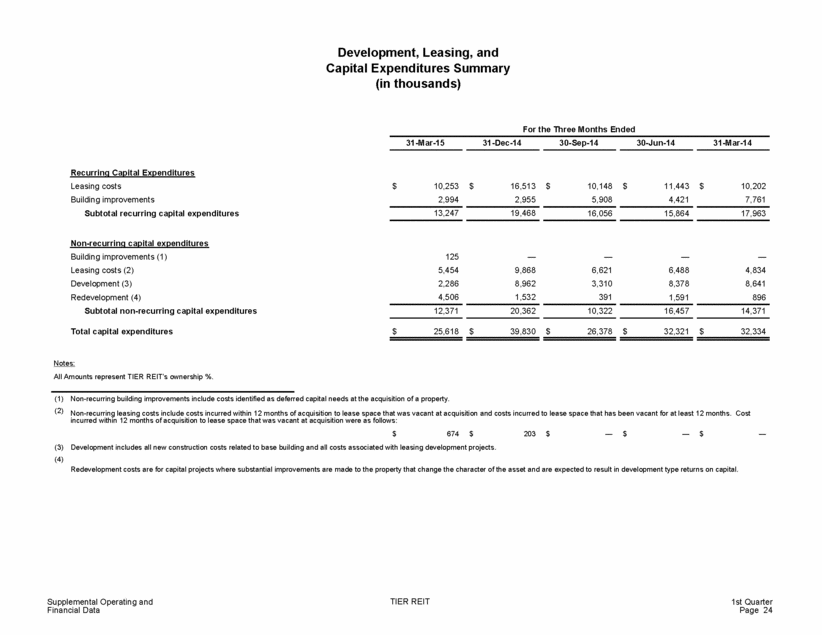
Development, Leasing, and Capital Expenditures Summary (in thousands) For the Three Months Ended 31-Mar-15 31-Dec-14 30-Sep-14 30-Jun-14 31-Mar-14 Recurring Capital Expenditures Leasing costs Building improvements Subtotal recurring capital expenditures $ 10,253 2,994 $ 16,513 2,955 $ 10,148 5,908 $ 11,443 4,421 $ 10,202 7,761 13,247 19,468 16,056 15,864 17,963 Non-recurring capital expenditures Building improvements (1) Leasing costs (2) Development (3) Redevelopment (4) Subtotal non-recurring capital expenditures 125 5,454 2,286 4,506 — 9,868 8,962 1,532 — 6,621 3,310 391 — 6,488 8,378 1,591 — 4,834 8,641 896 12,371 20,362 10,322 16,457 14,371 Total capital expenditures $ 25,618 $ 39,830 $ 26,378 $ 32,321 $ 32,334 Notes: All Amounts represent TIER REIT’s ownership %. (1) (2) Non-recurring building improvements include costs identified as deferred capital needs at the acquisition of a property. Non-recurring leasing costs include costs incurred within 12 months of acquisition to lease space that was vacant at acquisition and costs incurred to lease space that has been vacant for at least 12 months. Cost incurred within 12 months of acquisition to lease space that was vacant at acquisition were as follows: $ 674 $ 203 $ — $ — $ — (3) (4) Development includes all new construction costs related to base building and all costs associated with leasing development projects. Redevelopment costs are for capital projects where substantial improvements are made to the property that change the character of the asset and are expected to result in development type returns on capital. Supplemental Operating and Financial Data TIER REIT 1st Quarter Page 24 |
|
|
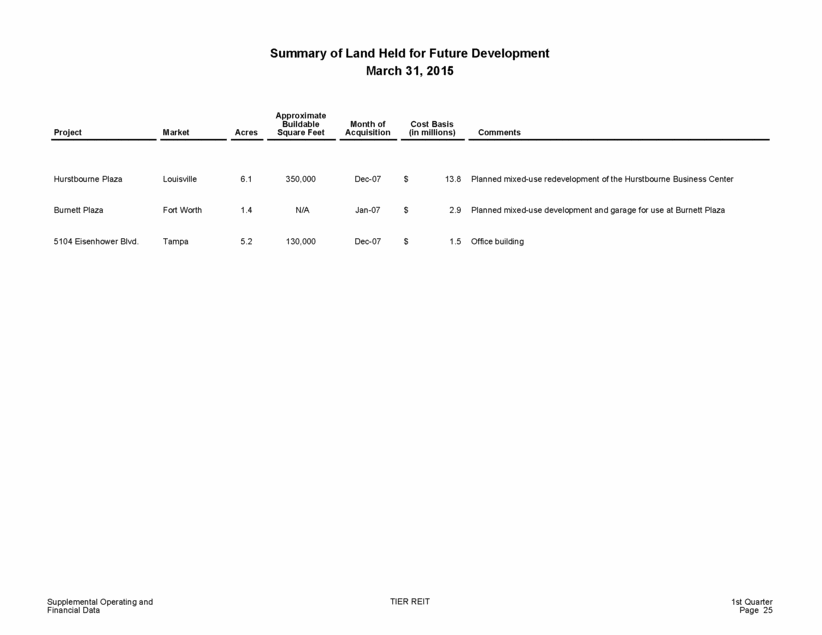
Summary of Land Held for Future Development March 31, 2015 Approximate Buildable Square Feet Month of Acquisition Cost Basis (in millions) Project Market Acres Comments Hurstbourne Plaza Louisville 6.1 350,000 Dec-07 $ 13.8 Planned mixed-use redevelopment of the Hurstbourne Business Center Burnett Plaza Fort Worth 1.4 N/A Jan-07 $ 2.9 Planned mixed-use development and garage for use at Burnett Plaza 5104 Eisenhower Blvd. Tampa 5.2 130,000 Dec-07 $ 1.5 Office building Supplemental Operating and Financial Data TIER REIT 1st Quarter Page 25 |
|
|
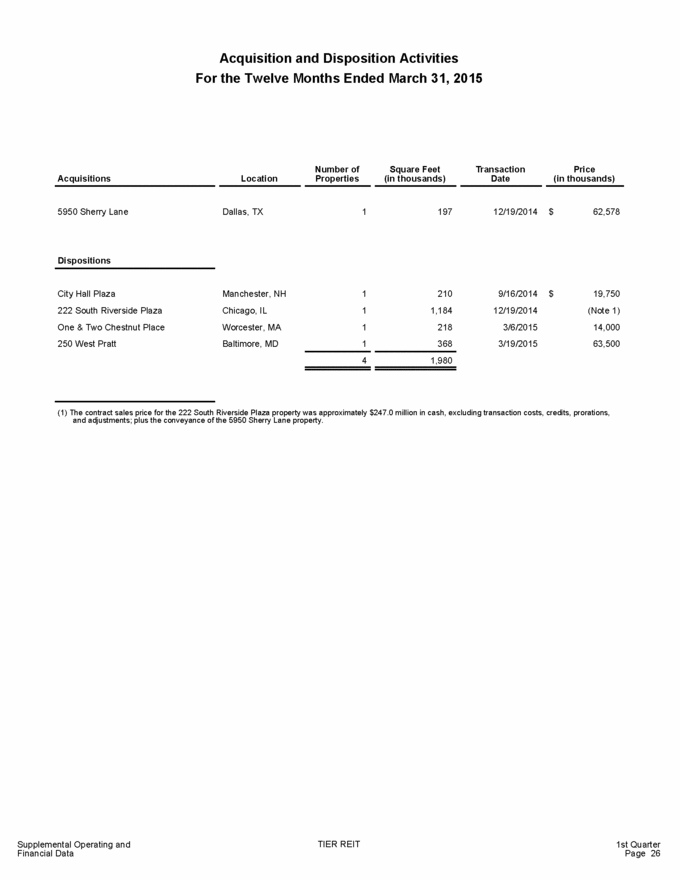
Acquisition and Disposition Activities For the Twelve Months Ended March 31, 2015 Number of Properties Square Feet (in thousands) Transaction Date Price (in thousands) Acquisitions Location 5950 Sherry Lane Dallas, TX 1 197 12/19/2014 $ 62,578 Dispositions City Hall Plaza 222 South Riverside Plaza One & Two Chestnut Place 250 West Pratt Manchester, NH Chicago, IL Worcester, MA Baltimore, MD 1 1 1 1 210 1,184 218 368 9/16/2014 12/19/2014 3/6/2015 3/19/2015 $ 19,750 (Note 1) 14,000 63,500 4 1,980 (1) The contract sales price for the 222 South Riverside Plaza property was approximately $247.0 million in cash, excluding transaction costs, credits, prorations, and adjustments; plus the conveyance of the 5950 Sherry Lane property. Supplemental Operating and Financial Data TIER REIT 1st Quarter Page 26 |
|
|
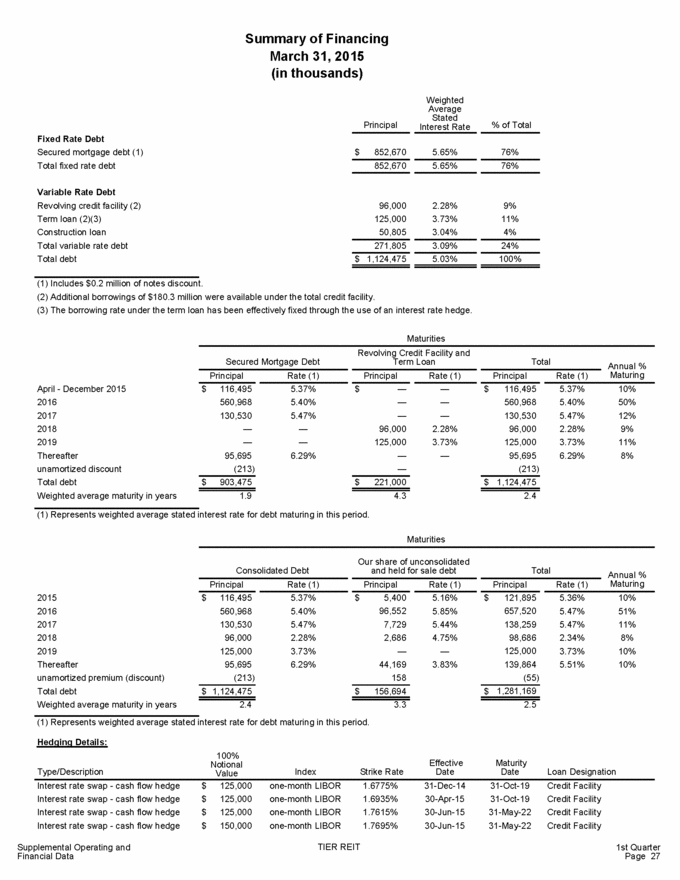
Summary of Financing March 31, 2015 (in thousands) Weighted Average Stated Interest Rate Principal % of Total Fixed Rate Debt Secured mortgage debt (1) Total fixed rate debt $ 852,670 5.65% 76% 852,670 5.65% 76% Variable Rate Debt Revolving credit facility (2) Term loan (2)(3) Construction loan Total variable rate debt Total debt 96,000 125,000 50,805 2.28% 3.73% 3.04% 9% 11% 4% 271,805 3.09% 24% $ 1,124,475 5.03% 100% (1) Includes $0.2 million of notes discount. (2) Additional borrowings of $180.3 million were available under the total credit facility. (3) The borrowing rate under the term loan has been effectively fixed through the use of an interest rate hedge. Maturities Revolving Credit Facility and Term Loan Secured Mortgage Debt Total Annual % Maturing Principal Rate (1) Principal Rate (1) Principal Rate (1) April - December 2015 2016 2017 2018 2019 Thereafter unamortized discount Total debt Weighted average maturity in years $ 116,495 560,968 130,530 — — 95,695 (213) 5.37% 5.40% 5.47% — — 6.29% $ — — — 96,000 125,000 — — — — — 2.28% 3.73% — $ 116,495 560,968 130,530 96,000 125,000 95,695 (213) 5.37% 5.40% 5.47% 2.28% 3.73% 6.29% 10% 50% 12% 9% 11% 8% $ 903,475 $ 221,000 $ 1,124,475 1.9 4.3 2.4 (1) Represents weighted average stated interest rate for debt maturing in this period. Maturities Our share of unconsolidated and held for sale debt Consolidated Debt Total Annual % Maturing Principal Rate (1) Principal Rate (1) Principal Rate (1) 2015 2016 2017 2018 2019 Thereafter unamortized premium (discount) Total debt Weighted average maturity in years $ 116,495 560,968 130,530 96,000 125,000 95,695 (213) 5.37% 5.40% 5.47% 2.28% 3.73% 6.29% $ 5,400 96,552 7,729 2,686 — 44,169 158 5.16% 5.85% 5.44% 4.75% — 3.83% $ 121,895 657,520 138,259 98,686 125,000 139,864 (55) 5.36% 5.47% 5.47% 2.34% 3.73% 5.51% 10% 51% 11% 8% 10% 10% $ 1,124,475 $ 156,694 $ 1,281,169 2.4 3.3 2.5 (1) Represents weighted average stated interest rate for debt maturing in this period. Hedging Details: 100% Effective Date Maturity Date Notional Value Type/Description Index Strike Rate Loan Designation Interest rate swap - cash flow hedge Interest rate swap - cash flow hedge Interest rate swap - cash flow hedge Interest rate swap - cash flow hedge $ $ $ $ 125,000 125,000 125,000 150,000 one-month LIBOR one-month LIBOR one-month LIBOR one-month LIBOR 1.6775% 1.6935% 1.7615% 1.7695% 31-Dec-14 30-Apr-15 30-Jun-15 30-Jun-15 31-Oct-19 31-Oct-19 31-May-22 31-May-22 Credit Facility Credit Facility Credit Facility Credit Facility TIER REIT Supplemental Operating and Financial Data 1st Quarter Page 27 |
|
|
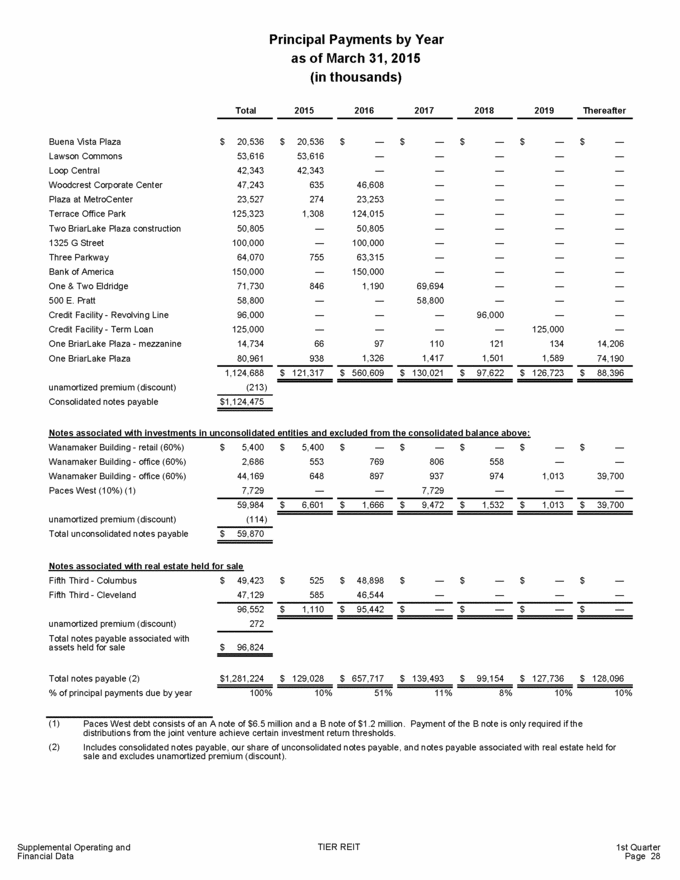
Principal Payments by Year as of March 31, 2015 (in thousands) Total 2015 2016 2017 2018 2019 Thereafter Buena Vista Plaza Lawson Commons Loop Central Woodcrest Corporate Center Plaza at MetroCenter Terrace Office Park Two BriarLake Plaza construction 1325 G Street Three Parkway Bank of America One & Two Eldridge 500 E. Pratt Credit Facility - Revolving Line Credit Facility - Term Loan One BriarLake Plaza - mezzanine One BriarLake Plaza $ 20,536 53,616 42,343 47,243 23,527 125,323 50,805 100,000 64,070 150,000 71,730 58,800 96,000 125,000 14,734 80,961 $ 20,536 53,616 42,343 635 274 1,308 — — 755 — 846 — — — 66 938 $ — — — 46,608 23,253 124,015 50,805 100,000 63,315 150,000 1,190 — — — 97 1,326 $ — — — — — — — — — — 69,694 58,800 — — 110 1,417 $ — — — — — — — — — — — — 96,000 — 121 1,501 $ — — — — — — — — — — — — — 125,000 134 1,589 $ — — — — — — — — — — — — — — 14,206 74,190 1,124,688 (213) $ 121,317 $ 560,609 $ 130,021 $ 97,622 $ 126,723 $ 88,396 unamortized premium (discount) Consolidated notes payable $1,124,475 Notes associated with investments in unconsolidated entities and excluded from the consolidated balance above: Wanamaker Building - retail (60%) Wanamaker Building - office (60%) Wanamaker Building - office (60%) Paces West (10%) (1) $ 5,400 2,686 44,169 7,729 $ 5,400 553 648 — $ — 769 897 — $ — 806 937 7,729 $ — 558 974 — $ — — 1,013 — $ — — 39,700 — 59,984 (114) $ 6,601 $ 1,666 $ 9,472 $ 1,532 $ 1,013 $ 39,700 unamortized premium (discount) Total unconsolidated notes payable $ 59,870 Notes associated with real estate held for sale Fifth Third - Columbus Fifth Third - Cleveland $ 49,423 47,129 $ 525 585 $ 48,898 46,544 $ — — $ — — $ — — $ — — 96,552 272 $ 1,110 $ 95,442 $ — $ — $ — $ — unamortized premium (discount) Total notes payable associated with assets held for sale $ 96,824 Total notes payable (2) % of principal payments due by year $1,281,224 $ 129,028 $ 657,717 $ 139,493 $ 99,154 $ 127,736 $ 128,096 100% 10% 51% 11% 8% 10% 10% (1) Paces West debt consists of an A note of $6.5 million and a B note of $1.2 million. Payment of the B note is only required if the distributions from the joint venture achieve certain investment return thresholds. Includes consolidated notes payable, our share of unconsolidated notes payable, and notes payable associated with real estate held for sale and excludes unamortized premium (discount). (2) TIER REIT Supplemental Operating and Financial Data 1st Quarter Page 28 |
|
|
Definitions of Non-GAAP Financial Measures We use non-GAAP financial measures in our public filings and other public disclosures. These non-GAAP financial measures are defined below. Funds from Operations (“FFO”) and Modified Funds from Operations (“MFFO”) Historical cost accounting for real estate assets in accordance with GAAP implicitly assumes that the value of real estate diminishes predictably over time. Since real estate values have historically risen or fallen with market conditions, many industry investors and analysts have considered the presentation of operating results for real estate companies that use historical cost accounting alone to be insufficient for evaluating operating performance. FFO is a non-GAAP financial measure that is widely recognized as a measure of a REIT’s operating performance. We use FFO as defined by the National Association of Real Estate Investment Trusts (“NAREIT”) in the April 2002 “White Paper on Funds From Operations” which is net income (loss), computed in accordance with GAAP, excluding extraordinary items, as defined by GAAP, gains (or losses) from sales of property and impairments of depreciable real estate (including impairments of investments in unconsolidated joint ventures and partnerships which resulted from measurable decreases in the fair value of the depreciable real estate held by the joint venture or partnership), plus depreciation and amortization on real estate assets, and after related adjustments for unconsolidated partnerships, joint ventures and subsidiaries and noncontrolling interests. The determination of whether impairment charges have been incurred is based partly on anticipated operating performance and hold periods. Estimated undiscounted cash flows from a property, derived from estimated future net rental and lease revenues, net proceeds on the sale of the property, and certain other ancillary cash flows are taken into account in determining whether an impairment charge has been incurred. While impairment charges for depreciable real estate are excluded from net income (loss) in the calculation of FFO as described above, impairments reflect a decline in the value of the applicable property which we may not recover. We believe that the use of FFO, together with the required GAAP presentations, is helpful in understanding our operating performance because it excludes real estate-related depreciation and amortization, gains and losses from property dispositions, impairments of depreciable real estate assets, and extraordinary items, and as a result, when compared year to year, reflects the impact on operations from trends in occupancy rates, rental rates, operating costs, development activities, general and administrative expenses, and interest costs, which are not immediately apparent from net income. Factors that impact FFO include fixed costs, yields on cash held in accounts, income from portfolio properties and other portfolio assets, interest rates on debt financing, and operating expenses. Since FFO was promulgated, several new accounting pronouncements have been issued, such that the presentation of FFO alone may be insufficient to evaluate operating performance. Accordingly, in addition to FFO, we use MFFO, as defined by the Investment Program Association (“IPA”). The IPA definition of MFFO excludes from FFO the following items: (1) (2) (3) (4) (5) acquisition fees and expenses; straight-line rent amounts, both income and expense; amortization of above-or below-market intangible lease assets and liabilities; amortization of discounts and premiums on debt investments; impairment charges on real estate related assets to the extent not already excluded from net income in the calculation of FFO, such as impairments of non-depreciable properties, loans receivable, and equity and debt investments; gains or losses from the early extinguishment of debt; gains or losses on the extinguishment or sales of hedges, foreign exchange, securities, and other derivative holdings except where the trading of such instruments is a fundamental attribute of our operations; gains or losses related to fair value adjustments for interest rate swaps and other derivatives not qualifying for hedge accounting, foreign exchange holdings, and other securities; gains or losses related to consolidation from, or deconsolidation to, equity accounting; gains or losses related to contingent purchase price adjustments; and adjustments related to the above items for unconsolidated entities in the application of equity accounting. (6) (7) (8) (9) (10) (11) We believe that MFFO is a helpful measure of operating performance because it excludes certain non-operating activities and certain recurring non-cash operating adjustments as outlined above. Accordingly, we believe that MFFO can be a useful metric in assessing the sustainability of operating performance. As explained below, management’s evaluation of our operating performance excludes the items considered in the calculation of MFFO based on the following economic considerations: • Acquisition fees and expenses. In evaluating investments in real estate, including both business combinations and investments accounted for under the equity method of accounting, management’s investment models and analyses differentiate costs to acquire the investment from the operations derived from the investment. GAAP requires acquisition costs related to business combinations and investments be expensed. We believe by excluding expensed acquisition costs, MFFO provides useful supplemental information that is comparable for our real estate investments and is consistent with management’s analysis of the investing and operating performance of our properties. Adjustments for straight-line rents and amortization of discounts and premiums on debt investments. In the application of GAAP, rental receipts and discounts and premiums on debt investments are allocated to periods using various systematic methodologies. This application will result in income recognition that could be significantly different than the underlying contract terms. By adjusting for these items, MFFO provides useful supplemental information on the realized economic impact of lease terms and debt investments and aligns results with management’s analysis of operating performance. Adjustments for amortization of above-or below-market intangible lease assets. Similar to depreciation and amortization of other real estate related assets that are excluded from FFO, GAAP implicitly assumes that the value of intangibles diminishes predictably over time and that these charges be recognized currently in revenue. Since real estate values and market lease rates in the aggregate have historically risen or fallen with market conditions, management believes that by excluding these charges, MFFO provides useful supplemental information on the realized economics of our real estate assets and aligns results with management’s analysis of operating performance. Impairment charges and gains or losses related to fair value adjustments for derivatives not qualifying for hedge accounting. Each of these items relates to a fair value adjustment, which, in part, is based on the impact of current market fluctuations and underlying assessments of general market conditions which may not be directly attributable to our current operating performance. As these gains • • • Supplemental Operating and Financial Data TIER REIT 1st Quarter Page 29 |
|
|
or losses relate to underlying long-term assets and liabilities where we are not speculating or trading assets, management believes MFFO provides useful supplemental information by focusing on the changes in our core operating fundamentals rather than changes that may reflect anticipated gains or losses. In particular, because in most circumstances GAAP impairment charges are not allowed to be reversed if the underlying fair values improve or because the timing of impairment charges may lag the onset of certain operating consequences, we believe MFFO provides useful supplemental information related to current consequences, benefits and sustainability related to rental rates, occupancy, and other core operating fundamentals. Adjustment for gains or losses related to early extinguishment of hedges, debt, consolidation or deconsolidation, and contingent purchase price. Similar to extraordinary items excluded from FFO, these adjustments are not related to our continuing operations. By excluding these items, management believes that MFFO provides supplemental information related to sustainable operations that will be more comparable between other reporting periods and to other real estate operators. • By providing MFFO, we believe we are presenting useful information in the analysis of long-term operating activities. Many of these adjustments are similar to adjustments required by SEC rules for the presentation of pro forma business combination disclosures, particularly acquisition expenses, gains or losses recognized in business combinations, and other activity not representative of future activities. MFFO also provides useful information in analyzing comparability between reporting periods in assessing the sustainability of our operating performance. MFFO is primarily affected by the same factors as FFO, but without certain non-operating activities and certain recurring non-cash operating adjustments; therefore, we believe fluctuations in MFFO are more indicative of changes and potential changes in operating activities. MFFO is also more comparable in evaluating our performance over time. We also believe that MFFO is a recognized measure of sustainable operating performance by the real estate industry and is useful in comparing the sustainability of our operating performance with the sustainability of the operating performance of other real estate companies that do not have a similar level of involvement in acquisition activities or are not similarly affected by impairments and other non-operating charges. FFO or MFFO should neither be considered as an alternative to net income (loss), nor as indications of our liquidity, nor are they indicative of funds available to fund our cash needs, including our ability to make distributions. Additionally, the exclusion of impairments limits the usefulness of FFO and MFFO as historical operating performance measures since an impairment charge indicates that operating performance has been permanently affected. FFO and MFFO are not useful measures in evaluating net asset value because impairments are taken into account in determining net asset value but not in determining FFO or MFFO. Both FFO and MFFO are non-GAAP measurements and should be reviewed in connection with other GAAP measurements. Our FFO attributable to common stockholders and MFFO attributable to common stockholders as presented may not be comparable to amounts calculated by other REITs that do not define these terms in accordance with the current NAREIT or IPA definitions or that interpret those definitions differently. Funds Available for Distribution (“FAD”) FAD is a non-GAAP financial measure that we define as MFFO, excluding fair value mark to market adjustments, non-real estate depreciation and amortization, non-cash stock-based compensation expense, accretion of Series A Convertible Preferred Stock, the amortization of financing costs, and realized gains (losses) from the early extinguishment of derivatives, less recurring capital expenditures, each as adjusted for our pro rata share of consolidated and unconsolidated amounts. Recurring capital expenditures are those capital expenditures, tenant improvements, leasing commissions and deferred lease incentives that are incurred to maintain current in-place rents including the leasing costs incurred to replace tenants upon lease expiration. Recurring capital expenditures exclude non-recurring capital expenditures. Non-recurring capital expenditures are those capital expenditures (1) incurred to change the class or characterization of an asset, (2) identified as deferred capital needs at the acquisition of a property and were incurred within a reasonable period of time subsequent to the property’s acquisition, or (3) incurred for tenant improvements, leasing commissions, or deferred lease incentives within twelve months of acquisition to lease space that was vacant at acquisition and costs incurred to lease space that has been vacant for at least twelve months. Although our FAD may not be comparable to that of other REITs and real estate companies, we believe it provides a meaningful indicator of our ability to fund cash needs and to make cash distributions to equity owners. We believe that net income is the most directly comparable GAAP financial measure to FAD. FAD does not represent cash generated from operating activities in accordance with GAAP and should not be considered as an alternative to net income as an indication of our performance or to cash flows as a measure of liquidity or our ability to make distributions. Net Operating Income (“NOI”) NOI is a non-GAAP financial measure equal to rental revenue, less property operating expenses (excluding tenant improvement demolition costs), real estate taxes, and property management expenses. Our management uses NOI internally as a performance measure and believes NOI is useful to investors as a performance measure because NOI reflects only those income and expense items that are incurred at the property level and is therefore a useful measure for evaluating a property’s performance. Using NOI on a comparative basis allows investors to evaluate property level performance to: (a) hold management accountable for maintaining or increasing property level NOI from period to period and (b) compare the operating performance of our properties in a given market with the operating performance of other real estate companies in the same market, and consequently allocate their own investment capital accordingly. Further, we use NOI internally as a performance measure and believe NOI is useful to investors as a performance measure because, when compared year over year, NOI reflects the impact on operations from trends in occupancy rates, rental rates, operating costs, acquisition and development activities, and general and administrative expenses on an un-leveraged basis, providing perspective not immediately apparent from net income. NOI excludes certain components from net income in order to provide results that are more closely related to a property’s results of operations. Certain items such as interest expense, while included in net income, do not affect the operating performance of a real estate asset and are often incurred at the corporate level as opposed to the property level. In addition, depreciation and amortization are excluded from NOI because historical cost accounting for real estate assets implicitly assumes that the value of real estate assets diminishes predictably over time, and, instead, real estate values have historically risen or fallen with market conditions. NOI presented by us may not be comparable to NOI reported by other REITs that do not define NOI exactly as we do. We believe that in order to facilitate a clear understanding of our operating results, NOI should be examined in conjunction with net income as presented in our consolidated financial statements and notes thereto. NOI should not be considered as an alternative to net income as an indication of our performance or to cash flows as a measure of liquidity or our ability to make distributions. Supplemental Operating and Financial Data TIER REIT 1st Quarter Page 30 |
|
|
Same Store GAAP NOI and Same Store Cash NOI Same Store GAAP NOI is a non-GAAP financial measure equal to rental revenue, less lease termination fee income, property operating expenses (excluding tenant improvement demolition costs), real estate taxes, and property management expenses for our same store properties and is considered a non-GAAP financial measure. Same Store Cash NOI is equal to Same Store GAAP NOI less non-cash revenue items including straight-line rent adjustments and the amortization of above-and below-market rent. The same store properties include our consolidated operating properties owned and operated for the entirety of the current and comparable periods. We view Same Store GAAP NOI and Same Store Cash NOI as important measures of the operating performance of our properties because they allow us to compare operating results of consolidated properties owned and operating for the entirety of the current and comparable periods and therefore eliminate variations caused by acquisitions or dispositions during the periods under review. Same Store GAAP NOI and Same Store Cash NOI presented by us may not be comparable to Same Store GAAP NOI or Same Store Cash NOI reported by other REITs that do not define Same Store GAAP NOI or Same Store Cash NOI exactly as we do. We believe that in order to facilitate a clear understanding of our operating results, Same Store GAAP NOI and Same Store Cash NOI should be examined in conjunction with net income (loss) as presented in our consolidated financial statements and notes thereto. Same Store GAAP NOI and Same Store Cash NOI should not be considered as alternatives to net income (loss) as an indication of our performance or to cash flows as a measure of liquidity or our ability to make distributions. Earnings before Interest, Taxes, Depreciation and Amortization (“EBITDA”) EBITDA, a non-GAAP financial measure, is defined as net income (loss), plus interest expense, income tax expense, and depreciation and amortization expense, and after related adjustments for unconsolidated partnerships, joint ventures and subsidiaries, and noncontrolling interests. EBITDA is not intended to represent cash flow for the period, is not presented as an alternative to operating income as an indicator of operating performance, should not be considered in isolation or as a substitute for measures of performance prepared in accordance with GAAP, and is not indicative of operating income or cash provided by operating activities as determined under GAAP. EBITDA is presented solely as a supplemental disclosure with respect to liquidity because we believe it provides useful information regarding our ability to service or incur debt. Supplemental Operating and Financial Data TIER REIT 1st Quarter Page 31 |
Exhibit 99.2
|
|
Regular Mail P.O. Box TIER REIT, Inc. PO Box 219433 Kansas City, MO 64121-9433 |
Express/Overnight Delivery: TIER REIT, Inc. 430 W. 7th St., STE 219433 Kansas City, MO. 64105 |
EXPECTED PUBLIC LISTING ON THE NEW YORK STOCK EXCHANGE
ON OR ABOUT JULY 23, 2015
July 7, 2015
Dear Stockholder:
We are pleased to announce that we anticipate listing our shares of common stock on the New York Stock Exchange (the “NYSE”) under the symbol “TIER” on or about July 23, 2015. While the completion of the listing remains subject to certain conditions, we have discussed our preparations to position the Company for an expected listing in our recent letter to you.
What Does a Listing Mean for Stockholders?
As a result of this expected listing, TIER REIT stockholders will be able to enjoy the benefits of owning stock in a publicly listed REIT, including increased liquidity. We believe the expected listing will increase our stockholders’ total return potential over the long term by providing the Company with greater access to additional capital to fund our disciplined and strategic growth strategy. Enclosed with this letter is your Direct Registration Transaction Advice (“DRTA”), which is a report of the number of TIER REIT shares you hold directly with our transfer agent, DST Systems (“DST”). You will need this DRTA if you wish to transfer your shares from your existing account with DST to a brokerage account with the firm of your choice.
You do not have to transfer your shares to a brokerage account; you can keep your account at the transfer agent indefinitely. However, your shares must be held in a brokerage account if you wish to sell them after our expected listing on the NYSE. If you already have a brokerage account, you may purchase additional TIER REIT shares without moving your current shares to that account.
If you wish to transfer your shares to a brokerage account, you will need to:
1. Provide the enclosed DRTA (or a copy) to your selected brokerage firm.
2. Complete any required paperwork and submit it to your brokerage firm.
3. Once the brokerage firm submits a request to transfer your shares, the shares will be credited to an account in your name at the brokerage firm and eligible for trading within three days.
Please note that your shares will not be eligible to be moved into a brokerage account until the expected listing on the NYSE takes place.
We encourage you to consult your financial advisor, brokerage firm, custodian or other trusted source of financial guidance to discuss your options.
Also, please note that a sale of your shares could result in a taxable event and that you should consult a qualified tax advisor prior to implementing any tax-related transactions. TIER REIT does not provide tax or legal advice.
Expected Tender Offer
In considering the options for your shares, we also want you to know that, in conjunction with our anticipated listing on the NYSE, we also expect to commence a “modified Dutch auction” tender offer. A modified Dutch auction tender offer is a process in which a company repurchases a certain number of shares from existing stockholders at the lowest price selected by the company within a specified price range. Tender offer documents with information about this expected tender offer, including detailed instructions on how to tender shares, will be published and mailed to all stockholders of record when the tender offer commences. As with any newly listed company, TIER REIT is likely to experience significant volatility in its share price in the days and weeks immediately following the expected listing as it may take some time for an efficient market to develop for our shares as institutional and other large investors evaluate the Company as an investment opportunity. Therefore, we are considering the expected tender offer to provide stockholders an alternative to selling their shares on the open market and also alleviate some anticipated volatility.
What’s Ahead for TIER REIT?
Following our expected public listing, we will continue to provide all stockholders with important information about the Company and announcements through our public filings with the Securities and Exchange Commission (the “SEC”). You can find all our public filings on our website at www.tierreit.com under the “Investor Relations” link and at the SEC’s website at www.sec.gov.
On the Company’s website you will find information about the Company’s leadership and financial strategy, including a video of a presentation to the investment community, answers to frequently asked questions, stockholder forms, recently filed presentations, and first quarter 2015 supplemental financial information. Additionally, if you move your shares to a brokerage account as discussed above, TIER REIT will no longer have your direct contact information in order to send letters such as this one. Therefore, we encourage you to visit our website at www.tierreit.com/ir to sign up for timely email communications and other information. Please note that the date for our second quarter 2015 conference call has not been set, though we will post this information on our website at least seven days in advance of the conference call.
NEW Contact Information for TIER REIT Shareholder Services
If you have additional questions about your account, our Shareholder Services team will continue to be available to assist you. Please note their new contact information:
Telephone: 844.782.0585 (toll-free)
Fax: 855.338.9449
Mailing Address: c/o DST Systems, P.O. Box 219433, Kansas City, MO 64121-9433
Email: [email protected]
Thank you for your investment in TIER REIT. We will continue to be focused and disciplined in our strategy as we move the Company forward. We appreciate your commitment to us and look forward to our next chapter as a publicly traded company.
Sincerely,

Scott W. Fordham
Chief Executive Officer and President
Enclosure
Important Information
This document is for informational purposes only and is neither an offer to buy nor the solicitation of an offer to sell any securities of the company. The tender offer will be made only pursuant to an offer to purchase, letter of transmittal and related materials that the Company intends to distribute to its stockholders and file with the SEC. The full details of the expected tender offer, including complete instructions on how to tender shares, will be included in the offer to purchase, the letter of transmittal, and other related materials, which the Company will distribute to stockholders and file with the SEC upon commencement of the expected tender offer. If the tender offer is commenced as expected, stockholders will be urged to carefully read the offer to purchase, the letter of transmittal, and other related materials when they become available, as they will contain important information, including the terms and conditions of the tender offer. If the tender offer is commenced as expected, stockholders will be able to obtain free copies of the offer to purchase, the letter of transmittal, and other related materials that the Company will file with the SEC on the SEC’s website at www.sec.gov or by calling the information agent for the contemplated offer, which will be identified in the materials filed with the SEC at the commencement of the expected tender offer. In addition, stockholders will be able to obtain free copies of the Company’s filings with the SEC from the Company’s website at www.tierreit.com/ir.
Forward-Looking Statements
This letter contains forward-looking statements relating to the business and financial outlook of TIER REIT, Inc. that are based on our current expectations, estimates, forecasts and projections and are not guarantees of future performance. These forward-looking statements include discussion and analysis of the financial condition of us and our subsidiaries, including our ability to rent space on favorable terms, our ability to address debt maturities and fund our capital requirements, our intentions to sell certain properties, the value of our assets, our anticipated capital expenditures, the amount and timing of any anticipated future cash distributions to our stockholders, and other matters. Words such as “may,” “anticipates,” “expects,” “intends,” “plans,” “believes,” “seeks,” “estimates,” “would,” “could,” “should,” “objectives,” “strategies,” “goals,” and variations of these words and similar expressions are intended to identify forward-looking statements. Actual results may differ materially from those expressed in these forward-looking statements, and you should not place undue reliance on any such statements. Factors that could cause actual results to vary materially from those expressed in forward-looking statements include changes in real estate conditions and in the capital markets, our ability to complete the listing of our shares of common stock on the NYSE in a timely manner or at all, our ability to complete the anticipated tender offer in a timely manner or at all, the price at which shares of our common stock may trade on the NYSE, which may be higher or lower than the purchase price in the anticipated tender offer, as well as the risk factors included in the Company’s Annual Report on Form 10-K for the fiscal year ended December 31, 2014 and Quarterly Report on Form 10-Q for the fiscal quarter ended March 31, 2015.
Exhibit 99.3
|
|
One & Two BriarLake Plaza Houston, TX Bank of America Plaza Charlotte, NC 1 COMPANY PRESENTATION July 2015 |
|
|
This presentation contains forward-looking statements, including discussion and analysis of the financial condition of us and our subsidiaries and other matters. These forward-looking statements are not historical facts but are the intent, belief or current expectations of our management based on their knowledge and understanding of our business and industry. Words such as “may,” “anticipates,” “expects,” “intends,” “plans,” “believes,” “seeks,” “estimates,” “would,” “could,” “should,” “objectives,” “strategies,” “goals,” and variations of these words and similar expressions are intended to identify forward-looking statements. We intend that such forward-looking statements be subject to the safe harbor provisions created by Section 27A of the Securities Act of 1933 and Section 21E of the Securities Exchange Act of 1934. These statements are not guarantees of future performance and are subject to risks, uncertainties and other factors, some of which are beyond our control, are difficult to predict and could cause actual results to differ materially from those expressed or forecasted in the forward-looking statements. Forward-looking statements that were true at the time made may ultimately prove to be incorrect or false. We caution you not to place undue reliance on forward-looking statements, which reflect our management's view only as of the date of this presentation. We undertake no obligation to update or revise forward-looking statements to reflect changed assumptions, the occurrence of unanticipated events or changes to future operating results. Factors that could cause actual results to differ materially from any forward-looking statements made in the presentation include but are not limited to: (i) market and economic challenges experienced by the U.S. economy or real estate industry as a whole and the local economic conditions in the markets in which our properties are located; (ii) our ability to renew expiring leases and lease vacant spaces at favorable rates or at all; (iii) the inability of tenants to continue paying their rent obligations due to bankruptcy, insolvency or a general downturn in their business; (iv) the availability of cash flow from operating activities to fund distributions and capital expenditures; (v) our ability to raise capital in the future by issuing additional equity or debt securities, selling our assets or otherwise to fund our future capital needs; (vi) our ability to strategically acquire or dispose of assets on favorable terms; (vii) our level of debt and the terms and limitations imposed on us by our debt agreements; (viii) our ability to retain our executive officers and other key personnel; (ix) our ability to successfully transition to directly providing certain property management and administrative services in connection with the termination of our property management agreement and our administrative services agreement; (x) unfavorable changes in laws or regulations impacting our business or our assets; (xi) our ability to complete the listing of our shares of common stock on a national securities exchange in a timely manner or at all; (xii) our ability to complete an issuer tender offer in a timely manner or at all; (xiii) the price at which shares of our common stock may trade on a national securities exchange, which may be higher or lower than the purchase price in the tender offer; and (xiv) factors that could affect our ability to qualify as a real estate investment trust. The forward-looking statements should be read in light of these and other risk factors identified in the “Risk Factors” section of our Annual Report on Form 10-K for the year ended December 31, 2014, and Quarterly Report on Form 10-Q for the quarter ended March 31, 2015, as filed with the Securities and Exchange Commission (the “SEC”). This presentation is for informational purposes only and is not an offer to buy or the solicitation of an offer to sell any of our securities. The tender offer will be made only pursuant to an offer to purchase, letter of transmittal and related materials that the Company intends to distribute to its stockholders and file with the SEC. The full details of the tender offer, including complete instructions on how to tender shares, will be included in the offer to purchase, the letter of transmittal and other related materials, which we will distribute to stockholders and file with the SEC upon commencement of the tender offer. Stockholders are urged to read the offer to purchase, the letter of transmittal and other related materials when they become available because they will contain important information, including the terms and conditions of the tender offer. Stockholders may obtain free copies of the offer to purchase, the letter of transmittal and other related materials that we file with the SEC at the SEC’s website at www.sec.gov or by calling the information agent for the contemplated tender offer, who will be identified in the materials filed with the SEC at the commencement of the tender offer. In addition, stockholders may obtain free copies of our filings with the SEC from the our website at www.tierreit.com. The modeling, projections, analyses, and other forward-looking information prepared by CoStar Portfolio Strategy, LLC (“CoStar”) and presented herein are based on financial and other information from public and proprietary sources, as well as various assumptions concerning future events and circumstances that are speculative, uncertain and subject to change without notice. Actual results and events may differ materially from the projections presented. All CoStar materials set forth herein (“CoStar Materials”) speak only as of the date referenced and may have materially changed since such date. CoStar does not purport that the CoStar Materials herein are comprehensive, and, while they are believed to be accurate, the CoStar Materials are not guaranteed to be free from error, omission or misstatement. CoStar has no obligation to update any of the CoStar Materials included in this document. All CoStar Materials are provided “as is,” without any guarantees, representations or warranties of any kind, including implied warranties of merchantability, non-infringement, title and fitness for a particular purpose. To the maximum extent permitted by law, CoStar disclaims any and all liability in the event any CoStar Materials prove to be inaccurate, incomplete or unreliable. CoStar does not sponsor, endorse, offer or promote an investment in the securities of TIER REIT, Inc. You should not construe any of the CoStar Materials as investment, tax, accounting or legal advice. 2 Forward-Looking Statements |
|
|
3 Presenters Presenter Title Years of experience Real estate Public company Joined TIER REIT Scott W. Fordham CHIEF EXECUTIVE OFFICER AND PRESIDENT 24 20 2008 Dallas E. Lucas CHIEF FINANCIAL OFFICER AND TREASURER 30 25 2014 William J. Reister CHIEF INVESTMENT OFFICER AND EXECUTIVE VICE PRESIDENT 29 20 2009 On average, over 27 years of real estate and over 21 years of public company experience |
|
|
NYSE ticker: TIER Listing date on NYSE: Anticipated listing to occur the week of July 20, 2015 Reverse stock split: 1-for-6 effected on June 2, 2015, resulting approximately 50 million shares outstanding in Distribution: $0.72 per share annualized distribution No “lock up”: Shares will be freely tradable; management will not sell shares in connection with the listing Tender offer: Upon listing, we expect to commence a tender offer targeting approximately 5% of total shares outstanding 4 Important Features of the Listing |
|
|
Management team with public REIT experience hired at the conclusion of capital raise in 2008 and post-investment phase to position company for a liquidity event Market conditions in 2009 provided a suboptimal backdrop for a liquidity event leading to the implementation of a strategic plan focused on repositioning the portfolio and strengthening the balance sheet for future growth Transitioned to self-management Reduced geographic footprint from 32 to 15 markets1 Reduced leverage from 69.3% to 39.5%2 1 Pro forma for disposition of Fifth Third Center (Columbus) 2 Leverage based on net debt divided by total market capitalization; assumes a share price based on estimated NAV of $4.25 per share as of 2Q’10 and $4.48 per share as of 4Q’14, respectively, both established with third party valuation firm (estimated per share value prior to the 1-for-6 reverse stock split effected on June 2) 5 Demonstrated Track Record of Change |
|
|
High-quality, Class A office portfolio 10.4mm square feet across 31 properties 88.4% occupied with well-staggered lease maturities Diverse tenant base and only 3.2% of net rentable area represented by energy tenants expiring prior to 2019 Focused strategy targeting markets with attractive long-term fundamentals Acquire, develop, and operate best-in-class office properties in our 7 target growth markets1 TIER1 Submarkets – primarily urban and amenity-rich locations in proximity to executive housing that disproportionately benefit from employment growth Strategic repositioning plan substantially complete Exited 17 non-strategic markets Reduced leverage from ~70% to ~40% and borrowing cost by ~130 bps2 Recycled approximately $160 million of capital into targeted growth markets Significant identifiable growth potential Approximately 39% cash NOI growth potential through 20173 Weighted-average in place rents ~6% below market $600 million of capital from remaining non-strategic properties to be redeployed into target growth markets Flexible balance sheet On track to achieve 7.0x net debt to EBITDA and pursue investment grade rating Well-staggered debt maturity profile with a weighted average remaining term of 4 years $225 million of existing investment liquidity4,5,6 Experienced management team and strong corporate governance On average, over 25 years of industry experience and three successful office REIT IPOs7 Non-executive Chairman and five of eight board members are independent 1 Target growth markets include Atlanta, Austin, Charlotte, Dallas, Denver, Houston, and Nashville 2 Leverage based on net debt divided by total market capitalization; assumes a share price based on estimated NAV of $4.25 per share as of 2Q’10 and $4.48 per share as of 4Q’14, respectively, both established with third party valuation firm (estimated per share value prior to the 1-for-6 reverse stock split effected on June 2) 3 See slide 21, Capture Embedded Growth, for additional detail 4 Represents portfolio and capital structure pro forma as of March 31, 2015 for the completed dispositions of United Plaza (Philadelphia), 1650 Arch (Philadelphia) and Fifth Third Center (Cleveland), and contribution of 90% of Washington, D.C. assets (1325 G Street and Colorado Building) into a new joint venture subsequent to quarter end and pending disposition of Fifth Third Center (Columbus) 5 Pro forma for a $275mm term loan swapped to fixed rate of 3.67% that was used to repay $150mm of mortgage debt on Bank of America Plaza in Charlotte and $125mm of mortgage debt on Terrace Office Park in Austin 6 Includes $159mm of cash and $66mm of availability under the revolving credit facility. See slide 47 for further detail 7 Includes Crescent Real Estate Equities, Maguire Properties and Prentiss Properties Trust 6 Three Eldridge Houston, TX Burnett Plaza Fort Worth, TX Bank of America Plaza Charlotte, NC Key Investment Highlights |
|
|
7 High-Quality, Class A Office Portfolio |
|
|
MN Non-strategic markets, 28% PA MD IL CO NJ KY TN Target growth markets, 60% D.C. CA NC Short-term value creation markets, 9% Other institutional markets, 3% GA TX Target Growth Markets Other Institutional Markets Short-term Value Creation Markets Non-strategic Markets FL Diversified portfolio of 31 properties totaling 10.4mm square feet located in 15 markets1 store cash NOI by 7.1% 10,682 4% 476 5% 3.7 Baa1 / A-6,780 6,254 3% 2% 161 240 2% 3% 11.7 5.1 A1 / A+ B3 / B 4,967 2% 219 2% 5.1 NR last 5 quarters4 1 Represents portfolio and capital structure pro forma as of March 31, 2015 for the completed dispositions of United Plaza (Philadelphia), 1650 Arch (Philadelphia) and Fifth Third Center (Cleveland), and contribution of 90% of Washington, D.C. assets (1325 G Street and Colorado Building) into a new joint venture subsequent to quarter end and pending disposition of Fifth Third Center (Columbus); See slide 14, Focused Investment Strategy, for additional detail 2 Pro forma for Disney lease at Buena Vista and for the AmeriCredit lease at Burnett Plaza; both signed in 2Q15 3 Ratings based on Moody’s and Standard & Poor’s 4 Tenant retention percentage based on renewals plus expansions divided by expiring space 8 Tenant Gross rental revenue ($mm) % of total rent Square feet % of total leased Wt. avg remaining term Credit ratings3 Increased 1st quarter 2015 year-over-year same Increased 1st quarter 2015 year-over-year same-store occupancy by 340 bps to 88.4% Strong historical tenant retention of 72% over the $15,2546%3894%3.2A2 / A U.S. Government12,0865%5106%4.6Aaa / AA+ 8,3473%2102%9.6Baa1 / A-6,0512%1902%5.8Ba3 / B+ 4,5192%1842%7.9NR 4,4912%1952%10.6NR Total$79,43132%2,77430%5.8 31 office properties comprising 10.4mm square feet Portfolio breakdown: Top 10 tenants2 High-Quality, Class A Office Portfolio Market composition NOI breakdown pro forma 3/31/15 1 |
|
|
High-quality, Class A portfolio consisting of over 4mm square feet and 45% of NOI as of 3/31/151 Houston: Two recently developed properties in Westchase and the Energy Corridor Asset quality and location command net rents in excess of market Only 64K sq. ft. of energy-related tenants expiring in 2015 or 2016 Dallas / Fort Worth: Burnett Plaza awarded International TOBY in 2014 Recently acquired 5950 Sherry Lane in prestigious, amenity-rich Preston Center submarket No energy-related tenants expiring in 2015 or 2016 Austin: Strategically located in Southwest submarket Diversified tenant base with limited exposure to technology and energy sector No energy-related tenants expiring in 2015 or 2016 8 buildings 2.2mm square feet $35.01 gross rent PSF 97% occupancy In-place rents ~10% below market One & Two BriarLake Plaza Three Eldridge 4 buildings 1.4mm square feet $24.10 gross rent PSF 83% occupancy In-place rents ~3% below market Burnett Plaza 5950 Sherry Lane 4 buildings 0.6mm square feet $35.97 gross rent PSF 93% occupancy In-place rents ~8% below market Focused on expanding presence in TIER1 Submarkets exhibiting strong economic fundamentals with long-term leasing opportunities Terrace Office Park Terrace Office Park Note: Annualized base rent per square foot and occupancy excludes Two BriarLake Plaza (Houston) 1 Represents 1Q’15 annualized GAAP NOI pro forma as of March 31, 2015 for the completed dispositions of United Plaza (Philadelphia), 1650 Arch (Philadelphia) and Fifth Third Center (Cleveland), and contribution of 90% of Washington, D.C. assets (1325 G Street and Colorado Building) into a new joint venture subsequent to quarter end and pending disposition of Fifth Third Center (Columbus) 9 Portfolio strategy Austin Dallas / Fort Worth Portfolio facts Houston Texas Portfolio Overview |
|
|
opportunity to acre land parcel Note: Gross rent per square foot and occupancy excludes Hurstbourne Plaza (Louisville) 1 As of 3/31/15 10 Long-term operating track record in each of our markets Number of Buildings 2 1 11 3 1 Square Feet (mm) 0.6 0.9 1.1 0.4 0.1 Gross Rent per Square Foot1 $21.84 $23.79 $18.95 $17.58 $25.75 Occupancy1 83% 89% 91% 91% 100% Select Highlights Capital commitments and BOMA 360 performance designation with ENERGY STAR® standards In-place rents ~8% below market Landmark office tower on corner of Trade and Tryon (“Main and Main”) with embedded value creation opportunity In-place rents ~16% below market Class A portfolio including mixed use redevelopment on 6.1 acres of land Increased occupancy from 78% to 91% since 2012 In-place rents at market Centrally located with ~50% of property leased to State of Tennessee through 2029 In-place rents ~3% below market Long-term lease with Fortune 500 company accompanied by develop adjacent 5.2 In-place rents at market Tampa 5104 Eisenhower Nashville MetroCenter Louisville One Oxmoor Place Charlotte Bank of America Plaza Atlanta Paces West Southeast Portfolio Overview |
|
|
Own and manage high-quality and environmentally-designed assets Burnett Plaza received the international TOBY award as Outstanding Building of the Year for 2013-2014 and Sustainability Award at the Downtown Fort Worth, Inc. Annual Meeting and Trailblazer Award ceremony Commitment to improve energy and resource efficiencies to reduce operating costs and uphold commitment to social responsibility 34 ENERGY STAR certified buildings and 12 LEED certified properties 40% increase in number of EPA ENERGY STAR certified buildings over past 5 years Industry recognized operational excellence 27 BOMA 360 properties and 7 TOBY award winners Highest percentage of BOMA 360 designations among U.S. REITs 11 One & Two BriarLake Plaza Houston, TX Burnett Plaza Dallas / Fort Worth, TX Bank of America Plaza Charlotte, NC One, Two & Three Eldridge Houston, TX Industry Recognized Operational Excellence |
|
|
Portfolio lease maturities (excl. Houston) 1,2 Houston lease maturities 1,2 38.6% 0.6% 0.6% 2015 2016 2017 2018 2019 2020 2021 2022+ 1 Pro forma as of March 31, 2015 for the completed dispositions of United Plaza (Philadelphia), 1650 Arch (Philadelphia) and Fifth Third Center (Cleveland), and contribution of 90% of Washington, D.C. assets (1325 G Street and Colorado Building) into a new joint venture subsequent to quarter end and pending disposition of Fifth Third Center (Columbus) 2 Schedule is pro forma for execution of leases at Buena Vista, MetroCenter and Woodcrest Corporate Center subsequent to March 31, 2015 3 Represents expiring annualized gross rent per square foot 12 Total SF expirations (000s) 5095971,1435801,3089885613,573 Cash gross rent per sq. ft. expiring3 $28.50$27.90$29.93$29.66$29.43$28.64$30.53$29.44 12.3%14.1% 6.6% 32.0% 3.7% 10.7% 5.5%6.4% 4.1% 6.3% 10.4% 3.0% 6.1% 8.2% 7.7% 5.9% 5.6% 2.3% 4.0% 3.7% Well-Staggered Lease Maturities |
|
|
13 Focused Investment Strategy |
|
|
targeted growth markets Target Growth Markets – Targeting high growth markets of Atlanta, Austin, Charlotte, Dallas, Denver, Houston and Nashville for expansion through acquisition and development of best-in-class properties Other Institutional Markets – Presence and significant experience in Southern California and Washington D.C. provide opportunities to diversify risk and enhance returns over the long-term Short-term Value Creation Markets – Ability to capitalize on short-term value creation opportunities in our existing markets of Louisville and Tampa Source: Moody’s Analytics; CoStar Portfolio Strategy, as of 1Q’15 Population and local GDP growth above the national average supporting amenity-rich environments attractive to the changing demographics of the labor force Historical rent growth driving significant mark-to-market rent spreads providing potential outsized income growth and development opportunities Highly educated and growing workforce with a significant Millennial population providing dynamic companies access to talented employment pools 14 Key attributes of target growth markets We target TIER1 Submarkets – primarily urban and amenity-rich locations in proximity to executive housing that disproportionately benefit from employment growth Strong forecasted job growth in Investment thesis Focused Investment Strategy |
|
|
Cumulative % change 2015 to 2019 by metro area Target growth markets U.S. average (excluding target growth markets) 17% 15% 10.3% 4.7% Austin Dallas /Houston Fort Worth NashvilleAtlantaCharlotteDenver Austin CharlotteAtlantaDallas /Houston Fort Worth Denver Nashville Source: Moody’s Analytics; CoStar Portfolio Strategy, as of 1Q’15 1 Represents forecasted job growth for office-using employment only 15 Outperforming the nation 11%11% 10%10% 7%7% 14% 13%13% 12%11% 5% Forecasted population gain (’15-’19) Forecasted job growth office-users (‘15–’19)1 Focused Investment Strategy |
|
|
16 Strategic Repositioning Plan |
|
|
Scott Fordham joins the position for liquidity event Gilchrist are added to the Board of assets, 75 office properties 2008 2009 2015 Planned listing of the stock on sites in Austin and Dallas management6 Sharpened geographic focus Strengthened balance sheet Strategically redeployed capital Note: Estimated per share value prior to the 1-for-6 reverse stock split effected on June 2 1 Leverage metric based on net debt divided by total market capitalization; assumes a share price based on estimated NAV of $4.25 per share as of 2Q’10 established with third party valuation firm 2 Leverage metric based on net debt divided by total market capitalization; assumes a share price based on estimated NAV of $4.20 per share as of 4Q’13 established with third party valuation firm 3 Leverage metrics based on net debt divided by total market capitalization; assumes a share price based on estimated NAV of $4.48 per share as of 4Q’14 established with third party valuation firm 4 Pro forma as of March 31, 2015 for the completed dispositions of United Plaza (Philadelphia), 1650 Arch (Philadelphia) and Fi fth Third Center (Cleveland), and contribution of 90% of Washington, D.C. assets (1325 G Street and Colorado Building) into a new joint venture subsequent to quarter end and pending disposition of Fifth Third Center (Columbus); leverage metrics based on net debt divided by total market capitalization; assumes a share price based on estimated NAV of $4.48 per share as of 4Q’14 established with third party valuation firm 5 Tom Herzog was appointed to the board in April 2015 17 3Q’15 a national securities exchange une 2015 Closed new $275mm 7-year term loan Acquired two development Fully internalized property August 2010 Company implements strategic repositioning plan to exit distressed properties and non-strategic markets, focusing on fewer markets and deleveraging the balance sheet from 69.3%1 201020112012 Nov. & Dec. 2013 Sold 10 & 120 S. Riverside Plaza and 200 S. Wacker, reducing leverage to 54.2%2 J Nov. & Dec. 2014 Retained advisors to assist management and board in evaluation of strategic alternatives Credit facility and new term loan totaling $475mm closes Leverage of 48.6% as of 12/31/143 May 2008 Company to build go-forward management team and Portfolio consisted of $4.2bn (23.8mm sq. ft.) across 24 states and 36 markets May & July 2014 Scott Fordham is named CEO and Dallas Lucas is hired as CFO Scott Fordham and Richard of Directors ’15 Tom Herzog added to the Board of Directors5 Reinstated distributions Richard Gilchrist named Chairman of the Board Oct. 2014 – June 2015 Sold ~$830mm of non-strategic properties, reducing number of markets to 15 and leverage to 39.5%4 Closed acquisition of 5950 Sherry Lane (Dallas, TX) through an off-market swap transaction 2Q 20132014 September 2012 Board approves the internalization of executive and asset management Plans announced for the development of a 332,000 sq. ft. office tower at BriarLake Plaza in Houston Strategic Repositioning Timeline |
|
|
Disposed of 13.8 million square feet of non-strategic assets Reduced geographic footprint from 32 to 15 markets Increased NOI from strategic properties from 36%1 to 72%2 of portfolio Reduced leverage from 69.3% to 39.5%3 Extended and staggered debt maturities Reduced weighted-average cost of debt from 5.6% to 4.3% Reduced non-prepayable mortgages from 95% to 44% of total debt Completed development of 332,000 square foot class A office building in August 2014 Acquired 5950 Sherry Lane in Preston Center submarket of Dallas in December 2014 Acquired two office development parcels planned for approximately 880,000 net rentable square feet in June 2015 Pursuing ~$200 million of new investment properties in target growth markets4 Note: Pro forma as of March 31, 2015 for the completed dispositions of United Plaza (Philadelphia), 1650 Arch (Philadelphia) and Fi fth Third Center (Cleveland), and contribution of 90% of Washington, D.C. assets (1325 G Street and Colorado Building) into a new joint venture subsequent to quarter end and pending disposition of Fifth Third Center (Columbus ) 1 Based on 3Q’10 annualized GAAP NOI and includes properties in Atlanta, Austin, Charlotte, Dallas, Denver, Houston, Los Angeles, Louisville, Nashville, Tampa and Washington, D.C. 2 Based on 1Q’15 annualized GAAP NOI and includes properties in Atlanta, Austin, Charlotte, Dallas, Houston, Los Angeles, Louisville, Nashville, Tampa, and Washington, D.C. 3 Leverage based on net debt divided by total market capitalization; assumes a share price based on estimated NAV of $4.25 per share as of 2Q’10 and $4.48 per share as of 4Q’14, respectively, both established with third party valuation firm (estimated per share value prior to the 1-for-6 reverse stock split effected on June 2) 18 4 Currently in due diligence; we make no guarantee that the planned investments will close or as to the timing or terms of any investments Strategically redeployed capital Strengthened balance sheet Repositioning the Company for Long-term Success Sharpened geographic focus |
|
|
completion Increase same-store occupancy to 92%1 Achieve 3-year annual cash net operating income growth rate of 8% Achieve full coverage of dividend 2017 2014-2017 2016 completion Complete $100-200 million of new investments Recycle $600 million of non-strategic assets into target growth markets2 2015-2016 2017 In a disciplined manner, and subject to market conditions and pre-leasing, initiate development projects in target growth markets 2016 completion Achieve investment grade debt rating 2017 1 Same-store portfolio includes Atlanta, Austin, Burbank, Charlotte, Dallas/Fort Worth, Houston, Louisville, Nashville, and Tampa 2 See slide 22, Future Dispositions of Non-Strategic Assets, for additional detail 19 Reposition balance sheetTarget Strategically redeploy capitalTarget Capture embedded growthTarget Positioned for Growth |
|
|
20 Significant Identifiable Growth Potential |
|
|
$18.5 $165.6 2014 cash NOI 1 Free rent burn off Contractual rent increase Property management fee savings Lease up to 92% stabilization4 Potential 2017E cash NOI The NOI growth forecasted in this analysis may not be realized, and our actual NOI may vary significantly from that presented above. The above estimates reflect the portfolio of assets currently owned, and these assets may be disposed in order to redeploy capital in other markets and at other yields. No assumption is made about future acquisitions. Our estimates above contain assumptions related to leasing potential, margins, and other estimates that may not reflect future conditions. Refer to the “Forward-Looking Statements” discussion in this presentation for discussion about such business, economic, regulatory, or other risks that could significantly impair our ability to achieve the results estimated above. We make no guarantee that the results above will be achieved, and users should not place undue reliance on this analysis. Note: Represents total portfolio pro forma as of March 31, 2015 for the completed dispositions of United Plaza (Philadelphia), 1650 Arch (Philadelphia) and Fifth Third Center (Cleveland), and contribution of 90% of Washington, D.C. assets (1325 G Street and Colorado Building) into a new joint venture subsequent to quarter end and pending disposition of Fifth Third Center (Columbus) 1 2014 cash NOI is pro forma for annualized income of 5950 Sherry Lane (Dallas), acquired December 2014; excludes assets dispos ed of during 2014 and 2015 and pro forma for the asset sales noted above 2 Net rent per square foot represents an assumed 75% operating margin on gross rent per square foot for each respective market 3 Includes properties in Atlanta, Charlotte, Cherry Hill, NJ, Philadelphia, St. Paul, and Washington, D.C. (TIER REIT retains 10% ownership post-D.C. joint venture) 4 Also includes $0.4mm mark-to-market rent increase and $0.4mm pro forma adjustment for individual lease up to 92% occupancy stabilization of Terrace VI (84% occupied at 12/31/14); we cannot guarantee whether we will be able to 21 execute the assumed leases or the timing or terms thereof Significant growth potential will further improve leverage metrics $6.5 $11.8 $9.6 $119.2 ContractualChicago248,058$23.78 Houston187,25329.82 Dallas/Fort Worth143,64019.11 Louisville52,68213.63 Nashville35,57813.61 Subtotal667,211$23.13 Other3109,956$19.90 Total777,167$22.67 Remaining LeaseNet Rent Per MarketUp to 92%Square Foot2 Capture Embedded Growth 2014 – 2017E ($mm) |
|
|
1 Square footage reflects TIER REIT’s ownership at pro rata share 2 Weighted average based on square feet 22 FOUR40 Chicago, IL Lawson Commons St. Paul, MN Wanamaker Building Philadelphia, PA 500 East Pratt Baltimore, MD Three Parkway Philadelphia, PA Woodcrest Corporate Center Cherry Hill, NJ Disposition pipeline Property Market Square feet (000s)1 Occupancy as of 3/31/15 Target date Over $600mm capital for redeployment Wanamaker Building Philadelphia, PA 834 96% 2015 Lawson Commons St. Paul, MN 436 89% 2015 111 Woodcrest Road Woodcrest Corporate Center Cherry Hill, NJ 53 333 85% 93% 2015 Three Parkway Philadelphia, PA 561 94% 2016 500 East Pratt Baltimore, MD 280 98% 2017 FOUR40 Chicago, IL 1,041 68% 2017 Total: 7 properties 3,538 86%2 Future Dispositions of Non-Strategic Assets |
|
|
Strict underwriting criteria Acquisitions must meet our strategic objectives Focused on our seven target growth markets Acquired a controlling ownership interest in a development site planned for a 311,000 square foot office building in the Austin CBD Acquired a controlling ownership interest in a development site planned for two office buildings aggregating 570,000 square feet located in the Upper Tollway submarket of Dallas Remaining investment pipeline currently under due diligence Note: Current investment pipeline is excluded in the presentation’s portfolio and financial metrics 1 Currently under due diligence; we make no guarantee that the planned investments will close; Note: Austin CBD development site ($8.5mm ) and Legacy Town Center development site ($6.2mm) closed in June 2015 23 Current pipeline (~$200 million)1 Disciplined approach Investment Pipeline |
|
|
24 Flexible Balance Sheet |
|
|
22% Mortgage debt $514 Secured term loan 525 Secured line of credit - Total debt $1,039 56% 22% Equity value3 1,349 Total market cap. $2,388 Total market capitalization: $2,388 2017 Note: Assumes cash on hand of $159mm as of 6/30/15 1 Represents portfolio and capital structure pro forma as of March 31, 2015 for the completed dispositions of United Plaza (Philadelphia), 1650 Arch (Philadelphia) and Fifth Third Center (Cleveland), and contribution of 90% of Washington, D.C. assets (1325 G Street and Colorado Building) into a new joint venture subsequent to quarter end and pending disposition of Fifth Third Center (Columbus) 2 Pro forma for a $275mm term loan swapped to fixed rate of 3.67% that was used to repay $150mm of mortgage debt on Bank of America Plaza in Charlotte and $125mm of mortgage debt on Terrace Office Park in Austin 3 Equity value is based on outstanding shares (300.9mm) multiplied by disclosed NAV of $4.48 per share as of 4Q’14 (estimated per share value prior to the 1-for-6 reverse stock split effected on June 2) 4 EBITDA reflects annualized EBITDA for properties owned at period end; pro forma as of March 31, 2015 for the completed dispositions of United Plaza (Philadelphia), 1650 Arch (Philadelphia) and Fifth Third Center (Cleveland), and contribution of 90% of Washington, D.C. assets (1325 G Street and Colorado Building) into a new joint venture subsequent to quarter end and pending disposition of Fifth Third Center (Columbus) 5 Includes $159mm of cash and $66mm of availability under the revolving credit facility. See slide 47 for further detail 25 Credit statistics Pro forma 3/31/15 Targets Net debt / Annualized adj. EBITDA4 8.1x 7.0x Net debt / Total market cap. 39.5% <45% Secured debt / Gross assets 24.2% <20% Fixed charge coverage1,2 1.9x >3.0x Weighted average interest rate1,2 4.3% – Liquidity (cash + facility capacity)1,2,5 $225mm – Commitment to repositioning the balance sheet Minimize cost of capital Maintain access to multiple sources of debt and equity capital Operate at conservative leverage levels, with solid credit metrics Achieve investment grade debt rating Commitment to a Strong Balance Sheet Strategy and focus Capital structure as of 3/31/15 ($mm)1,2 |
|
|
$600 500 400 300 from cash on hand 200 with cash on hand 100 0 2015 2016 2017 2018 2019 Thereafter interest rate 1 Represents portfolio and capital structure pro forma as of March 31, 2015 for the completed dispositions of United Plaza (Philadelphia), 1650 Arch (Philadelphia) and Fifth Third Center (Cleveland), and contribution of 90% of Washington, D.C. assets (1325 G Street and Colorado Building) into a new joint venture subsequent to quarter end and pending disposition of Fifth Third Center (Columbus) and an additional $275mm term loan swapped to fixed rate of 3.67% that was used to repay $150mm of mortgage debt on Bank of America Plaza in Charlotte and $125mm of mortgage debt on Terrace Office Park in Austin 2 Based on 2015-2016 weighted average interest rate from company filings; peers include BDN, CUZ, CXP, HIW, PDM, and PKY 26 Near-term maturities have an interest rate ~30 bps above our peers2 % of debt 4.6%17.9%13.3%0.2%24.1%39.9% 5.2%4.8%5.5%4.8%3.2%4.3% Wtd. avg. Mortgage debtSecured bank debt $415 $51mm addressed by refinancing, $111mm by asset sales and $24mm$250 275 $42mm to be repaid$186 $48 $138 140 $3 Well-Staggered Debt Maturity Profile ($mm)1 |
|
|
27 Experienced Management Team and Strong Corporate Governance |
|
|
Proven 25-year track record of office investment and development in our target markets Significant public REIT experience including three successful office REIT IPOs Previous public REIT experience including Prentiss Properties, Brandywine, AIMCO, Crescent Real Estate, Maguire Properties and Hines 7 years experience repositioning and creating value within existing office portfolio 28 Scott W. Fordham Chief Executive Officer and President 24 years real estate experience with 20 years public company experience Dallas E. Lucas Chief Financial Officer and Treasurer 30 years real estate experience with 25 years public company experience William J. Reister Chief Investment Officer and Executive Vice President 29 years real estate experience with 20 years public company experience Telisa Webb Schelin Chief Legal Officer, Executive Vice President and Secretary 10 years real estate experience with 18 years public company experience James E. Sharp Chief Accounting Officer and Executive Vice President 19 years real estate experience with 16 years public company experience R. Heath Johnson Managing Director – Asset Management 15 years real estate experience with 8 years public company experience Experienced Management Team |
|
|
Non-executive Chairman 5 out of 8 board members are independent Non-staggered board SEC reporting company since 2002 Internalized executive and asset management since September 2012 29 G. Ronald Witten Independent Director President of Witten Advisors, LLC Steven W. Partridge Independent Director Chief Financial Officer of International Capital LLC Thomas M. Herzog Independent Director Chief Financial Officer of UDR, Inc. Charles G. Dannis Independent Director Sr. Managing Director of National Valuation Consultants, Inc. Richard I. Gilchrist Chairman of the Board and Independent Director Senior Advisor of The Irvine Company Director of Ventas, Inc. and Spirit Realty Capital, Inc. Independent directors Strong Corporate Governance |
|
|
30 Investment Summary |
|
|
Capture significant NOI and NAV growth potential through leasing Prior leasing successes include: Increased occupancy at 250 Pratt (Baltimore) and 1650 Arch (Philadelphia) from sub 70% to 95%+ and recently monetized value through sale Increased occupancy at the Terrace Office Park (Austin) from mid 60% to 92%+ significantly increasing long-term cash flow Retenanted 100% of 5104 Eisenhower (Tampa) with Fortune 500 company three months after building was vacated by non-credit tenant Acquire new properties in our target markets accretive to long-term cash flow growth and net asset value Prior investment successes include: Acquisition of 5950 Sherry Lane (Dallas) in December 2014 Acquisition of Austin CBD development site in June 2015 Acquisition of the Legacy Town Center (Dallas) development site in June 2015 Capitalize on approximately $300 million pipeline of future development targeting ~8.0% to 9.0% yield on cost Prior development successes include: Two BriarLake Plaza (Houston) completed August 2014 at projected stabilized yield on cost of 8.3% Three Eldridge (Houston) completed in 2009 at stabilized yield on cost of 9.1% Proactively manage capital structure to create competitive cost of capital Prior capital successes include: Completed two bank term loans aggregating $525 million, extending maturities over 6 years and reducing weighted-average interest rate by approximately 130 basis points Reduced short-term debt maturities from $1.2 billion to $0.2 billion since 2014 Executed two forward starting interest rate swaps in 2014/2015 with an average rate of approximately 20 basis points below current prevailing rates 31 Uniquely Positioned to Create Value For Our Shareholders |
|
|
32 Experienced management team and strong corporate governance Flexible balance sheet evolving toward investment grade rating Capital redistribution into significant pipeline of accretive investment opportunities Approximately 39% NOI growth potential with existing assets through 2017 Focused and disciplined investment strategy 10.4mm square feet of Class A office properties in highly attractive submarkets Investment Highlights Why Invest With TIER REIT |
|
|
33 NAV building blocks and select detail Proven execution Value creation opportunities Supplemental material Appendix |
|
|
34 Value Creation Opportunities |
|
|
2014 LEED Silver construction 149,000 sq. ft. of new and 35 Opportunity to add over $22.6mm of NOI Market Chicago – CBD Fort Worth – CBD Houston – Westchase Occupancy / Economic Occupancy (%) 68% / 54% 81% / 73% 56% / 32% Current Cash NOI ($mm) (1Q’15 annualized) $6.4 $9.3 ($0.3) Stabilized Cash NOI ($mm) $16.3 $13.5 $8.2 Target Stabilization Date 2017 2017 2016 Select Highlights Completed $10mm innovative new amenity center in June 2015 Recent $5mm lobby renovation completed 63,000 sq. ft. of new and expansion leases completed over last 4 quarters BOMA 2014 International Building of the Year Fort Worth Trailblazer sustainability award expansion leases completed over last 4 quarters First “smart building” developed in Houston Commands highest rents in market Two BriarLake Burnett Plaza FOUR40 High-Quality Opportunities to Create Value |
|
|
lease with 11 months of Free rent period ends 36 1 Represents 2Q’15 annualized for Buena Vista due to renewal of Disney Lease commencing in April 2015 Market Dallas – Preston Center Nashville – MetroCenter Tampa – Westshore Los Angeles – Burbank Occupancy / Economic Occupancy (%) 85% / 64% 91% / 88% 100% / 57% 100% / 0% Current Cash NOI ($mm) (1Q’15 annualized) $2.0 $2.3 $0.8 ($1.0)1 Stabilized Cash NOI ($mm) $4.1 $3.0 $2.3 $3.1 Target Stabilization Date 2016 2017 2016 2017 Select Highlights Premier Preston Center submarket Purchased below replacement cost 15-year lease to the State of Tennessee for 100,000 square feet with 6 months staggered free rent High-grade government tenant Long-term lease with Bristol-Myers, with potential to develop on adjacent land Free rent period expires in July 2015 Substantially leased to Disney under new 11-year free rent March 2016 Opportunity to add over $8.4mm of NOI MetroCenter 5950 Sherry Lane Buena Vista 5104 Eisenhower High-Quality Opportunities to Create Value (cont’d) |
|
|
40-story, 1.0mm square foot office tower located in Chicago’s Central Loop CBD submarket – anchor of the city’s financial district Building amenities include 45,000 square foot landscaped outdoor plaza, 325-space underground parking garage, state-of-the-art fitness facility and a 21 room boutique hotel The top floor is home to the award-winning French restaurant, Everest Invested capital of ~$15mm to renovate lobby, construct balcony and build new innovative tenant amenity center Subject to market conditions, projecting to lease ~175,000 square feet over the next 18-24 months Significant NOI growth of 250% projected by 2017 37 Redevelopment outlook Background Value Creation – FOUR40 |
|
|
40-story, 1.02mm square foot iconic office tower located in the Fort Worth CBD 2014 BOMA International Building of the Year LEED Gold and Energy Star® certification Located adjacent to two-acre urban park designed by renowned landscape architect Peter Walker Plans to invest $2.5mm in common area upgrades including lobby renovation Approximate 200,000 square feet of currently vacant space projected to lease up over next 24 months Adjacent 1.4 acre parcel which offers opportunity to develop 300,000 square foot mixed-use property including 850 new covered parking spaces City-sponsored transformational redevelopment of Lancaster Corridor area with plans for over 500 residential units and new retail space in the south end of the CBD 38 Growth opportunities Background Value Creation – Burnett Plaza |
|
|
buildings 39 Market Tampa Louisville Austin Dallas Acres 5.2 6.1 0.8 4.0 Approximate Net Rentable Sq. Ft. (000s) 90 350 311 570 Month of Acquisition December 2007 December 2007 June 2015 June 2015 Cost Basis ($mm) $1.5 $13.8 $8.5 $6.2 Comments Build-to-suit opportunity for 90,000 sq. ft. additional space for credit tenant Planned redevelopment of retail strip center as part of the Hurstbourne Business Center Planned 13-story office building above a 12-level parking garage Zoning allows for construction of two office Austin CBD Legacy Town Center 5104 Eisenhower Hurstbourne Plaza Land Development Opportunities |
|
|
40 Proven Execution |
|
|
5950 Sherry Lane, a 196,933 square foot property, acquired in an off-market transaction in December 2014 for $62.6 million Located in the Preston Center submarket 5950 Sherry Lane Dallas, TX Consistent low vacancy and high rental rates Attracts high-quality credit tenants In place rents ~18% below market Increased Dallas / Fort Worth to 6% of portfolio Demonstrates commitment to repositioning portfolio in high growth target markets Relationship-sourced off-market transaction Exhibits ability to capitalize on market expertise and management relationships Redeployed sale proceeds into trophy building below replacement cost ston Highland Park Note: Dark gray shading indicates Preston Center 41 Hilllcrest Ave Preston Rd Inwood Rd Inwood Rd Pre Ce W Lovers Ln Dallas Love Field Airport 12 75 nter E Lovers Ln University Park 75 Acquisition Success |
|
|
Two BriarLake Plaza, a 332,597 square foot building Two BriarLake Plaza Houston, TX Acquired land in December 2009 Commenced construction in September 2012 Increased Westchase portfolio to over 835,000 square feet Located in Houston’s Westchase District Situated along the Sam Houston Parkway between Interstate 10 and Westpark Tollway Portfolio commands highest rent in the market Projected stabilized cash yield of 8.3% Projected stabilized NOI of $8.2mm Total project cost of $98.6mm 68% leased, projected stabilization in 2016 Energy Corridor 90 10 Park George Bush 69 288 Mission 610 42 Bear Creek610 Pioneers Park8 10109010 6Memorial45 Park /610Houston Eldridge Westchase869 59 Bend6 Development Success |
|
|
occupancy options on adjacent owned land achieving 100%+ IRR Sold property as part of two property portfolio for $200mm in 2Q15 occupancy to 63% Successfully increased to 93% from $20/sq. ft. NNN to $26/sq. ft. NNN 43 TIER REIT increased year-over-year occupancy by 320 basis points to 88.4% at 3/31/15 Loop Central Houston, TX August 2012, a 199,000 sq. ft. tenant vacated due to M&A activity, reducing Subsequently invested $900,000 in various property upgrades occupancy 250 West Pratt Baltimore, MD August 2014, occupancy decreased to 68% December 2014, completed 116,000 sq. ft. of new leases, increasing occupancy to 95% March 2015, property was sold for $65.5 million, resulting in an $8.6 million gain Terrace Office Park Austin, TX August 2012, a 200,000 sq. ft. tenant vacated to build-to-suit, reducing occupancy to 65% Subsequently completed 166,000 sq. ft. of leasing, increasing occupancy to 92% Rental rates during re-leasing increased 30%, 1650 Arch Street Philadelphia, PA 200 South Wacker Chicago, IL Purchased $42.5M note for $31.5M in February 2010 170,000 SF tenant vacated in March 2009, reducing occupancy to 69% Invested $8.4M in upgrades Executed 204,000 SF of new leases and 317,000 SF of renewals to reach 95% occupancy Occupancy dropped to 69% in January 2010 Retained a 10% interest, two-tier promote and property management Leased 250,000 SF in 18 months achieving 95% Sold in December 2013 for $215M or $270/SF 5104 Eisenhower Tampa, FL October 2013, non-credit tenant vacated entirety of the building December 2013, leased 57% to Bristol-Myers with option to expand August 2014, Bristol-Myers leased balance of building Evaluating development Asset Management / Leasing Success |
|
|
44 NAV Building Blocks |
|
|
unconsolidated real estate and property management fee income See slide 35, 36, 39 and 42 for further portfolio detail See slide 41 for further detail in unconsolidated joint ventures See slide 26 for further detail completed on 6/2/15 Note: Pro forma as of March 31, 2015 for the completed dispositions of United Plaza (Philadelphia), 1650 Arch (Philadelphia) and Fifth Third Center (Cleveland), and contribution of 90% of Washington, D.C. assets (1325 G Street and Colorado Building) into a new joint venture subsequent to quarter end and pending disposition of Fifth Third Center (Columbus) 1 Includes: $322.0mm of revenue less $15.9mm of GAAP rent adjustments less $2.2mm of lease termination fees less $166.7mm of property operating expenses plus $0.2mm of costs attributable to tenant improvement demolition less $26.9mm of adjusted cash NOI from properties sold during 1Q’15 less $20.4mm of adjusted cash NOI from non-stabilized properties plus $8.4mm of 1Q’15 annualized cash NOI from unconsolidated real estate joint ventures plus $7.1mm of property management fee income 2 Includes adjusted cash NOI of Plaza at MetroCenter and Buena Vista Plaza, which are currently stabilized but are expected to become economically non-stabilized in 2015 due to large renewals with associated rent abatements 3 Includes 1Q’15 annualized cash NOI at ownership share for Wanamaker (60%), 1325 G Street (10%), Colorado Building (10%) and Paces West (10%) 4 Includes 1Q’15 annualized property management fee income. The property management platform was fully internalized in 2Q’15 5 Based on estimated asset value established with third party valuation firm as of 4Q’14 6 Other tangible assets include: $159.0mm of cash, $32.8mm of restricted cash, $8.7mm of accounts receivable, $7.2mm of prepaid expenses and $8.3mm of ownership share of other tangible assets in unconsolidated joint ventures 7 Other liabilities include: $94.9mm of other liabilities and $2.4mm of ownership share of other liabilities in unconsolidated joint ventures 8 Debt includes: $454.2mm of notes payable, $525.0mm of secured term loans and $60.0mm of ownership share of unconsolidated debt 45 NAV Building Blocks ($mm, except per share data) Key assumptions Reference / additional detail Cash NOI from operating portfolio1,2,3,4 $105.7 Includes 1Q’15 annualized cash NOI for stabilized wholly-owned operating assets, 1Q’15 annualized cash NOI from See slide 8 and 21 for further portfolio detail Value of non-stabilized portfolio5 532.8 Includes Two BriarLake, Hurstbourne Plaza, FOUR40, Burnett Plaza, 5104 Eisenhower, 1325 G Street and Colorado Building 5950 Sherry Lane acquisition price 62.6 Acquired in an off-market transaction in December 2014 for $318 per square foot and an implied 6.5% stabilized yield Other tangible assets6 216.0 Includes cash, restricted cash, accounts receivable, prepaid expenses and ownership share of other tangible assets in unconsolidated joint ventures Other liabilities7 97.3 Includes other liabilities and ownership share of other liabilities Debt8 1,039.2 Includes $60mm of ownership share of unconsolidated JV debt Diluted shares outstanding 50.0 Diluted shares outstanding are post 1-for-6 reverse stock split |
|
|
Note: Pro forma as of March 31, 2015 for the completed dispositions of United Plaza (Philadelphia), 1650 Arch (Philadelphia) and Fifth Third Center (Cleveland), and contribution of 90% of Washington, D.C. assets (1325 G Street and Colorado Building) into a new joint venture subsequent to quarter end and pending disposition of Fifth Third Center (Columbus) 1 Expected growth rate represents 2017E cash NOI divided by the sum of 2014 cash NOI 46 Category No. of assets Square feet Ann. 1Q’15 gross rental revenue ($mm) Ann. 1Q’15 adjusted cash NOI ($mm) Expected NOI growth (’14-’17)1 Targeted growth markets 9 4.0 $110.9 $63.7 26.5% Other institutional markets 2 0.2 5.7 4.1 (6.5%) Short-term value creation markets 7 1.0 17.6 8.8 27.7% Non-strategic markets 6 2.5 53.6 29.1 10.4% Stabilized portfolio 24 7.7 $187.8 $105.7 20.3% Non-stabilized portfolio 7 2.7 63.0 20.4 133.7% Total portfolio 31 10.4 $250.9 $126.1 38.9% NOI detail NAV Building Blocks (cont’d) |
|
|
Note: Pro forma as of March 31, 2015 for the completed dispositions of United Plaza (Philadelphia), 1650 Arch (Philadelphia) and Fifth Third Center (Cleveland), and contribution of 90% of Washington, D.C. assets (1325 G Street and Colorado Building) into a new joint venture subsequent to quarter end and pending disposition of Fifth Third Center (Columbus) 1 Adjusted cash NOI of properties sold during 1Q’15 2 Debt represents repayment of Buena Vista ($20.6mm), Lawson Commons ($53.6mm), Terrace Office Park ($125.3mm), and Bank of America Plaza ($150.0mm), which are offset by a net increase in the credit facility draw of $304mm; cash represents $45.5mm of cash used to repay debt plus $62.5mm of transactional and operational costs during the period; line availability represents the net effect of adding Terrace Office Park and Bank of America Plaza to the credit facility collateral pool after using a new $275mm term loan to repay existing debt on both assets 3 Availability under the revolving credit facility is expected to increase as the Company plans to include additional owned assets in the collateral pool 47 No. of properties Sq. Ft. Ann. 1Q’15 adj. cash NOI Debt Cash Line availability At 3/31/15 35 12.8 $152.4 $1,281.2 $5.8 $180.3 Less: 1Q NOI at sold properties1 - - (2.8) - - - Less: United Plaza 1 (0.6) (8.0) - 114.6 - Less: 1650 Arch 1 (0.6) (3.6) - 76.4 (44.3) Less: Fifth Third Center (Cleveland) 1 (0.5) (4.0) (49.4) 2.5 - Less: Fifth Third Center (Columbus) 1 (0.3) (2.5) (47.1) - - Less: 1325 G (90%) - (0.3) (3.6) (100.0) 45.1 - Less: Colorado Building (90%) - (0.1) (1.8) - 22.6 (24.5) Less: Net financing & operations2 - - - (45.5) (108.0) (45.8) At pro forma 3/31/15 31 10.4 $126.1 $1,039.2 $159.0 $65.73 Portfolio detail Reconciliation |
|
|
Short-term value creation Paces West1 Atlanta 65 Forum Office Park Louisville 328 Terrace Office Park Austin 619 Hurstbourne Place Louisville 235 Bank of America Plaza Charlotte 891 Centreport Office Center Dallas / Fort Worth 133 One Oxmoor Place Louisville 135 Loop Central Houston 575 Hurstbourne Park Louisville 104 One & Two Eldridge Houston 519 Steeplechase Louisville 77 One BriarLake Plaza Houston 502 Three Eldridge Houston 306 Lakeview Louisville 76 Plaza at MetroCenter Nashville 361 Hunnington Louisville 62 Burnett Plaza Dallas / Fort Worth 1,025 5950 Sherry Lane Dallas / Fort Worth 197 5104 Eisenhower Tampa 130 Two BriarLake Plaza Houston 333 500 East Pratt Baltimore 280 Buena Vista Plaza Los Angeles 115 Wanamaker Building2 Philadelphia 834 801 Thompson Washington, D.C. 51 Three Parkway Philadelphia 561 Woodcrest Corporate Center Cherry Hill, NJ 333 111 Woodcrest Road Cherry Hill, NJ 53 1325 G Street1 Washington, D.C. 31 Lawson Commons St. Paul 436 Colorado Building1 Washington, D.C. 13 FOUR40 Chicago 1,034 Note: Pro forma as of March 31, 2015 for the completed dispositions of United Plaza (Philadelphia), 1650 Arch (Philadelphia) and Fifth Third Center (Cleveland), and contribution of 90% of Washington, D.C. assets (1325 G Street and Colorado Building) into a new joint venture subsequent to quarter end and pending disposition of Fifth Third Center (Columbus) 1 Square footage represents pro rata ownership of 10% 48 2 Square footage represents pro rata ownership of 60% Subtotal: Non-stabilized1,034 Total3,531 Subtotal: Non-stabilized44 Total210 Subtotal: Stabilized2,497 Subtotal: Stabilized166 AssetMarketSF (‘000s) AssetMarketSF (‘000s) Other institutional Non-strategic Subtotal: Non-stabilized1,555 Total5,526 Subtotal: Non-stabilized130 Total1,147 Subtotal: Stabilized1,017 Subtotal: Stabilized3,971 AssetMarketSF (‘000s) AssetMarketSF (‘000s) Pro forma portfolio breakdown by market Targeted growth Reconciliation (cont’d) |
Exhibit 99.4
|
|
Bank of America Plaza Charlotte, NC Three Eldridge Houston, TX 1 Portfolio Summary June 2015 |
|
|
This presentation contains forward-looking statements, including discussion and analysis of the financial condition of us and our subsidiaries and other matters. These forward-looking statements are not historical facts but are the intent, belief or current expectations of our management based on their knowledge and understanding of our business and industry. Words such as “may,” “anticipates,” “expects,” “intends,” “plans,” “believes,” “seeks,” “estimates,” “would,” “could,” “should,” “objectives,” “strategies,” “goals,” and variations of these words and similar expressions are intended to identify forward-looking statements. We intend that such forward-looking statements be subject to the safe harbor provisions created by Section 27A of the Securities Act of 1933 and Section 21E of the Securities Exchange Act of 1934. These statements are not guarantees of future performance and are subject to risks, uncertainties and other factors, some of which are beyond our control, are difficult to predict and could cause actual results to differ materially from those expressed or forecasted in the forward-looking statements. Forward-looking statements that were true at the time made may ultimately prove to be incorrect or false. We caution you not to place undue reliance on forward-looking statements, which reflect our management's view only as of the date of this presentation. We undertake no obligation to update or revise forward-looking statements to reflect changed assumptions, the occurrence of unanticipated events or changes to future operating results. Factors that could cause actual results to differ materially from any forward-looking statements made in the presentation include but are not limited to: (i) market and economic challenges experienced by the U.S. economy or real estate industry as a whole and the local economic conditions in the markets in which our properties are located; (ii) our ability to renew expiring leases and lease vacant spaces at favorable rates or at all; (iii) the inability of tenants to continue paying their rent obligations due to bankruptcy, insolvency or a general downturn in their business; (iv) the availability of cash flow from operating activities to fund distributions and capital expenditures; (v) our ability to raise capital in the future by issuing additional equity or debt securities, selling our assets or otherwise to fund our future capital needs; (vi) our ability to strategically acquire or dispose of assets on favorable terms; (vii) our level of debt and the terms and limitations imposed on us by our debt agreements; (viii) our ability to retain our executive officers and other key personnel; (ix) our ability to successfully transition to directly providing certain property management and administrative services in connection with the termination of our property management agreement and our administrative services agreement; (x) unfavorable changes in laws or regulations impacting our business or our assets; (xi) our ability to complete the listing of our shares of common stock on a national securities exchange in a timely manner or at all; (xii) our ability to complete an issuer tender offer in a timely manner or at all; (xiii) the price at which shares of our common stock may trade on a national securities exchange, which may be higher or lower than the purchase price in the tender offer; and (xiv) factors that could affect our ability to qualify as a real estate investment trust. The forward-looking statements should be read in light of these and other risk factors identified in the “Risk Factors” section of our Annual Report on Form 10-K for the year ended December 31, 2014 and our Quarterly Report on Form 10-Q for the quarter ended March 31, 2015, as filed with the Securities and Exchange Commission. This presentation is for informational purposes only and is not an offer to buy or the solicitation of an offer to sell any of our securities. 2 Forward-Looking Statements |
|
|
Loop Central Houston TX West Loop 3 100% 574,944 574,944 7 Three Eldridge Houston TX Energy Corridor 1 100% 305,886 305,886 9 Two BriarLake Plaza Houston TX Westchase 1 100% 334,325 334,325 11 5950 Sherry Lane Dallas / Fort Worth TX Preston Center 1 100% 196,993 196,993 14 Terrace Office Park Austin TX Southwest 4 100% 619,026 619,026 17 Bank of America Plaza Charlotte NC Central Business District 2 100% 891,136 891,136 20 Plaza at MetroCenter Nashville TN MetroCenter 3 100% 361,200 361,200 24 1325 G Street Washington DC East End 1 10% 306,563 30,656 27 801 Thompson Rockville MD Rockville 1 100% 50,918 50,918 29 Forum Office Park Louisville KY Hurstbourne / Lyndon 4 100% 327,811 327,811 34 Hurstbourne Park Louisville KY Hurstbourne / Lyndon 1 100% 104,237 104,237 36 Hunnington Louisville KY Hurstbourne / Lyndon 1 100% 61,862 61,862 48 Lakeview Louisville KY St. Matthews 1 100% 76,438 76,438 40 Wanamaker Building Philadelphia PA Market Street East 1 60% 1,389,838 833,903 45 Woodcrest Corporate Center Cherry Hill NJ Southern New Jersey 1 100% 333,275 333,275 47 FOUR40 Chicago IL Central Loop 1 100% 1,041,292 1,041,292 50 500 East Pratt Baltimore MD Central Business District 1 100% 279,712 279,712 54 3 Total (31 Properties)4511,950,74210,422,236 Lawson CommonsSt. PaulMN Central Business District1100%436,478436,47852 111 Woodcrest RoadCherry HillNJSouthern New Jersey1100%52,64852,64848 Three ParkwayPhiladelphiaPAMarket Street West1100%561,351561,35146 5104 EisenhowerTampaFLWestshore1100%130,091130,09142 Other Markets / Disposition Pipeline43 One Oxmoor PlaceLouisvilleKYSt. Matthews1100%134,926134,92639 SteeplechaseLouisvilleKYHurstbourne / Lyndon1100%76,66676,66637 Hurstbourne PlaceLouisvilleKYHurstbourne / Lyndon1100%234,896234,89635 Buena Vista PlazaBurbankCABurbank1100%115,130115,13031 Short-Term Value Creation Markets32 Colorado BuildingWashingtonDCEast End110%127,60012,76028 Other Institutional Markets25 Paces WestAtlantaGACumberland / Galleria210%646,47164,64722 Southeast Portfolio18 Centreport Office CenterDallas / Fort WorthTXMid-Cities2100%133,246133,24615 Burnett PlazaDallas / Fort WorthTX Central Business District1100%1,024,6271,024,62713 One BriarLake PlazaHoustonTXWestchase1100%502,410502,41010 One & Two EldridgeHoustonTXEnergy Corridor2100%518,746518,7468 Rentable SF PropertyCityStateSubmarketBuildingsOwnership100%Own %Page Target Growth Markets4 Texas Portfolio4 Portfolio Overview |
|
|
4 Texas Portfolio (16 buildings, 4.2mm SF) Target Growth Markets (23 buildings, 6.1mm SF) |
|
|
One & Two Eldridge One BriarLake Plaza Two Briarlake Plaza Loop Central Three Eldridge 5 Map of Houston Assets |
|
|
One BriarLake Plaza Two BriarLake Plaza Loop Central One & Two Eldridge Three Eldridge 6 Houston Assets |
|
|
Class A complex has distinctive trapezoid shaped floor plates that allow for efficient space planning Located near Houston’s Galleria area, one of the city’s vital business districts The combined Loop Central One, Two and Three parking garage provides a total of 1,925 spaces plus 402 surface lot spaces Location is highly visible and easily accessible to several of Houston’s major thoroughfares Above-standard electrical capacity on most floors in Loop Central Three Recently upgraded lobby, elevator cabs and deli BOMA 360, Energy Star Loop Central 7 Submarket West Loop Buildings 3 Net Rentable SF 574,944 Average Effective Rent ($ / RSF) $19.11 Built 1980–1982 Year Acquired 2007 Weighted Average Remaining Lease Term 4.8 years % Occupied at 3/31/15 94% % Occupied by Energy Tenants 39% % of Energy Tenant Space Expiring Through 2017 0.4% Location 4828, 4848, & 4888 Loop Central Drive Ownership 100% Property Facts Property Highlights Property Description Loop Central |
|
|
Two Class A buildings constructed with a cast-in-place concrete frame The combined One & Two Eldridge parking garage provides a total of 1,475 parking spaces Premier location in the Energy Corridor managed district – one of the largest managed districts in the City of Houston Easy access to adjacent parks, hike and bike trails and green space On-site fitness center, conference room, deli, 24-hour security, on-site management and banking center with drive-thru facility BOMA 360, LEED Gold EB, Energy Star One & Two Eldridge 8 Submarket Energy Corridor Buildings 2 Net Rentable SF 518,746 Average Effective Rent ($ / RSF) $32.52 Built 1984–1986 Year Acquired 2006 Weighted Average Remaining Lease Term 4.7 years % Occupied at 3/31/15 99% % Occupied by Energy Tenants 78% % of Energy Tenant Space Expiring Through 2017 23% Location 777 & 757 N. Eldridge Parkway Ownership 100% Property Facts Property Highlights Property Description One & Two Eldridge |
|
|
Class A building constructed of poured in place concrete, precast panel and glass curtain wall Contains a six-level parking garage with 1,046 parking spaces Premier location in the Energy Corridor managed district – one of the largest managed districts in the City of Houston Direct access to attached parking garage on floors 3 and 4 Campus amenities include on-site fitness center, conference room, deli, 24-hour security, on-site management and banking center Easy access to adjacent parks, hike and bike trails and green space BOMA 360, LEED Gold EB, Energy Star Three Eldridge 9 Submarket Energy Corridor Buildings 1 Net Rentable SF 305,886 Average Effective Rent ($ / RSF) $40.22 Built 2009 Year Acquired New Development Weighted Average Remaining Lease Term 3.4 years % Occupied at 3/31/15 100% % Occupied by Energy Tenants 100% % of Energy Tenant Space Expiring Through 2017 29% Location 737 N. Eldridge Parkway Ownership 100% Property Facts Property Highlights Property Description Three Eldridge |
|
|
Class A building constructed from poured in place concrete with reinforced steel structure Office tower is centered on the site, with a grand flame-finished granite plaza and lake in front of the building, and a large courtyard in the back Contains a seven-level reinforced concrete parking garage with 1,959 parking spaces Easy access to major interstates and transportation arteries High quality design and construction of the building coupled with location makes this a premier asset that leads the submarket in rental rates Campus amenities include a fitness center, deli and café, and 150-seat conference center BOMA 360, TOBY, LEED Gold EB, Energy Star One BriarLake Plaza 10 Submarket Westchase Buildings 1 Net Rentable SF 502,410 Average Effective Rent ($ / RSF) $40.78 Built 2000 Year Acquired 2008 Weighted Average Remaining Lease Term 6.2 years % Occupied at 3/31/15 97% % Occupied by Energy Tenants 78% % of Energy Tenant Space Expiring Through 2017 13% Location 2000 W. Sam Houston Parkway South Ownership 100% Property Facts Property Highlights Property Description One BriarLake Plaza |
|
|
Class AA office building constructed of poured in place concrete along with a glass curtain wall system and Houston’s first “smart and connected” office development Contains a seven-level parking garage with 954 parking spaces Location central to a wide variety of desirable residential neighborhoods offering convenient access Campus amenities include a fitness center, deli and café, and 150-seat conference center LEED Silver Two Briarlake Plaza 11 Submarket Westchase Buildings 1 Net Rentable SF 334,325 Average Effective Rent ($ / RSF) $42.07 Built 2014 Year Acquired New Development Weighted Average Remaining Lease Term 11.2 years % Occupied at 3/31/15 56% % Occupied by Energy Tenants 53% % of Energy Tenant Space Expiring Through 2017 0% Location 2050 W. Sam Houston Parkway Ownership 100% Property Facts Property Highlights Property Description Two BriarLake Plaza |
|
|
Legacy Town Center Land Parcel To Accommodate 570,000 Office Net Rentable Square Feet 5950 Sherry Lane Centreport Office Center Burnett Plaza 12 Map of Dallas / Fort Worth Assets |
|
|
40-story Class A iconic building located in downtown Fort Worth Constructed of poured-in-place concrete with architectural precast concrete curtain wall and bronze glass exterior Interior features an atrium lobby with granite tile flooring 1,979 parking spaces allocated among garage, surface lots, and leased space Upgraded deli and lower level common area Additional amenities include a conference center, dry cleaners, convenience store, hair salon and full service banking Location offers one-of-a kind views of a beautiful, two-acre urban park designed by renowned landscape architect, Peter Walker BOMA 2014 International Building of the Year, 2015 Downtown Fort Worth Inc. Trailblazer Sustainability Award, BOMA 360, TOBY, LEED Silver, Energy Star Burnett Plaza 13 Submarket Central Business District Buildings 1 Net Rentable SF 1,024,627 Average Effective Rent ($ / RSF) $22.34 Built 1983 Year Acquired 2006 Weighted Average Remaining Lease Term 6.5 years % Occupied at 3/31/15 81% % Occupied by Energy Tenants 23% % of Energy Tenant Space Expiring Through 2017 0.5% Location 801 Cherry St. Ownership 100% Property Facts Property Highlights Property Description Burnett Plaza |
|
|
Nine-story Class A building conveniently located in the prestigious Preston Center submarket and prominently positioned on the Dallas North Tollway Garage parking, with 642 spaces, located under the building providing direct and secured access to the lobby Abundance of restaurants, specialty shops, health clubs and other services within walking distance Located within affluent areas of Dallas such as Highland Park, with immediate access to downtown LEED Silver 5950 Sherry Lane 14 Property Facts Submarket Preston Center Buildings 1 Net Rentable SF 196,993 Average Effective Rent ($ / RSF) $30.27 Built 1999 Year Acquired 2014 Weighted Average Remaining Lease Term 4.0 years % Occupied at 3/31/15 85% Location 5950 Sherry Lane Ownership 100% Property Highlights Property Description 5950 Sherry Lane |
|
|
Buildings are steel-framed structures of joists, joist girders and steel columns supporting metal roof decks Located in the Mid-Cities submarket, which is comprised of Arlington, Grand Prairie and Hurst-Euless-Bedford 693 parking spaces Currently 100% leased to two credit tenants Convenient location near DFW International Airport, and close proximity to highway access (Highway 360 and Highway 183) Centreport Office Center 15 Property Facts Submarket Mid-Cities Buildings 2 Net Rentable SF 133,246 Average Effective Rent ($ / RSF) $12.87 Built 1999 Year Acquired 2007 Weighted Average Remaining Lease Term 3.1 years % Occupied at 3/31/15 100% Location 14760 & 14770 Trinity Boulevard Ownership 100% Property Highlights Property Description Centreport Office Center |
|
|
The Terrace Austin CBD Land Parcel To Accommodate 311,000 Off Rentable Square Feet Net Terrace Office Park 16 Map of Austin Assets |
|
|
Class A office complex located at southwest Austin’s gateway and comprised of four separate buildings constructed between 1998 and 2002 Located near executive housing Abundant parking available on site with 2,693 spaces Convenient access from Mopac Blvd and minutes from Austin CBD On site café operated by Whole Foods Energy Star Terrace Office Park 17 Property Facts Submarket Southwest Buildings 4 Net Rentable SF 619,026 Average Effective Rent ($ / RSF) $35.25 Built 1998–2002 Year Acquired 2006 Weighted Average Remaining Lease Term 4.3 years % Occupied at 3/31/15 93% Location 2600,2700,2801,2901 Via Fortuna Drive Ownership 100% Property Highlights Property Description Terrace Office Park |
|
|
18 Southeast Portfolio (7 buildings, 1.9mm SF) Target Growth Markets (23 buildings, 6.1mm SF) |
|
|
Bank of America Plaza 19 Map of Charlotte Assets |
|
|
Consists of a 40-story Class A office building as well as a sizable retail component Located on the corner of Trade and Tryon streets, considered to be the heart of Uptown Charlotte On-site parking garage with 456 spaces Connected to the Overstreet Mall with accessibility to many retail, lodging and entertainment locations BOMA 360, TOBY, LEED Gold, Energy Star Bank of America Plaza 20 Property Facts Submarket Central Business District Buildings 2 Net Rentable SF 891,136 Average Effective Rent ($ / RSF) $23.79 Built 1974–1977 Year Acquired 2006 Weighted Average Remaining Lease Term 6.8 years % Occupied at 3/31/15 89% Location 101 S. Tryon Street Ownership 100% Property Highlights Property Description Bank of America Plaza |
|
|
Paces West 21 Map of Atlanta Assets |
|
|
Two interconnected Class A office towers consisting of 17 stories each, and situated on a wooded, 9.2-acre site in Atlanta’s core Cumberland / Galleria submarket The towers’ multi-story lobbies boast granite floors, mahogany walls and unrivalled views of Atlanta Located near the intersection of I-285 and I-75; a 20-minute drive from Hartsfield-Jackson Atlanta International Airport and downtown Atlanta On-site amenities include an attached six-story parking garage (1,890 spaces), two conference facilities, ATMs / onsite banking, fitness center and restaurant BOMA 360, TOBY, Energy Star Paces West 22 Property Facts Submarket Cumberland / Galleria Buildings 2 Net Rentable SF (Pro Rata Ownership) 646,471 (64,647) Average Effective Rent ($ / RSF) $19.61 Built 1987 / 1989 Year Acquired 2006 (90% interest sold in 2013) Weighted Average Remaining Lease Term 7.2 years % Occupied at 3/31/15 83% Location 2727 Paces Ferry Road Ownership 10% Property Highlights Property Description Paces West |
|
|
Plaza at MetroCenter 23 Map of Nashville Assets |
|
|
Comprised of three separate Class A office buildings located just 13 blocks from the CBD Located in the largest master-planned business community in Nashville Abundant surface parking with 1,195 spaces Located within one mile of the interstate junctions of I-24, I-40, I-65 and I-440 and minutes from the Nashville Metropolitan Airport, West End and the CBD BOMA 360, Energy Star Plaza at MetroCenter 24 Property Facts Submarket MetroCenter Buildings 3 Net Rentable SF 361,200 Average Effective Rent ($ / RSF) $16.86 Built 1985 Year Acquired 2007 Weighted Average Remaining Lease Term 9.1 years % Occupied at 3/31/15 91% Location 200-220 Athens Way Ownership 100% Property Highlights Property Description Plaza at MetroCenter |
|
|
25 Other Institutional Markets (4 buildings, 600k SF) |
|
|
801 Thompson 1325 G Street Colorado Building 26 Map of Washington, DC Assets |
|
|
Class A building constructed with post-tension concrete structure with a glass and precast concrete curtain wall in 1969 Roof and perimeter access systems have been replaced since 1997 Significant infrastructure improvements are in progress including lobby renovation, replacement of perimeter induction units with energy efficient above ceiling units and conversion of diesel boilers to natural gas Public five-level, below-grade parking garage accommodating 418 cars Strategic location within blocks of the White House and one block of public rail transportation stations Bordered on the east by a church, increasing number of windows with views on this mid-block location BOMA 360, LEED Gold, Energy Star 1325 G Street 27 Property Facts Submarket East End Buildings 1 Net Rentable SF (Pro Rata Ownership) 306,563 (30,656) Average Effective Rent ($ / RSF) $44.49 Built 1969 Year Acquired 2005 (90% sold in 2015) Weighted Average Remaining Lease Term 5.2 years % Occupied at 3/31/15 75% Location 1325 G Street Ownership 10% Property Highlights Property Description 1325 G Street |
|
|
Class A steel beam super structure with corrugated metal decks and concrete floors Originally developed in 1903 and redeveloped in 1989, adding the 10th and 11th floors and an upgrade of the mechanical systems Additional renovations including lobby and fitness center upgrades and major façade rehabilitation and waterproofing One of the few Category III landmark office buildings in D.C. High profile corner location within blocks of the White House and one block of public rail transportation stations Boutique-quality historic structure with first-class ground floor retail Energy Star Colorado Building 28 Property Facts Submarket East End Buildings 1 Net Rentable SF (Pro Rata Ownership) 127,600 (12,760) Average Effective Rent ($ / RSF) $37.71 Built 1903/1989 Year Acquired 2004 (90% sold in 2015) Weighted Average Remaining Lease Term 5.0 years % Occupied at 3/31/15 90% Location 1341 G Street Ownership 10% Property Highlights Property Description Colorado Building |
|
|
Four-story suburban office building on 1.179 acres located along the Rockville Pike Corridor (MD Route 355) Poured concrete footing with slab-on-grade construction and steel frame Cladding is pre-cast concrete façade with pre-finished aluminum and glass windows 80 parking spaces Immediate access to the Twin Brook Metro rail station Significant transit-oriented development occurring in the immediate vicinity BOMA 360, LEED EB Gold, Energy Star 801 Thompson 29 Property Facts Submarket Rockville Buildings 1 Net Rentable SF 50,918 Average Effective Rent ($ / RSF) $32.23 Built 1963 Year Acquired 2007 Weighted Average Remaining Lease Term 1.6 years % Occupied at 3/31/15 100% Location 801 Thompson Avenue Ownership 100% Property Highlights Property Description 801 Thompson |
|
|
Buena Vista Plaza 30 Map of Los Angeles Assets |
|
|
Constructed of poured-in-place post tension concrete Curtain wall is pre-cast aggregate panels with aluminum and glass window system Interior finishes include granite floor tiles and wall panels in the main lobby and standard drywall in office and common areas Sits above a 400-space subterranean parking garage 61607 Buena Vista is fully leased to Disney long-term and is located two blocks from the Disney headquarters in the Burbank media district Corner location with good parking ratio Energy Star Buena Vista Plaza 31 Property Facts Submarket Burbank Buildings 1 Net Rentable SF 115,130 Average Effective Rent ($ / RSF) $37.76 Built 1991 Year Acquired 2005 Weighted Average Remaining Lease Term 10.5 years % Occupied at 3/31/15 100% Location 2411 W. Olive Avenue Ownership 100% Property Highlights Property Description Buena Vista Plaza |
|
|
32 Short-Term Value Creation Markets (11 buildings, 1.1mm SF) |
|
|
Forum Office Park One Oxmoor Place Hurstbourne Place Hurstbourne Park Lakeview Hunnington Steeplechase Place 33 Map of Louisville Assets |
|
|
Campus-style, four-building Class A office park located on attractive and extensively landscaped grounds Prime Hurstbourne/Lyndon submarket location on the North Hurstbourne corridor along with its open floor plates makes it the suburban choice of many companies 1,385 parking spaces Immediately across the street from University of Louisville Development Recent completion of major capital improvements BOMA 360, Energy Star Forum Office Park 34 Property Facts Submarket Hurstbourne / Lyndon Buildings 4 Net Rentable SF 327,811 Average Effective Rent ($ / RSF) $16.81 Built 1984-1989 Year Acquired 2007 Weighted Average Remaining Lease Term 5.7 years % Occupied at 3/31/15 98% Location 301-307 N. Hurstbourne Parkway Ownership 100% Property Highlights Property Description Forum Office Park |
|
|
Suburban landmark Class A office property located on the most prominent corner in the submarket, constructed with unique reflective glass architecture and height Prestigious thirteen-story glass curtain wall office tower offering glass-panel revolving doors, polished granite floor and granite panel walls in the lobby 791 parking spaces Strategically situated for easy accessibility to I-264, I-64, and I-71 Recipient of IREM 2013 PREMA award for Best Managed office property in Louisville BOMA 360, Energy Star Hurstbourne Place 35 Property Facts Submarket Hurstbourne / Lyndon Buildings 1 Net Rentable SF 234,896 Average Effective Rent ($ / RSF) $18.50 Built 1982 Year Acquired 2007 Weighted Average Remaining Lease Term 3.5 years % Occupied at 3/31/15 80% Location 9300 Shelbyville Road Ownership 100% Property Highlights Property Description Hurstbourne Place |
|
|
Eight-story, dark bronze Class A office tower with efficient floor plates The lobby finish includes flame-cut granite flooring and a double door glass entrance Recently upgraded Class A finishes in common areas, restrooms and new HVAC control and energy management capabilities 281 parking spaces Strategic location in the Hurstbourne corridor within upscale east end submarket Strategically situated for easy accessibility to I-264, I-64 and I-71 BOMA 360, Energy Star Hurstbourne Park 36 Property Facts Submarket Hurstbourne / Lyndon Buildings 1 Net Rentable SF 104,237 Average Effective Rent ($ / RSF) $20.86 Built 1971 Year Acquired 2007 Weighted Average Remaining Lease Term 1.2 years % Occupied at 3/31/15 100% Location 9200 Shelbyville Road Ownership 100% Property Highlights Property Description Hurstbourne Park |
|
|
Brick and glass three-story Class A office building with large efficient floor plates Located in the southwest quadrant of Hurstbourne Parkway and I-64, near executive housing 260 parking spaces Recently updated common areas, restrooms and conference space BOMA 360 Steeplechase Place 37 Property Facts Submarket Hurstbourne / Lyndon Buildings 1 Net Rentable SF 76,666 Average Effective Rent ($ / RSF) $16.77 Built 1989 Year Acquired 2007 Weighted Average Remaining Lease Term 5.3 years % Occupied at 3/31/15 91% Location 9410 Bunsen Parkway Ownership 100% Property Highlights Property Description Steeplechase Place |
|
|
Brick and glass three-story Class A office building with large efficient floor plates Located in the southwest quadrant of Hurstbourne Parkway and I-64, near many prominent residential areas and Louisville Metro’s highway and interstate system 184 parking spaces Upgraded building systems Recent lobby & common area renovations BOMA 360, Energy Star Hunnington 38 Property Facts Submarket Hurstbourne / Lyndon Buildings 1 Net Rentable SF 61,862 Average Effective Rent ($ / RSF) $17.11 Built 1986 Year Acquired 2007 Weighted Average Remaining Lease Term 5.2 years % Occupied at 3/31/15 57% Location 9420 Bunsen Parkway Ownership 100% Property Highlights Property Description Hunnington |
|
|
Four-story granite, Class A office building set on a beautifully landscaped, expansive lawn with a quadruple water fountain in front of the main entrance Directly adjacent to prominent shopping and executive housing with large floor plates and covered executive parking area that set it apart from its closest competition 495 parking spaces Accessible from I-264, I-64 and I-71 Situated in an aesthetically appealing and historical area which benefits from a preservation easement BOMA 360, Energy Star One Oxmoor Place 39 Property Facts Submarket St. Matthews Buildings 1 Net Rentable SF 134,926 Average Effective Rent ($ / RSF) $22.11 Built 1989 Year Acquired 2007 Weighted Average Remaining Lease Term 4.0 years % Occupied at 3/31/15 96% Location 101 Bullitt Lane Ownership 100% Property Highlights Property Description One Oxmoor Place |
|
|
Polished granite four-story Class A office building Located at the southeast corner of Mallard Creek Road and Bowling Boulevard Roof & rooftop units recently replaced 290 parking spaces The building is easily accessible from I-264 via Shelbyville Road Situated within a neighborhood of office, commercial, and residential developments Aesthetically appealing with patio overlooking a reflecting pond BOMA 360 Lakeview 40 Property Facts Submarket St. Matthews Buildings 1 Net Rentable SF 76,438 Average Effective Rent ($ / RSF) $19.33 Built 1989 Year Acquired 2007 Weighted Average Remaining Lease Term 3.7 years % Occupied at 3/31/15 95% Location 100 Mallard Creek Road Ownership 100% Property Highlights Property Description Lakeview |
|
|
5104 Eisenhower 41 Map of Tampa Assets |
|
|
Four-story Class A office building located just west of Tampa International Airport, on the west side of Tampa’s Westshore Business District Converted to a modern open plan office layout with significant upgrades to interior finishes 895 parking spaces 100% leased to Bristol Myers through 2024 Good access to all major submarkets in Tampa, as well as the airport 5.2 acres of additional land used as parking with entitlement to allow for an additional 130k SF office building Energy Star 5104 Eisenhower 42 Property Facts Submarket Westshore Buildings 1 Net Rentable SF 130,091 Average Effective Rent ($ / RSF) $14.64 Built 1998 Year Acquired 2007 Weighted Average Remaining Lease Term 9.3 years % Occupied at 3/31/15 100% Location 5104 Eisenhower Boulevard Ownership 100% Property Highlights Property Description 5104 Eisenhower |
|
|
43 Other Markets / Disposition Pipeline (7 buildings, 4.1mm SF) |
|
|
Wanamaker Building Three Parkway Woodcrest Corporate Center 111 Woodcrest Road 44 Map of Philadelphia Assets |
|
|
12-story Class A building in Center City Philadelphia Constructed in 1904, it was the first department store in Philadelphia and one of the first in the United States Most recent renovation was in 1997 when the retail portion (now Macy’s) was put on the lower 3 floors and the remainder was converted to commercial office space 660 parking spaces Prestigious landmark in Philadelphia Convenient access to public transportation 15 to 20 foot ceiling heights Energy Star Wanamaker Building 45 Property Facts Submarket Market Street East Buildings 1 Net Rentable SF (Pro Rata Ownership) 1,389,838 (833,903) Average Effective Rent ($ / RSF) $17.08 Built 1904 Year Acquired 60% acquired in 2007 Weighted Average Remaining Lease Term 9.2 years % Occupied at 3/31/15 96% Location 1301 Chestnut Street Ownership 60% Property Highlights Property Description Wanamaker Building |
|
|
20-story Class A building in Center City Philadelphia Constructed in 1970, the building had an $8.7 million redevelopment in 1997 and an additional $4.1 million in capital upgrades between 2001 and 2005 Panoramic unobstructed views Convenient access to rail lines and major transportation arteries Café with outdoor seating located in Parkway Plaza, just across the street BOMA 360, TOBY, Energy Star Three Parkway 46 Property Facts Submarket Market Street West Buildings 1 Net Rentable SF 561,351 Average Effective Rent ($ / RSF) $25.31 Built 1970 Year Acquired 2006 Weighted Average Remaining Lease Term 4.1 years % Occupied at 3/31/15 95% Location 1601 – 1645 Cherry Street Ownership 100% Property Highlights Property Description Three Parkway |
|
|
Class A office building that was originally constructed as an industrial property in the 1960s Completely renovated between 2003 and 2005 into an office building Steel framed single story building Exterior facade consists of painted stucco, EIFS, and glass curtain wall 1,849 parking spaces Located close to major access route (I-295) Above market parking ratio Located adjacent to public transportation Energy Star Woodcrest Corporate Center 47 Property Facts Submarket Southern New Jersey Buildings 1 Net Rentable SF 333,275 Average Effective Rent ($ / RSF) $26.26 Built 1960 Year Acquired 2006 Weighted Average Remaining Lease Term 5.7 years % Occupied at 3/31/15 93% Location 101, 121, 131 Woodcrest Road Ownership 100% Property Highlights Property Description Woodcrest Corporate Center |
|
|
Two-story office building originally constructed in 1976 Exterior is precast concrete panels with exposed aggregate finish Pocket windows with highly reflective glass throughout the building and storefront entry doors Located close to major access route (I-295) and adjacent to public transportation Above market parking ratio Roof replaced in 2008 Updated lobby 111 Woodcrest Road 48 Property Facts Submarket Southern New Jersey Buildings 1 Net Rentable SF 52,648 Average Effective Rent ($ / RSF) $20.55 Built 1976 Year Acquired 2007 Weighted Average Remaining Lease Term 4.9 years % Occupied at 3/31/15 85% Location 111 Woodcrest Road Ownership 100% Property Highlights Property Description 111 Woodcrest Road |
|
|
FOUR40 49 Map of Chicago Assets |
|
|
Consists of a 40-story Class A office tower and a 5-story annex Constructed with a structural steel frame with composite concrete on metal deck elevated floor slabs, granite panel spandrel and column exterior cladding and aluminum framed thermal glass panels in punched window assemblies Efficient floor plates 325 parking spaces Above-standard power, telecom and cooling capacity Excellent access to public transportation Recently completed $15 million of building upgrades including lobby renovation and new innovative tenant amenity center with a conference center, lounge, outdoor terrace, and upscale modern café Recently renovated Buckingham Club & Hotel, a premier athletic and social club BOMA 360, LEED EB Gold, Energy Star FOUR40 50 Property Facts Submarket Central Loop Buildings 1 Net Rentable SF 1,041,292 Average Effective Rent ($ / RSF) $28.49 Built 1984 Year Acquired 2007 Weighted Average Remaining Lease Term 5.7 years % Occupied at 3/31/15 68% Location 440 S. LaSalle Ownership 100% Property Highlights Property Description FOUR40 |
|
|
Lawson Commons 51 Map of Minneapolis – St. Paul Assets |
|
|
Premier Class A building in the St. Paul CBD Building frame is comprised of structural steel framing with a brick and glass curtain extension exterior Includes a portion of the City of St. Paul Skyway system, an elevated enclosed walkway connecting downtown buildings Large floor plates Unobstructed views to the west and southwest Excellent ingress and egress, and access to light rail State of the art energy management system LEED EB Gold, Energy Star Lawson Commons 52 Property Facts Submarket Central Business District Buildings 1 Net Rentable SF 436,478 Average Effective Rent ($ / RSF) $24.13 Built 1999 Year Acquired 2005 Weighted Average Remaining Lease Term 5.7 years % Occupied at 3/31/15 89% Location 380 St. Peter Street Ownership 100% Property Highlights Property Description Lawson Commons |
|
|
500 East Pratt 53 Map of Baltimore Assets |
|
|
13-story Class A building located in the CBD of Baltimore Constructed in 2004, one of the newest buildings in the CBD Contains building systems that are superior to those of its more dated competitors Home to 13 tenants with strong credit and minimal near term rollover 699 parking spaces Desirable, prestigious Pratt Street address Unobstructed Harbor views Convenient location to numerous retail and dining destinations including Capital Grille located on first floor BOMA 360, TOBY 500 East Pratt 54 Property Facts Submarket Central Business District Buildings 1 Net Rentable SF 279,712 Average Effective Rent ($ / RSF) $33.14 Built 2004 Year Acquired 2007 Weighted Average Remaining Lease Term 4.1 years % Occupied at 3/31/15 98% Location 500 East Pratt Ownership 100% Property Highlights Property Description 500 East Pratt |
Exhibit 99.5
|
|
TIER REIT Names Gilchrist Chairman of the Board
DALLAS, Texas, July 7, 2015 — TIER REIT, Inc., a Dallas-based real estate investment trust, announced that Rick Gilchrist has been named chairman of the board. Over the past twelve months, the board has expanded with three new members, and with these additions and the company’s pursuit of a listing on a national securities exchange, the board believed it was appropriate to realign this role for the company.
Chuck Dannis, past chairman, will remain on the board and continue to serve on the compensation committee. Mr. Dannis has been our chairman since February 2013 and an independent director since 2003. Mr. Dannis played an instrumental role in assisting the company through its self-management transaction in September 2012 and positioning the company over the past several years in preparation for its listing on a national securities exchange.
“As TIER REIT moves closer to its listing on a national securities exchange, we believe that Rick’s extensive REIT and public markets background will assist us in executing the company’s future strategy,” said Mr. Dannis. “I have enjoyed my role as chairman over the last two years as the company transitioned to a self-managed REIT and look forward to the its future success as a publicly traded company.”
About TIER REIT, Inc.
TIER REIT, Inc. is a self-managed, Dallas, Texas-based real estate investment trust focused on maximizing total return to stockholders through the combination of stock appreciation and income derived from a sustainable distribution. TIER REIT’s investment strategy is to acquire, develop and operate a portfolio of best-in-class office properties in select U.S. markets that consistently lead the nation in population and office-using employment growth. For more information on TIER REIT, please visit tierreit.com or call 972.483.2400.
![]() TIER REIT, Inc.
TIER REIT, Inc.
Kelly Sargent, 972-387-5473
[email protected]
Source: TIER REIT, Inc.
Serious News for Serious Traders! Try StreetInsider.com Premium Free!
You May Also Be Interested In
- Merlin Chain Launches MERL: A Major Leap Forward in Bitcoin Layer 2 Solutions
- Top Non Bank Lenders in Australia
- American Express beats profit estimates on strong spending by wealthy customers
Create E-mail Alert Related Categories
SEC FilingsSign up for StreetInsider Free!
Receive full access to all new and archived articles, unlimited portfolio tracking, e-mail alerts, custom newswires and RSS feeds - and more!


 Tweet
Tweet Share
Share