Form 8-K TESORO LOGISTICS LP For: Aug 19
UNITED STATES
SECURITIES AND EXCHANGE COMMISSION
Washington, D.C. 20549
Form 8-K
CURRENT REPORT
Pursuant to Section 13 or 15(d) of the Securities Exchange Act of 1934
Date of Report (Date of earliest event reported) August 19, 2015
TESORO LOGISTICS LP
(Exact name of registrant as specified in its charter)
Delaware | 1-35143 | 27-4151603 | ||
(State or other jurisdiction of incorporation) | (Commission File Number) | (IRS Employer Identification No.) | ||
19100 Ridgewood Pkwy San Antonio, Texas | 78259-1828 | |
(Address of principal executive offices) | (Zip Code) | |
(210) 626-6000
(Registrant’s telephone number, including area code)
Not Applicable
(Former name or former address, if changed since last report)
Check the appropriate box below if the Form 8-K filing is intended to simultaneously satisfy the filing obligation of the registrant under any of the following provisions (see General Instruction A.2.):
o | Written communications pursuant to Rule 425 under the Securities Act (17 CFR 230.425) | |
o | Soliciting material pursuant to Rule 14a-12 under the Exchange Act (17 CFR 240.14a-12) | |
o | Pre-commencement communications pursuant to Rule 14d-2(b) under the Exchange Act (17 CFR 240.14d-2(b)) | |
o | Pre-commencement communications pursuant to Rule 13e-4(c) under the Exchange Act (17 CFR 240.13e-4(c)) | |
Item 7.01 | Regulation FD Disclosure. | |
On August 19, 2015, Tesoro Logistics LP (the “Partnership”) will present to certain investors at the Citi 2015 MLP/Midstream Infrastructure Conference the information in the attached slides (the “Slide Presentation”). The Slide Presentation, available on our website at www.tesorologistics.com, is filed as Exhibit 99.1 to this Current Report on Form 8-K and is incorporated herein by reference.
The Slide Presentation is being furnished, not filed, pursuant to Item 7.01 of Form 8-K. Accordingly, the information in Item 7.01 of this Current Report will not be subject to liability under Section 18 of the Securities Exchange Act of 1934, as amended (the “Exchange Act”), and will not be incorporated by reference into any registration statement or other document filed by the Partnership under the Securities Act of 1933, as amended, or the Exchange Act, unless specifically identified therein as being incorporated by reference.
Item 9.01 | Financial Statements and Exhibits. | |
(d) Exhibits.
99.1 | Slide Presentation dated August 19, 2015. | ||
2
SIGNATURES
Pursuant to the requirements of the Securities Exchange Act of 1934, the Registrant has duly caused this report to be signed on its behalf by the undersigned, hereunto duly authorized.
Date: August 19, 2015
TESORO LOGISTICS LP | |||
By: | Tesoro Logistics GP, LLC | ||
Its general partner | |||
By: | /s/ STEVEN M. STERIN | ||
Steven M. Sterin | |||
Vice President and Chief Financial Officer | |||
3
Index to Exhibits
Exhibit Number | Description of the Exhibit | ||
99.1 | Slide Presentation dated August 19, 2015. | ||
4

Citi 2015 MLP/Midstream Infrastructure Conference August 2015 Driving Distinctive Growth Exhibit 99.1
2 Forward Looking Statements This Presentation includes forward-looking statements within the meaning of the Private Securities Litigation Reform Act of 1995. These statements relate to, among other things, the following: execution of our strategy and vision, including organic investments for growth and expansion projects , acquisition opportunities and commercial opportunities; our ability to improve operational efficiency and maximize asset utilization; potential growth in our third-party business and revenues; possible logistics asset acquisition opportunities from Tesoro Corporation and its affiliates and the potential EBITDA generated by such assets; EBITDA estimates for Tesoro Logistics and various portions of our businesses and the relative contribution of these businesses; the timing and amount of capital expenditures and the effect on those expenditures on our financial position and EBITDA; expected cost and timeframe for construction projects; our ability to capture new business opportunities and maintain our existing customer base; pricing projections; our ability to maintain a credit-worthy customer base; our ability to reduce risk, including commodity price exposure; our ability to integrate our businesses effectively and increase utilization; the outlook for natural gas production and related pricing; expectations regarding our liquidity, leverage ratio and target debt to EBITDA level; expectations regarding unitholder distribution growth and coverage levels; and other aspects of future performance. We have used the words “anticipate,” “believe,” “could,” “estimate,” “expect,” “intend,” “may,” “plan,” “predict,” “project,” “should,” “will,“ “potential” and similar terms and phrases to identify forward-looking statements in this Presentation. Although we believe the assumptions upon which these forward-looking statements are based are reasonable, any of these assumptions could prove to be inaccurate and the forward-looking statements based on these assumptions could be incorrect. Our operations involve risks and uncertainties, many of which are outside of our control, and any one of which, or a combination of which, could materially affect our results of operations and whether the forward-looking statements ultimately prove to be correct. Actual results and trends in the future may differ materially from those suggested or implied by the forward-looking statements depending on a variety of factors which are described in greater detail in our filings with the SEC. Please see our Risk Factor disclosures included in our 2014 Annual Report on Form 10-K and our quarterly reports on Form 10-Q. All future written and oral forward-looking statements attributable to us or persons acting on our behalf are expressly qualified in their entirety by the previous statements. We undertake no obligation to update any information contained herein or to publicly release the results of any revisions to any forward-looking statements that may be made to reflect events or circumstances that occur, or that we become aware of, after the date of this Presentation. We have included EBITDA, adjusted EBITDA, and distributable cash flow and results of operations excluding Predecessors, each of which is a non-GAAP financial measure, for the company. Please see the Appendix for the definition and reconciliation of these amounts.

3 • Leading provider of upstream and downstream logistics services in Western United States • Growth driven by integrated value chain from wellhead to end users • Capturing opportunities from asset optimization, organic growth and strategic acquisitions • Strategic growth supported by Tesoro • Minimal commodity price exposure through contract with Tesoro Key Investment Highlights Expect strong distribution growth for next several years

4 Well Positioned Assets

5 Focus on Stable, Fee- Based Business • Focused fee-based business with long-term minimum commitments • Maintain minimal commodity price exposure • Provide full-service logistics offering Optimize Existing Asset Base • Improve operational efficiency and maximize asset utilization • Leverage commercial capabilities to expand 3rd party business • Capture Tesoro volumes moving through non-TLLP assets Pursue Organic Expansion Opportunities • Identify and execute low-risk, high-return growth projects • Invest to capture the full commercial value of logistics assets Grow through Strategic Acquisitions • Pursue attractive opportunities in strategic geographic footprint • Strategically partner with Tesoro for new growth initiatives • Methodically acquire Tesoro assets Execution drives EBITDA and distribution growth Strategic Initiatives

6 • Integration across Tesoro’s value chain provides competitive advantage and unique strategic support • Tesoro provides anchor demand to move advantaged crude oil to western U.S. locations • Supporting increasing domestic and export market demand for refined products Product Sales Feedstock Acquisition Inbound Logistics Refining Outbound Logistics Strong Sponsor Support

7 1.35 2.89 2 Q1 1 3 Q1 1 4 Q1 1 1 Q1 2 2 Q1 2 3 Q1 2 4 Q1 2 1 Q1 3 2 Q1 3 3 Q1 3 4 Q1 3 1 Q1 4 2 Q1 4 3 Q1 4 4 Q1 4 1 Q1 5 2 Q1 5 42 39 87 2011 EBITDA 2012 2013 2014 2014 EBITDA 2015 First Call LP distributions have grown over 114% since IPO Note: See appendix for adjusted EBITDA definition and reconciliations. 2015 EBITDA is First Call EBITDA as of 8/10/15 319 151 Distributions Per LP Unit $ annualized Adjusted EBITDA Growth $ in millions 670 Proven Track Record of Delivering Value

8 2015E Business Mix by EBITDA Terminalling & Transportation 45% Natural Gas Gathering and Processing 40% Crude Oil Gathering 15% Strong, committed business model with diversified earning streams 2Q 2015 Revenue Covered By MVCs or Acreage Dedications Covered by MVCs or Acreage Dedications 70% Above MVCs or Acreage Dedications 30% Committed and Diversified Business Model

9 Crude Oil Gathering Asset Overview • 700 miles of crude oil gathering and trunkline pipeline • High Plains Pipeline throughput capacity of 190MBD • Bakken Area Storage Hub storage capacity of 780 thousand barrels Strategy • Support Tesoro’s demand for advantaged Bakken crude oil • Expand High Plains Pipeline system supporting growing 3rd party demand for transportation services • Capture new business opportunities in crude oil and natural gas gathering and storage

10 Source: North Dakota Pipeline Authority, July 2015 North Dakota Crude Oil Production Outlook 0 250 500 750 1,000 1,250 1,500 1,750 2,000 2,250 Ja n -0 7 Ja n -0 8 Ja n -0 9 Ja n -1 0 Ja n -1 1 Ja n -1 2 Ja n -1 3 Ja n -1 4 Ja n -1 5 Ja n -1 6 Ja n -1 7 Ja n -1 8 Ja n -1 9 Ja n -2 0 Ja n -2 1 Ja n -2 2 Ja n -2 3 Ja n -2 4 Ja n -2 5 Ja n -2 6 Ja n -2 7 Ja n -2 8 Ja n -2 9 Ja n -3 0 Ja n -3 1 Ja n -3 2 Ja n -3 3 Williston Basin Production Outlook MBD 37% slowdown in well completions 50% slowdown in well completions Actual

11 Tier 3 $60+ Bakken Core $20 - $30 Tier 2 $35 - $40 Source: North Dakota Department of Mineral Resources, July 2015 Current Wellhead Breakeven Prices $/barrel High Plains Pipeline Well Positioned
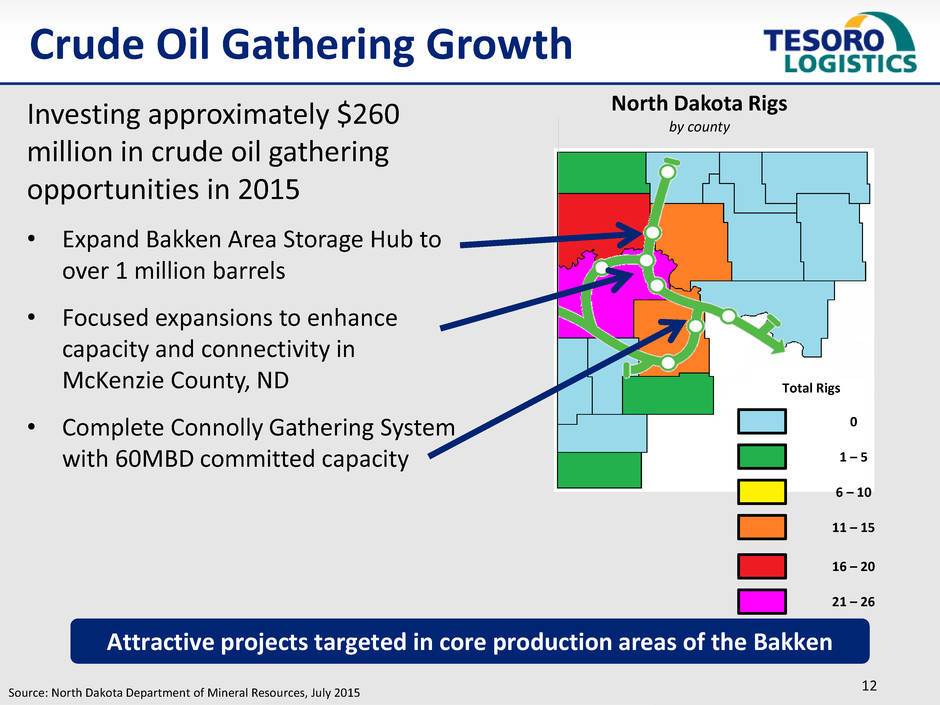
12 Investing approximately $260 million in crude oil gathering opportunities in 2015 • Expand Bakken Area Storage Hub to over 1 million barrels • Focused expansions to enhance capacity and connectivity in McKenzie County, ND • Complete Connolly Gathering System with 60MBD committed capacity Attractive projects targeted in core production areas of the Bakken Total Rigs 0 1 – 5 6 – 10 11 – 15 16 – 20 21 – 26 Source: North Dakota Department of Mineral Resources, July 2015 North Dakota Rigs by county Crude Oil Gathering Growth

13 2Q15 Revenue by Customer Credit Rating 2Q15 Revenue Covered Under MVCs Covered Under MVCs 60%1 Above MVCs 40% Investment Grade 15% Tesoro 65% High Yield 20% Strong MVCs underpinned by stable balance sheets 1) Includes shortfall revenue equivalent to approximately 8% Crude Oil Gathering Committed Customers

14 Asset Overview • Approximately 2,000 miles of natural gas gathering pipeline • Natural gas gathering capacity of over 2,900 MMcf/d • Four natural gas processing complexes and one fractionation facility • Over 1,500 MMcf/d of processing capacity and over 15MBD of fractionation capacity Strategy • Focus on long-term, fee-based contracts with strong, diversified customer base • Leverage Tesoro’s commercial capabilities to minimize any direct commodity exposure • Develop projects supporting production growth and drilling efficiencies • TLLP development capabilities to drive installed asset base utilization Rockies Natural Gas Business

15 Investing approximately $90 million in natural gas opportunities in 2015 • Investing $40-$60 million to expand compression in the Pinedale basin • Investing $50-$75 million to expand gathering, compression and processing systems in Uinta basin • Expect projects to be completed in 2016 Rockies Natural Gas Growth
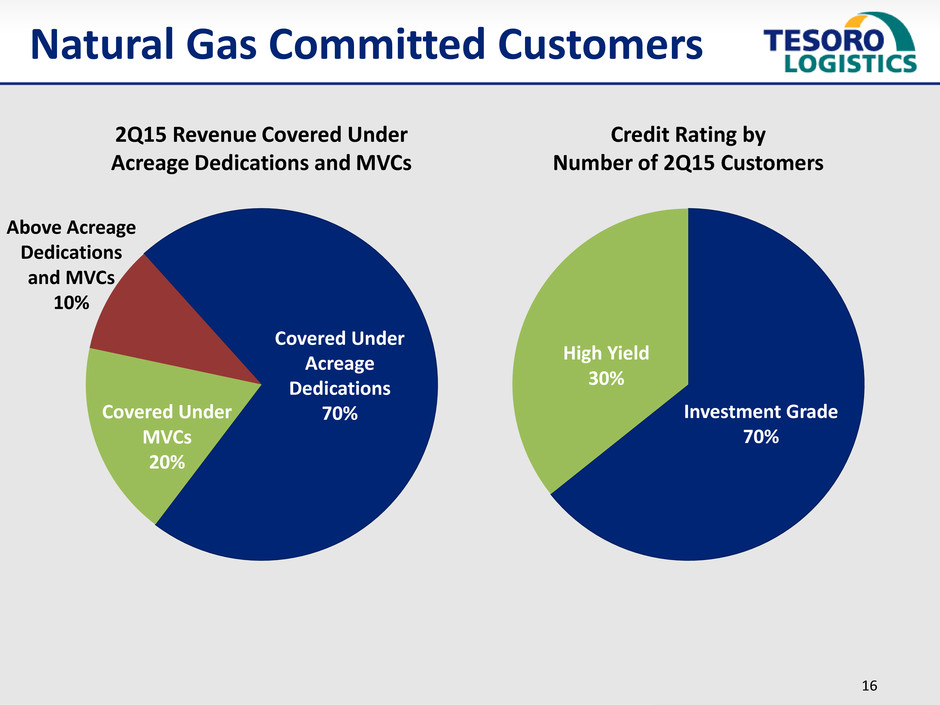
16 Credit Rating by Number of 2Q15 Customers Investment Grade 70% High Yield 30% Covered Under Acreage Dedications 70% Above Acreage Dedications and MVCs 10% 2Q15 Revenue Covered Under Acreage Dedications and MVCs Covered Under MVCs 20% Natural Gas Committed Customers

17 Asset Overview • 24 refined product and storage terminals with over 955MBD throughput capacity • Four marine terminals with 795MBD throughput capacity • 760 mile Northwest Products System pipeline • Over 100 miles of crude oil and refined products pipeline in Southern California distribution system • Dedicated storage capacity of over 9.2 million barrels Strategy • Capture Tesoro volumes from non-TLLP assets • Pursue additional 3rd party business Terminalling & Transportation
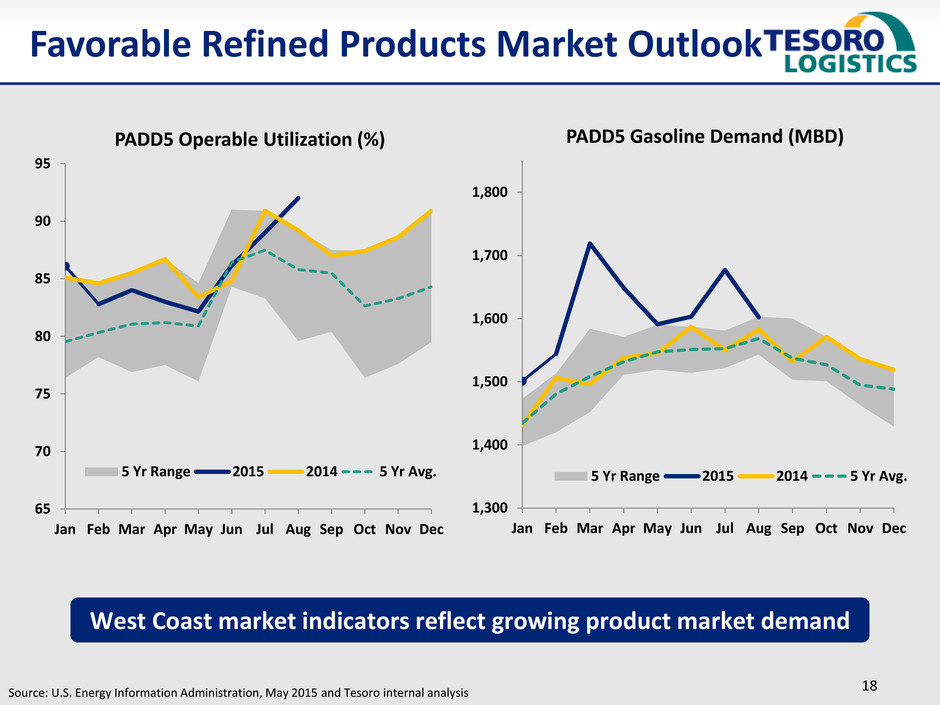
18 Source: U.S. Energy Information Administration, May 2015 and Tesoro internal analysis Favorable Refined Products Market Outlook 1,300 1,400 1,500 1,600 1,700 1,800 Jan Feb Mar Apr May Jun Jul Aug Sep Oct Nov Dec PADD5 Gasoline Demand (MBD) 5 Yr Range 2015 2014 5 Yr Avg. 65 70 75 80 85 90 95 Jan Feb Mar Apr May Jun Jul Aug Sep Oct Nov Dec PADD5 Operable Utilization (%) 5 Yr Range 2015 2014 5 Yr Avg. West Coast market indicators reflect growing product market demand
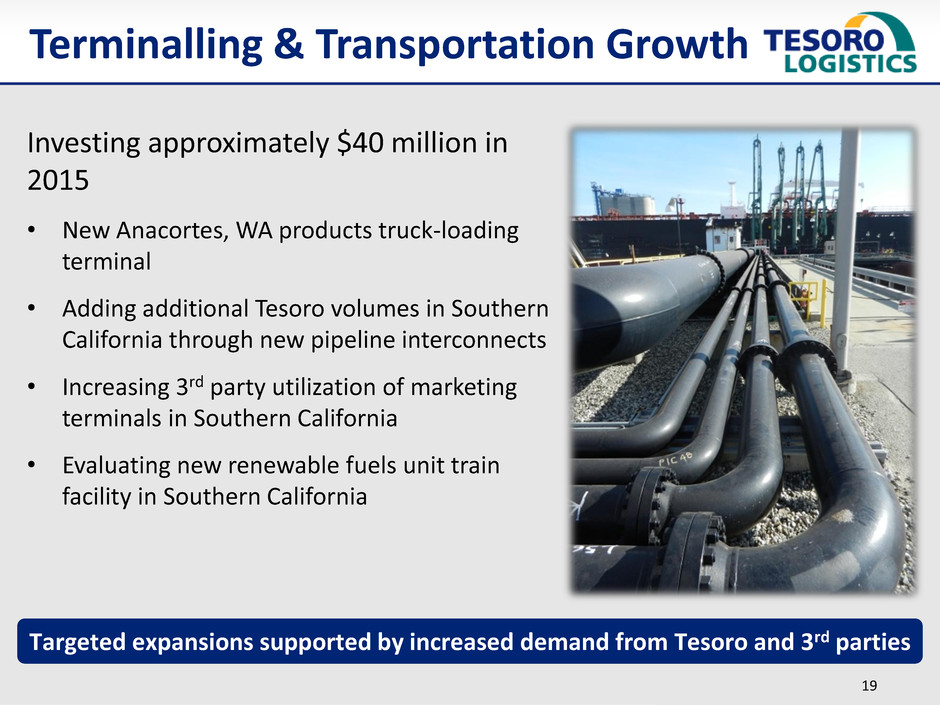
19 Investing approximately $40 million in 2015 • New Anacortes, WA products truck-loading terminal • Adding additional Tesoro volumes in Southern California through new pipeline interconnects • Increasing 3rd party utilization of marketing terminals in Southern California • Evaluating new renewable fuels unit train facility in Southern California Targeted expansions supported by increased demand from Tesoro and 3rd parties Terminalling & Transportation Growth

20 Covered Under MVCs 60%1 Above MVCs 30% Common Carrier Pipeline 10% Tesoro 90% Investment Grade 10% 2Q 2015 Revenue Covered Under MVCs 2Q 2015 Revenue by Customer Credit Rating Terminalling & Transportation Committed Customers Strong MVCs underpinned by stable balance sheets 1) Includes shortfall revenue equivalent to approximately 3%

21 37 40 50 50 200 380 370 350 2014 2015E 2016E 2017E Consolidated Capital Spend Net Maintenance Capital Net Growth Capital 70 150 200 225 2015E 2016E 2017E 2018E Expected EBITDA Growth Organic investment of $1.3 billion expected to drive over $200 million of growth $ in millions Organic Investment Drives EBITDA Growth Note: Expected EBITDA growth derived from organic investment and optimization

22 • Marine terminals • Crude oil pipelines • Marine barges • Railcars • Refinery tank terminals • Marine terminals • Rail terminals • Petroleum Coke handling • Refined products distribution terminals • Refined products pipelines • Rail unloading terminals • Truck unloading terminals • Marine terminals Potential drop downs of at least $500 million of EBITDA; Targeting drop down of at least $50 million of EBITDA in 4Q15 Product Sales Feedstock Acquisition Inbound Logistics Refining Outbound Logistics • Wholesale distribution system Tesoro Driven Logistics Opportunities

23 $ in millions 2014 2015E 2016E 2017E Gathering (Incl. natural gas) 71 250-270 310-340 335-395 Processing 8 140-160 140-160 150-180 Terminalling and Transportation 260 285-315 300-330 310-340 Drop Downs from Tesoro N/A1 50-752 100-150 150-225 Adjusted EBITDA3 319 640-6802 785-940 900-1,075 On track to deliver $640 to $680 million of adjusted EBITDA in 2015 Distinctive Growth Strategy 1) EBITDA contribution from West Coast Logistics assets acquisition of $14 million is included in Terminalling and Transportation segment 2) Due to the 4Q15 timing, the anticipated drop down is not expected to have a material impact on full year 2015 adjusted EBITDA 3) Adjusted EBITDA includes general & administrative expenses that are not allocated to each segment or drop downs from Tesoro

24 Conservative Leverage and Ample Liquidity • $900 million revolving credit facility, expandable to $1.5 billion • Long-term leverage target of 3x to 4x EBITDA • Expect leverage ratio within target range by end of 2015 Pursue Growth through a Balanced Capital Structure • Maximize flexibility to fund growth • Issue equity and/or long-term debt to repay step borrowings Protect and Grow Distributions • Target prudent distribution coverage with a minimum of 1.1x • Expect 17% distribution growth rate for next several years Maintain flexibility to achieve strategic objectives while growing distributions Financial Discipline

25 25 26 36 39 561 51 53 51 113 1082 1Q 1 3 2Q 1 3 3Q 1 3 4Q 1 3 1Q 1 4 2Q 1 4 3Q 1 4 4Q 1 4 1Q 1 5 2Q 1 5 31 32 50 55 75 70 80 94 168 155 1Q 1 3 2Q 1 3 3Q 1 3 4Q 1 3 1Q 1 4 2Q 1 4 3Q 1 4 4Q 1 4 1Q 1 5 2Q 1 5 Adjusted EBITDA3 $ in millions 1.35 1.40 1.45 1.51 1.64 1.82 1.89 1.96 2.04 2.18 2.26 2.36 2.46 2.57 2.67 2.78 2.89 2Q 1 1 3Q 1 1 4Q 1 1 1Q 1 2 2Q 1 2 3Q 1 2 4Q 1 2 1Q 1 3 2Q 1 3 3Q 1 3 4Q 1 3 1Q 1 4 2Q 1 4 3Q 1 4 4Q 1 4 1Q 1 5 2Q 1 5 114% Since IPO in 2Q 2011 1.1x Target coverage ratio 1) 1Q14 distributable cash flow is presented as the $66 million excluding the $10 million of proceeds from the sale of the legacy Boise Terminal 2) 2Q15 distributable cash flow is presented as the $89 million including the $19 million of pro forma adjustments to include the noncontrolling interest in QEPM as controlling interest based on the pro forma assumption that the merger of QEPM and TLLP occurred on April 1, 2015 3) See appendix for adjusted EBITDA definition and reconciliations Distributions Per LP Unit $ annualized Distributable Cash Flow $ in millions Value Proposition to Unitholders

26 Well-Positioned Assets Stable Cash Flow Experienced Management Team Strong Sponsorship Attractive, Visible Growth Opportunities Continuing to Drive Unitholder Value

Appendix

28 Non-GAAP Financial Measures (In millions) Tesoro Logistics LP (a) 1Q 2Q 3Q 4Q Year 1Q 2Q 3Q 4Q Year 1Q 2Q Year Reconciliation of EBITDA, Adjusted EBITDA and Distributable Cash Flow to Net Income (Loss): Net income (loss) 17$ 11$ 1$ 6$ 35$ 42$ 31$ 33$ (8)$ 98$ 74$ 72$ 146$ Loss attributable to Predecessor 2 7 21 15 45$ 1 3 — — 4 — — — Depreciation and amortization expenses, net of Predecessor expense 4 6 13 14 37$ 16 16 18 26 76 44 44 88 Interest and financing costs, net 6 7 12 15 40$ 18 17 28 46 109 37 38 75 Interest income — (1) — — (1)$ — — — — — — — — EBITDA (b) 29 30 47 50 156 77 67 79 64 287 155 154 309 Net gain on asset disposals and impairments — — — — — (4) — — — (4) — — — Acquisition costs included in general and administrative expense 2 2 1 2 7 — — 1 18 19 — 1 1 Billing of deficiency payment (c) — — — — — — — — 10 10 13 — 13 Inspection and maintenance costs associated with the Northwest Products System — — 2 3 5 2 3 — 2 7 — — — Adjusted EBITDA (b) 31 32 50 55 168 75 70 80 94 319 168 155 323 Interest and financing costs, net (d) (6) (7) (12) (15) (40) (18) (17) (21) (30) (86) (37) (38) (75) Net income attributable to noncontrolling interest — — — — — — — — (3) (3) (10) (6) (16) Maintenance capital expenditures, net (e) (2) (4) (4) (4) (14) (2) (5) (13) (24) (44) (9) (15) (24) Other adjustments for noncontrolling interest (f) — — — — — — — — 8 8 (8) (12) (20) Reimbursement for maintenance capital expenditures (e) 1 2 1 1 5 — 1 3 3 7 1 2 3 Unit-based compensation expense — — 1 1 2 — — 1 1 2 1 2 3 Change in deferred revenue — 1 — 1 2 — 1 — 1 2 5 (1) 4 Interest income — 1 — — 1 — — — — — — — — Proceeds from sale of assets — — — — — 10 — — — 10 — — — Amortization of debt issuance costs and other 1 1 — — 2 1 1 3 1 6 2 2 4 Distributable Cash Flow (b) (g) 25$ 26$ 36$ 39$ 126$ 66$ 51$ 53$ 51$ 221$ 113$ 89$ 202$ The financial information contained herein has been retrospectively adjusted to include the historical results of assets acquired from Tesoro and its affiliates. We refer to the historical results of the Los Angeles logistics assets (from June 1, 2013 to December 5, 2013) the West Coast terminal assets (prior to July 1, 2014) and the Tesoro Alaska pipeline (prior to September 30, 2014), collectively as our “Predecessors.” 2015 RECONCILIATION OF AMOUNTS REPORTED UNDER U.S. GAAP 2013 2014

29 Non-GAAP Financial Measures (a) We believe that this presentation of our results of operations excluding results of our “Predecessors” will provide useful information to investors in assessing our results of operations. We believe investors want to analyze operations of our business under our current commercial agreements with Tesoro. This non-GAAP financial measure should not be considered in isolation or as a substitute for analysis of our results as reported under U.S. GAAP. (b) We define EBITDA as net income before loss attributable to Predecessors, depreciation and amortization expenses, net interest and financing costs and interest income. We define adjusted EBITDA as EBITDA plus or minus amounts determined to be “special items” by our management based on their unusual nature and relative significance to earnings in a certain period. We define Distributable Cash Flow as adjusted EBITDA plus or minus amounts determined to be “special items” by our management based on their relative significance to cash flow in a certain period. EBITDA, adjusted EBITDA and Distributable Cash Flow are not measures prescribed by accounting principles generally accepted in the United States of America (“U.S. GAAP”) but are supplemental financial measures that are used by management and may be used by external users of our combined consolidated financial statements, such as industry analysts, investors, lenders and rating agencies, to assess: - our operating performance as compared to other publicly traded partnerships in the midstream energy industry, without regard to historical cost basis or financing methods; - the ability of our assets to generate sufficient cash flow to make distributions to our unitholders; - our ability to incur and service debt and fund capital expenditures; and - the viability of acquisitions and other capital expenditure projects and the returns on investment of various investment opportunities. (c) Several of our contracts contain minimum volume commitments that allow us to charge the customer a deficiency payment if the customer’s actual throughput volumes are less than its minimum volume commitments for the applicable period. Depending on the specific terms of the contract, revenue under these agreements may be classified as deferred revenue and recognized once all contingencies or potential performance obligations associated with these related volumes have either been satisfied through the gathering or processing of future excess volumes of natural gas, or are expected to expire or lapse through the passage of time pursuant to terms of the applicable agreement. During the three month periods ended December 31, 2014 and March 31, 2015, we invoiced customers for deficiency payments. We do not recognize revenue related to the billing periods as these represent opening balance sheet assets for the Rockies Natural Gas Business Acquisition; however, TLLP is entitled to the cash receipt from such billings. (d) Interest and financing costs, net exclude capitalized interest, reimbursed premiums from Tesoro and acquisition related costs. (e) Maintenance capital expenditures include expenditures required to ensure the safety, reliability, integrity and regulatory compliance of our assets. Maintenance capital expenditures, net included in the Distributable Cash Flow are presented net of Predecessor amounts. (f) Adjustments represent cash distributions in excess of (or less than) our controlling interest in income and depreciation as well as other adjustments for depreciation and maintenance capital expenditures applicable to the noncontrolling interest obtained in the December 2, 2014 Rockies Natural Gas Business Acquisition. (g) Certain prior year balances in the calculation of Distributable Cash Flow have been updated to conform to the current year presentation.
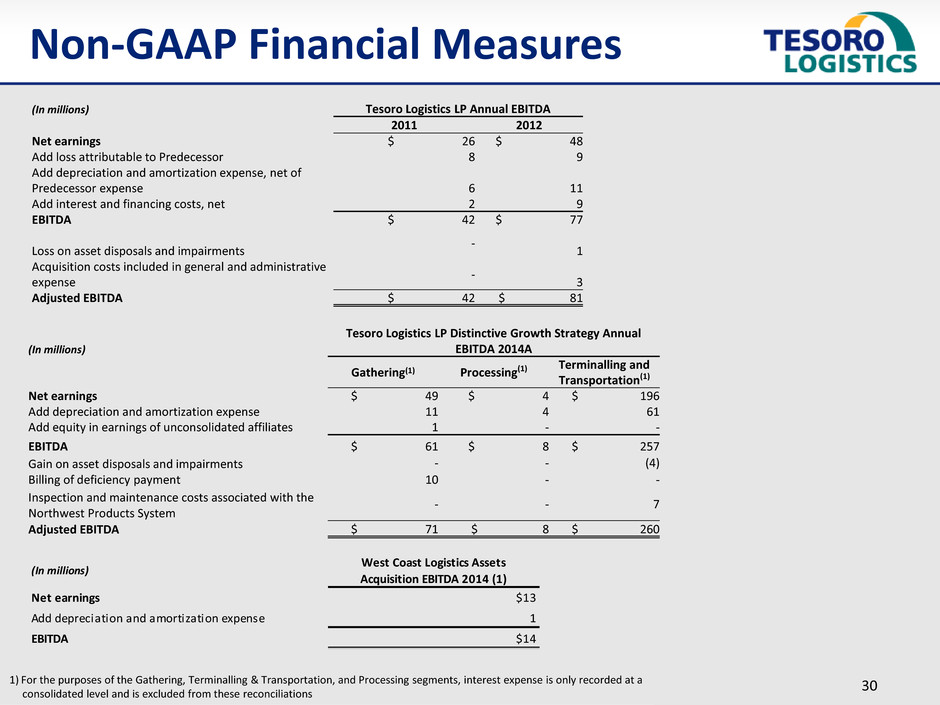
30 (In millions) Tesoro Logistics LP Distinctive Growth Strategy Annual EBITDA 2014A Gathering(1) Processing(1) Terminalling and Transportation(1) Net earnings $ 49 $ 4 $ 196 Add depreciation and amortization expense 11 4 61 Add equity in earnings of unconsolidated affiliates 1 - - EBITDA $ 61 $ 8 $ 257 Gain on asset disposals and impairments - - (4) Billing of deficiency payment 10 - - Inspection and maintenance costs associated with the Northwest Products System - - 7 Adjusted EBITDA $ 71 $ 8 $ 260 Non-GAAP Financial Measures 1) For the purposes of the Gathering, Terminalling & Transportation, and Processing segments, interest expense is only recorded at a consolidated level and is excluded from these reconciliations (In millions) West Coast Logistics Assets Acquisition EBITDA 2014 (1) Net earnings $13 Add depreciation and amortization expense 1 EBITDA $14 (In millions) Tesoro Logistics LP Annual EBITDA 2011 2012 Net earnings $ 26 $ 48 Add loss attributable to Predecessor 8 9 Add depreciation and amortization expense, net of Predecessor expense 6 11 Add interest and financing costs, net 2 9 EBITDA $ 42 $ 77 Loss on asset disposals and impairments - 1 Acquisition costs included in general and administrative expense - 3 Adjusted EBITDA $ 42 $ 81
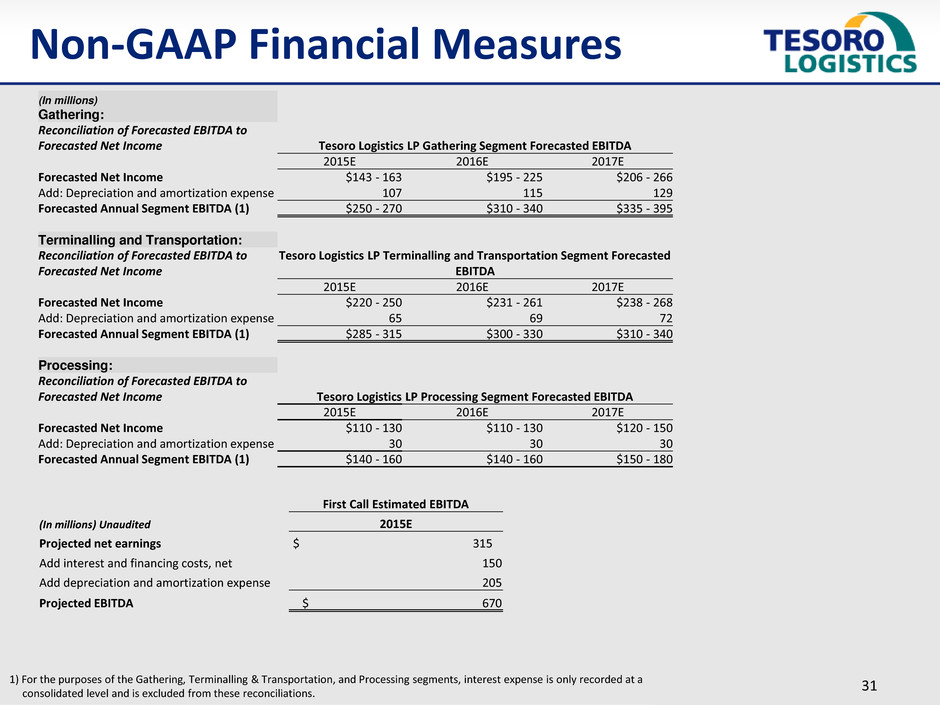
31 (In millions) Gathering: Reconciliation of Forecasted EBITDA to Forecasted Net Income Tesoro Logistics LP Gathering Segment Forecasted EBITDA 2015E 2016E 2017E Forecasted Net Income $143 - 163 $195 - 225 $206 - 266 Add: Depreciation and amortization expense 107 115 129 Forecasted Annual Segment EBITDA (1) $250 - 270 $310 - 340 $335 - 395 Terminalling and Transportation: Reconciliation of Forecasted EBITDA to Forecasted Net Income Tesoro Logistics LP Terminalling and Transportation Segment Forecasted EBITDA 2015E 2016E 2017E Forecasted Net Income $220 - 250 $231 - 261 $238 - 268 Add: Depreciation and amortization expense 65 69 72 Forecasted Annual Segment EBITDA (1) $285 - 315 $300 - 330 $310 - 340 Processing: Reconciliation of Forecasted EBITDA to Forecasted Net Income Tesoro Logistics LP Processing Segment Forecasted EBITDA 2015E 2016E 2017E Forecasted Net Income $110 - 130 $110 - 130 $120 - 150 Add: Depreciation and amortization expense 30 30 30 Forecasted Annual Segment EBITDA (1) $140 - 160 $140 - 160 $150 - 180 1) For the purposes of the Gathering, Terminalling & Transportation, and Processing segments, interest expense is only recorded at a consolidated level and is excluded from these reconciliations. Non-GAAP Financial Measures First Call Estimated EBITDA (In millions) Unaudited 2015E Projected net earnings $ 315 Add interest and financing costs, net 150 Add depreciation and amortization expense 205 Projected EBITDA $ 670

32 (In millions) Reconciliation of Forecasted annual EBITDA to Forecasted Net Income: Annual EBITDA Contributions from Drop Downs from Tesoro 2015E 2016E 2017E Forecasted Net Income $28 - 53 $56 - 106 $84 - 159 Add: Depreciation and amortization expenses 2 4 6 Add: Interest and financing costs, net 20 40 60 Forecasted Annual EBITDA $50 - 75 $100 - 150 $150 - 225 Annual Expected EBITDA: Reconciliation of Forecasted EBITDA to Forecasted Net Income Tesoro Logistics LP Annual Expected EBITDA 2015E 2016E 2017E Forecasted Net Income $288 - 328 $361 - 516 $437 - 612 Add depreciation and amortization expense 202 218 237 Add interest and financing costs, net 150 206 226 Forecasted Annual EBITDA $640 - 680 $785 - 940 $900 - 1,075 Reconciliation of Forecasted EBITDA to Forecasted Net Income EBITDA from Potential Drop Downs Forecasted Net Income $344 Add depreciation and amortization expense 23 Add interest and financing costs, net 133 Forecasted Annual EBITDA $500 Reconciliation of Forecasted annual EBITDA to Forecasted Net Income: Cumulative EBITDA from Organic Investments 2015E 2016E 2017E 2018E Forecasted Net Income $ 59 $ 110 $ 133 $ 133 Add: Depreciation and amortization expenses 7 25 42 58 Add: Interest and financing costs, net 4 15 25 34 Forecasted Annual EBITDA $ 70 $ 150 $ 200 $ 225 Non-GAAP Financial Measures

33 1) Shorter term primarily reflects typical commercial arrangements 2) Fixed minimum volumes remain in effect during routine turnarounds Commercial Agreements With Tesoro Refinery Shutdown Force Majeure Transportation Agreement (High Plains System) Apr-11 10 Years 2 x 5 Years 49 mbpd FERC Index Second Amended and Restated Trucking Transporation Services Agreement (High Plains System) Apr-11 5 Years (1) 1 x 5 Years 32 mbpd Market Comp Second Amended and Restated Master Terminalling Agreement Apr-11 10 Years 2 x 5 Years 108 mbpd CPI Salt Lake City Storage Agreement Apr-11 10 Years 2 x 5 Years 878,000 bbls CPI Amended Salt Lake City Transporation Agreement Apr-11 10 Years 2 x 5 Years 250 mbpd CPI Amorco Terminal Use and Throughput Agreement (Martinez Marine) Apr-12 10 Years 2 x 5 Years 65 mbpd CPI Amended Anacortes Track Use and Throughput Agreement Nov-12 10 Years 2 x 5 Years 40 mbpd CPI Carson Storage Services Agreement Jun-13 10 Years 2 x 5 Years 1,920,000 bbls CPI Amended and Restated Master Terminalling Services Agreement - Southern California Jun-13 10 Years 2 x 5 Years CPI Terminalling Services Jun-13 10 Years 2 x 5 Years 154 mbpd CPI Dedicated Storage Jun-13 10 Years 2 x 5 Years 2,927,143 bbls CPI Long Beach Storage Services Agreement Dec-13 10 Years 2 x 5 Years 1,995,197 bbls CPI Carson Coke Handling Service Agreement Dec-13 10 Years 2 x 5 Years 2,212 MTPD CPI Amended and Restated Long Beach Berth Access Use and Throughput Agreement Dec-13 10 Years 2 x 5 Years CPI Long Beach Berth Throughput Agreement Dec-13 10 Years 2 x 5 Years 295 mbpd CPI Long Beach Pipeline Throughput Agreement Dec-13 10 Years 2 x 5 Years 30 mbpd CPI Transportation Services Agreement (SoCal Pipelines) Dec-13 10 Years 2 x 5 Years 500 mbpd CPI Terminalling Services Agreement - Anacortes Jul-14 10 Years 2 x 5 Years 8 mbpd CPI Storage Services Agreement - Anacortes Jul-14 10 Years 2 x 5 Years 1,542,000 bbls CPI Terminalling Services Agreement - Martinez Jul-14 10 Years 2 x 5 Years 25 mbpd CPI Martinez Dedicated LPG Storage Agreement Jul-14 10 Years 2 x 5 Years 10,908 bbls CPI Terminalling Services Agreement - Nikiski Jul-14 10 Years 2 x 5 Years 3 mbpd CPI 29 mbpd Winter 33 mbpd Summer N/A Tesoro Logistics can declare (unilateral) 12 Month notice (2) Termination Provisions Initation Date Term Renewals Fixed Minimum Volume Commitment Tarrif/Fee Escalators Teroso Alaska Pipeline Throughput Agreement RCASep-14 10 Years 2 x 5 Years
Serious News for Serious Traders! Try StreetInsider.com Premium Free!
You May Also Be Interested In
- Alvotech Announces Topline Results from a Confirmatory Clinical Study for AVT05, a Proposed Biosimilar for Simponi® (golimumab)
- Of Consumers, 70% Are Excited about GenAI in the Workplace, but Only 43% Are Enthusiastic about Its Impact on Daily Life
- Zuora Partners with Global Video Game Publisher Ubisoft to Power Its Subscription Services
Create E-mail Alert Related Categories
SEC FilingsSign up for StreetInsider Free!
Receive full access to all new and archived articles, unlimited portfolio tracking, e-mail alerts, custom newswires and RSS feeds - and more!


 Tweet
Tweet Share
Share