Form 8-K Skilled Healthcare Group For: Jan 14
UNITED STATES
SECURITIES AND EXCHANGE COMMISSION
Washington, D.C. 20549
Form�8-K
�CURRENT REPORT
Pursuant to Section�13 or 15(d) of the
Securities Exchange Act of 1934
Date of Report (Date of earliest event reported): January 14, 2015
�Skilled Healthcare Group, Inc.
(Exact name of registrant as specified in its charter)
Delaware | 001-33459 | 20-3934755 | ||
(State or Other Jurisdiction of Incorporation) | (Commission File Number) | (IRS Employer Identification Number) | ||
27442 Portola Parkway, Suite�200 Foothill Ranch, CA | 92610 | |
(Address of Principal Executive Offices) | (Zip Code) | |
(949)�282-5800
(Registrant's telephone number, including area code)
Not Applicable
(Former Name or Former Address, if Changed Since Last Report)
Check the appropriate box below if the Form 8-K filing is intended to simultaneously satisfy the filing obligation of the registrant under any of the following provisions:
o | Written communications pursuant to Rule�425 under the Securities Act (17 CFR 230.425) |
o | Soliciting material pursuant to Rule�14a-12 under the Exchange Act (17 CFR 240.14a-12) |
o | Pre-commencement communications pursuant to Rule�14d-2(b) under the Exchange Act (17 CFR 240.14d-2(b)) |
o | Pre-commencement communications pursuant to Rule�13e-4(c) under the Exchange Act (17 CFR 240.13e-4(c)) |
Item 7.01 Regulation FD Disclosure
Attached hereto as Exhibit 99.1 is a copy of an electronic slide show presentation which Skilled Healthcare Group, Inc. (the
Company
) and Genesis HealthCare intend to share during their scheduled presentation at the 33rd Annual J.P. Morgan Healthcare Conference in San Francisco, California, on Thursday, January 15, 2015, at 9:30 am Pacific Time, which among other things discusses the proposed combination of the Company and Genesis HealthCare. The proposed combination is discussed in the Companys Current Reports on Form 8-K filed with the U.S. Securities and Exchange Commission (the
SEC
) on August 18, 2014 and January 9, 2015, as well as in the Companys definitive information statement filed with the SEC on January 9, 2015.
Forward-Looking Statements
Certain statements in this Form 8-K (including without limitation its attached exhibit) regarding the Companys future expectations, beliefs, goals or prospects, including regarding its pending combination with Genesis HealthCare, as well as the Companys estimations of future performance, constitute
forward-looking statements
under Section 27A of the Securities Act of 1933 and Section 21E of the Securities Exchange Act of 1934. Forward-looking statements may be preceded by, followed by or include the words
may,
will,
believe,
expect,
anticipate,
intend,
plan,
estimate,
could,
might,
or
continue
or the negative or other variations thereof or comparable terminology. A number of important factors could cause actual events or results to differ materially from those indicated by such forward-looking statements, including without limitation the parties ability to consummate the transaction; the timing for satisfying the conditions to the completion of the transaction, including the receipt of the regulatory approvals required for the transaction; the parties ability to meet expectations regarding the timing and completion of the transaction, as well as future performance by the combined company; the occurrence of any event, change or other circumstance that could give rise to the termination of the Purchase Agreement; and other factors described in the most recent Annual Report on Form 10-K of the Company and elsewhere in the Companys filings with the SEC. You should not place undue reliance on any of these forward-looking statements. Any forward-looking statement speaks only as of the date on which it is made, and the Company undertakes no obligation to update any such statement to reflect new information, or the occurrence of future events or changes in circumstances.
Additional Information and Where to Find It
This communication is being made in respect of the transactions contemplated by the Purchase Agreement referenced in the Companys Current Report on Form 8-K filed with the SEC on August 18, 2014, as amended by Amendment No. 1 referenced in the Companys Current Report on Form 8-K filed with the SEC on January 9, 2015. In connection with the consummation of such transactions, the Company filed with the SEC a preliminary information statement on December 15, 2014 and a definitive information statement on January 9, 2015. The Company has commenced mailing of the definitive information statement to stockholders of record of the Company on January 8, 2015. The definitive information statement provides additional important information concerning the transactions contemplated by the Purchase Agreement. The Companys stockholders will be able to obtain, without charge, a copy of the information statement and other relevant documents filed with the SEC from the SECs website at http://www.sec.gov. The Companys stockholders will also be able to obtain, without charge, a copy of the information statement and other documents relating to the Purchase Agreement (when available) upon written request to Skilled Healthcare Group, Inc. at 27442 Portola Parkway, Suite 200, Foothill Ranch, CA, 92610 or from the Companys website, www.skilledhealthcaregroup.com.
Item 9.01. Financial Statements and Exhibits
2
(d) Exhibits.
Exhibit Number | Description | ||
99.1 | Electronic Slide Show Presentation | ||
3
SIGNATURES
Pursuant to the requirements of the Securities Exchange Act of 1934, the registrant has duly caused this report to be signed on its behalf by the undersigned hereunto duly authorized.
SKILLED HEALTHCARE GROUP, INC.
Date: January 14, 2015����/s/ Roland G. Rapp������������
Roland G. Rapp
General Counsel, Chief Administrative Officer and Secretary
4
EXHIBIT INDEX
Exhibit Number | Description | |
99.1 | Electronic Slide Show Presentation. | |
5

Skilled Healthcare Group, Inc + Genesis HealthCare LLC Creating a Leading National Provider of Post-Acute Services January 2015
�
Safe Harbor Statement Certain statements in this presentation regarding the proposed transaction, the expected timetable for completing the transaction, benefits of the transaction, future opportunities for the Company and any other statements regarding the Companys future expectations, beliefs, goals or prospects contained in this presentation constitute
forward-looking statements
under Section 27A of the Securities Act of 1933 and Section 21E of the Securities Exchange Act of 1934. Forward-looking statements may be preceded by, followed by or include the words
may,
will,
believe,
expect,
anticipate,
intend,
plan,
estimate,
could,
might,
or
continue
or the negative or other variations thereof or comparable terminology. A number of important factors could cause actual events or results to differ materially from those indicated by such forward-looking statements, including the parties ability to consummate the transaction; the results and impact of the announcement of the transaction; the timing for satisfying the conditions to the completion of the transaction, including the receipt of the regulatory approvals required for the transaction; the parties ability to meet expectations regarding the timing and completion of the transaction; the occurrence of any event, change or other circumstance that could give rise to the termination of the Purchase and Contribution Agreement; and other factors described in the most recent Annual Report on Form 10-K of the Company and elsewhere in the Companys filings with the Securities and Exchange Commission. You should not place undue reliance on any of these forward- looking statements. Any forward-looking statement speaks only as of the date on which it is made, and the Company undertakes no obligation to update any such statement to reflect new information, or the occurrence of future events or changes in circumstances. 1
�
Transaction Update Genesis Growth Strategy Financial Summary AGENDA Genesis and Skilled Combined
�

Transaction Update " Hart-Scott-Rodino clearance received " Regulatory notification / consent-request submissions made to all state regulators " Definitive Information Statement was mailed to Skilled Shareholders on January 9th " Genesis term loan amendment approved by existing lending group " Working toward financing for Skilled real estate assets " Both organizations working well and cooperatively through integration plans " No change in original synergy estimates of at least $25 million " Targeting Feb 2nd transaction close Financing Regulatory Integration 3
�

Transaction Summary � Skilled and Genesis to combine in stock-for-stock transaction � Existing Skilled public shares shall remain outstanding w Onex high-vote stock will have only one vote per share � Up-C structure w/ a subsidiary of Skilled becoming a new managing member of Genesis; existing Genesis equity-holders will initially retain a portion of interests in Genesis (
OP Units
) w Each Genesis OP unit will be economically fungible with, and exchangeable for, one share of Skilled stock � Following the combination, the Combined Company will remain a public company � Existing Skilled shareholders will own 25.75% and Genesis shareholders will own 74.25% of the pro forma Combined Company � Approximate pro forma ownership structure: � Skilled public investors (16%); Onex (10%); Formation Capital Principals (28%); Management (9%) � Other Genesis shareholders (34%); Health Care REIT (3%) � The Combined Company will operate under the Genesis HealthCare name � George Hager, CEO; Tom DiVittorio, CFO � Board composition: CEO, George Hager � 10 additional directors appointed or jointly appointed by Genesis/Skilled. At least 3 will be independent. � Regulatory approvals and customary closing conditions � Targeting Feb 2nd transaction close Governance Structure and Considerations Path to Completion 4
�

Leading Post-Acute Platform � Expands one of the largest providers of post acute care inpatient services � Scale to drive local & national market efficiencies � Accelerates revenue, earnings, free cash flow growth � Enhances Rehab growth by introducing Genesis into new Skilled markets � Rehab services provided to 1,500+ pro forma sites of service � Complementary operating strategies � Pioneers in the development of high acuity capabilities � Focus on rehab intensive services � Strategically & clinically well-positioned with payors and referral sources � Strong management team with a demonstrated track record of integrating sizable acquisitions � Genesis acquired/integrated 199 facilities in Sun acquisition in 2012 w Targeted $50 mm of synergies & realized $60 mm+ Strategically Attractive Partnership Financially Compelling Transaction � Long term growth opportunity across Skilled &Genesis platforms � Strategic & organic growth � Meaningful synergy opportunity � Combined rehab platform better positioned to continue high-growth growth trajectory � Genesis IT and operating model improves efficiency and margins for non-affiliated third party operators � Significant Combined Company asset value � Combined Company will own the real estate of 58 SNFs / 22 ALFs � Sizeable home health / hospice platform and nurse / therapist staffing provider � Attractive rate environment for skilled nursing providers � Medicares 2.0% average increase for FY15 is the most attractive in recent years � Improved state budgets have resulted in favorable Medicaid environment 5
�

Transaction Update Genesis Growth Strategy Financial Summary AGENDA Genesis and Skilled Combined
�

Broad Combined Geographic Scale Pro Forma Inpatient Services Footprint Skilled Healthcare Facilities Genesis HealthCare Facilities � Over 500 SNF and ALF facilities across 34 states � Top 5 states by licensed beds: � PA: 10.6% � NJ: 8.9% � MD: 7.7% � MA: 7.4% � CA: 7.0% ___________________________ Source: Company information. 7
�

28 8 2 Hawaii 4 55 185 16 7 8 2 34 63 123 6 4 2 12 9 27 67 76 63 14 23 18 23 45 29 95 14 8 21 6 9 1 12 1 6 10 10 37 1 83 60 52 Expansive Rehabilitation and Respiratory Services GRS and RHS GRS Only RHS Only Expansive Service Contract Footprint ___________________________ Note: Facility counts by state are for GRS Only. 108 1 3 11 7 11 10 3 40 Skilled Healthcare Rehab Contracts Genesis is the 2nd largest contract rehabilitation therapy provider in the U.S., with nearly 1,400 contracts in 45 states and D.C. (
GRS
) 8
�

Genesis and Skilled Combined " One of the largest post-acute and contract rehabilitation providers in the nation " Combined revenues of approximately $5.6 billion (as of Sept. 30, 2014) " More than 500 facilities in 34 states " Approximately 95,000 employees " Estimated $25 million in identified synergies, with additional upside potential " The Combined Company estimated Pro-forma Funded Net-Debt is expected to be approximately $950 million 9
�
Transaction Update Genesis Growth Strategy Financial Summary AGENDA Genesis and Skilled Combined
�

Genesis Growth Strategy � Develop specialized post-acute / long-term care services & buildings � Grow through selective acquisitions and successful integration � Leverage growth in rehab therapy segment including home-based services � Position for success in a post-healthcare reform environment 11
�

Specialized Services & Buildings � Transform existing facilities to focus 100% on short-term, post-acute care � Accelerate growth in higher margin, higher skilled services 100% Short-Stay / Post-Acute Facilities 100% Long-Term Care Genesis Bifurcation Strategy � Transform existing facilities to focus 100% on long-term care � Increase occupancy and overall profitability of long-term care facilities 12
�
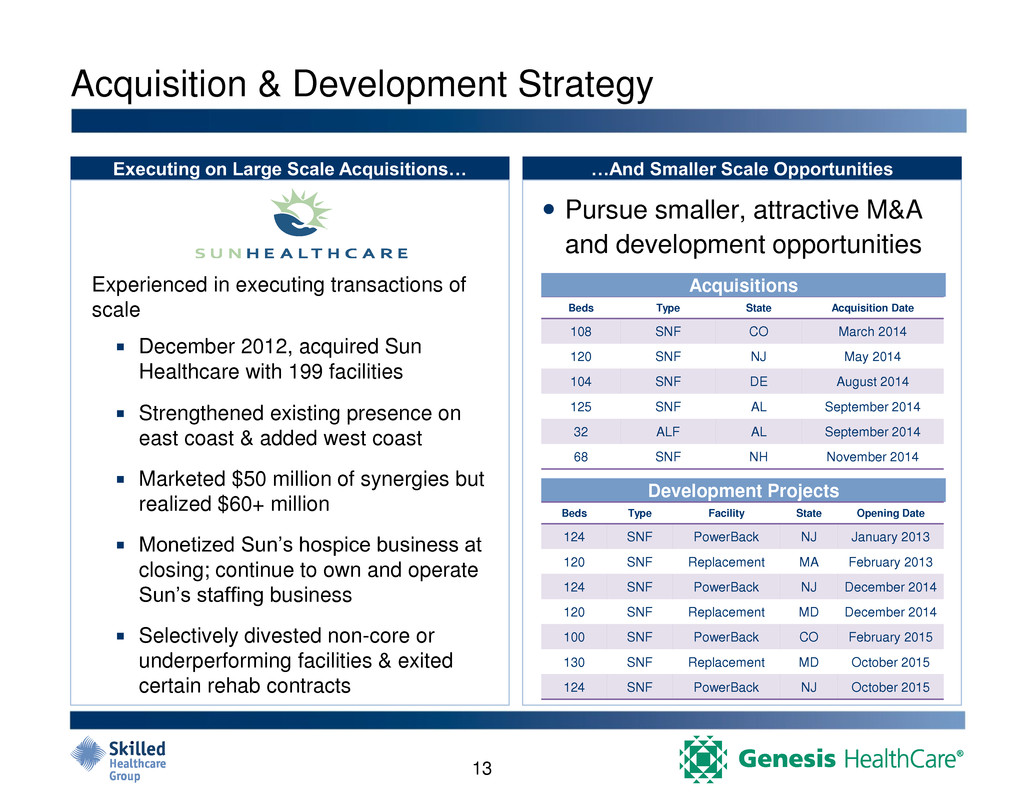
Acquisition & Development Strategy Experienced in executing transactions of scale � December 2012, acquired Sun Healthcare with 199 facilities � Strengthened existing presence on east coast & added west coast � Marketed $50 million of synergies but realized $60+ million � Monetized Suns hospice business at closing; continue to own and operate Suns staffing business � Selectively divested non-core or underperforming facilities & exited certain rehab contracts Executing on Large Scale Acquisitions& &And Smaller Scale Opportunities � Pursue smaller, attractive M&A and development opportunities Beds Type State Acquisition Date 108 SNF CO March 2014 120 SNF NJ May 2014 104 SNF DE August 2014 125 SNF AL September 2014 32 ALF AL September 2014 68 SNF NH November 2014 Acquisitions Development Projects Beds Type Facility State Opening Date 124 SNF PowerBack NJ January 2013 120 SNF Replacement MA February 2013 124 SNF PowerBack NJ December 2014 120 SNF Replacement MD December 2014 100 SNF PowerBack CO February 2015 130 SNF Replacement MD October 2015 124 SNF PowerBack NJ October 2015 13
�

15 Bifurcation Case Study � Assumptions: � Convert 10 buildings to short-stay model � Convert 10 buildings to long-term care model � Build 6 new non-Medicaid certified short-stay facilities � Assumed Operating Metrics: Conversions Current Portfolio 10 Short-Stay 10 Long-Term Care 6 New Builds Pro Forma Portfolio Number of SNFs 360 - - 6 366 SNF Beds 42,418 - - 720 43,138 Avg Beds / SNF 118 - - 120 118 Occupancy 88.5% 85.0% 97.0% 85.0% 88.6% Skilled Mix 22.0% 100.0% 10.0% 100.0% 24.8% 14
�

Growth Strategies: Genesis Rehab Services 15 � Organic net contract growth 100 per year � Genesis/Formation acquisition/development strategy � Expand into new states post Skilled transaction � Expansion of Outpatient Services � Vitality at Home � National / regional Home Health collaboration
�

Post-Healthcare Reform Environment Managed Care Strategy �Build upon strong relationships with national and regional managed care plans � Reduces readmissions � Improves quality outcomes � Creates efficiency in the healthcare delivery system �Capture additional patient referrals resulting from expanded coverage through healthcare reform " Readmission Incentive programs 16
�

Partnering Strategy With Providers Key Partners Key Strategies � Develop SNFs in partnership with acute care providers � Partner with hospitals to deliver COPD and CHF specialties to reduce re-hospitalization / re-admission rates � Strategic partnerships to develop additional PowerBack centers � Unique software solutions to identify a patients unique care requirements & match the patient with appropriate post-acute care setting � Partner with provider of dialysis services Well positioned for inclusion in applicable ACO networks as well as bundled / episodic payment programs 17
�

Enhancing Skilled Mix through Focus on High Acuity Patients Specialty Care Units # of Specialty Units Short-Term Specialties PowerBack Rehabilitation 8 Transitional Care Units 103 Progression Orthopedic Units 4 Long-Term Specialties Alzheimers Units 53 Ventilator Care Units 8 Dialysis Units 11 18
�

Genesis Physician Services (
GPS
) � Group practice specializing in sub- acute, skilled nursing & long-term care � Dedicated Medical Directors & full-/ part-time Attending Physicians, NPs and PAs � Clinical care partners for the entire Genesis care team � 73% of facility admissions are seen by GPS providers (where a GPS presence exists) � 525,000 patient visits annually Leading the Direction of Post Acute Care Full-Time Provider Growth 52 74 102 119 141 24 42 55 70 82 76 116 157 189 223 0 50 100 150 200 250 Sep-10 Sep-11 Sep-12 Sep-13 Sep-14 Nurse Practitioners Physicians 19
�
Transaction Update Genesis Growth Strategy Financial Summary AGENDA Genesis and Skilled Combined
�
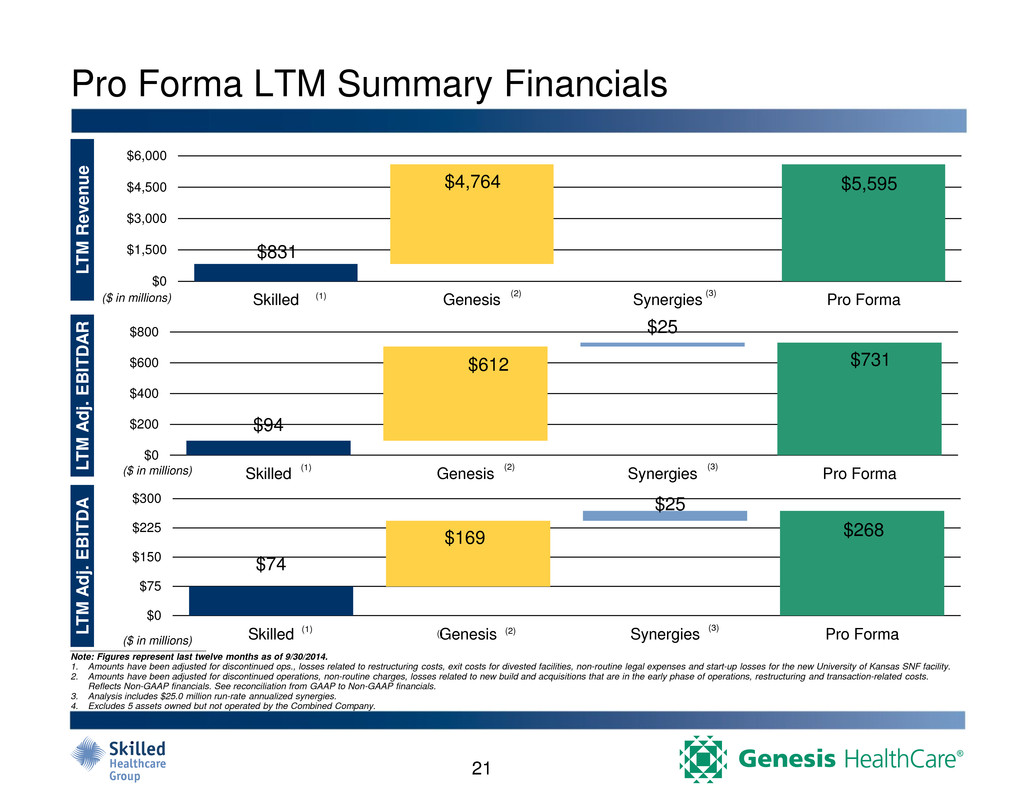
Pro Forma LTM Summary Financials ___________________________ Note: Figures represent last twelve months as of 9/30/2014. 1. Amounts have been adjusted for discontinued ops., losses related to restructuring costs, exit costs for divested facilities, non-routine legal expenses and start-up losses for the new University of Kansas SNF facility. 2. Amounts have been adjusted for discontinued operations, non-routine charges, losses related to new build and acquisitions that are in the early phase of operations, restructuring and transaction-related costs. Reflects Non-GAAP financials. See reconciliation from GAAP to Non-GAAP financials. 3. Analysis includes $25.0 million run-rate annualized synergies. 4. Excludes 5 assets owned but not operated by the Combined Company. L T M Re v en u e L T M A dj. EBITD A R L T M A dj. EBITD A $94 $612 $25 $731 $0 $200 $400 $600 $800 Skilled Genesis Synergies Pro Forma($ in millions) $74 $169 $25 $268 $0 $75 $150 $225 $300 Skilled Genesis Synergies Pro Forma($ in millions) (3) $831 $4,764 $5,595 $0 $1,500 $3,000 $4,500 $6,000 Skilled Genesis Synergies Pro Forma($ in millions) (1) (1) (1) (3) () (2) (2) (2) (3) 21
�
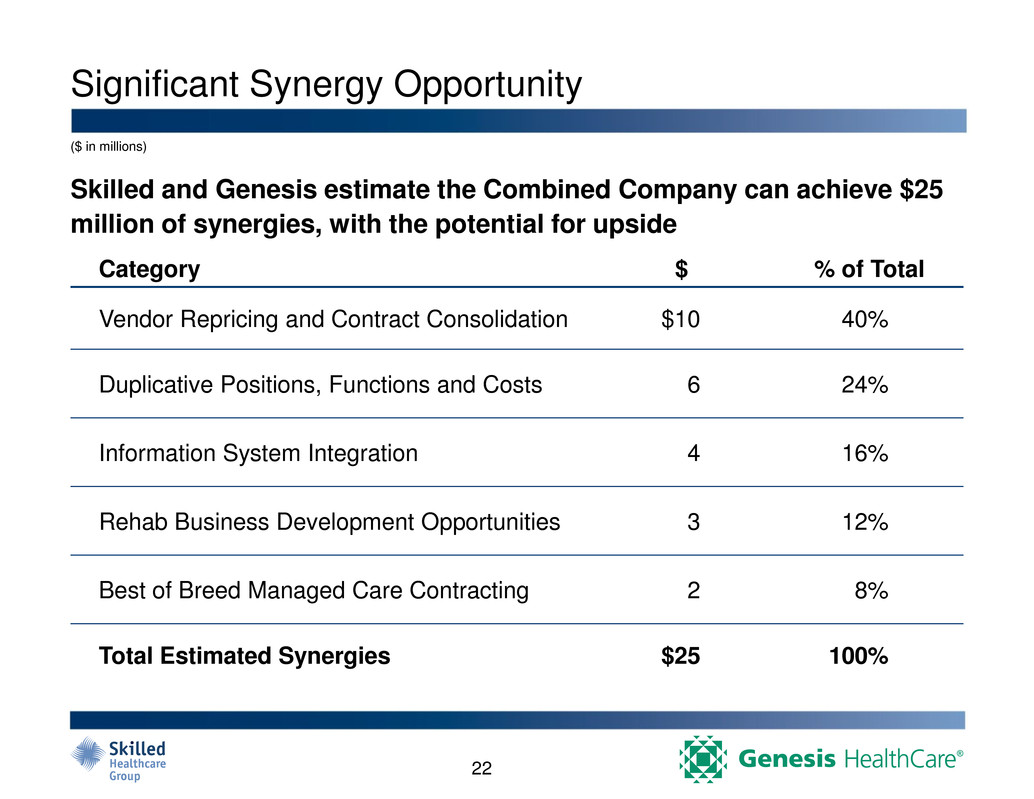
Significant Synergy Opportunity Skilled and Genesis estimate the Combined Company can achieve $25 million of synergies, with the potential for upside Category $ % of Total Vendor Repricing and Contract Consolidation $10 40% Duplicative Positions, Functions and Costs 6 24% Information System Integration 4 16% Rehab Business Development Opportunities 3 12% Best of Breed Managed Care Contracting 2 8% Total Estimated Synergies $25 100% ($ in millions) 22
�
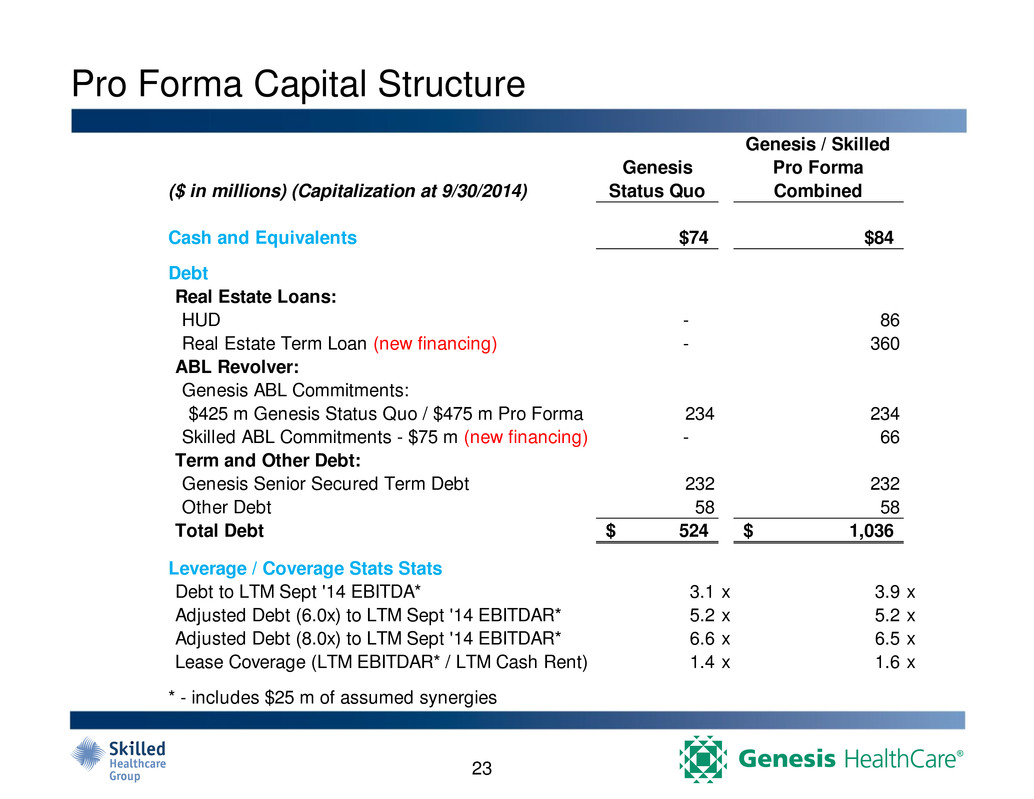
Pro Forma Capital Structure ($ in millions) (Capitalization at 9/30/2014) Genesis Status Quo Genesis / Skilled Pro Forma Combined Cash and Equivalents $74 $84 Debt Real Estate Loans: HUD - 86 Real Estate Term Loan (new financing) - 360 ABL Revolver: Genesis ABL Commitments: $425 m Genesis Status Quo / $475 m Pro Forma 234 234 Skilled ABL Commitments - $75 m (new financing) - 66 Term and Other Debt: Genesis Senior Secured Term Debt 232 232 Other Debt 58 58 Total Debt 524$ 1,036$ Leverage / Coverage Stats Stats Debt to LTM Sept '14 EBITDA* 3.1 x 3.9 x Adjusted Debt (6.0x) to LTM Sept '14 EBITDAR* 5.2 x 5.2 x Adjusted Debt (8.0x) to LTM Sept '14 EBITDAR* 6.6 x 6.5 x Lease Coverage (LTM EBITDAR* / LTM Cash Rent) 1.4 x 1.6 x * - includes $25 m of assumed synergies 23
�

2015 Strategic Focus Areas � Integrate Skilled Healthcare Group & achieve synergies. � Grow rehab therapy business, including development & expansion of outpatient service capabilities. � Continue efforts to develop & acquire skilled nursing assets in attractive markets, with emphasis on short stay only facilities. � Take steps to reduce cost of capital / fixed charges, including refinance Skilled facility real estate into HUD program. 24
�

Appendix
�
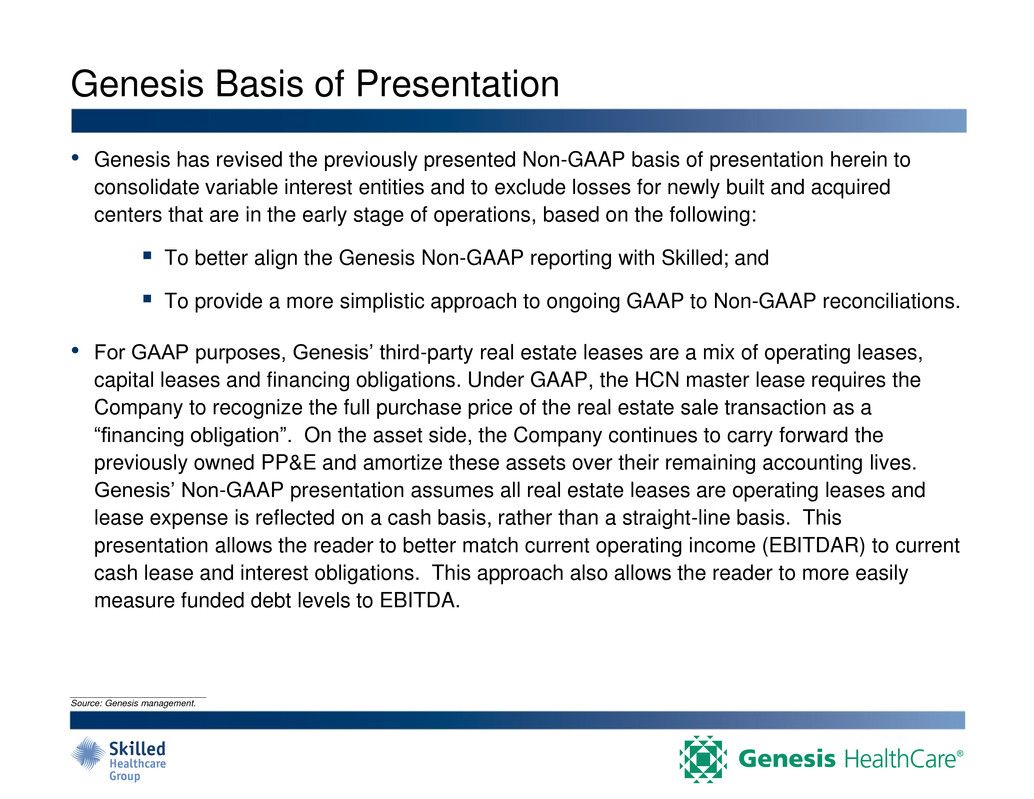
Genesis Basis of Presentation ___________________________ Source: Genesis management. " Genesis has revised the previously presented Non-GAAP basis of presentation herein to consolidate variable interest entities and to exclude losses for newly built and acquired centers that are in the early stage of operations, based on the following: � To better align the Genesis Non-GAAP reporting with Skilled; and � To provide a more simplistic approach to ongoing GAAP to Non-GAAP reconciliations. " For GAAP purposes, Genesis third-party real estate leases are a mix of operating leases, capital leases and financing obligations. Under GAAP, the HCN master lease requires the Company to recognize the full purchase price of the real estate sale transaction as a
financing obligation
. On the asset side, the Company continues to carry forward the previously owned PP&E and amortize these assets over their remaining accounting lives. Genesis Non-GAAP presentation assumes all real estate leases are operating leases and lease expense is reflected on a cash basis, rather than a straight-line basis. This presentation allows the reader to better match current operating income (EBITDAR) to current cash lease and interest obligations. This approach also allows the reader to more easily measure funded debt levels to EBITDA.
�

Genesis GAAP to Non-GAAP Accounting (contd) Reconciliation of Net Loss to Adjusted EBITDAR and EBITDA (LTM and 9 Months Ended September 30, 2014) ___________________________ Source: Genesis management. ($ in millions) 12 Months Ended 9 Months Ended Dec 31, 2013 Mar 31, 2014 Jun 30, 2014 Sep 30, 2014 Sep 30, 2014 Sep 30, 2014 Net revenues $1,188.9 $1,186.5 $1,200.7 $1,187.6 $4,763.7 $3,574.8 Expenses Salaries, wages and benefits 752.2 746.5 742.7 749.4 2,990.8 2,238.7 Other operating expenses 271.0 274.2 280.1 275.8 1,101.0 830.0 Provision for losses on accounts receivable and notes receivable 21.4 18.5 17.1 17.3 74.2 52.9 Lease expense 33.1 32.8 32.9 32.9 131.7 98.6 Depreciation and amortization expense 47.0 47.4 48.9 48.6 191.9 144.9 Accretion expense 0.1 0.1 0.1 0.1 0.3 0.2 Interest expense 108.8 108.8 109.9 112.1 439.6 330.8 Loss on early extinguishment of debt 0.3 0.5 0.2 - 1.0 0.7 Loss on asset impairment 10.0 - - - 10.0 - Investment income (2.3) (0.9) (0.4) (1.5) (5.1) (2.8) Other loss (gain) - - (0.7) 0.0 (0.6) (0.6) Transaction costs and other non-recurring charges 2.6 2.2 1.3 1.7 7.8 5.3 Equity in net (income) loss of unconsolidated affiliates 0.0 0.0 (0.4) 0.2 (0.1) (0.1) Total Expenses $1,244.1 $1,230.1 $1,231.6 $1,236.7 $4,942.5 $3,698.4 Loss before income tax expense (55.2) (43.5) (31.0) (49.1) (178.8) (123.6) Income tax benefit (1.0) (2.8) (0.1) (6.5) (10.3) (9.4) Loss from continuing operations (54.2) (40.8) (30.9) (42.6) (168.5) (114.3) Loss from discontinued operations, net of taxes (0.6) (3.2) (1.2) (1.2) (6.2) (5.6) Net loss (54.9) (44.0) (32.0) (43.8) (174.7) (119.8) Less net (income) loss attributable to noncontrolling interests (0.2) (0.2) (1.2) (1.0) (2.5) (2.3) Net loss attributable to FC-GEN Investment Operations, LLC ($55.1) ($44.2) ($33.2) ($44.8) ($177.2) ($122.1) Adjustment from loss before income tax expense to Adjusted EBITDAR: Lease expense 33.1 32.8 32.9 32.9 131.7 98.6 Depreciation and amortization expense 47.0 47.4 48.9 48.6 191.9 144.9 Accretion expense 0.1 0.1 0.1 0.1 0.3 0.2 Interest expense 108.8 108.8 109.9 112.1 439.6 330.8 Loss on early extinguishment of debt 0.3 0.5 0.2 - 1.0 0.7 Loss on asset impairment 10.0 - - - 10.0 - Other loss (gain) - - (0.7) 0.0 (0.6) (0.6) Transaction costs and other non-recurring charges 2.6 2.2 1.3 1.7 7.8 5.3 Non-recurring costs included in operation expenses 2.8 3.1 0.6 1.6 8.1 5.3 EBITDAR for new build and acquired facilities in start up phase (0.9) 0.1 0.6 1.6 1.4 2.3 Adjusted EBITDAR $148.5 $151.5 $162.8 $149.6 $612.3 $463.8 Cash basis rent (entire portfolio) (109.2) (110.3) (113.2) (113.5) (446.2) (337.0) Cash basis rent for new build and acquired facilities in start up phase 1.2 0.4 0.7 0.5 2.8 1.6 Adjusted EBITDA $40.5 $41.6 $50.2 $36.6 $168.9 $128.4 3 Months Ended
�

Genesis GAAP to Non-GAAP Accounting (contd) ___________________________ Source: Genesis management. ($ in millions) Reconciliation of Net Loss to Adjusted EBITDAR and EBITDA (FYE 2013 and 9 Months Ended September 30, 2013) 12 Months Ended 9 Months Ended Mar 31, 2013 Jun 30, 2013 Sep 30, 2013 Dec 31, 2013 Dec 31, 2013 Sep 30, 2013 Net revenues $1,173.0 $1,173.4 $1,175.2 $1,188.9 $4,710.3 $3,521.5 Expenses Salaries, wages and benefits 751.5 733.2 761.9 752.2 2,998.7 2,246.5 Other operating expenses 264.5 266.6 258.6 271.0 1,060.7 789.7 Provision for losses on accounts receivable and notes receivable 16.5 15.8 16.3 21.4 69.9 48.6 Lease expense 32.7 32.7 32.7 33.1 131.2 98.1 Depreciation and amortization expense 47.1 45.4 48.9 47.0 188.5 141.5 Accretion expense 0.1 0.1 0.1 0.1 0.3 0.2 Interest expense 105.2 105.2 107.7 108.8 427.0 318.1 Loss on early extinguishment of debt (0.2) - - 0.3 0.1 (0.2) Loss on asset impairment - - - 10.0 10.0 - Investment income (0.4) (0.5) (0.9) (2.3) (4.2) (1.9) Other loss (gain) - 0.5 (0.0) - 0.5 0.5 Transaction costs and other non-recurring charges 0.3 1.8 1.1 2.6 5.9 3.3 Equity in net (income) loss of unconsolidated affiliates (0.1) (0.1) 0.9 0.0 0.7 0.7 Total Expenses $1,217.1 $1,200.7 $1,227.3 $1,244.1 $4,889.1 $3,645.1 Loss before income tax expense (44.2) (27.3) (52.1) (55.2) (178.8) (123.6) Income tax benefit 2.7 0.6 (11.5) (1.0) (9.2) (8.2) Loss from continuing operations (46.8) (27.9) (40.6) (54.2) (169.6) (115.4) Loss from discontinued operations, net of taxes (1.6) (2.2) (2.9) (0.6) (7.4) (6.7) Net loss (48.4) (30.1) (43.5) (54.9) (177.0) (122.1) Less net (income) loss attributable to noncontrolling interests 0.3 (0.5) (0.6) (0.2) (1.0) (0.8) Net loss attributable to FC-GEN Investment Operations, LLC ($48.1) ($30.7) ($44.2) ($55.1) ($178.0) ($122.9) Adjustment from loss before income tax expense to Adjusted EBITDAR: Lease expense 32.7 32.7 32.7 33.1 131.2 98.1 Depreciation and amortization expense 47.1 45.4 48.9 47.0 188.5 141.5 Accretion expense 0.1 0.1 0.1 0.1 0.3 0.2 Interest expense 105.2 105.2 107.7 108.8 427.0 318.1 Loss on early extinguishment of debt (0.2) - - 0.3 0.1 (0.2) Loss on asset impairment - - - 10.0 10.0 - Other loss (gain) - 0.5 (0.0) - 0.5 0.5 Transaction costs and other non-recurring charges 0.3 1.8 1.1 2.6 5.9 3.3 Non-recurring costs included in operation expenses 1.7 0.1 0.5 2.8 5.2 2.4 EBITDAR for new build and acquired facilities in start up phase 1.5 (0.0) (0.5) (0.9) (0.0) 0.9 Adjusted EBITDAR $144.3 $158.5 $138.4 $148.5 $589.7 $441.2 Cash basis rent (entire portfolio) (107.1) (109.3) (109.1) (109.2) (434.6) (325.5) Cash basis rent for new build and acquired facilities in start up phase 0.7 1.7 1.2 1.2 4.7 3.5 Adjusted EBITDA $37.8 $50.8 $30.5 $40.5 $159.7 $119.2 3 Months Ended
�
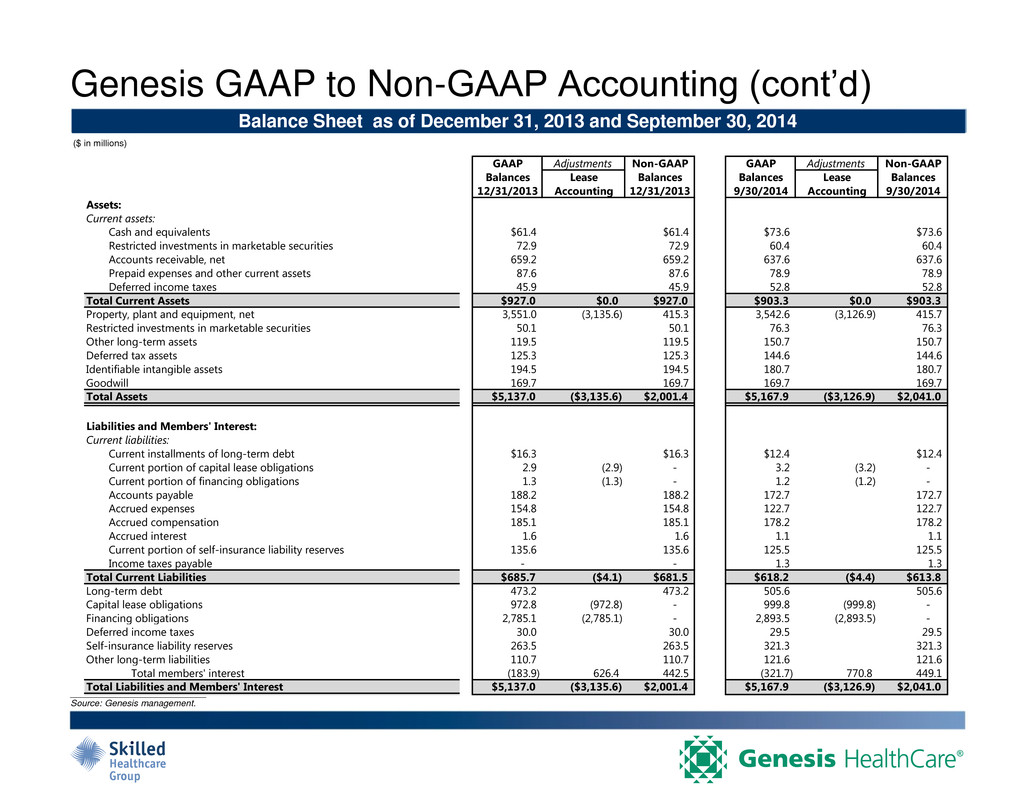
Genesis GAAP to Non-GAAP Accounting (contd) ___________________________ Source: Genesis management. Balance Sheet as of December 31, 2013 and September 30, 2014 ($ in millions) GAAP Adjustments Non-GAAP GAAP Adjustments Non-GAAP Balances Lease Balances Balances Lease Balances 12/31/2013 Accounting 12/31/2013 9/30/2014 Accounting 9/30/2014 Assets: Current assets: Cash and equivalents $61.4 $61.4 $73.6 $73.6 Restricted investments in marketable securities 72.9 72.9 60.4 60.4 Accounts receivable, net 659.2 659.2 637.6 637.6 Prepaid expenses and other current assets 87.6 87.6 78.9 78.9 Deferred income taxes 45.9 45.9 52.8 52.8 Total Current Assets $927.0 $0.0 $927.0 $903.3 $0.0 $903.3 Property, plant and equipment, net 3,551.0 (3,135.6) 415.3 3,542.6 (3,126.9) 415.7 Restricted investments in marketable securities 50.1 50.1 76.3 76.3 Other long-term assets 119.5 119.5 150.7 150.7 Deferred tax assets 125.3 125.3 144.6 144.6 Identifiable intangible assets 194.5 194.5 180.7 180.7 Goodwill 169.7 169.7 169.7 169.7 Total Assets $5,137.0 ($3,135.6) $2,001.4 $5,167.9 ($3,126.9) $2,041.0 Liabilities and Members' Interest: Current liabilities: Current installments of long-term debt $16.3 $16.3 $12.4 $12.4 Current portion of capital lease obligations 2.9 (2.9) - 3.2 (3.2) - Current portion of financing obligations 1.3 (1.3) - 1.2 (1.2) - Accounts payable 188.2 188.2 172.7 172.7 Accrued expenses 154.8 154.8 122.7 122.7 Accrued compensation 185.1 185.1 178.2 178.2 Accrued interest 1.6 1.6 1.1 1.1 Current portion of self-insurance liability reserves 135.6 135.6 125.5 125.5 Income taxes payable - - 1.3 1.3 Total Current Liabilities $685.7 ($4.1) $681.5 $618.2 ($4.4) $613.8 Long-term de t 473.2 473.2 505.6 505.6 Capital lease obligations 972.8 (972.8) - 999.8 (999.8) - Financing obligations 2,785.1 (2,785.1) - 2,893.5 (2,893.5) - Deferred income taxes 30.0 30.0 29.5 29.5 Self-insurance liability reserves 263.5 263.5 321.3 321.3 Other long-term liabilities 110.7 110.7 121.6 121.6 Total members' interest (183.9) 626.4 442.5 (321.7) 770.8 449.1 Total Liabilities and Members' Interest $5,137.0 ($3,135.6) $2,001.4 $5,167.9 ($3,126.9) $2,041.0
�

Skilled Adjusted EBITDA Reconciliation � We believe that a report of EBITDA, EBITDAR, Adjusted EBITDA and Adjusted EBITDAR provides consistency in our financial reporting and provides a basis for the comparison of results of core business operations between our current, past and future periods. EBITDA, EBITDAR, Adjusted EBITDA and Adjusted EBITDAR are primary indicators management uses for planning and forecasting in future periods, including trending and analyzing the core operating performance of our business from period-to- period without the effect of expenses, revenues and gains (losses) that are unrelated to the day-to-day performance of our consolidated and segmented business but are required to reported in accordance with accounting principles generally accepted in the United States of America ("U.S. GAAP"). We also use EBITDA, EBITDAR, Adjusted EBITDA and Adjusted EBITDAR to benchmark the performance of our consolidated and segmented business against expected results, analyzing year-over-year trends as described below and to compare our operating performance to that of our competitors. � Management uses EBITDA, EBITDAR, Adjusted EBITDA and Adjusted EBITDAR to assess the performance of our core business operations, to prepare operating budgets and to measure our performance against those budgets on a consolidated and segment level. Segment management uses these metrics to measure performance on a business unit by business unit basis. We typically use Adjusted EBITDA and Adjusted EBITDAR for these purposes on a consolidated basis as the adjustments to EBITDA and EBITDAR are not generally allocable to any individual business unit and we typically use EBITDA and EBITDAR to compare the operating performance of each skilled nursing and assisted living facility, as well as to assess the performance of our operating segments. EBITDA, EBITDAR, Adjusted EBITDA and Adjusted EBITDAR are useful in this regard because they do not include such costs as interest expense (net of interest income), income taxes, depreciation and amortization expense, rent cost of revenue (in the case of EBITDAR and Adjusted EBITDAR) and special charges, which may vary from business unit to business unit and period-to-period depending upon various factors, including the method used to finance the business, the amount of debt that we have determined to incur, whether a facility is owned or leased, the date of acquisition of a facility or business, the original purchase price of a facility or business unit or the tax law of the state in which a business unit operates. These types of charges are dependent on factors unrelated to the underlying business unit performance. As a result, we believe that the use of adjusted net income per share, EBITDA, EBITDAR, Adjusted EBITDA and Adjusted EBITDAR provides a meaningful and consistent comparison of our underlying business units between periods by eliminating certain items required by U.S. GAAP which have little or no significance to their day-to-day operations. � The use of EBITDA, EBITDAR, Adjusted EBITDA, Adjusted EBITDAR and other non-GAAP financial measures has certain limitations. Our presentation of EBITDA, EBITDAR, Adjusted EBITDA, Adjusted EBITDAR or other non-GAAP financial measures may be different from the presentation used by other companies and therefore comparability may be limited. Depreciation and amortization expense, interest expense, income taxes and other items have been and will be incurred and are not reflected in the presentation of EBITDA, EBITDAR, Adjusted EBITDA or Adjusted EBITDAR. Each of these items should also be considered in the overall evaluation of our results. Additionally, EBITDA, EBITDAR, Adjusted EBITDA, Adjusted EBITDAR do not consider capital expenditures and other investing activities and should not be considered as a measure of our liquidity. We compensate for these limitations by providing the relevant disclosure of our depreciation and amortization, interest and income taxes, capital expenditures and other items both in our reconciliations to the U.S. GAAP financial measures and in our consolidated financial statements, all of which should be considered when evaluating our performance. � EBITDA, EBITDAR, Adjusted EBITDA, Adjusted EBITDAR and certain other non-GAAP financial measures are used in addition to and in conjunction with results presented in accordance with U.S. GAAP. EBITDA, EBITDAR, Adjusted EBITDA, Adjusted EBITDAR and other non-GAAP financial measures should not be considered as an alternative to net income, operating income, or any other operating performance measure prescribed by U.S. GAAP, nor should these measures be relied upon to the exclusion of U.S. GAAP financial measures. EBITDA, EBITDAR, Adjusted EBITDA, Adjusted EBITDAR and other non-GAAP financial measures reflect additional ways of viewing our operations that we believe, when viewed with our U.S. GAAP results and the reconciliations to the corresponding U.S. GAAP financial measures, provide a more complete understanding of factors and trends affecting our business than could be obtained absent this disclosure. You are strongly encouraged to review our financial information in its entirety and not to rely on any single financial measure.
�

Skilled Adjusted EBITDA Reconciliation Reconciliation of Net Income (Loss) to Adjusted EBITDA and Adjusted EBITDAR ___________________________ 1. Amounts have been adjusted for discontinued operations. ($ in millions) Year Ended December 31, Nine Months Ended September 30, 2013 (1) 2012 2014 2013 (1) Net (loss) income ($10.5) $21.6 ($0.8) ($7.5) Interest expense, net of interest income 33.9 37.2 23.5 25.9 Provision (benefit) for income taxes (2.9) 12.9 (0.2) (3.9) Depreciation and amortization expense 23.8 23.6 18.2 17.7 EBITDA $44.3 $95.4 $40.7 $32.1 Rent cost of revenue 18.8 17.9 14.8 14.2 EBITDAR $63.1 $113.3 $55.6 $46.3 EBITDA 44.3 95.4 40.7 32.1 Change in fair value of contingent consideration (3.7) 0.8 (0.1) (2.1) Organization restructure costs 2.3 - 1.4 2.0 Exit costs related to divested facilities - - 0.4 - Losses at skilled nursing facility not at full operation - - 0.6 - Debt modification/retirement costs 2.8 4.1 0.8 1.5 Governmental investigation expense - - 6.0 - Impairment of long-lived assets 19.0 - 0.1 19.0 Closure of California home health agency 0.4 - - 0.4 Professional fees related to non-routine matters 2.8 - 7.9 2.1 Loss on disposal of assets, net of tax - - 0.1 - Loss from discontinued operations, net of tax 4.3 0.8 - 0.7 Adjusted EBITDA $72.3 $101.1 $57.9 $55.8 Rent cost of revenue 18.8 17.9 14.8 14.2 Adjusted EBITDAR $91.1 $119.1 $72.8 $69.9
�
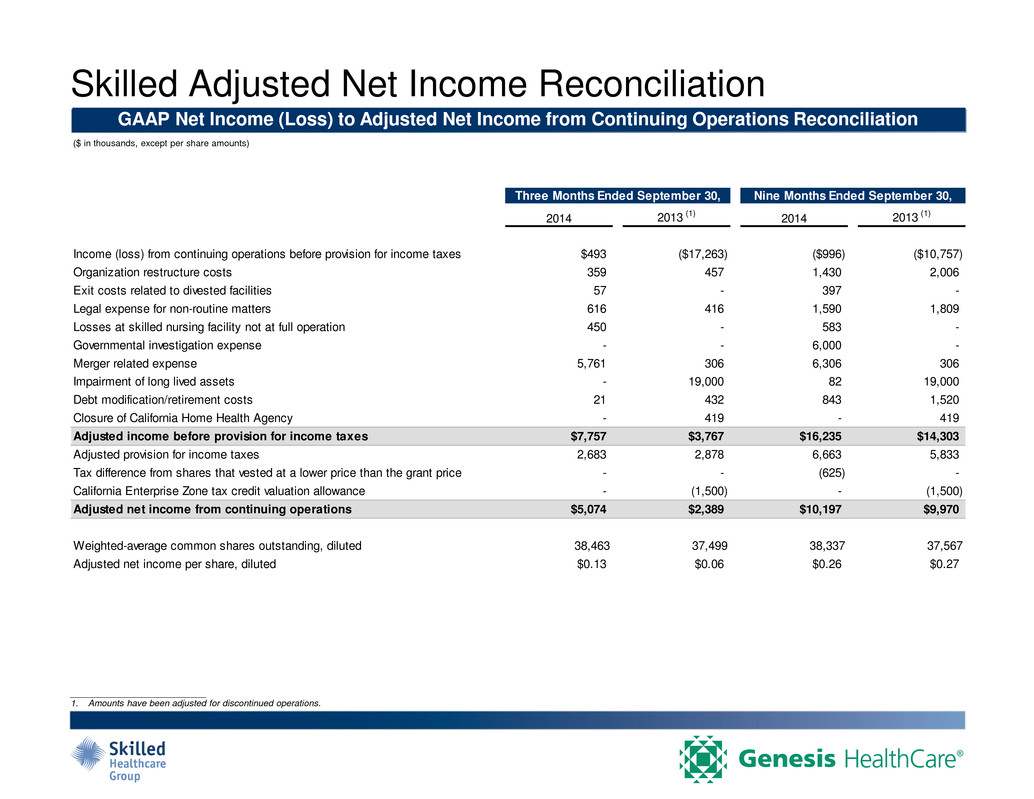
Skilled Adjusted Net Income Reconciliation GAAP Net Income (Loss) to Adjusted Net Income from Continuing Operations Reconciliation ___________________________ 1. Amounts have been adjusted for discontinued operations. ($ in thousands, except per share amounts) Three Months Ended September 30, Nine Months Ended September 30, 2014 2013 (1) 2014 2013 (1) Income (loss) from continuing operations before provision for income taxes $493 ($17,263) ($996) ($10,757) Organization restructure costs 359 457 1,430 2,006 Exit costs related to divested facilities 57 - 397 - Legal expense for non-routine matters 616 416 1,590 1,809 Losses at skilled nursing facility not at full operation 450 - 583 - Governmental investigation expense - - 6,000 - Merger related expense 5,761 306 6,306 306 Impairment of long lived assets - 19,000 82 19,000 Debt modification/retirement costs 21 432 843 1,520 Closure of California Home Health Agency - 419 - 419 Adjusted income before provision for income taxes $7,757 $3,767 $16,235 $14,303 Adjusted provision for income taxes 2,683 2,878 6,663 5,833 Tax differe ce from shares that vested at a lower price than the grant price - - (625) - California Enterprise Zone tax credit valuation allowance - (1,500) - (1,500) Adjusted net income from continuing operations $5,074 $2,389 $10,197 $9,970 Weighted-average common shares outstanding, diluted 38,463 37,499 38,337 37,567 Adjusted net income per share, diluted $0.13 $0.06 $0.26 $0.27
�
Serious News for Serious Traders! Try StreetInsider.com Premium Free!
You May Also Be Interested In
- Suzano Ventures invests up to US$5 million into Bioform Technologies to further develop bio-based plastic alternatives
- WOO X Lists $CKB on its Spot Market
- Palliser Capital Proposes Advisory Resolution to Give Shareholders a Voice at Keisei’s Forthcoming AGM
Create E-mail Alert Related Categories
SEC FilingsSign up for StreetInsider Free!
Receive full access to all new and archived articles, unlimited portfolio tracking, e-mail alerts, custom newswires and RSS feeds - and more!


 Tweet
Tweet Share
Share