Form 8-K Sensata Technologies For: Feb 24
UNITED STATES
SECURITIES AND EXCHANGE COMMISSION
WASHINGTON, D.C. 20549
__________________________________________
FORM 8-K
CURRENT REPORT
Pursuant to Section 13 or 15(d) of the
Securities Exchange Act of 1934
Date of Report (Date of earliest event reported): February 24, 2015
__________________________________________
SENSATA TECHNOLOGIES HOLDING N.V.
(Exact name of Registrant as specified in its charter)
__________________________________________
The Netherlands | 001-34652 | 98-0641254 | ||
(State or other jurisdiction of incorporation) | (Commission File Number) | (IRS Employer Identification No.) | ||
Kolthofsingel 8, 7602 EM Almelo
The Netherlands
(Address of Principal executive offices, including Zip Code)
31-546-879-555
(Registrant's telephone number, including area code)
(Former name or former address, if changed since last report)
__________________________________________
Check the appropriate box below if the Form 8-K filing is intended to simultaneously satisfy the filing obligation of the registrant under any of the following provisions:
o | Written communications pursuant to Rule 425 under the Securities Act (17 CFR 230.425) |
o | Soliciting material pursuant to Rule 14a-12 under the Exchange Act (17 CFR 240.14a-12) |
o | Pre-commencement communications pursuant to Rule 14d-2(b) under the Exchange Act (17 CFR 240.14d-2(b)) |
o | Pre-commencement communications pursuant to Rule 13e-4(c) under the Exchange Act (17 CFR 240.13e-4(c)) |
2
Item 7.01 | Regulation FD Disclosure |
Sensata Technologies Holding N.V. (the “Company”), will hold an Investor Event at the Company’s U.S. headquarters in Attleboro, Massachusetts on Tuesday, February 24, 2015. The Company’s prepared presentation is scheduled to be webcast live beginning at approximately 12:30 p.m. Eastern Time. Copies of the presentation slides containing financial and operating information, including information relating to the Company’s outlook for 2015, are attached as Exhibit 99.1 to this Current Report and are incorporated by reference herein.
The webcast can be accessed through a link on the investor relations page of the Company’s website at http://www.sensata.com. Investors are advised to log on to the website at least 15 minutes prior to the start of the webcast to allow sufficient time for downloading any necessary software. A replay of the webcast will also be available from the website following the conclusion of the live event.
The information contained in, or incorporated into, this Item 7.01, including Exhibit 99.1 attached hereto, is being furnished and shall not be deemed “filed” for purposes of Section 18 of the Securities Exchange Act of 1934, as amended (the “Exchange Act”), or otherwise subject to the liabilities under that section, nor shall it be incorporated by reference into any registration statement or other filing under the Securities Act of 1933, as amended, or the Exchange Act, except as shall be expressly set forth by specific reference. This report shall not be deemed an admission as to the materiality of any information in this report that is being disclosed pursuant to Regulation FD.
Item 9.01 | Financial Statements and Exhibits. |
(d) Exhibits
99.1 | February 24, 2015 investor event presentation | |
3
SIGNATURES
Pursuant to the requirements of the Securities Exchange Act of 1934, the registrant has duly caused this report to be signed on its behalf by the undersigned hereunto duly authorized.
SENSATA TECHNOLOGIES HOLDING N.V. | ||||
/s/ Paul Vasington | ||||
Date: February 24, 2015 | Name: Paul Vasington | |||
Title: Executive Vice President and Chief Financial Officer | ||||
4
EXHIBIT INDEX
Exhibit No. | Description | |
99.1 | February 24, 2015 investor event presentation | |
5

1 February 2015 Investor Event SENSATA TECHNOLOGIES INVESTOR EVENT FEBRUARY 2015

INTRODUCTION FEBRUARY 2015 2 February 2015 Investor Event JACOB SAYER, VP TREASURY & INVESTOR RELATIONS
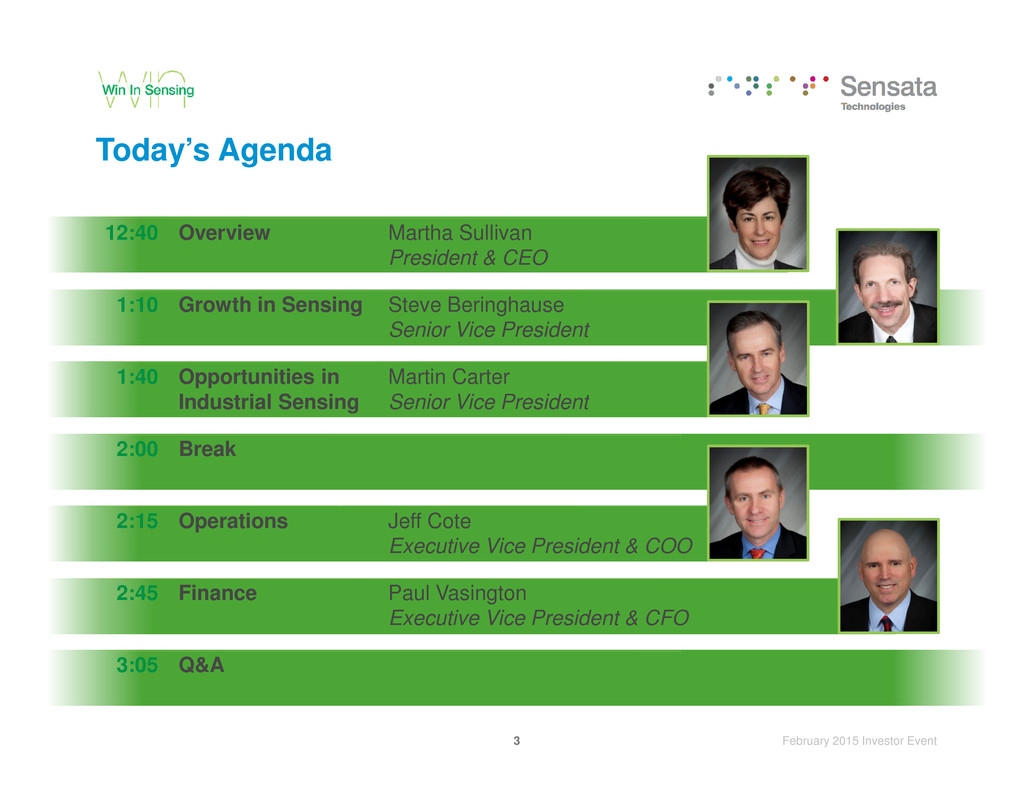
Today’s Agenda 12:40 Overview Martha Sullivan President & CEO 1:10 Growth in Sensing Steve Beringhause Senior Vice President 1:40 Opportunities in Industrial Sensing Martin Carter Senior Vice President 3 February 2015 Investor Event 2:00 Break 2:15 Operations Jeff Cote Executive Vice President & COO 2:45 Finance Paul Vasington Executive Vice President & CFO 3:05 Q&A

This presentation contains certain forward–looking statements that involve risks or uncertainties. For example, statements regarding financial guidance and product development goals are forward–looking. The Company’s future results may differ materially from the projections described in today’s discussion. Factors that might cause these differences include, but are not limited to, the risk factors described in Forward–Looking Statements 4 February 2015 Investor Event the Company’s Form 10–K, Form 10–Q and Form 8–K filings. Copies of all the Company’s filings are available from the Investor Relations section of our website, www.sensata.com, and from the SEC.

OVERVIEW FEBRUARY 2015 5 February 2015 Investor Event MARTHA SULLIVAN, PRESIDENT & CEO

Sensata Investment Highlights checkbld Innovative products designed for mission–critical, hard–to–do applications checkbld Custom solutions in high–value systems are sole-sourced leading to sticky, recurring revenue checkbld Collaborative, long–term relationships with diversified OEM customers Leading Position IN SENSING WE WIN IN Sensing checkbld Large, fast–growing sensing markets are driven by safety, clean environment, efficiency checkbld Solutions enabled by proliferation of embedded closed–loop systems requiring smart sensors 6 February 2015 Investor Event checkbld Revenue grows at double–digit long–term compound annual rate • Organic revenue grows at high single-digit pace, faster than markets due to content growth • M&A is core pillar of Sensata’s growth checkbld Earnings grow faster than revenue over time DOUBLE DIGIT Revenue & Earnings CAGRs checkbld Long–cycle revenue, low-cost consolidated supply chain, premium margins, attractive tax position, low capital intensity all lead to strong cash flows checkbld Capital can be used to create shareholder value through R&D, Capital Expenditures, share repurchases and to fund expansion through M&A LEADING MARGINS, STRONG Cash Generation checkbld Sensata has a successful track record of creating significant value through M&A checkbld Significant opportunities exist to continue to extend our footprint inorganically into $8B–$9B of adjacent, addressable markets SUCCESSFUL RECORD OF Acquisitions

$45.00 $55.00 Sensata Delivers High Shareholder Returns TSR from IPO CAGR (S&P: 13%) 24% 2014 TSR 35% 2014 ROIC 15.0% 7 February 2015 Investor Event $15.00 $25.00 $35.00 ST Volume ST S&P 500 Acquired Revenue 2014 RUN RATE $1 ACCRETION AFTER INTEGRATION$800M Cash Returned 2012–2014 7.5% OF SHARES REPURCHASED$500M

Automotive Machinery We are Expanding Our Large Addressable Markets GLOBAL MARKETS TOTAL MARKET: $95B OUR END MARKETS AND TECHNOLOGIES IN US $ MILLIONS $1,300 $2,000 $3,200 Motor / Power Protection Speed Sensing Temperature Sensing Position Sensing 8 February 2015 Investor Event Construction Process Aircraft / Ship Consumer Goods Medical Other SOURCE: BCC (July 2014) and Company estimates $8,100 $3,400 7% CAGR EXPECTED FUTURE Pressure Sensing 2015 $18.0B $1,200 $1,000 $2,300 $600 $1,350 2011 $6.5B

Premature deaths Societal Imperatives Drive Markets Regulatory requirements and economic forces drive sensor adoption CLEAN ENVIRONMENT Reduce emissions in air and water EFFICIENCY 9 February 2015 Investor Event from vehicle exhaust1 1 International Council on Clean Transportation More efficiently use fossil fuels, increase productivity SAFETY Reduce loss of life, injury, accidents
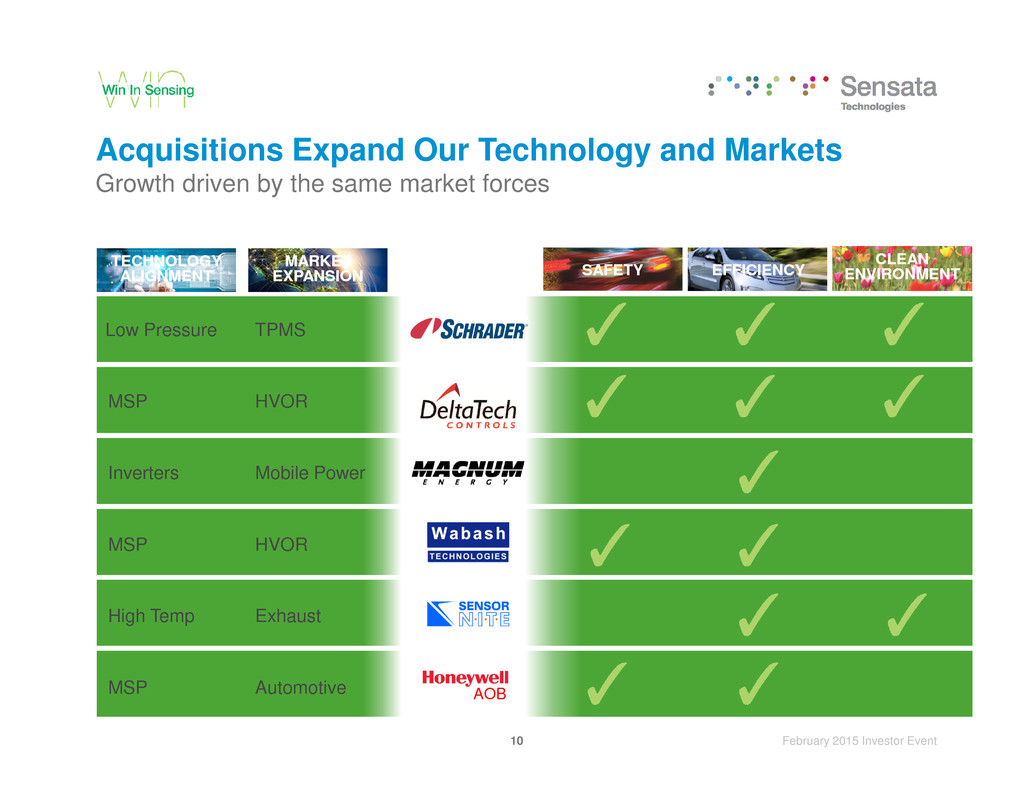
Acquisitions Expand Our Technology and Markets Growth driven by the same market forces CLEAN ENVIRONMENTEFFICIENCY SAFETY MARKET EXPANSION TECHNOLOGY ALIGNMENT TPMS HVOR Low Pressure MSP 10 February 2015 Investor Event AOB Mobile Power HVOR Exhaust Automotive Inverters MSP High Temp MSP

Technology Evolution Enables Ongoing Improvement Proliferation of closed–loop control systems require smart sensing Value–creating automotive trends now migrating to industrial end markets AUTOMOTIVE / HVOR Basic Braking On / Off Pumps Fixed Drives, Valve Train Anti–lock Braking > Electronic Stability Control Continuously Variable Outputs Load Management AUTOMOTIVE / HVOR 11 February 2015 Investor Event CONTINUOUS SYSTEM IMPROVEMENTS drive the adoption of closed–loop systems (requiring sensing capabilities) and faster–than–market secular growth for Sensata SMARTER HVAC Fixed Compressors Expansion Valves Variable Refrigerant Flow Single Speed On / Off Pumps Variable Speed Pumps for Advanced Fluid Management INDUSTRIAL HVAC INDUSTRIAL
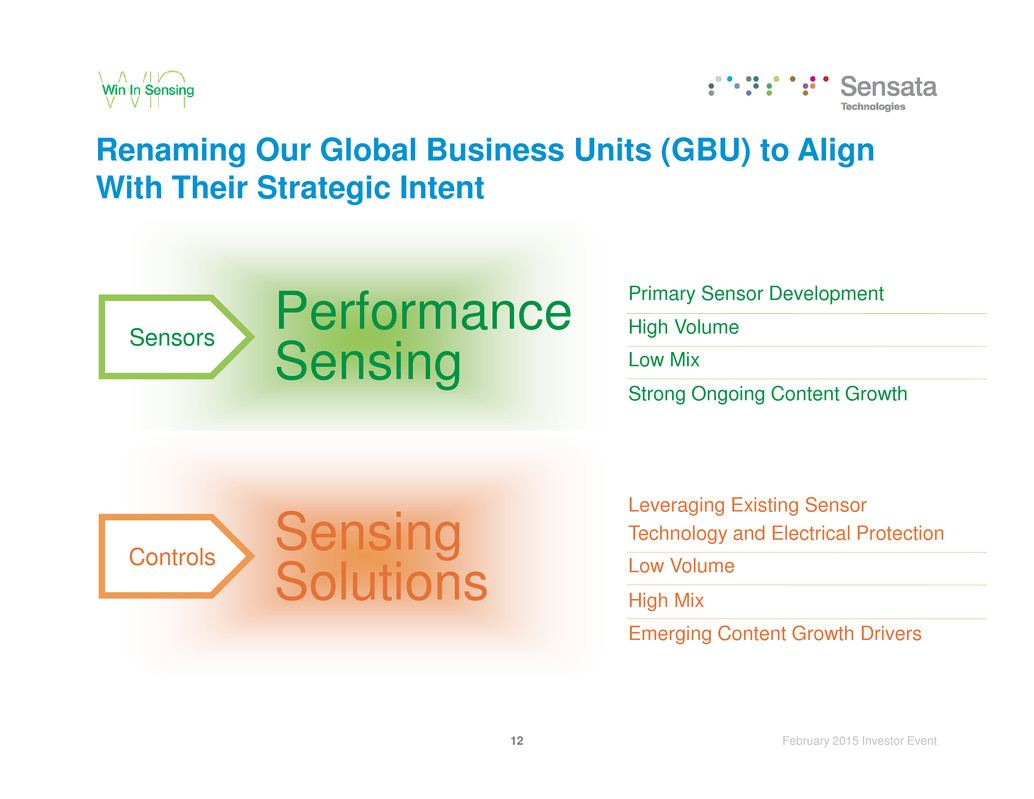
Renaming Our Global Business Units (GBU) to Align With Their Strategic Intent Sensors PerformanceSensing Primary Sensor Development High Volume Low Mix Strong Ongoing Content Growth 12 February 2015 Investor Event Sensing SolutionsControls Leveraging Existing Sensor Technology and Electrical Protection Low Volume High Mix Emerging Content Growth Drivers

Sensata Grows Organically at High Single–digits Content growth drives consistent above market revenue growth Organic Growth 10.3% Content growth can be variable due to economic backdrop, timing of product launches, timing of regulation 13 February 2015 Investor Event SENSATA PRODUCES ATTRACTIVE ORGANIC REVENUE GROWTH 2005–2014 10 YR 2010–2014 5 YR 2015E 5.4% 6.0% Acquisitions increase that variability (Schrader growth closely tied to regulation) 1 2015E represents mid–point of guidance given February 2015 1

Sensata Grows Revenue Double-digits All–in With acquisitions revenue and earnings grow at double–digit CAGRs $1,540 $3,065 Revenue $Millions $1.77 $2.92 ANI / Share 14 February 2015 Investor Event 1 2015E represents mid–point of guidance given February 2015 2 Assumes 2011 diluted share count to calculate ANI / share ORGANIC REVENUE grows faster than market due to increasing content; including acquisitions, Sensata achieves long–term double–digit revenue and earnings CAGRs 10–YEAR CAGR : 11% $1,061 2005 2010 2015E 10–YEAR CAGR : 14% $0.81 2005 2010 2015E21 1
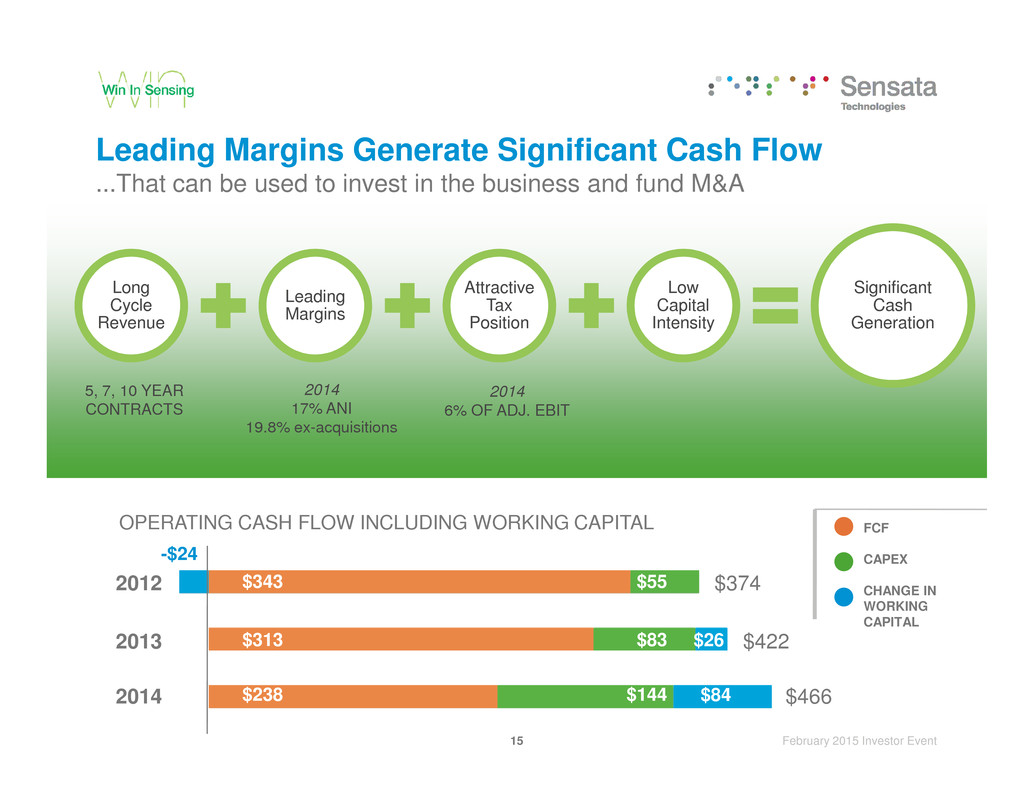
Long Cycle Revenue Leading Margins Attractive Tax Position Low Capital Intensity Significant Cash Generation Leading Margins Generate Significant Cash Flow ...That can be used to invest in the business and fund M&A 5, 7, 10 YEAR 2014 2014 15 February 2015 Investor Event 2012 $343 2013 $313 2014 $238 $55 $83 $144 $26 $84 -$24 $374 $422 $466 OPERATING CASH FLOW INCLUDING WORKING CAPITAL FCF CAPEX CHANGE IN WORKING CAPITAL CONTRACTS 17% ANI 19.8% ex-acquisitions 6% OF ADJ. EBIT

Sensata Invests in Acquired Products and Technologies Creating value in acquisitions through product expansion Repositioning portfolios for growth NEW HIGH TEMPERATURE SENSORS 1 CREATING A PLATFORM FOR GROWTH IN MAGNETIC SENSING checkbld More robust designs 16 February 2015 Investor Event AOB $135M Net Revenue $75M Net Revenue $125M Net Revenue Acquisition +$360M magnetic sensing portfolio in 2015 growing high single digits checkbld Scalable, customizable checkbld Higher margin than predecessors

Sensata Globalizes Acquired Companies Creating value in acquisitions through market expansion Globalization TPMS EXPANSION 2 17 February 2015 Investor Event Future manufacturing line in Changzhou to support growth of business, especially in China Acquisition Expanding from Germany to three continents led to 11% compound annual revenue growth

Sensata Captures Synergies From Acquisitions Creating value in acquisitions through cost synergies Back–end savings and synergies LEVERAGE COMMONALITIES 3 AOB 18 February 2015 Investor Event Common ERP system, back–office processes, and sales infrastructure Moving manufacturing to best cost locations and leveraging a single supply chain improved gross margins by 80% ADDITIONAL $8B–$9B of adjacent, attractive markets are available to Sensata through M&AAcquisition

PERFORMANCE SENSING FEBRUARY 2015 19 February 2015 Investor Event STEVE BERINGHAUSE, SVP
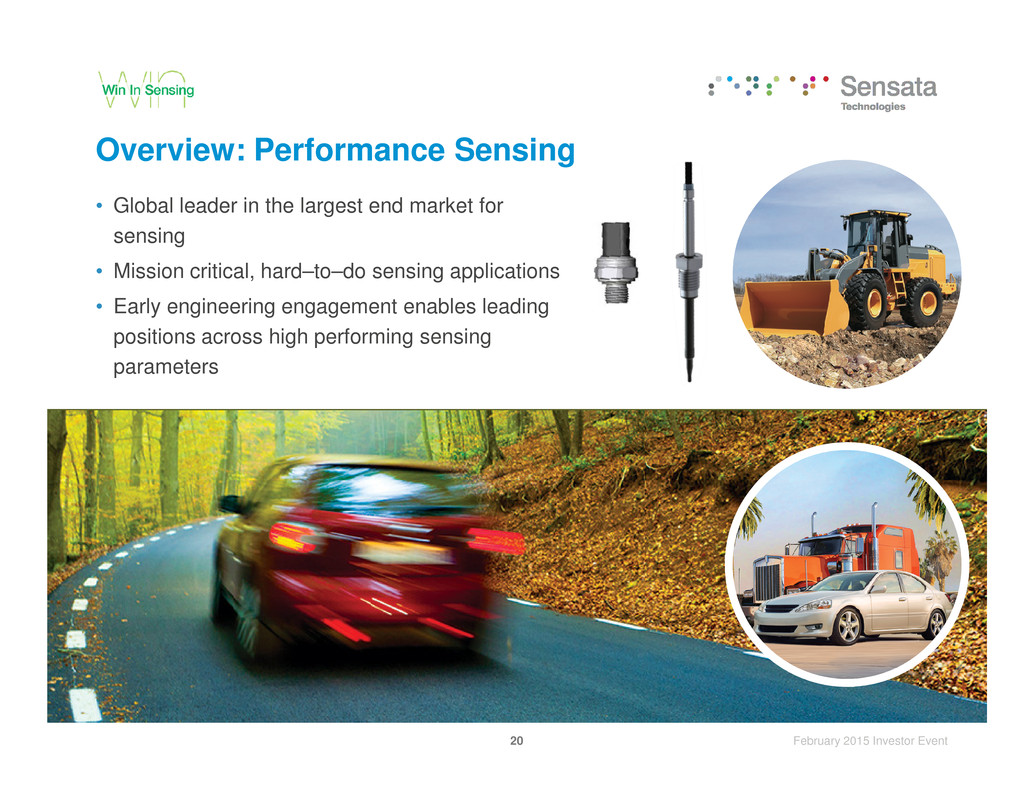
Overview: Performance Sensing • Global leader in the largest end market for sensing • Mission critical, hard–to–do sensing applications • Early engineering engagement enables leading positions across high performing sensing parameters 20 February 2015 Investor Event
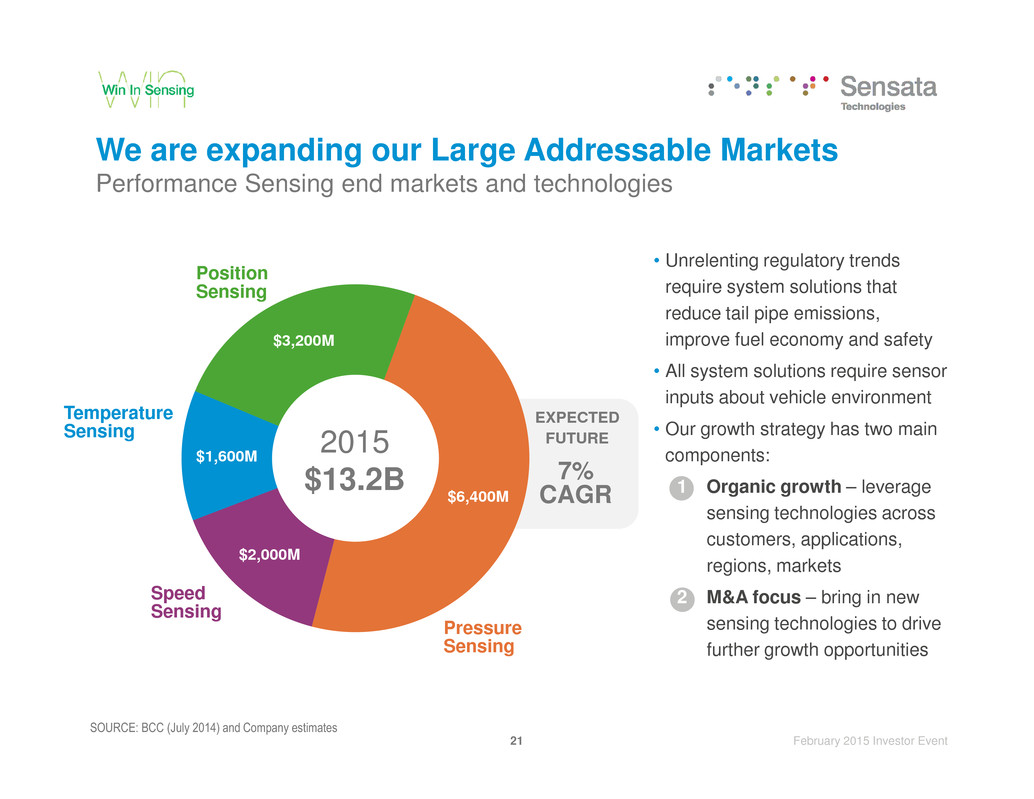
$3,200M Position Sensing • Unrelenting regulatory trends require system solutions that reduce tail pipe emissions, improve fuel economy and safety • All system solutions require sensor inputs about vehicle environment We are expanding our Large Addressable Markets Performance Sensing end markets and technologies 21 February 2015 Investor Event $6,400M $2,000M $1,600M 7% CAGR EXPECTED FUTURE Speed Sensing Temperature Sensing Pressure Sensing 2015 $13.2B SOURCE: BCC (July 2014) and Company estimates • Our growth strategy has two main components: 1 Organic growth – leverage sensing technologies across customers, applications, regions, markets 2 M&A focus – bring in new sensing technologies to drive further growth opportunities

Exhaust checkbld Exhaust Temperature Cabin Comfort checkbld Air Conditioning Pressure checkbld Air Classification / Quality checkbld Humidity checkbld Solar / Twilight Sensor o Air Conditioning Temperature o Rain Engine checkbld Gasoline Direct Injection Pressure checkbld Common Rail Diesel Pressure checkbld Returnless Fuel Pressure checkbld Cylinder Pressure checkbld Throttle Valve Position checkbld EGR Valve Position checkbld Oil Pressure checkbld Air Intake Pressure checkbld Cam / Crank Position / Speed checkbld Turbo Valve Position Sensata Provides Sensors to Mission Critical Auto Systems 22 February 2015 Investor Event Transmission checkbld Clutch Actuation Pressure checkbld Clutch Pedal Position checkbld Line Pressure checkbld Continuous Variable Pulley Pressure checkbld Gear Position checkbld Input / Output Speed o Torque checkbld Particle Filter Pressure checkbld Urea Pressure o Urea Level o NOx Gas o Oxygen checkbld Turbo Speed o Fuel Tank Pressure o Knock Acceleration o Barometric Passive Safety checkbld Occupant Detection o Fuel Cut Off o Airbag Silicon Active Safety (Brake) checkbld Brake Pressure (ESC) checkbld Vacuum Boost Pressure checkbld Wheel Speed o Force Sensor (EHC) o Camera (External) o Ultrasonic o Brake Pedal Position o Yaw o Brake Acceleration Chassis checkbld Suspension Pressure checkbld Tire Pressure Monitoring Systems (TPMS) checkbld Pedal Position o Chassis Height Position o Steering Position o Seat Position checkbldCURRENT o POTENTIAL

Development of a Sensor 23 February 2015 Investor Event checkbldAcross Customers checkbldAcross Geographies checkbldAcross Applications

What Does Sensata Mean for Gasoline Engines? 24 February 2015 Investor Event SOURCE: Dr. Sung Hwan Cho, President, Hyundai America Technical Center, Superior Township, MI, USA; 35th International Vienna Engine symposium 2014
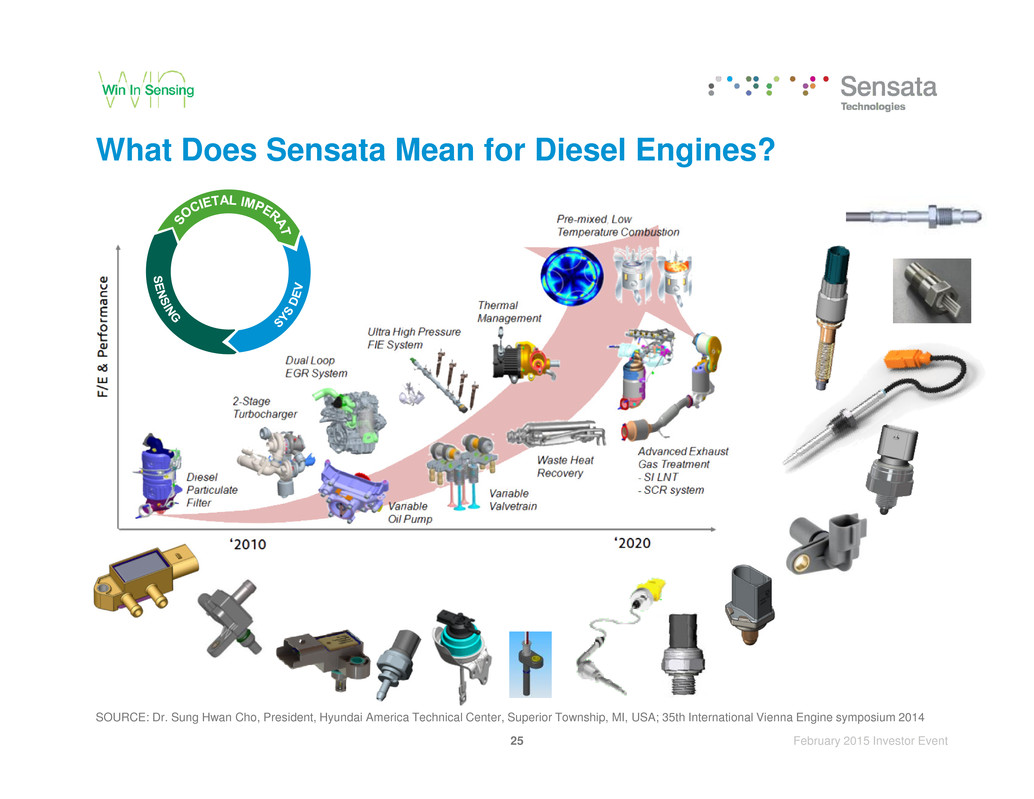
What Does Sensata Mean for Diesel Engines? 25 February 2015 Investor Event SOURCE: Dr. Sung Hwan Cho, President, Hyundai America Technical Center, Superior Township, MI, USA; 35th International Vienna Engine symposium 2014

What Does Schrader Mean to Sensata? Enhances Position in Safety Systems checkbldVehicle Stability Control P checkbldWheel Speed Expands Capabilities checkbldMEMS manufacturing, scale checkbldASIC and sense element design 26 February 2015 Investor Event checkbldPedal Position checkbldBrake Booster Vacuum P checkbldTPMS checkbldWireless design checkbldCURRENT o POTENTIAL checkbldAir Intake P checkbldVacuum P o Fuel Tank P

• Downsized engine increases fuel economy; adding turbo maintains engine performance • Sensor allows the system to drive the turbo closer to its design limits compared with indirect control Turbo Speed Sensor Opportunity Direct speed measurement 27 February 2015 Investor Event • Small engine and turbo with the power of a big one

First customer launch with DPF for diesel passenger car First gasoline particle filters planned European politics 100% diesel installation 2000–200 EU3 2000–2006 EU 4 2005–2010 US 07 2007–2009 EU 5 2009–2015 EU6b 2014–2018 EU6c 2017–2022? Opportunity for Gasoline Particulate Filter Differential Pressure Sensor 28 February 2015 Investor Event DPS Gen 1 RPS DPS Gen 2 DPS for GPF RPS Gen 2 for GPF HCM (HP EGR) stimulated incentives Use on low pressure EGR Differential Relative Pressure Sensor (DPF + LP EGR)
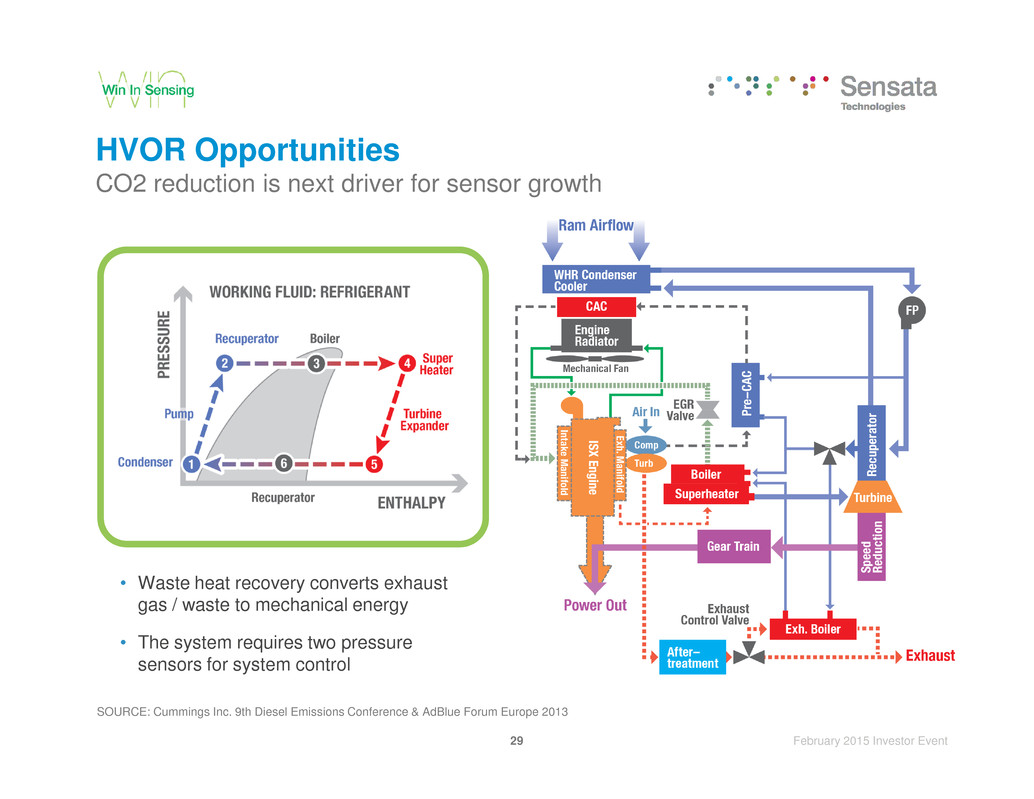
HVOR Opportunities CO2 reduction is next driver for sensor growth 29 February 2015 Investor Event SOURCE: Cummings Inc. 9th Diesel Emissions Conference & AdBlue Forum Europe 2013 • Waste heat recovery converts exhaust gas / waste to mechanical energy • The system requires two pressure sensors for system control

China: System Penetration Increase Drives Growth System 2015 Installed System IN CHINA 2019 Installed System IN CHINA 2015 Mature Market Sensor Controlled A/C Systems 55% 60% 95% Electronic Stability Control 30% 45% 100% 30 February 2015 Investor Event Tire Pressure Monitoring 10% 40 - 100% 100% Common Rail 40% 90% 100% Diesel Exhaust Treatment LV: 25%HV: 35% LV: 80% HV: 100% 100% 100%

Competitive Strategies to Win Competitor Typical Strategy Weakness Sensata Strategy Large multinational • System suppliers (Bosch / Denso) • Technology drivers with standard high–volume process • Sensors represent small portion of overall business • Less flexibility with design, process checkbldHigher level of service checkbldGreater flexibility checkbldCustom design solutions checkbld Low–cost manufacturing 31 February 2015 Investor Event • High–cost manufacturing (i.e., Germany, Japan) • Competitiveness footprint Small regional/new entrants • Local relationships • Responsiveness • Commercial incentives • Competitiveness • Limited global reach checkbld Financial strength checkbldCost advantage via scale checkbldR&D / Development checkbld Technical depth checkbldGlobal support checkbld Local support in country

Summary • As vehicles get safer, cleaner, and more efficient they require more sensors • Manufacturers are risk–averse and depend on partners they can trust, like Sensata • Our engineers engage early and provide mission critical high performing solutions built into complex systems 32 February 2015 Investor Event
FEBRUARY 2015 SENSING SOLUTIONS 33 February 2015 Investor Event MARTIN CARTER, SVP

Sensing Solutions Overview • Global leader in mature and emerging markets • Critical “must work” products driven by safety and energy mandates • Successful high mix / low volume and multi–market global business model • Well positioned with leading OEMs and innovators 34 February 2015 Investor Event INDUSTRIAL AEROSPACE NETWORKING & MOBILE POWER APPLIANCE & HVAC

3 Successfully Executing on Three Platforms 2 SALES checkbldLeading technology with scale checkbld Incumbency with leading OEMs and innovators checkbld INDUSTRIAL ELECTRONIC SENSING 35 February 2015 Investor Event 2015 INDUSTRIAL ELECTRO–MECHANICAL EMERGING MARKETS INDUSTRIAL ELECTRONIC SENSING 1 2 31 YEAR Global high mix / low volume business model

Successfully Executing on Three Platforms 2 3SALES checkbldGlobal leader 10x its nearest competitor checkbld In mission critical applications checkbldLow percentage of INDUSTRIAL ELECTRO–MECHANICAL 36 February 2015 Investor Event 2015 YEAR INDUSTRIAL ELECTRO–MECHANICAL EMERGING MARKETS INDUSTRIAL ELECTRONIC SENSING 1 21 3 systems cost checkbldMass customization, over 60 product families with >12,000 variants checkbldBuilt out organization and supply chain checkbldLeverage opportunity for new markets and applications EMERGING MARKETS
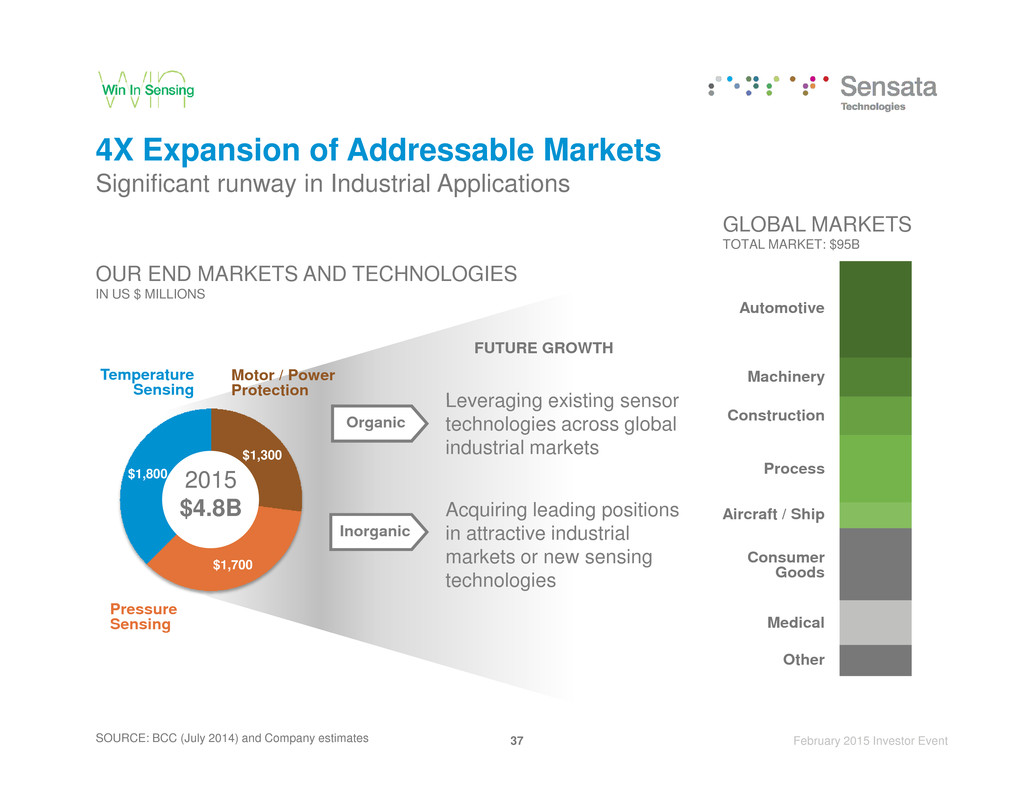
4X Expansion of Addressable Markets Significant runway in Industrial Applications Automotive Machinery GLOBAL MARKETS TOTAL MARKET: $95B OUR END MARKETS AND TECHNOLOGIES IN US $ MILLIONS Temperature Sensing Motor / Power Protection FUTURE GROWTH Leveraging existing sensor 37 February 2015 Investor Event Construction Process Aircraft / Ship Consumer Goods Medical Other SOURCE: BCC (July 2014) and Company estimates Pressure Sensing $1,300 $1,700 $1,800 2015 $4.8B Inorganic Organic technologies across global industrial markets Acquiring leading positions in attractive industrial markets or new sensing technologies

Auto Technologies Support Industrial Needs Proliferation of closed–loop control systems require smart sensing Value–creating automotive trends now migrating to industrial end markets AUTOMOTIVE / HVORAUTOMOTIVE / HVOR 38 February 2015 Investor Event CONTINUOUS SYSTEM IMPROVEMENTS drive the adoption of closed–loop systems (requiring sensing capabilities) and faster–than–market secular growth for Sensata SMARTER HVAC Continuous HVAC/R Systems Pressure / Temp. Switches On–demand HVAC/R Systems Pressure / Temp. Sensors Single Speed On/Off Pumps Pressure Switches Variable Speed Pumps Advanced Fluid Mgmt Pressure Sensors INDUSTRIAL HVAC INDUSTRIAL

Macro Needs Enable Content Growth in Industrial Markets Food Safety > Cold Chain Deployment Monitoring, Redundancy > Pumps, Gas Tanks Safety Energy > 39 February 2015 Investor Event Green Energy Sources > Solar & Wind Natural Refrigerants > Ammonia, CO2, and HC Clean Environment Variable Load Motor Systems Productivity > Industrial Machinery Efficiency 20/20/20

5:1 RATIO OF COLD STORAGE CAPACITY PER PERSON, DEVELOPED VS. DEVEOPING COUNTRIES 200M1 Safety Environment Cold Chain Deployment a Critical Priority Refrigerated transport and storage preserves food from field to fork 3 EXAMPLE METRIC TONS OF FOOD COULD BE PRESERVED2 40 February 2015 Investor Event ADOPTION ACCELERATING Current Sensata Content Refrigeration Market Systems: Storage, Trailer Reefers Content: Pressure, Temperature Future Market Entry Points Example: Agriculture, Medical UP TO $50 IN CONTENT Systems: Precision Farming, Tank Management SOURCE: 1 International Association of Refrigerated Warehouses Capacity Report 2010, 2014; Population by country from The World Bank; Company Estimates 2 “Feeding a Hungry World: The role of the global cold chain”, United Technologies Building & Industrial Systems, 2014 3 thedailystar.net

45% OF THE GLOBAL ELECTRICITY IS CONSUMED BY ELECTRIC MOTOR– DRIVEN SYSTEMS 50% OPTIMIZATION DRIVES UP TO IN ENERGY SAVINGS 2 1 Efficiency Environment The Largest New Source of Energy Is Efficiency Early stage adoption of variable load systems EXAMPLE 41 February 2015 Investor Event ADOPTION ACCELERATING Current Sensata Content HVAC Market (REGULATION DRIVES ADOPTION) Systems: Variable Refrigerant Flow, Variable Speed Pumps, Fans, Compressors Content: Pressure, Temperature Future Market Entry Points Example: Discrete Equipment, Oil & Gas, Water VARIABLE LOAD SYSTEMS WITH 4X THE SENSING CONTENT OF FIXED Systems: Storage Tanks, Artificial Lifts SOURCE: 1 Paul Waide, Conrad U. Brunner, Martin Jakob, et al.: Energy efficiency policy opportunities for electric motor-driven systems, IEA Energy Series, Paris France: 2011 2 Kreith, Frank and D.Yogi Goswami. (2007). Handbook of energy efficiency and renewable energy: CRC Press

Competitive Advantages Typical Strategy • Industrial system suppliers • Various sensing parameters offering • Global support • High service level • Regional support • Custom design solutions • Niche market expertise Competitor Diverse Global Industrial Regional 42 February 2015 Investor Event Sensata Strategy checkbldHigher service level checkbld Large scale sensor supplier checkbldCustom design solutions (engineer to engineer) checkbld Auto quality standards checkbld Technical depth / R&D checkbld Low cost checkbld Local support in country checkbldGlobal support checkbld Auto quality standards Weakness • Sensors represent a small portion of overall business • Lack of sensing scale • Industrial quality standards • High cost • Limited global reach • Industrial quality standards

A Unique Business Model MIX INDUSTRIAL VOLUME PERFORMANCE SENSING Technology with Scale Technology, Scale & Supply Chain Technology with Scale Channels & Customers checkbldAutomotive Volume checkbld Innovation checkbldCost WIN checkbldLeaders checkbldLong–lasting checkbldBroad Industrial Channels 43 February 2015 Investor Event SENSING SOLUTIONS High Mix / Low Volume; >12,000 Variants Leading OEMs in Diverse Markets Supply Chain checkbldGlobal checkbldHigh Mix / Low Volume checkbldEfficient

Sensing Solutions in Summary • Safety, Efficiency, and Environmental concerns are driving significant discontinuities in industrial markets • A well established, global, and leading electrical protection business • A unique business model drives new sensing growth: technology with scale, incumbency in channels and customers, and an efficient global supply chain • Parallel deployment of organic and inorganic strategies accelerate growth in addressable markets 44 February 2015 Investor Event

Short Break 45 February 2015 Investor Event

45 February 2015 Investor Event SENSATA TECHNOLOGIES INVESTOR EVENT FEBRUARY 2015

GLOBAL OPERATIONS FEBRUARY 2015 46 February 2015 Investor Event JEFF COTE, COO
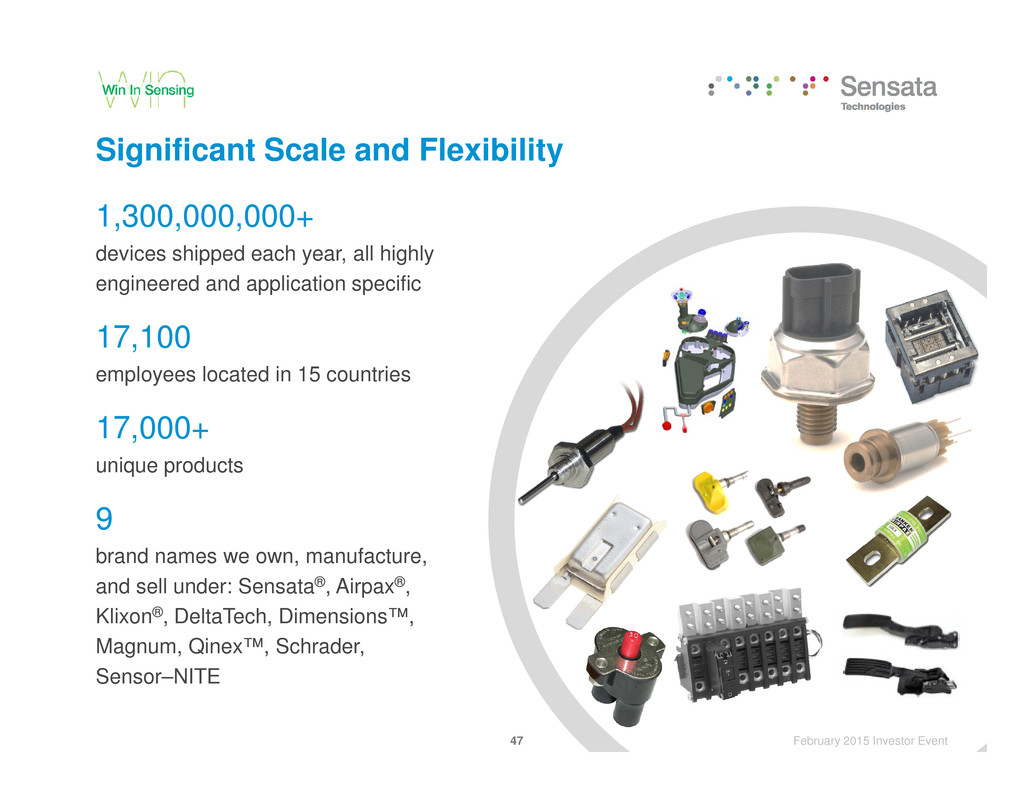
1,300,000,000+ devices shipped each year, all highly engineered and application specific 17,100 employees located in 15 countries Significant Scale and Flexibility 47 February 2015 Investor Event 17,000+ unique products 9 brand names we own, manufacture, and sell under: Sensata®, Airpax®, Klixon®, DeltaTech, Dimensions™, Magnum, Qinex™, Schrader, Sensor–NITE

Competitive Advantage Through Operational Excellence checkbld Best cost sourcing commodity approach drives significant cost productivitySourcing checkbld Evolving shared service centers provide consistency and selling, checkbld Best delivered cost with culture of continuous improvementCost 48 February 2015 Investor Event checkbld Cost focus and transparency enabled by single instance of Enterprise Resource Management SystemSystem checkbld Product differentiation and customized solutions with scale and building block approachProduct checkbld Low capital intensity allows a significant amount of earnings to be converted to cashCapital general and administration leverageService

Consolidated Manufacturing Footprint Serving the World Major manufacturing sites Bulgaria: Botevgrad, Plovdiv China: Baoying, Changzhou Malaysia: Subang Jaya Poland: Bydgoszcz 49 February 2015 Investor Event NEWLY ACQUIRED CORE SENSATA MFG SITE NEW, UNDER CONSTRUCTION Mexico: Aguascalientes, Mexicali, Matamoras N. Ireland: Antrim, Carrickfergus USA: MA, TN

620,000 417,000 916,000 AMERICAS EUROPE ASIA Facilities Capacity Available for Growth In thousands of square feet 50 February 2015 Investor Event 89,000 328,000 17,000 603,000 285,000 631,000 AVAILABLE SQ FT UTILIZED SQ FT

25% 30% 35% COMMODITY APPROACH Sourcing Strategy to Drive Core Productivity and Acquisition Synergies LOW COST / HIGH COST SOURCING COST REDUCTION % OF SPEND 55.4% 52.8% 46.8% 6.2% 5.8% 6.2% 51 February 2015 Investor Event 0% 5% 10% 15% 20% FY12 FY13 FY14 FY13 FY14 AP15 44.6% 47.2% 53.2% 2013 % OF SPEND 2014 % OF SPEND 2015 % OF SPEND HIGH COST COUNTRY LOW COST COUNTRY OTHER LEVELS checkbldSupplier consolidation checkbldNegotiations checkbldDesign driven cost reduction

Mature Manufacturing With Significant Labor Advantage COUNTRY PRODUCTIONSTART DIRECT LABOR RATE INDEX USA = 100 HEADCOUNT DIRECT LABOR MANUFACTURING ENGINEERING PURCHASING SHARED SERVICE CENTER USA 1916 100 473 N. Ireland 1996 93 751 Poland 2011 33 308 52 February 2015 Investor Event 89% OF HEADCOUNT in locations with cost advantage Bulgaria 2002 28 898 Malaysia 1974 26 488 China 1995 21 4,092 Mexico 1983 20 4,739

Continuous Improvement Through Design Driven Cost Reduction 0.47 WEIGHT REDESIGNORIGINAL Inline design improvements checkbldDownsize sense element checkbld Eliminate components TARGET: 22% COST SAVINGS (EXCLUSIVE OF INVESTMENTS) INDEX 1.0 WEIGHT INDEX 53 February 2015 Investor Event $0.78 2017 COST + SIMPLIFIED INSTALL checkbldReduce form factor checkbld Reduce weight 67% Redesign 33% Original Product 2019 VOLUME MIX $1.00 2015 COST

Continuous Improvement Through Best Delivered Cost APPROACHBACKGROUND Existing capacity footprint entirely within Asia Capacity expansion into Bulgaria in 2015, leveraging existing supply chain to serve Measures of success checkbldOn–time delivery to customer with zero defect rate launch checkbldReduce tax / freight to <1% of total cost 54 February 2015 Investor Event Europe represents a large portion of MSG Net Revenue Freight and taxes: 5%–7% of total cost Europe customers Localization of steel, machine house, sense element assembly operation within Europe in 2016 checkbld Average savings of 3.7% checkbldReduction of Euro exposure—natural hedge

Continuous Improvement By Increasing Throughput Value stream map Go see, ask why Identify waste1 2 3 55 February 2015 Investor Event Similar changeover reduction time Similar output improvement Product A 54% 10.7% Product B 58% 9.8% Product C 63% 10.3% Before After Change Human movement (m) 146 36 75% Changeover time (s) 1,747 371 79% Increase in thousands of units / day 970 1,185 22% $1.5M 2015 SAVINGS AFTER FANNING OUT TO OTHER BOTTLENECKSCAPITAL EXPENDITURE EXAMPLE

Shared Service Opportunity Build a center: maximize scale, financial benefits, improve process 80 HEADCOUNT Transactional Break / fixMATURITY M ATURITY O F SHARED SERVICES CENTER O F SHARED SERVICES CENTER 2012 2014 85 HEADCOUNT Contractual 56 February 2015 Investor Event LIFECYCLE OF SHARED SERVICES CENTER O F SHARED SERVICES CENTER O F SHARED SERVICES CENTER 2015 Share risk; reduce total ownership cost 105 HEADCOUNT Expand Customer Outcomes Optimized assets, operations; use data and analysis for decision support services

checkbld Modular manufacturing cells—with long design cycles—reducing at risk capitalModular checkbld Throughput optimization—debottleneckingThroughput checkbld Flexibility across products and customersFlexible Low Capital Intensity Driving Strong Cash Flow 57 February 2015 Investor Event 2004 2005 2006 2007 2008 2009 2010 2011 2012 2013 2014 5 YR 10 YR $60M 4% $78M 4% $121M 6% $69M 4% $55M 3% $90M 5% $53M 3% $15M 1% $41M 3% $67M 5% $46M 4% $42M 4% $38M 4% AVG AVG checkbld Majority of investment focused on growthGrowth 1 Excludes certain large one–time capital expenditures such as the implementation of our Enterprise Resource Management tool CAPITAL EXPENDITURES1 CAPITAL EXPENDITURES AS % OF NET REVENUE

58 February 2015 Investor Event

FINANCE FEBRUARY 2015 59 February 2015 Investor Event PAUL VASINGTON, CFO

Schrader DeltaTech Controls Wabash Technologies Organic Growth $570M Sensata On-track to $3.8B in Revenue by 2017 2017 Double Revenue $3.8B High Single Digit $125M 60 February 2015 Investor Event 2012 Revenue $1.9B $80M TREMENDOUS PROGRESS IN 2014 checkbld Deployed $1.3B of capital for acquisitions • Closed 4 acquisitions • ~$800 million of run–rate revenue checkbld Deployed $180 million to buyback shares checkbld Organic growth outpacing market • 7% organic growth • $400M in new business wins drives long–term content growth checkbld Organic earnings growing faster than revenue

RUN–RATE BUSINESS RUN–RATE BUSINESS Acquiring Sensing Growth Platforms Demonstrating our ability to repeatedly identify and close value–creating transactions aligned with our strategy to Win In Sensing 61 February 2015 Investor Event $570M, growing rapidly ACQUIRED October 2014 EARNINGS $(0.05) dilutive in Q4 2014 $0.18–$0.21 in 2015 $0.50–$0.55 after integration, debt repayment $125M ACQUIRED August 2014 EARNINGS Neutral to earnings for first 24 months $0.11–$0.13 after integration, debt repayment

2014 Financial Results checkbld7% organic revenue growth checkbldExcluding the impact of acquired businesses ANI expanded ~9% HIGHLIGHTSFY14 FY13 %V Net Revenue $2,410 $1,981 22% Adj. Net Income $410 $385 7% 62 February 2015 Investor Event • Index % expands 40 bps to 19.8% checkbldANI Per Share excluding Schrader: $2.43, or +13% checkbldElevated inventory and M&A transaction costs reduce FCF % Net Revenue 17.0% 19.4% –2.4% ANI Per Share $2.38 $2.15 11% Free Cash Flow $238 $313 –24%

2015 Financial Outlook checkbld6% organic revenue growth • Content accelerates • Market ~flat • ASP decline (1.5%–2.0%) FY151 FY14 %V Net Revenue $3,065 $2,410 27% Adj. Net Income $501 $410 22% HIGHLIGHTS 63 February 2015 Investor Event checkbld23% growth from acquired businesses checkbldFX (2%) revenue headwind, moderated by hedging checkbldCore2 ANI grows ~12% checkbldSchrader accretive % Net Revenue 16.3% 17.0% –0.7% ANI Per Share $2.92 $2.38 23% Free Cash Flow $425 $238 79% 1 FY15 outlook reflects mid–point of guidance 2 Definition of Core business excludes Schrader and DeltaTech

M&A Delivering Value Hedge Net Earnings Volatility 80%–90% hedged Hedge systematically 2015 ANI Per Share 23% growth in 2015 coming from both core and acquired businesses. FX impact on earnings moderated by systematic hedging program. $2.38 $2.92 $0.25 – $0.41 $0.21 – $0.28 $(0.03) – $(0.04) 64 February 2015 Investor Event 2014 SensataCore1 Schrader / DeltaTech FX ANI Drivers Content growth Productivity, efficiency gains Invest for NBOs, operating excellence ASP decline Integrations on-track Schrader delivers 18¢–21¢ EPS in 2015 (5¢ loss in 2014) DeltaTech: +/-2¢ impact each month 24 month horizon 1 Definition of Core business excludes Schrader and DeltaTech

Euro Pound Net Exposure1 $250M–$300M Effective Systematic Hedging Program Designed to Reduce Earnings Volatility • Euro and Renminbi largest net revenues Peso and Pound largest net expenses Foreign Exchange Non–US dollar denominated net transaction flows $0.03–$0.04 HEADWIND IN 2015 65 February 2015 Investor Event NET REVENUE Korean Won Renminbi Peso Ringgit NET EXPENSE • Hedge 80%–90% of net exposure prior to beginning of year • Hedge each month to average in rate over a 24 month horizon • Optimizing best delivered cost can naturally reduce exposure over time • Expanding manufacturing in Bulgaria (2016) 1 US $ equivalent at 1/5/2015; excludes any hedge position

Sensata’s Financial Framework % Net Revenue 2014 Target Range Highlights Gross Margin 35.0% 36%–38% checkbld Productivity, Integration synergies R&D 3.4% 3%–4% checkbld Invest for NBOscheckbld Tech leadership position RDE 6.8% 6%–7% 66 February 2015 Investor Event checkbld Included in COR SGA 9.1% 7%–8% checkbldOperational efficiencycheckbld Productivity, Integration synergies Interest and Other 4.9% ~2% checkbld Strong FCF lowers debt Cash Taxes ~1% 1%-1.5% checkbldMaintain tax rate for foreseeable future Adjusted ANI 17.0% 20%–23% 5.8% Adj. EBIT 5%–6% Adj. EBIT 19.8% ex–acquisitions

$238 $425 $313 75% 2.6x 4.4x ~3.0x Financial Liquidity Strong cash flow generation fuels robust capital allocation Execute M&A and reduce debt to return to target net leverage ratio of 2x–3x FREE CASH FLOW NET LEVERAGE RATIO (“NLR”) 67 February 2015 Investor Event 2013 2014 2015E 74% 57% 2013 2014 2015E Target NLR • Expect to be within 2x–3x range by end of 2015 • Prepay floating rate term loans with free cash flow • FCF recovers from increased working capital efficiency • Cap Ex $175M–$200M in 2015 • Target unlevered FCF ~80% of Adj. EBITDA UNLEVERAGED FCF AS % OF ADJ. EBITDA 1 1 1 2015E represents mid–point of guidance given February 2015

Sensata Investment Highlights checkbld Innovative products designed for mission–critical, hard–to–do applications checkbld Custom solutions in high–value systems are sole-sourced leading to sticky, recurring revenue checkbld Collaborative, long–term relationships with diversified OEM customers Leading Position IN SENSING WE WIN IN Sensing checkbld Large, fast–growing sensing markets are driven by safety, clean environment, efficiency checkbld Solutions enabled by proliferation of embedded closed–loop systems requiring smart sensors 68 February 2015 Investor Event checkbld Revenue grows at double–digit long–term compound annual rate • Organic revenue grows at high single-digit pace, faster than markets due to content growth • M&A is core pillar of Sensata’s growth checkbld Earnings grow faster than revenue over time DOUBLE DIGIT Revenue & Earnings CAGRs checkbld Long–cycle revenue, low-cost consolidated supply chain, premium margins, attractive tax position, low capital intensity all lead to strong cash flows checkbld Capital can be used to create shareholder value through R&D, Capital Expenditures, share repurchases and to fund expansion through M&A LEADING MARGINS, STRONG Cash Generation checkbld Sensata has a successful track record of creating significant value through M&A checkbld Significant opportunities exist to continue to extend our footprint inorganically into $8B–$9B of adjacent, addressable markets SUCCESSFUL RECORD OF Acquisitions

Q & A 69 February 2015 Investor Event

This presentation includes references to Adjusted net income, Adjusted EBITDA, Net debt, Net leverage ratio, free cash flow and unleveraged free cash flow amounts. Adjusted net income is a non–GAAP financial measure. The Company defines Adjusted net income as follows: Net income before certain restructuring and special charges, costs associated with financing and other transactions, deferred (gain) / loss on other hedges, depreciation and amortization expense related to the step–up in fair value of fixed and intangible assets and inventory, deferred income tax and other tax (benefit) / expense, amortization of deferred financing costs, and other costs. Adjusted EBITDA is also a non–GAAP financial measure. The Company defines Adjusted EBITDA as follows: Net income before provision for / (benefit from) income taxes and other tax related expense, interest expense (net of interest income), amortization and depreciation expense, deferred (gain) / loss on other hedges, financing and other transactions costs, and restructuring and special Non–GAAP Measures 70 February 2015 Investor Event charges. The Company believes Adjusted net income and Adjusted EBITDA provide investors with helpful information with respect to the performance of the Company's operations, and management uses Adjusted net income and Adjusted EBITDA to evaluate its ongoing operations and for internal planning and forecasting purposes. Adjusted net income and Adjusted EBITDA are not measures of liquidity. Net debt represents total indebtedness including capital lease and other financing obligations, less cash and cash equivalents. The net leverage ratio represents Net debt divided by Adjusted EBITDA for the last twelve months. Free cash flow represents operating cash flow less capital expenditures. Unleveraged free cash flow represents free cash flow excluding interest expense. Please refer to the Company’s financial press releases, Form 8–K filings, and financial reports for a further description of our non–GAAP financial measures, including reconciliations of these measures to Net income. Copies of all the Company’s filings are available from the Investor Relations section of our website, Sensata.com, and from the SEC.
Serious News for Serious Traders! Try StreetInsider.com Premium Free!
You May Also Be Interested In
- Sensata Technologies Board Approves Q2 Dividend of $0.12 Per Share
- Homestyler to Recruit First Batch of Global Partners in 20 Countries
- Daniel Karpovič steps down as Head of B2B at Telia Lietuva
Create E-mail Alert Related Categories
SEC FilingsSign up for StreetInsider Free!
Receive full access to all new and archived articles, unlimited portfolio tracking, e-mail alerts, custom newswires and RSS feeds - and more!


 Tweet
Tweet Share
Share