

Form 8-K Sanchez Production Partn For: May 16
 Tweet
Tweet Share
ShareUNITED STATES
SECURITIES AND EXCHANGE COMMISSION
Washington, D.C. 20549
FORM 8-K
CURRENT REPORT
Pursuant to Section 13 or 15(d) of the Securities Exchange Act of 1934
Date of Report (date of earliest event reported): May 16, 2016
Sanchez Production Partners LP
(Exact name of registrant as specified in its charter)
|
Delaware |
001-33147 |
11-3742489 |
||||
|
(State or other jurisdiction of |
(Commission |
(IRS Employer |
||||
|
incorporation) |
File Number) |
Identification No.) |
||||
|
1000 Main Street, Suite 3000 |
|
||
|
Houston, TX |
77002 |
||
|
(Address of principal executive offices) |
(Zip Code) |
||
|
|
|
||
|
Registrant’s telephone number, including area code: (713) 783-8000 |
|||
(Former name or former address, if changed since last report.)
Check the appropriate box below if the Form 8-K filing is intended to simultaneously satisfy the filing obligation of the registrant under any of the following provisions:
☐ Written communications pursuant to Rule 425 under the Securities Act (17 CFR 230.425)
☐ Soliciting material pursuant to Rule 14a-12 under the Exchange Act (17 CFR 240.14a-12)
☐ Pre-commencement communications pursuant to Rule 14d-2(b) under the Exchange Act (17 CFR 240.14d-2(b))
☐ Pre-commencement communications pursuant to Rule 13e-4(c) under the Exchange Act (17 CFR 240.13e-4(c))
Item 2.02Results of Operations and Financial Condition.
On May 16, 2016, Sanchez Production Partners LP (the “Partnership”) issued a press release announcing its first quarter financial results. A copy of the press release is furnished as a part of this Current Report on Form 8-K as Exhibit 99.1.
In accordance with General Instruction B.2 of Form 8-K, the information in this Item shall not be deemed “filed” for the purpose of Section 18 of the Securities Exchange Act of 1934, as amended, nor shall it be deemed incorporated by reference in any filing.
Item 7.01Regulation FD.
On May 16, 2016, the Partnership posted an investor presentation on its website. A copy of this presentation is attached hereto as Exhibit 99.2 and is incorporated herein by reference.
In accordance with General Instruction B.2 of Form 8-K, the information in this Item shall not be deemed “filed” for the purpose of Section 18 of the Securities Exchange Act of 1934, as amended, nor shall it be deemed incorporated by reference in any filing.
Item 9.01 Financial Statements and Exhibits.
(d) Exhibits.
|
Exhibit No. |
Exhibit |
|
|
|
| 99.1 |
Press Release, dated May 16, 2016 |
| 99.2 |
Investor Presentation |
2
SIGNATURES
Pursuant to the requirements of the Securities Exchange Act of 1934, the registrant has duly caused this report to be signed on its behalf by the undersigned hereunto duly authorized.
|
|
|
|
|
|
|
|
SANCHEZ PRODUCTION PARTNERS LP |
||||||
|
|
|
|
|
|
|
|
By: Sanchez Production Partners GP LLC, |
||||||
|
|
|
|
|
|
|
|
|
|
|
|
|
|
|
|
|
|
|
|
|
|
|
|
|
|
|
|
|
|
|
|
|
|
|
|
|
|
|
|
|
|
|
|
|
|
|
|
|
|
|
|
|
|
|
|
|
|
|
|
|
Date: May 16, 2016 |
|
|
|
By: |
/s/ Charles C. Ward |
||||||||
|
|
|
|
|
|
|
|
|
Charles C. Ward |
|||||
|
|
|
|
|
|
|
|
|
Chief Financial Officer |
|||||
3
Exhibit Index
|
Exhibit No. |
Exhibit |
|
|
|
| 99.1 |
Press Release, dated May 16, 2016 |
| 99.2 |
Investor Presentation |
4

News Release
Sanchez Production Partners Reports
First Quarter 2016 Results
HOUSTON--(Marketwired)--May 16, 2016--Sanchez Production Partners LP (NYSE MKT: SPP) (“SPP” or the “Partnership”) today reported first quarter 2016 results. Highlights from the report include:
|
· |
A cash distribution to common unitholders of $0.4121 per common unit ($1.6484 per unit annualized) related to first quarter 2016 activity, which represents the second consecutive increase of 1.5% over the Partnership’s initial distribution in the third quarter 2015; |
|
· |
Distribution coverage of 2.65x excluding the Mid-Continent assets, which have been targeted for divestiture, and 1.95x including the Mid-Continent assets (in each case after the effect of the March 31, 2016 conversion of the Class A preferred units to common units); |
|
· |
Total revenue of $23.2 million and Adjusted EBITDA of $13.5 million during the first quarter 2016; |
|
· |
Throughput volumes for the Western Catarina Midstream system during the first quarter 2016 of 136% and 132% of the Minimum Quarterly Quantity for oil and natural gas, respectively; and |
|
· |
A strong liquidity position of approximately $97 million, with a pro forma leverage ratio of 1.9x for the first quarter 2016. |
Management Commentary
"During the first quarter 2016, we demonstrated the capability of both our unique structure and relationships,” said Gerald F. Willinger, Chief Executive Officer of SPP’s general partner. “To that end, we exceeded our volume and revenue expectations on the Western Catarina Midstream system for the quarter, with throughput at 136% and 132% of the Minimum Quarterly Quantity for oil and natural gas, respectively, and began to realize the benefits of continuing Catarina development, which includes further delineation of the South-Central region of the lease by Sanchez Energy Corporation (NYSE: SN).”
“Our performance allowed us to declare a cash distribution of $0.4121 per common unit, which represents our second consecutive increase of 1.5% over our initial distribution. Including the effects of the March 31, 2016 conversion of the Class A preferred units to common units, we had distribution coverage for
- 1 -
the first quarter of 2.65x, excluding the Mid-Continent assets targeted for divestiture, and 1.95x including the Mid-Continent assets. In addition to significant headroom on our common unit distribution, we ended the quarter with a strong liquidity position of approximately $97 million, which consists of $91 million in borrowing capacity under our credit facility and approximately $6 million in cash and cash equivalents, and a pro forma leverage ratio calculated in accordance with the terms of our credit facility of 1.9x. Taken together, we continue to believe that we offer one of the most compelling investment opportunities in the master limited partnership space today.”
“We will continue to focus our near-term efforts on midstream transaction development to take advantage of recent industry market conditions, our liquidity, and the strength of our balance sheet. As part of those efforts, we have received instrumental support from both Stonepeak Infrastructure Partners and our lending institutions.”
Operating and Financial Results
The Partnership’s revenue totaled $23.2 million during the first quarter 2016. Included in total revenue for the first quarter 2016 is revenue from the Western Catarina midstream system of $13.9 million and revenue from the Mid-Continent assets targeted for divestiture of $2.3 million. The balance of the Partnership’s first quarter 2016 total revenue came from other production activities ($3.0 million), hedge settlements ($7.1 million), and a loss on mark-to-market activities ($3.1 million), which is a non-cash item.
Operating expenses during the first quarter 2016 totaled $14.5 million, which includes $3.2 million in operating expenses related to the Western Catarina Midstream system and $2.0 million in production operating expenses not related to the Mid-Continent assets targeted for divestiture. General and administrative expenses during the first quarter 2016, excluding $1.7 million in non-cash items related to unit-based compensation and asset management fees, totaled $4.4 million, which included $0.4 million related to the Mid-Continent assets targeted for divestiture.
Adjusted EBITDA for the first quarter 2016 was approximately $13.5 million, which compares to $4.9 million in the first quarter 2015 after adjustments for non-recurring items in the first quarter 2015 related to employee severance ($4.4 million), transaction charges ($0.6 million), conversion charges ($0.3 million) and litigation charges (less than $0.1 million). This compares to Adjusted EBITDA for the fourth quarter 2015 of $12.0, which represents a 13% increase quarter-on-quarter.
On a GAAP basis, the Partnership recorded net income of $5.3 million for the first quarter 2016. Included in net income for the first quarter 2016 are expenses related to asset impairments totaling $1.3 million and a gain on embedded derivative expense, which relates to accounting for the Class B preferred units, of $6.3 million, each of which are non-cash items.
The Partnership’s capital spending during the first quarter 2016 totaled approximately $1.1 million.
Credit Facility and Hedging Update
- 2 -
As of May 13, 2016, the Partnership had $109 million in debt outstanding under its credit facility, which has a borrowing base of $200 million. The Partnership’s borrowing base is scheduled for redetermination by the lenders in the second quarter 2016.
For the period April 1, 2016 through Dec. 31, 2016, the Partnership has hedged approximately 3.0 Bcf of its natural gas production at an effective NYMEX fixed price of approximately $4.14 per Mcf and approximately 320 MBbl of its crude oil production at an effective NYMEX fixed price of approximately $73.93 per barrel.
COMMON UNITS
The Partnership had 4,279,517 common units issued and outstanding as of May 13, 2016. The Partnership converted the Class A preferred units to common units effective March 31, 2016.
DISTRIBUTIONS
On May 10, 2016, the Partnership declared a first quarter 2016 cash distribution on its common units of $0.4121 per unit ($1.6484 per unit annualized), which represents the second consecutive increase of 1.5% over the Partnership’s initial cash distribution in the third quarter 2015. The Partnership also declared a first quarter 2016 cash distribution of $0.45 per unit on its Class B preferred units. The distributions will be paid on May 31, 2016 to holders of record on May 20, 2016.
2016 FORECAST
Based on hedges in place and forward prices as of Dec. 31, 2015, the Partnership’s “base case forecast” estimates that 2016 Adjusted EBITDA will range from $54 million to $60 million, providing Distributable Cash Flow (“DCF”) of $13.5 million to $19.5 million in 2016. Based on these forecast results, and a common unit count that includes the conversion of the Class A preferred units to common units effective March 31, 2016, the Partnership projects the common unit distribution coverage will range from 1.9x to 2.8x, or 2.3x at the midpoint of the Partnership’s 2016 DCF forecast.
The Partnership’s base case forecast excludes contribution of the Mid-Continent assets, which have been targeted for divestiture. No incremental asset acquisitions or divestitures are included in the Partnership’s base case forecast. The base case forecast also assumes no additional units are repurchased in the open market under the Partnership’s $10 million unit repurchase program.
Conference Call Information
The Partnership will host a conference call at 10:00 a.m. Central Time (11:00 a.m. Eastern Time) on Monday, May 16, 2016 to discuss first quarter 2016 results.
To participate in the conference call, analysts, investors, media and the public in the U.S. may dial (877) 300-8521 shortly before 10:00 a.m. Central Time (11:00 a.m. Eastern Time) . The international phone number is (412) 317-6026. Callers should request the “SPP 16Q1 Conference Call” once reaching the operator.
A live audio webcast of the conference call and the earnings release will be available on the Partnership’s website (www.sanchezpp.com) under the Investor Relations page. A replay will be available approximately one hour after the
- 3 -
call through May 23, 2016, at 10:59 p.m. Central Time (11:59 p.m. Eastern Time). The replay may accessed by dialing (877) 870-5176 (U.S.) or (858) 384-5517 (International), and referencing the replay passcode: 10085341.
About the Partnership
Sanchez Production Partners LP (NYSE MKT: SPP) is a publicly-traded limited partnership focused on the acquisition, development, ownership and operation of midstream and other energy production assets. The Partnership owns an oil and natural gas gathering and processing system located in the Eagle Ford Shale in Dimmit and Webb Counties, Texas. The Partnership also currently owns producing reserves in the Eagle Ford Shale in South Texas, the Gulf Coast region of Texas and Louisiana, and across several basins in Oklahoma and Kansas. The Partnership announced in March 2015 that is exploring the possible divestiture of its assets and operations in Oklahoma and Kansas.
Additional Information
Additional information about SPP can be found in the Partnership’s documents on file with the U.S. Securities and Exchange Commission (www.sec.gov) and in the “Investor Presentation” available on the Partnership’s website (www.sanchezpp.com).
The Partnership anticipates that it will file its first quarter 2016 Form 10-Q with the U.S. Securities Exchange Commission on or about May 16, 2016.
Non-GAAP Measures
We present Adjusted EBITDA in addition to our reported net income (loss) in accordance with GAAP in this news release. We also provide our earnings forecast in terms of Adjusted EBITDA and Distributable Cash Flow.
Adjusted EBITDA is a non-GAAP financial measure that is defined as net income (loss) adjusted by interest (income) expense, net; income tax expense (benefit); depreciation, depletion and amortization; asset impairments; accretion expense; (gain) loss on sale of assets; (gain) loss from equity investment; unit-based compensation programs; unit-based asset management fees; (gain) loss on mark-to-market activities; and (gain) loss on embedded derivative. Distributable Cash Flow is defined as Adjusted EBITDA less cash interest expense; distributions on preferred units; and maintenance capital.
Adjusted EBITDA and Distributable Cash Flow are used as quantitative standards by our management and by external users of our financial statements such as investors, research analysts and others to assess the financial performance of our assets without regard to financing methods, capital structure or historical cost basis; the ability of our assets to generate cash sufficient to pay interest costs and support our indebtedness; and our operating performance and return on capital as compared to those of other companies in our industry, without regard to financing or capital structure. Adjusted EBITDA and Distributable Cash Flow are not intended to represent cash flows for the period, nor are they
- 4 -
presented as a substitute for net income, operating income, cash flows from operating activities or any other measure of financial performance or liquidity presented in accordance with GAAP.
We are unable to reconcile our forecast range of Adjusted EBITDA or Distributable Cash Flow to GAAP net income, operating income or net cash flow provided by operating activities because we do not predict the future impact of adjustments to net income (loss), such as (gains) losses from mark-to-market activities and equity investments or asset impairments due to the difficulty of doing so, and we are unable to address the probable significance of the unavailable reconciliation, in significant part due to ranges in our forecast impacted by changes in oil and natural gas prices and reserves which affect certain reconciliation items.
Forward-Looking Statements
This press release contains, and the officers and representatives of the Partnership and its general partner may from time to time make, statements that are considered forward–looking statements within the meaning of the Securities Act of 1933 and the Securities Exchange Act of 1934. These forward-looking statements are subject to a number of risks and uncertainties, many of which are beyond our control, which may include statements about our: business strategy; acquisition strategy; financial strategy; anticipated effects of transactions; timing or ability to make, maintain and grow distributions; the ability of our customers to meet their drilling and development plans on a timely basis or at all and perform under gathering and processing agreements; future operating results, including our forecast of Adjusted EBITDA and Distributable Cash Flow; future capital expenditures; and plans, objectives, expectations, forecasts, outlook and intentions. All of these types of statements, other than statements of historical fact included in this press release, are forward-looking statements. In some cases, forward-looking statements can be identified by terminology such as “may,” “will,” “could,” “should,” “expect,” “plan,” “project,” “intend,” “anticipate,” “believe,” “estimate,” “predict,” “potential,” “pursue,” “target,” “continue,” the negative of such terms or other comparable terminology.
The forward-looking statements contained in this press release are largely based on our expectations, which reflect estimates and assumptions made by our management. These estimates and assumptions reflect our best judgment based on currently known market conditions and other factors. Although we believe such estimates and assumptions to be reasonable, they are inherently uncertain and involve a number of risks and uncertainties that are beyond our control. In addition, management’s assumptions about future events may prove to be inaccurate. Management cautions all readers that the forward-looking statements contained in this press release are not guarantees of future performance, and we cannot assure any reader that such statements will be realized or the forward-looking events and circumstances will occur. Actual results may differ materially from those anticipated or implied in the forward-looking statements due to factors listed in the “Risk Factors” section in our filings with the U.S. Securities and Exchange Commission and elsewhere in those filings. The forward-looking statements speak only as of the date made, and other than as required by law, we do not intend to publicly update or revise any forward-looking statements as a result of new information, future events or otherwise. These cautionary statements qualify all forward-looking statements attributable to us or persons acting on our behalf.
- 5 -
PARTNERSHIP CONTACT
Charles C. Ward
Chief Financial Officer
Sanchez Production Partners GP LLC
(877) 847-0009
(Operating and Financial Highlights Follow)
- 6 -
PRESS RELEASE
Sanchez Production Partners LP
Operating Statistics
|
|
|
Three Months Ended March 31, |
||||
|
|
|
2016 |
|
2015 |
||
|
Net Production in MBOE: |
|
|
|
|
|
|
|
Total production (MBOE) |
|
|
303 |
|
|
324 |
|
Average daily production (BOE/D) |
|
|
3,334 |
|
|
3,596 |
|
|
|
|
|
|
|
|
|
Average Sales Price per BOE: |
|
|
|
|
|
|
|
BOE Net realized price, including hedges (1) |
|
$ |
39.61 |
|
$ |
35.51 |
|
BOE Net realized price, excluding hedges (2) |
|
$ |
16.22 |
|
$ |
18.31 |
|
(1) |
Excludes impact of mark-to-market gains (losses) |
|
(2) |
Excludes all hedges, the impact of mark-to-market gains (losses). |
- 7 -
Sanchez Production Partners LP
Condensed Consolidated Statements of Operations
|
|
|
Three Months Ended March 31, |
||||
|
|
|
2016 |
|
2015 |
||
|
|
|
($ in thousands) |
||||
|
Oil, liquids, and gas sales |
|
$ |
12,398 |
|
$ |
12,656 |
|
Gathering and transportation sales |
|
|
13,875 |
|
|
— |
|
Loss on mark-to-market activities |
|
|
(3,104) |
|
|
(732) |
|
Total revenues |
|
|
23,169 |
|
|
11,924 |
|
|
|
|
|
|
|
|
|
Operating expenses: |
|
|
|
|
|
|
|
Lease operating expenses |
|
|
4,973 |
|
|
4,900 |
|
Gathering and transportation operating expenses |
|
|
3,054 |
|
|
— |
|
Cost of sales |
|
|
130 |
|
|
205 |
|
Production taxes |
|
|
221 |
|
|
370 |
|
General and administrative |
|
|
6,157 |
|
|
9,547 |
|
Gain on sale of assets |
|
|
— |
|
|
(59) |
|
Depreciation, depletion and amortization |
|
|
7,188 |
|
|
3,120 |
|
Asset impairments |
|
|
1,309 |
|
|
82,865 |
|
Accretion expense |
|
|
315 |
|
|
253 |
|
Total operating expenses |
|
|
23,347 |
|
|
101,201 |
|
|
|
|
|
|
|
|
|
Other expenses: |
|
|
|
|
|
|
|
Interest expense |
|
|
899 |
|
|
646 |
|
Gain on embedded derivatives |
|
|
(6,294) |
|
|
— |
|
Other (income) expense |
|
|
(60) |
|
|
63 |
|
Total expenses, net |
|
|
17,892 |
|
|
101,910 |
|
Net income (loss) |
|
|
5,277 |
|
|
(89,986) |
|
Less: |
|
|
|
|
|
|
|
Preferred unit dividends |
|
|
(8,750) |
|
|
— |
|
Preferred unit amortization |
|
|
(7,266) |
|
|
|
|
Net loss attributable to common unitholders |
|
$ |
(10,739) |
|
$ |
(89,986) |
|
|
|
|
|
|
|
|
|
Adjusted EBITDA |
|
$ |
13,521 |
|
$ |
(437) |
|
|
|
|
|
|
|
|
|
Net loss per unit prior to conversion (1) |
|
|
|
|
|
|
|
Class A units - Basic and Diluted |
|
$ |
— |
|
$ |
(0.38) |
|
Class B units - Basic and Diluted |
|
$ |
— |
|
$ |
(0.31) |
|
Weighted Average Units Outstanding prior to conversion (1) |
|
|
|
|
|
|
|
Class A units - Basic and Diluted |
|
|
— |
|
|
48,451 |
|
Class B units - Basic and Diluted |
|
|
— |
|
|
2,879,163 |
|
Net income (loss) per unit after conversion (1) |
|
|
|
|
|
|
|
Common units - Basic and Diluted |
|
$ |
(3.91) |
|
$ |
29.76 |
|
Weighted Average Units Outstanding after conversion (1) |
|
|
|
|
|
|
|
Common units - Basic and Diluted |
|
|
2,743,419 |
|
|
2,992,801 |
|
(1) |
Amounts adjusted for 1-for-10 reverse split completed August 3, 2015. |
- 8 -
Sanchez Production Partners LP
Condensed Consolidated Balance Sheets
|
|
|
March 31, |
|
Dec. 31, |
||
|
|
|
2016 |
|
2015 |
||
|
|
|
($ in thousands) |
||||
|
Current assets |
|
$ |
29,000 |
|
$ |
32,901 |
|
Oil and natural gas properties, net of accumulated depreciation, depletion, amortization and impairments |
|
|
222,321 |
|
|
227,054 |
|
Other assets |
|
|
208,429 |
|
|
211,345 |
|
Total assets |
|
$ |
459,750 |
|
$ |
471,300 |
|
|
|
|
|
|
|
|
|
Current liabilities |
|
$ |
7,231 |
|
$ |
9,012 |
|
Long-term debt, net of premium, discount and debt issuance costs |
|
|
107,032 |
|
|
104,909 |
|
Other long-term liabilities |
|
|
207,419 |
|
|
213,441 |
|
Total liabilities |
|
|
321,682 |
|
|
327,362 |
|
|
|
|
|
|
|
|
|
Mezzanine equity |
|
|
179,763 |
|
|
172,111 |
|
Partners' capital |
|
|
(41,695) |
|
|
(28,173) |
|
Total partners' capital |
|
|
(41,695) |
|
|
(28,173) |
|
Total liabilities and partners' capital |
|
$ |
459,750 |
|
$ |
471,300 |
- 9 -
Sanchez Production Partners LP
Reconciliation of Net Income (Loss) to
Adjusted EBITDA
|
|
|
Three Months Ended March 31, |
||||
|
|
|
2016 |
|
2015 |
||
|
|
|
($ in thousands) |
||||
|
Reconciliation of Net Income (Loss) to Adjusted EBITDA: |
|
|
|
|
|
|
|
Net income (loss) |
|
$ |
5,277 |
|
$ |
(89,986) |
|
Add: |
|
|
|
|
|
|
|
Interest expense, net |
|
|
899 |
|
|
646 |
|
Income tax expense |
|
|
— |
|
|
— |
|
Depreciation, depletion and amortization |
|
|
7,188 |
|
|
3,120 |
|
Asset impairments |
|
|
1,309 |
|
|
82,865 |
|
Accretion expense |
|
|
315 |
|
|
253 |
|
Gain on sale of assets |
|
|
— |
|
|
(59) |
|
Unit-based compensation programs |
|
|
438 |
|
|
1,992 |
|
Unit-based asset management fees |
|
|
1,285 |
|
|
— |
|
Loss on mark-to-market activities |
|
|
3,104 |
|
|
732 |
|
Gain on embedded derivatives |
|
|
(6,294) |
|
|
— |
|
Adjusted EBITDA (1) |
|
$ |
13,521 |
|
$ |
(437) |
|
|
|
Three Months Ended Dec. 31, |
||||
|
|
|
2015 |
|
2014 |
||
|
|
|
($ in thousands) |
||||
|
Reconciliation of Net Income (Loss) to Adjusted EBITDA: |
|
|
|
|
|
|
|
Net income (loss) |
|
$ |
(44,524) |
|
$ |
11,798 |
|
Add: |
|
|
|
|
|
|
|
Interest expense, net |
|
|
1,767 |
|
|
507 |
|
Income tax expense |
|
|
52 |
|
|
— |
|
Depreciation, depletion and amortization |
|
|
5,486 |
|
|
4,327 |
|
Asset impairments (2) |
|
|
41,062 |
|
|
5,187 |
|
Accretion expense |
|
|
317 |
|
|
153 |
|
Loss on sale of assets |
|
|
— |
|
|
246 |
|
Unit-based compensation programs |
|
|
(9) |
|
|
82 |
|
Unit-based asset management fees |
|
|
937 |
|
|
— |
|
Gain on mark-to-market activities |
|
|
(3,109) |
|
|
(17,547) |
|
Loss on embedded derivatives |
|
|
9,982 |
|
|
— |
|
Adjusted EBITDA (1) |
|
$ |
11,961 |
|
$ |
4,753 |
|
(1) |
Our Adjusted EBITDA should not be considered as an alternative to net income, operating income, cash flows from operating activities or any other measure of financial performance or liquidity presented in accordance with GAAP. Our Adjusted EBITDA excludes some, but not all, items that affect net income and operating income and these measures may vary among other companies. Therefore, our Adjusted EBITDA may not be comparable to similarly titled measures of other companies. |
We define Adjusted EBITDA as net income (loss) plus:
|
· |
interest (income) expense, net which includes: |
|
· |
interest expense; |
|
· |
interest expense net (gain) loss on interest rate derivative contracts; and |
|
· |
interest (income); |
|
· |
income tax expense (benefit); |
|
· |
depreciation, depletion and amortization; |
|
· |
asset impairments; |
|
· |
accretion expense; |
|
· |
(gain) loss on sale of assets; |
|
· |
(gain) loss from equity investment; |
|
· |
unit-based compensation programs; |
|
· |
unit-based asset mananagement fees; |
|
· |
(gain) loss on mark-to-market activities; and |
|
· |
(gain) loss on embedded derivatives. |
|
(2) |
2015 amounts include $1,866 of exploration costs related to impairment of unproved property. |
- 10 -
|
|
Legal Disclaimers Forward-Looking Statements This presentation contains, and the officers and representatives of the Partnership and its general partner may from time to time make, statements that are considered forward–looking statements within the meaning of the Securities Act of 1933 and the Securities Exchange Act of 1934. These forward-looking statements are subject to a number of risks and uncertainties, many of which are beyond our control, which may include statements about our: business strategy; acquisition strategy; financial strategy; ability to make, maintain and grow distributions; the ability of our customers to meet their drilling and development plans on a timely basis or at all and perform under gathering and processing agreements; future operating results, including our forecast of Adjusted EBITDA and Distributable Cash Flow; future capital expenditures; and plans, objectives, expectations, forecasts, outlook and intentions. All of these types of statements, other than statements of historical fact included in this presentation, are forward-looking statements. In some cases, forward-looking statements can be identified by terminology such as “may,” “will,” “could,” “should,” “expect,” “plan,” “project,” “intend,” “anticipate,” “believe,” “estimate,” “predict,” “potential,” “pursue,” “target,” “continue,” the negative of such terms or other comparable terminology. The forward-looking statements contained in this presentation are largely based on our expectations, which reflect estimates and assumptions made by our management. These estimates and assumptions reflect our best judgment based on currently known market conditions and other factors. Although we believe such estimates and assumptions to be reasonable, they are inherently uncertain and involve a number of risks and uncertainties that are beyond our control. In addition, management’s assumptions about future events may prove to be inaccurate. Management cautions all readers that the forward-looking statements contained in this presentation are not guarantees of future performance, and we cannot assure any reader that such statements will be realized or the forward-looking events and circumstances will occur. Actual results may differ materially from those anticipated or implied in the forward-looking statements due to factors listed in the “Risk Factors” section in our filings with the U.S. Securities and Exchange Commission (“SEC”) and elsewhere in those filings. The forward-looking statements speak only as of the date made, and other than as required by law, we do not intend to publicly update or revise any forward-looking statements as a result of new information, future events or otherwise. These cautionary statements qualify all forward-looking statements attributable to us or persons acting on our behalf. Oil and Gas Reserves The SEC requires oil and gas companies, in filings with the SEC, to disclose “proved oil and gas reserves” (i.e., quantities of oil and gas that are estimated with reasonable certainty to be economically producible) and permits oil and gas companies to disclose “probable reserves” (i.e., quantities of oil and gas that are as likely as not to be recovered) and “possible reserves” (i.e., additional quantities of oil and gas that might be recovered, but with a lower probability than probable reserves). Investors are urged to consider closely the disclosure in Sanchez Production Partners’ Annual Report on Form 10-K for the most recent fiscal year. 2 |
|
|
Overview |
|
|
SPP’s Transformation (1) See Slide 12 (2) Reflects anticipated contribution to 2016 base case Adjusted EBITDA forecast (as updated 3/30/2016) before G&A expenses; See Slide 23 “SOG” refers to Sanchez Oil & Gas Corporation; “SN” refers to Sanchez Energy Corporation (NYSE: SN); “SEPI” refers to Sanchez Energy Partners I, LP, a SOG-operated private company The New Sanchez Production Partners Challenge: Orphan MLP with no sponsor Significant leverage with no ability to grow Asset base: Legacy PDP production Dominated by dry gas assets acquired in the 2007-08 timeframe Distributions: Suspended in 2009 Steps of the Transformation The Old SPP / Constellation Energy Partners EV: ~ $70 MM (1) (As of 6/30/2013) Established Relationship With SOG (Aug-13) Closed First Production Transaction With SN (Mar-15) Closed First Midstream Transaction With SN (Oct-15) Adjusted EBITDA Adjusted EBITDA (2) Converted from LLC to LP (Mar-15) ROFO on Significant, Identified Acquisition Inventory 4 Challenge met: Sponsored partnership Shared Services Agreement with SP Holdings, LLC; supported by the SOG operating platform ROFO on significant, identified acquisition inventory Executed transactions with SEPI and SN to deleverage and grow cash flows Asset base: Fixed fee gathering and processing assets with long-term minimum volume commitments Eagle Ford EWI and other Gulf Coast production assets Other legacy production assets (Mid-Continent) Distributions: An initial quarterly distribution per unit (“DPU”) of $0.4000 was paid in November 2015 A DPU of $0.4121, a 1.5% increase over the prior quarter (the Partnership’s second consecutive increase of 1.5%), will be paid in May 2016 Production 100% Production 44% Midstream 56% EV: ~ $500 MM (1) (As of 3/31/2016) Production 40% Midstream 60% |
|
|
2016 Forecast 5 See also SPP Hedging Program, Slide 22; Non-GAAP Financial Measures, Slide 23 Low Midpoint High Adjusted EBITDA 54.0 $ 57.0 $ 60.0 $ Distributable Cash Flow (2) 13.5 $ 16.5 $ 19.5 $ Common Unit Distributions 7.0 $ 7.0 $ 7.0 $ Distribution Coverage Ratio 1.9x 2.3x 2.8x NOTES: (1) Developed using the following key assumptions: - Hedges in place and forward prices as of 12/31/2015 - Excludes contribution of the Mid-Continent assets, which have been targeted for divestiture - No incremental asset acquisitions or divestitures - No additional common unit repurchases (2) Adjusted EBITDA, less: - Cash interest expense of $3.1 MM; - Distributions on Class B Preferred Units of $35.0 MM; and - Maintenance capital of $2.4 MM Base Case ($MM) (1) |
|
|
Investment Highlights |
|
|
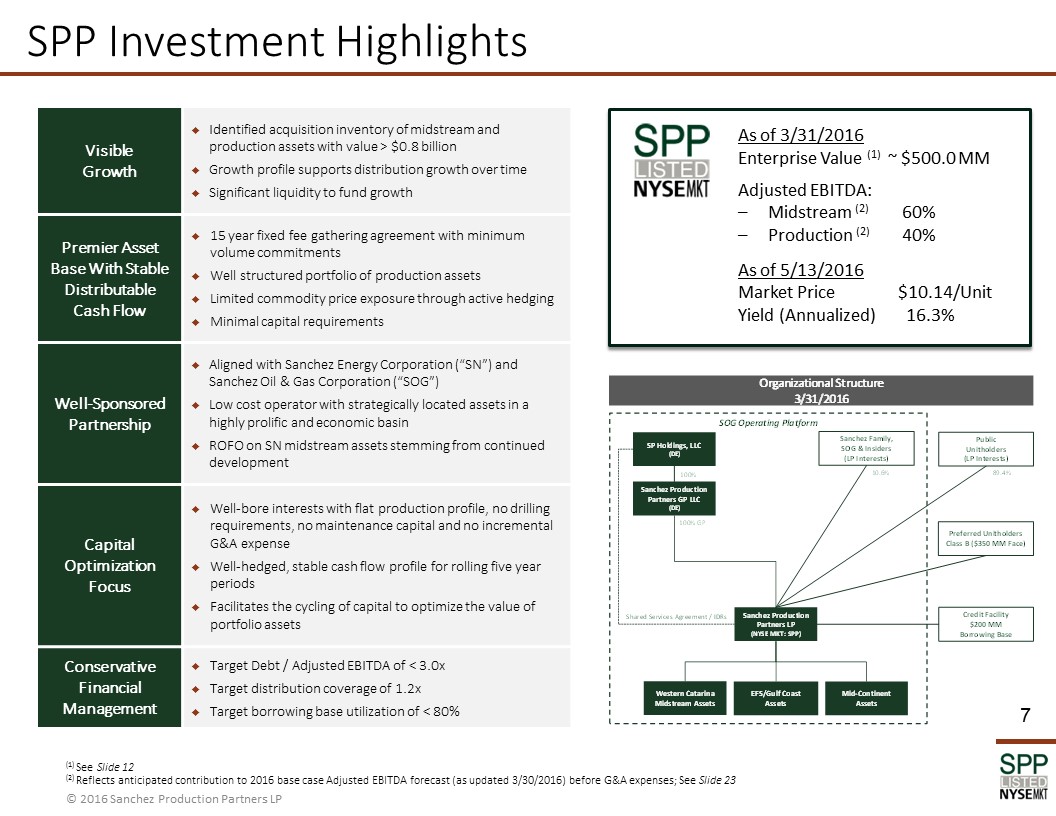
Visible Growth Identified acquisition inventory of midstream and production assets with value > $0.8 billion Growth profile supports distribution growth over time Significant liquidity to fund growth Premier Asset Base With Stable Distributable Cash Flow 15 year fixed fee gathering agreement with minimum volume commitments Well structured portfolio of production assets Limited commodity price exposure through active hedging Minimal capital requirements Well-Sponsored Partnership Aligned with Sanchez Energy Corporation (“SN”) and Sanchez Oil & Gas Corporation (“SOG”) Low cost operator with strategically located assets in a highly prolific and economic basin ROFO on SN midstream assets stemming from continued development Capital Optimization Focus Well-bore interests with flat production profile, no drilling requirements, no maintenance capital and no incremental G&A expense Well-hedged, stable cash flow profile for rolling five year periods Facilitates the cycling of capital to optimize the value of portfolio assets Conservative Financial Management Target Debt / Adjusted EBITDA of < 3.0x Target distribution coverage of 1.2x Target borrowing base utilization of < 80% As of 3/31/2016 Enterprise Value (1) ~ $500.0 MM Adjusted EBITDA: – Midstream (2) 60% – Production (2) 40% As of 5/13/2016 Market Price $10.14/Unit Yield (Annualized) 16.3% (1) See Slide 12 (2) Reflects anticipated contribution to 2016 base case Adjusted EBITDA forecast (as updated 3/30/2016) before G&A expenses; See Slide 23 |
|
|
Second quarterly DPU increase of 1.5% to $0.4121/unit (May-16) NYSE MKT: SPP (IPO Dec-06 as “CEP”) NYSE: SN (IPO Dec-11) Visible Growth CEP Acquires Gulf Coast Assets from SEP I, LP* (Aug-13) SN acquires Catarina assets from Shell (May-14) LLC-LP conversion implemented with the overwhelming support of SPP’s unitholders (Mar-15) SPP acquires Palmetto EWI assets from SN (Mar-15) * Sanchez Energy Partners I, LP, a SOG-operated private company SN grows its Eagle Ford asset base, through the drill bit and acquisitions Development/Growth 2012 2013 2014 Business development relationship between SPP and SOG, a committed sponsor, initiated 2016 and Beyond CEP asset base managed without a sponsor; significant leverage with no ability to grow Yield/Distributions Other targets with value > $0.8 B identified by SN (Ongoing) SPP acquires Western Catarina Midstream assets from SN (Oct-15) Ongoing Eagle Ford development expected to lead to growth and enhanced performance Cash Flowing Assets Monetized Proceeds Reinvested Additional Stable Cash Flows Shared Services Agreements executed and implemented; CEP (public LLC) is rebranded “SPP” 8 Quarterly DPU initiated at $0.4000/unit (Nov-15) 2015 |
|
|
Sanchez Production Partners LP Asset Base Midstream Production % Adjusted EBITDA (1) 60% 40% Total Proved Reserves (2) N/A 15,327 MBOE* EFS / Gulf Coast Assets (2) 5,252 MBOE (95% PDP)* Mid-Continent Assets (2) 10,075 MBOE (36% PDP)* Houston, Texas Headquarters (1) Reflects anticipated contribution to 2016 base case Adjusted EBITDA forecast (as updated 3/30/2016) before G&A expenses; See Slide 23 (2) As of 12/31/2015 based on forward prices Premier Asset Base Western Catarina Midstream Assets Located in a dedication area covering approximately 35,000 net acres in Dimmit and Webb Counties, TX Includes over 150 miles of gathering lines (4” to 12” diameter), compressors, tanks, vessels and other miscellaneous production equipment Supports production activities across SN’s Catarina asset Long-term fee-based throughput and gathering agreement with SN SPP Production Assets Gulf Coast non-operated assets acquired from Sanchez Energy Partners I, LP in 2013 Eagle Ford Shale (“EFS”) assets acquired from SN in 2015 Mid-Continent assets: Cherokee Basin operated and non-operated assets Other non-operated assets, including Woodford Shale assets and Central Kansas Uplift assets 9 Targeted for Divestiture |
|
|
Well-Sponsored Partnership Sanchez Oil & Gas Corporation (“SOG”) 1972 Private operating platform with ~ 200 employees Experienced management Technical and operational expertise Active business development Shared Services and Business Development Relationships (1) Sanchez Energy Corporation (2) (NYSE: SN) 2011 (IPO) Structure: Public C-Corp Enterprise Value: ~ $2.2 billion Asset Focus: Oil resource focus Eagle Ford Shale Tuscaloosa Marine Shale 1P Reserves: 128 MMBOE (at 12/31/2015) Production: ~ 56.500 BOE/D (16Q1 Average) Net Acres: ~ 200,000 Acquired $1.1 billion in assets since IPO Credit Rating (Sr. Unsecured): B / Caa2 Sanchez Production Partners (NYSE MKT: SPP) 2006 (IPO) Structure: Publicly-traded limited partnership Enterprise Value: ~ $500 MM (3) Asset Focus: Stable cash producing assets Gathering and processing midstream assets Escalating working interests Integrated approach to visible growth Initial quarterly DPU of $0.4000 was paid in November 2015 A DPU of $0.4121, a 1.5% increase over the prior quarter, will be paid in May 2016 Development / Growth Yield / Distributions Operations and Technical Support (1) Covers operational and technical support and business development activities; includes allocation of G&A (2) Source: SN Corporate Presentation – May 2016; SN market data as of 2/23/2016 (3) See Slide 12 Right of First Offer 10 |
|
|
Capital Optimization Focus Growth at SPP generates currency for SN’s future growth SN invests capital in development drilling and acquisitions Produces growth in production, infrastructure and cash flow Assets sold to SPP Large inventory of mature cash producing assets fit best in the MLP model Cash flows at SPP valued on yield Ability to pay market price to SN while capturing economic uplift for SPP Ability to show accretion 4 1 2 3 Perpetuates Growth Platform Capital Deployed Assets Divested Accelerates Cash Proceeds to SN Transaction Value Exchanged Provides Stable Cash Flows To SPP Optimizes Cost of Capital Initial Cash Flow to SN Development/Growth Yield/Distributions Improves Credit Metrics 11 |
|
|
Conservative Financial Management 12 (1) Quarter-end preceding SPP’s acquisition of Gulf Coast non-operated assets from Sanchez Energy Partners I, LP (2) Based on ~2.4 MM units outstanding at an $18.80/unit closing price of SPP on NYSE MKT (adjusted for the 1:10 reverse split effective 8/4/2015) as of 6/30/2013 (3) Based on ~4.2 MM units outstanding at a $11.60/unit closing price of SPP on NYSE MKT as of 3/31/2016 (4) Par value ($ in 000’s unless noted) 6/30/2013 (1) 3/31/2016 Cash & Cash Equivalents 9,541 $ 5,936 $ Borrowing Capacity 21,000 $ 91,000 $ = Borrowing Base 55,000 200,000 - Debt Outstanding 34,000 109,000 Total Liquidity 30,541 $ 96,936 $ = Borrowing Capacity 21,000 91,000 + Cash & Equivalents 9,541 5,936 Net Debt 24,459 $ 103,064 $ = Debt Outstanding 34,000 109,000 - Cash & Equivalents 9,541 5,936 Enterprise Value 69,054 $ 501,295 $ = Market Capitalization, Common Units (2),(3) 44,595 48,231 + Class B Preferred Units (4) - 350,000 + Net Debt 24,459 103,064 Net Debt / Enterprise Value 35% 21% |
|
|
Appendix I Escalating Working Interest Advantage |
|
|
From the Seller’s perspective, monetization of a portion of the well’s stable cash flow in an EWI structure enhances realized rates of return and provides capital for redeployment in the asset base In this example, the sale of the EWI results in: NPV $4.1 MM (unchanged) IRR 89% Eagle Ford wells are characterized by fast payback during a period of steep decline followed by a longer period of stable cash flow and low decline for the remaining life of the well Years 0 - 2 = ~ 40% of production and 60% of present value Years 2+ = ~ 60% of production and 40% of present value In this example, over the full life of the well the developer expects: NPV $4.1 MM IRR 67% EWI Case Study: Repeatable “Win/Win” Structure(1) Typical Eagle Ford Well EWI – Seller’s Perspective EWI – MLP Buyer’s Perspective (1) Assumes initial well cost of $4.5 MM; Three year EWI sold in Year 2 at PV10; Flat price deck of $55/BBL and $3.50/MCFE; 25% NGL realization; Catarina type curve EWI Seller Achieves Payback, Monetizes FCF For Redeployment, and Enhances IRR EWI Buyer Achieves Stable Cash Flow, Which Supports Distributions PV10 CF t=0 Mo. $4.1 MM From the MLP Buyer’s perspective, the purchase of an EWI, together with hedging (at closing) of the resulting “levelized” production from the asset, provides stable cash flow to support distributions over time while mitigating the need for maintenance capital 14 Cash Flow Cash Flow Cash Flow Months Months Months $ 0.0 $ 1.0 $ 2.0 $ 3.0 $ 4.0 $ 5.0 $ 6.0 0 12 24 36 48 60 72 84 96 108 120 Remaining PV ($mm) Months $ 0.0 $ 1.0 $ 2.0 $ 3.0 $ 4.0 $ 5.0 $ 6.0 0 12 24 36 48 60 72 84 96 108 120 Remaining PV ($mm) Months $ 0.0 $ 1.0 $ 2.0 $ 3.0 $ 4.0 $ 5.0 $ 6.0 0 12 24 36 48 60 72 84 96 108 120 Remaining PV ($mm) Months |
|
|
SPP Eagle Ford Acquisition Illustrated below, the SPP Eagle Ford Acquisition was structured to offset natural production declines, minimize maintenance capital requirements, and maintain more stable cash flows over the life of the asset for SPP The escalating working interests acquired from SN are expected to “levelize” production to SPP in years one through five Hedges covering a high percentage of production in years one through five, executed by SN, were novated to SPP at closing Escalating Working Interest Purchased From SN By SPP SN Retains EWI Year = * * Factors shown exclude natural gas liquids production Stable Cash Flow, Low Decline In this EWI structure (closed in Mar-15), SPP’s WI increases annually which, when applied to the production total, yields flat SPP production in EWI Years 1 - 5 SPP Owns 15 - 200 400 600 800 1,000 1,200 1 2 3 4 5 MBOE Per Year SPP PDP PDP Total SPP Receives: 2015 2016 2017 2018 2019 2020 2021 2022 2023 2024+ Avg. Working Interest 18.2% 26.1% 33.5% 40.6% 47.5% 47.5% 47.5% 47.5% 47.5% 47.5% Avg. Net Revenue Interest 13.2% 18.9% 24.2% 29.4% 34.3% 34.3% 34.3% 34.3% 34.3% 34.3% % PDP Total Shown Above 33.1% 50.7% 66.2% 80.9% 95.0% 95.0% 95.0% 95.0% 95.0% 95.0% Hedges as a % of Acquired Interests* 95.0% 90.0% 85.0% 85.0% 80.0% |
|
|
SPP Eagle Ford Acquisition (Closed March 2015) Source: Graphics from the SN Corporate Presentation – December 2014; Transaction details provided by SN and verified by SPP Note: All data shown is as of 3/31/2015, the date of transaction closing EURs (MBOE) 450 – 750 % Oil / Liquids 75% / 89% Palmetto Well Characteristics Trend Eagle Ford Shale Field Palmetto Location (County) Gonzales County, TX Type Wellbore Interests Operator Marathon Well (Reserve) Type Producing (PDP Only) Well Count 59 Transaction Structure Escalating Working Interests Avg. WI / NRI – Year 1 18.3% / 13.2% Avg. WI / NRI – Years 5+ 47.5% / 34.3% Forecast Net Production , 2015 through 2019 ~1,000 BOE/D Producing Horizons Upper Eagle Ford, Lower Eagle Ford Asset Mix, 2015-19 84.2% Oil/Liquids, 15.8% Natural Gas Asset Mix, Life Cycle 83.9% Oil/Liquids, 16.1% Natural Gas % PV10 Value Years 1 – 5 63.3% Assets Included In Transaction Producing Horizon Trend Field Type Curve Geology 16 LEF BUDA UEF |
|
|
Appendix II Western Catarina Midstream Transaction |
|
|
18 Catarina Overview Upper Eagle Ford 150+ Potential Locations 7 wells in stacked pilots drilled to date High oil yields of 250 Bbl/MMcf 500+ potential Locations Large Stacked Pay Application Production in line with LEF Type Curve Middle Eagle Ford 700+ Potential Locations 600-1200 Mboe EUR Extension into South Central Lower Eagle Ford Source: SN Corporate Presentation – May 2016 |
|
|
Gathering and processing assets originally constructed by Royal Dutch Shell as part of the infrastructure for the development of the Catarina Field Development and construction of the assets were promulgated under rights embedded in the lease agreement Pipeline capacity can be easily expanded through small compression projects at nominal costs (~$1 MM/year in growth capital planned) Western Catarina Midstream Asset Overview Asset Details Asset Overview Western Catarina Dedicated Acreage (1) Covers ~ 85,000 net development acres 19 Dedicated Acreage ~ 35,000 acres (1) Pipeline Assets ~ 150 miles of gathering lines (ranging in diameter from 4” to 12”) Facilities Four main gathering and processing facilities, which include: Eight stabilizers (5,000 BBL/D) ~ 25,000 BBL storage capacity NGL pressurized storage ~ 18,000hp compression ~ 300 MMCF/D dehydration capacity Interconnections Crude oil: Plains All American Pipeline header system delivered to Gardendale Terminal Connectivity to all four takeaway pipelines to Corpus Christi Natural gas: Southcross Energy Kinder Morgan Energy Transfer Enterprise Products Targa Resources Interconnections located at each of the four main processing facilities Capacity Condensate: 40,000 BBL/D Natural Gas: 200 MMCF/D |
|
|
Western Catarina Midstream Transaction Buyer: Sanchez Production Partners LP (“SPP”) Seller: SN Catarina, LLC, a wholly-owned subsidiary of Sanchez Energy Corp. (“SN”) Purchase Price: ~ $345 MM Effective Date: 10/14/2015 Closed: 10/14/2015 Assets: All of the issued and outstanding membership interests in Catarina Midstream, LLC, which owns ~ 150 miles of gathering lines, compressors, tanks, vessels and other gathering and processing infrastructure in Dimmit and Webb Counties, TX Transaction Agreement: Purchase and Sale Agreement; includes right of first offer on additional midstream asset sales by SN Gathering Agreement: Effective upon closing; 15 year term with fixed rates and a five year “Minimum Quarterly Quantity” Dedicated Acreage: ~ 35,000 acres in Western Catarina, SN’s most active development area Operations: Managed with the support of SOG since SN’s June 2014 acquisition Financing Overview: Financed through a preferred equity raise with Stonepeak Infrastructure Partners and available cash with incremental new debt capacity reserved for future growth 20 |
|
|
Appendix III Other Information |
|
|
SPP Hedging Program (1) As of 3/31/2016 (2) NYMEX swaps NOTE: The Partnership accounts for derivatives using the mark-to-market accounting method SPP intends to hedge a high percentage of PDP for up to five years SPP’s hedge strategy primarily utilizes swaps and costless collars, as warranted by market conditions Hedges executed with SPP’s lenders and subject to limitations in SPP’s Credit Facility Hedges in place result in the following fixed price positions, which were in-the-money ~ $28 MM as of 3/31/2016: 22 Hedge Positions (1) 2016 2017 2018 2019 Natural Gas Hedges (2) $/MMbtu 4.14 3.52 3.58 3.62 MMbtu 3,009,867 296,048 295,683 277,888 Crude Hedges (2) $/Bbl 73.93 64.80 65.40 65.65 Bbl 320,234 213,003 212,555 199,768 |
|
|
Non-GAAP Financial Measures Use of Non-GAAP Financial Measures – Historic Financials: EBITDA and Adjusted EBITDA are non-GAAP financial measures that are reconciled to their most comparable GAAP financial measure under Reconciliation of Non-GAAP Financial Measures in this presentation. The reconciliations are only intended to be reviewed in conjunction with the presentation to which they relate. EBITDA is defined as net income (loss) adjusted by interest (income) expense, net; income tax expense (benefit); depreciation, depletion and amortization; asset impairments; and accretion expense. Adjusted EBITDA is defined as EBITDA adjusted by (gain) loss on sale of assets; (gain) loss from equity investment; unit-based compensation programs; unit-based asset management fees; (gain) loss from mark-to-market activities; and (gain) loss on embedded derivative. Distributable Cash Flow is defined as Adjusted EBITDA less cash interest expense; distributions on preferred units; and maintenance capital. These financial measures are used as quantitative standards by our management and by external users of our financial statements such as investors, research analysts and others to assess the financial performance of our assets without regard to financing methods, capital structure or historical cost basis; the ability of our assets to generate cash sufficient to pay interest costs and support our indebtedness; and our operating performance and return on capital as compared to those of other companies in our industry, without regard to financing or capital structure. These financial measures are not intended to represent cash flows for the period, nor are they presented as a substitute for net income, operating income, cash flows from operating activities or any other measure of financial performance or liquidity presented in accordance with GAAP. Use of Non-GAAP Financial Measures – Forecast Financials: In addition to Adjusted EBITDA, we provide a forecast of Distributable Cash Flow in this presentation. Distributable Cash Flow is defined as Adjusted EBITDA less cash interest expense; distributions on preferred units; and maintenance capital. We are unable to reconcile our forecast range of Adjusted EBITDA or Distributable Cash Flow to GAAP net income, operating income or net cash flow provided by operating activities because we do not predict the future impact of adjustments to net income (loss), such as (gains) losses from mark-to-market activities and equity investments or asset impairments due to the difficulty of doing so, and we are unable to address the probable significance of the unavailable reconciliation, in significant part due to ranges in our forecast impacted by changes in oil and natural gas prices and reserves which affect certain reconciliation items. Summary of Non-GAAP Financial Measures : 23 Non-GAAP Measure Slide(s) Where Used in Presentation Most Comparable GAAP Measure Slide Containing Reconciliations Adjusted EBITDA, EBITDA 5, 24 Net Income 25 |
|
|
Recent Financial Results 24 (1) Includes lease operating expenses, cost of sales and production taxes (2) Includes loss (gain) on asset sale and loss on embedded derivative, which are non-cash items (3) Includes accretion expense and asset impairments, which are non-cash items (4) Includes employee severance charges of $4.4 MM, transaction charges of $0.6 MM, conversion charges of $0.3 MM, and litigation charges of less than $0.1 MM in 15Q1 See Reconciliation Items, Slide 25 16Q1 vs. 15Q4 16Q1 vs. 15Q1 ($ in 000’s unless noted) 16Q1 15Q4 16Q1 15Q1 Production (MBOE) 303 336 303 324 Oil and gas sales 12,398 $ 11,264 $ 12,398 $ 12,656 $ Midstream sales 13,875 11,725 13,875 - Gain (loss) on mark-to-market activities (3,104) 3,109 (3,104) (732) Revenue 23,169 $ 26,098 $ 23,169 $ 11,924 $ Operating expenses, production (1) 5,324 5,058 5,324 5,475 Operating expenses, midstream 3,054 2,176 3,054 - General and administrative expenses 6,157 5,440 6,157 9,547 Other (income) expense (2) (6,354) 9,264 (6,354) 4 EBITDA 14,988 $ 4,160 $ 14,988 $ (3,102) $ DD&A (3) 8,812 46,865 8,812 86,238 Interest expense, net 899 1,767 899 646 Income tax expense - 52 - - Net income (loss) 5,277 $ (44,524) $ 5,277 $ (89,986) $ Adjusted EBITDA, As Reported 13,521 $ 11,961 $ 13,521 $ (437) $ Add Back: Non-Recurring Items (4) - - - 5,318 Equals: Adjusted EBITDA Excluding Non-Recurring Items 13,521 $ 11,961 $ 13,521 $ 4,881 $ |
|
|
Reconciliation Items 25 (1) Includes accretion expense and asset impairments (2) Includes employee severance charges of $4.4 MM, transaction charges of $0.6 MM, conversion charges of $0.3 MM, and litigation charges of less than $0.1 MM in 15Q1; Excluding these non-recurring items in the quarterly results shown, 15Q1 Adjusted EBITDA was $4.9 MM Reconciliation of Net Income (Loss) to Adjusted EBITDA ($ in 000s) 15Q1 15Q4 16Q1 Net income (loss) (89,986) $ (44,524) $ 5,277 $ Interest expense, net 646 1,767 899 Income tax expense - 52 - DD&A (1) 86,238 46,865 8,812 EBITDA (3,102) $ 4,160 $ 14,988 $ (Gain) on sale of assets (59) - - Unit-based compensation programs 1,992 (9) 438 Unit-based asset management fees - 937 1,285 (Gain) loss on mark-to-market activities 732 (3,109) 3,104 (Gain) loss on embedded derivative - 9,982 (6,294) Adjusted EBITDA (1),(2) (437) $ 11,961 $ 13,521 $ |
Serious News for Serious Traders! Try StreetInsider.com Premium Free!
You May Also Be Interested In
- Vena Closes FY24 With Record-Setting Q4, Customer Growth, Product Innovation and Industry Recognition
- Polish Operator Play Extends Partnership With Netcracker for Digital BSS and Professional Services
- Clearview AI Improves SOC 2 Certification, Certifying Privacy Controls Alongside Security Controls
Create E-mail Alert Related Categories
SEC FilingsSign up for StreetInsider Free!
Receive full access to all new and archived articles, unlimited portfolio tracking, e-mail alerts, custom newswires and RSS feeds - and more!
