Form 8-K Sabra Health Care REIT, For: Nov 15
UNITED STATES
SECURITIES AND EXCHANGE COMMISSION
WASHINGTON, D.C. 20549
FORM 8-K
CURRENT REPORT
PURSUANT TO SECTION 13 OR 15(d) OF THE
SECURITIES EXCHANGE ACT OF 1934
Date of Report (Date of earliest event reported): November 15, 2016
SABRA HEALTH CARE REIT, INC.
(Exact name of registrant as specified in its charter)
Maryland | 001-34950 | 27-2560479 | ||
(State of Incorporation) | (Commission File Number) | (I.R.S. Employer Identification No.) | ||
18500 Von Karman, Suite 550 Irvine, CA | 92612 | |
(Address of principal executive offices) | (Zip Code) | |
Registrant's telephone number including area code: (888) 393-8248
(Former name or former address, if changed since last report.)
Check the appropriate box below if the Form 8-K filing is intended to simultaneously satisfy the filing obligation of the registrant under any of the following provisions:
o | Written communications pursuant to Rule 425 under the Securities Act (17 CFR 230.425) |
o | Soliciting material pursuant to Rule 14a-12 under the Exchange Act (17 CFR 240.14a-12) |
o | Pre-commencement communications pursuant to Rule 14d-2(b) under the Exchange Act (17 CFR 240.14d-2(b)) |
o | Pre-commencement communications pursuant to Rule 13e-4(c) under the Exchange Act (17 CFR 240.13e-4(c)) |
Item 7.01 | Regulation FD Disclosure. |
On November 15-17, 2016, Sabra Health Care REIT, Inc. (“Sabra”) intends to present the materials attached to this report as Exhibit 99.1 in investor presentations. The furnishing of these materials is not intended to constitute a representation that such furnishing is required by Regulation FD or other securities laws, or that the presentation materials include material investor information that is not otherwise publicly available. In addition, Sabra does not assume any obligation to update such information in the future.
Item 9.01 | Financial Statements and Exhibits. |
(d) | Exhibits | |
99.1 | Presentation materials for November 15-17, 2016 presentations. | |
SIGNATURES
Pursuant to the requirements of the Securities Exchange Act of 1934, the Registrant has duly caused this report to be signed on its behalf by the undersigned thereunto duly authorized.
SABRA HEALTH CARE REIT, INC. | |||
/S/ HAROLD W. ANDREWS, JR. | |||
Name: | Harold W. Andrews, Jr. | ||
Title: | Executive Vice President, Chief Financial Officer and Secretary | ||
Dated: November 15, 2016
EXHIBIT INDEX
Exhibit Number | Description | |
99.1 | Presentation materials for November 15-17, 2016 presentations. | |

NAREIT 2016 REITWorld
Annual Convention
November 15-17, 2016
Relationship driven.
Investor focused.

.
2
STRATEGIC OVERVIEW
Multiple avenues to increase shareholder value
Create a diversified portfolio that is well positioned for the future of health care delivery
Leverage Sabra’s operating expertise to develop strategic relationships with local & regional
operators
Improve Sabra’s cost of capital and increase total shareholder return

.
3
• Jointly selling 35 facilities (out of a total of 78 facilities in our Genesis portfolio) as contemplated by
three separate MOUs with Genesis
• All net proceeds go to Sabra – estimated $226.2 million remaining to be received ($191.5 million
net of debt assumptions and payoffs)
• Annual cash rent reduction from Genesis estimated at $16.6 million (based on estimated net sales
proceeds)
• Rent reductions will occur upon the sales of the facilities, which are expected to be
completed over time through Q2 2017
• Estimated $191.5 million of net cash proceeds expected to be reinvested through future
acquisitions
• Estimated impact on annual Normalized AFFO (“NAFFO”) per share of $(0.02) after
elimination of debt and reinvestment of proceeds
• Remaining portfolio of 43 facilities in 16 master leases has been restructured
• Remaining rents reallocated to better match facility performance
• Maturities on eight leases extended
• Guarantees improved to survive future facility sales to the benefit of buyer
GENESIS DISPOSITIONS - OVERVIEW

.
4
• Accelerated reduction in concentrations (1)
• Negligible impact expected on future NAFFO per share growth
• $191.5 million of future investment activity to be funded from net sales proceeds (instead of debt
and equity capital) which mitigates slow down in growth of absolute NAFFO
• Leverage goals of 4.5x – 5.5x expected to be maintained
Genesis SNF
As of 9/30/2016 32.6% 58.4%
Pro Forma
After sales 27.2% 55.1%
After reinvestment 25.3% 51.2%
GENESIS DISPOSITIONS – LONG TERM BENEFITS TO SABRA
(1) Concentrations are calculated using annualized revenue for real estate investments, investments in loans receivable and other investments while net operating income is
used for investments leased through RIDEA compliant structures.

.
5
• Enhanced portfolio
• Sale of less desirable facilities; Genesis exits less desirable markets
• Rent reallocations and maturity extensions
• Creates strong coverage levels for longer dated lease maturities
• Including the estimated $16.6 million reduction in rents following the sales, rent associated
with leases maturing by the end of 2021 declines by $24.7 million (42%)
• Guarantees survive future sales or other arrangements such as a JV transaction, which enhances
flexibility in future portfolio management
Current Pro Forma
$ (M) % $ (M) %
2020 $28.3 36.7% $2.9 4.8%
2021 $30.9 40.1% $15.0 24.8%
2022 $10.3 13.4% $15.7 26.0%
2023 $0.0 0.0% $12.6 20.9%
2024 $2.0 2.6% $9.3 15.4%
2025 $5.5 7.2% $4.9 8.1%
Total $77.1 100.0% $60.5 100.0%
GENESIS DISPOSITIONS – LONG TERM BENEFITS TO SABRA
.
6
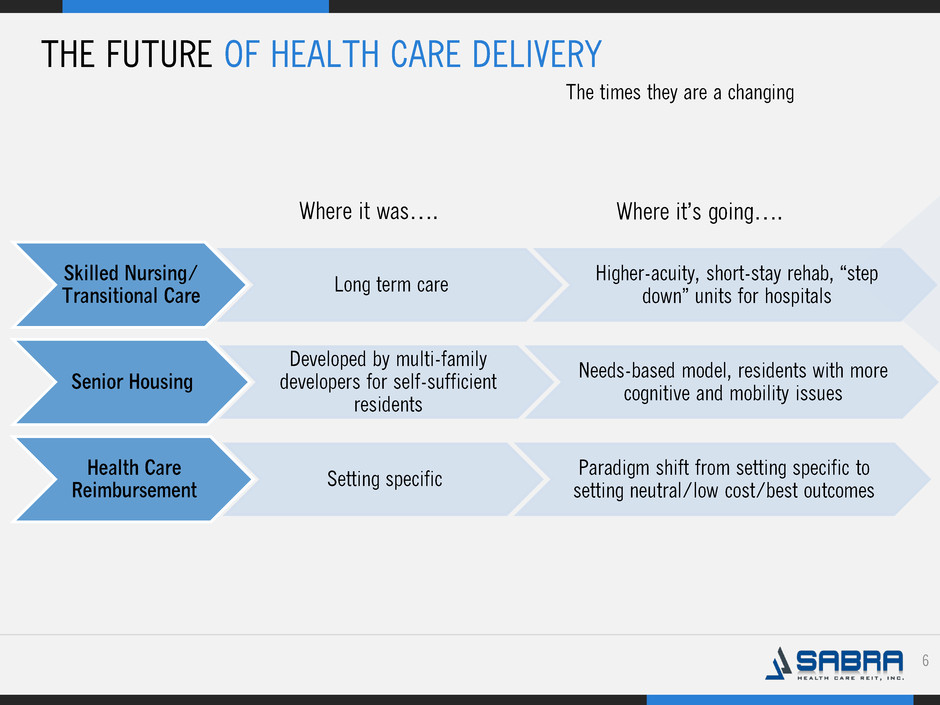
THE FUTURE OF HEALTH CARE DELIVERY
The times they are a changing
Skilled Nursing/
Transitional Care Long term care
Higher-acuity, short-stay rehab, “step
down” units for hospitals
Senior Housing
Developed by multi-family
developers for self-sufficient
residents
Needs-based model, residents with more
cognitive and mobility issues
Health Care
Reimbursement Setting specific
Paradigm shift from setting specific to
setting neutral/low cost/best outcomes
Where it was…. Where it’s going….
.
7
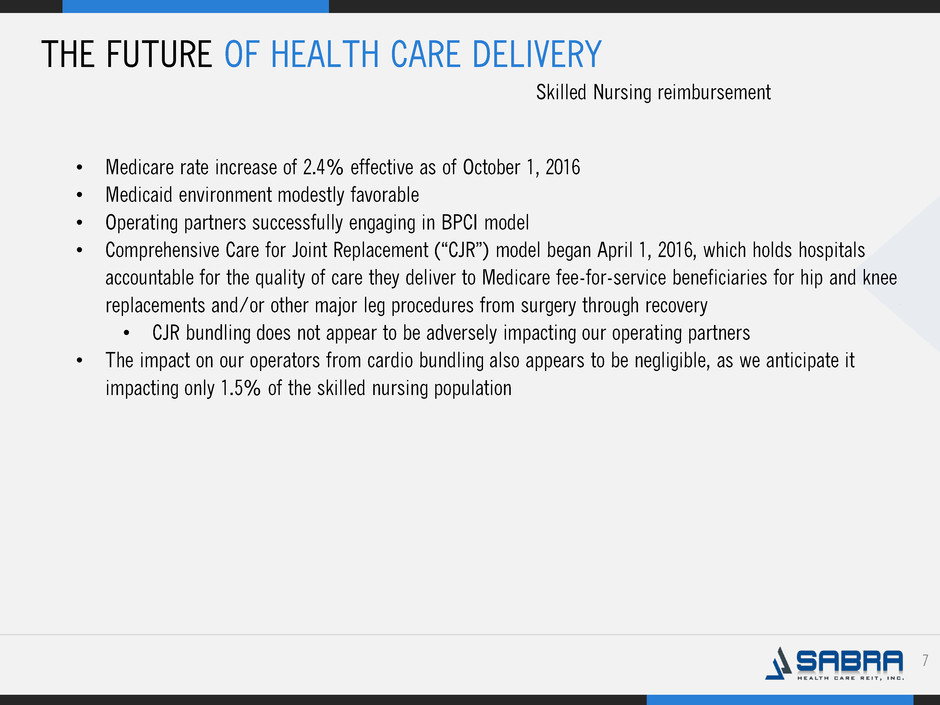
Skilled Nursing reimbursement
• Medicare rate increase of 2.4% effective as of October 1, 2016
• Medicaid environment modestly favorable
• Operating partners successfully engaging in BPCI model
• Comprehensive Care for Joint Replacement (“CJR”) model began April 1, 2016, which holds hospitals
accountable for the quality of care they deliver to Medicare fee-for-service beneficiaries for hip and knee
replacements and/or other major leg procedures from surgery through recovery
• CJR bundling does not appear to be adversely impacting our operating partners
• The impact on our operators from cardio bundling also appears to be negligible, as we anticipate it
impacting only 1.5% of the skilled nursing population
THE FUTURE OF HEALTH CARE DELIVERY

.
8
Traditional REIT
structures
- Sale/leasebacks
-Mortgage debt
Deal structure flexibility drives competitive advantage
Smaller investments
with options to
purchase
RIDEA
compliant
structures
Preferred equity
& mezzanine debt
Development
agreements
THINKING OUTSIDE THE BOX
Forward
purchase
commitments
.
9
MARKET FOCUS
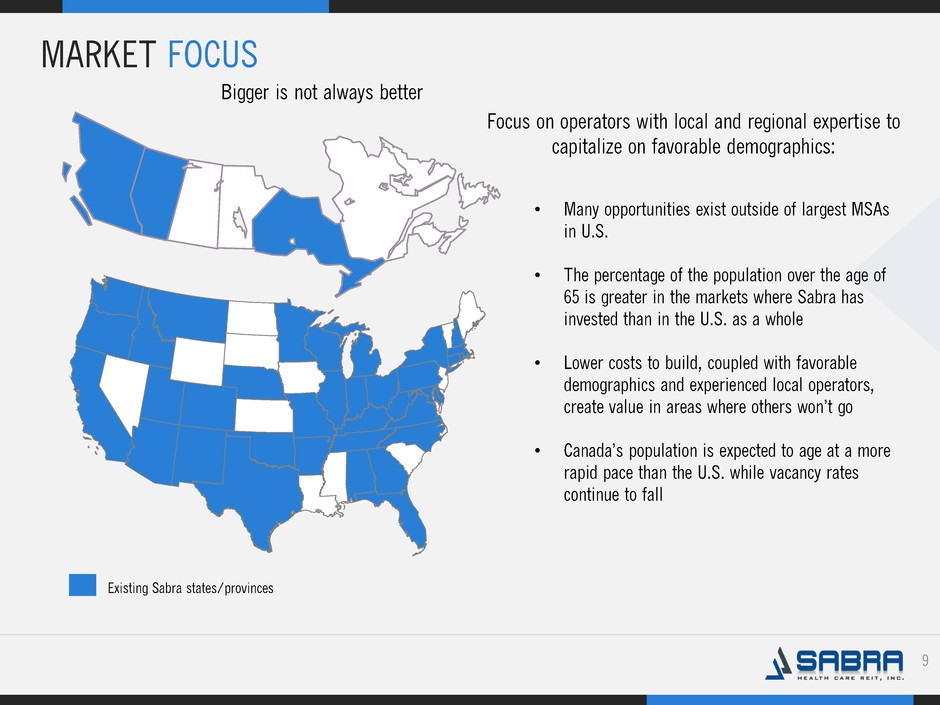
Bigger is not always better
• Many opportunities exist outside of largest MSAs
in U.S.
• The percentage of the population over the age of
65 is greater in the markets where Sabra has
invested than in the U.S. as a whole
• Lower costs to build, coupled with favorable
demographics and experienced local operators,
create value in areas where others won’t go
• Canada’s population is expected to age at a more
rapid pace than the U.S. while vacancy rates
continue to fall
Focus on operators with local and regional expertise to
capitalize on favorable demographics:
Existing Sabra states/provinces

.
10
PROPRIETARY DEVELOPMENT PIPELINE
Proprietary pipeline drives consistent deal flow for
new, purpose-built facilities
($ in millions; investment amounts through October 31, 2016)
Completed
Projects In Process Future Total
Projects 6 23 10 39
Current Investment Amount $ 82.5 $ 93.9 $ - $ 176.4
Real Estate Value (1) $ 82.5 $ 486.5 $ 97.7 $ 666.7
(1) Estimated real estate values, except for completed projects

.
11
$32.6
$14.5
$70.0
$24.4
$116.8
$27.0
$18.4
$23.7
$59.1
$17.8
$74.6
$7.7
2 1 3 1 4 1 1 1 2 1 5 1
$-
$20.0
$40.0
$60.0
$80.0
$100.0
$120.0
$140.0
Texas Wisconsin Colorado Florida Indiana Kentucky Minnesota Nevada Ohio Tennessee Texas Wisconsin
Investment Amount Est. Real Estate Value Upon Completion Number of Facilities
Senior Housing
PROPRIETARY DEVELOPMENT PIPELINE
($ in millions; investment amounts through October 31, 2016)
Smaller initial investments for future purpose-built facilities lower Sabra’s development risk
Skilled Nursing /
Transitional Care

.
12
NEW ASSETS IN REAL ESTATE PORTFOLIO
Includes facilities built since 2010 and owned by Sabra
($ in millions; investment amounts through October 31, 2016)
$10.1
$10.7
$23.0
$10.1
$5.6
$26.6
$41.4
$26.6
$-
$5.0
$10.0
$15.0
$20.0
$25.0
$30.0
$35.0
$40.0
$45.0
Arizona Colorado Illinois Indiana Texas Virginia Wisconsin Canada
Skilled Nursing Pipeline Senior Housing Pipeline Senior Housing Non-Pipeline

.
13
TARGET = INVESTMENT GRADE
Main barriers to investment grade rating are size and diversification
Sabra (1) “Big 3” (2)
Net Debt to Adjusted EBITDA (3) 5.29x 5.67x 6.10x
Debt as % of Enterprise Value 45% 33% 44%
Interest Coverage Ratio 3.99x 3.89x 5.24x
Fixed Charge Coverage Ratio 3.17x 3.60x 4.70x
Secured Debt to Gross Asset Value 6% 4% 11%
Corporate Credit Ratings Ba3/BB-
/BB+
BBB BBB+
(1) Key credit statistics (excluding Net Debt to Adjusted EBITDA) are calculated in accordance with our credit facility and the indentures relating to our unsecured senior notes. Key credit
statistics (excluding debt as a percentage of enterprise value) are calculated as of September 30, 2016. Debt as a percentage of enterprise value was calculated using the common and preferred
closing stock prices of $20.84 and $26.22, respectively, as of November 7, 2016.
(2) As of September 30, 2016 and based on public filings of Welltower, Inc., HCP, Inc., and Ventas, Inc., except debt as a percentage of enterprise value, which was calculated using the closing
stock prices as of November 7, 2016.
(3) Adjusted EBITDA is calculated as earnings before interest, taxes, depreciation and amortization ("EBITDA") on a trailing 12 month basis, excluding the impact of stock based compensation
expense under our long-term equity award program, asset-specific loan loss revenues, significant out of period revenues and expenses and further adjusted to give effect to acquisitions and
dispositions as though such acquisitions and dispositions occurred at the beginning of the period.
Lower Net Debt to Adjusted EBITDA than the “Big 3”

Portfolio Performance

.
15
STRONG PORTFOLIO PERFORMANCE
Portfolio occupancy and SNF/TC portfolio skilled mix
87.2% 87.3%
90.7% 89.5%
39.1%
43.7%
2015 2016 2015 2016
SNF/TC Senior Housing Skilled Mix
Occupancy & Skilled Mix
Solid skilled mix reflects focus on higher-
acuity, short-stay skilled nursing/transitional
care facilities.
(1) Occupancy percentage and skilled mix for each period presented include only Stabilized Facilities owned by the company as of the end of the respective period and are only included in
periods subsequent to our acquisition. All data is presented one quarter in arrears.
(2) Skilled mix is defined as the total Medicare and non-Medicaid managed care patient revenue divided by the total revenues at skilled nursing/transitional care facilities for the period
indicated.
(for the twelve month periods ended September 30, 2015 and 2016)
(1) (2) (1)

.
16
1.28x
1.62x
1.49x
1.79x
EBITDAR EBITDARM
2015 2016
(1) (1)
STRONG PORTFOLIO PERFORMANCE
Skilled Nursing/Transitional Care
(1) EBITDAR and EBITDARM coverage for each period presented include only Stabilized Facilities owned by Sabra as of the end of the respective period and are only included in periods
subsequent to our acquisition. All data is presented one quarter in arrears. EBITDARM Coverage and EBITDAR Coverage exclude the Genesis, Tenet and Holiday assets, which have
significant corporate guarantees as noted on slide 17. See Definitions for definitions of EBITDAR Coverage, EBITDARM Coverage and Stabilized Facilities.
(2) Sabra’s stabilized Senior Housing portfolio contained 235 and 1,046 independent living units as of September 30, 2015 and 2016, respectively. Total Senior Housing units were 1,457 and
2,695 as of September 30, 2015 and 2016, respectively.
(for the twelve month periods ended September 30, 2015 and 2016)
Senior Housing (2)
EBITDAR and EBITDARM coverage
1.28x
1.48x
1.13x
1.29x
EBITDAR EBITDARM
2015 2016
(1) (1)

.
17
STRONG PORTFOLIO PERFORMANCE
Fixed charge coverage
(1) Fixed Charge Coverage is presented one quarter in arrears for tenants with significant corporate guarantees. See Definitions for definition of Fixed Charge Coverage.
(for the twelve month periods ended September 30, 2015 and 2016)
Tenant Facility Type
Relationship
Concentration
Fixed Charge Coverage as of
September 30(1)
2015 2016
Genesis SNF/SH 32.6% 1.27x 1.24x
Tenet ACH 2.3% 2.44x 2.15x
Holiday SH 16.3% 1.17x 1.17x

Financial Overview

.
19
$1,360
$700
$165
$151
$340
Common Equity Market Value
Senior Notes
Mortgage Debt
Preferred Equity Market Value
Term Loans
(1)
Capitalization and cost of capital
(1) Common Equity Market Value and Preferred Equity Market Value are based on closing stock prices of $20.84 and $26.22, respectively, as of November 7, 2016.
Track Record of Access to Capital Markets
2016
• Amended credit facility to increase unsecured revolving credit facility to $500.0 million, US dollar term loan to $245.0 million
and Canadian dollar term loan to CAD $135.0 million. Amended credit facility includes ability to borrow up to $125.0 million
in certain foreign currencies under the unsecured revolving credit facility
• Fixed interest rates on US and Canadian dollar term loans through interest rate swaps resulting in no variable interest rate
exposure on outstanding debt. Fixed LIBOR at 0.90% on $245.0 million US dollar term loan borrowings and fixed CDOR at
0.93% on $35.0 million of Canadian dollar term loan borrowings.
2015
• 5.9 million shares of common stock through an underwritten offering providing net proceeds, before expenses, of $147.9
million
• New CAD $90.0 million floating rate term loan swapped to a rate of 1.59 % plus a spread of 2.00 % to 2.60 % , depending on
leverage
2014
• 15.0 million shares of common stock through underwritten offerings providing net proceeds, before expenses, of $379.7
million
• 5.0 million shares of common stock through ATM programs, resulting in net proceeds of $137.6 million
• $500.0 million aggregate principal amount of 5.5% senior unsecured notes due 2021, of which $221.3 million was used to
repay 8.125 % senior unsecured notes maturing 2018
• New $650.0 million unsecured revolving credit facility, of which $200.0 million was converted into a term loan
2013
• $200.0 million aggregate principal amount of 5.375% senior unsecured notes due 2023
• $100.0 million At-The-Market stock offering program with respect to shares of Sabra common stock
• 5.8 million shares of 7.125% Series A Cumulative Redeemable Preferred Stock providing net proceeds, before expenses, of
$139.2 million
Total: $2.7 billion
(Pro forma as of September 30, 2016, $ in millions unless otherwise noted)
FINANCIAL STRENGTH

.
20
FINANCIAL RESULTS
Normalized AFFO/share, Normalized FFO/share and dividend/share
$1.51
$1.59
$1.77
$2.12 $2.14
$0.55 $0.53
$0.58
$0.53
$1.31
$1.47
$1.84
$2.20
$2.33
$0.64 $0.56
$0.61
$0.54
$1.29 $1.33
$1.38
$1.54
$1.62
$0.41 $0.42 $0.42 $0.42
2011 2012 2013 2014 2015 Q4 2015 Q1 2016 Q2 2016 Q3 2016
Normalized AFFO/share Normalized FFO/share Dividend/Share
Sabra’s quarterly dividend has
increased from $0.32 per common
share with respect to the first
quarter of 2011 to $0.42 per common
share with respect to the third
quarter of 2016.

.
21
FINANCIAL STRENGTH
Historical net debt to adjusted EBITDA (1)
2.19x
2.65x 2.82x
4.48x
5.11x
4.57x
1.90x
2.11x 1.92x
0.61x
0.74x
0.72x
4.09x
4.76x 4.74x
5.09x
5.85x
5.29x
12/31/2011 12/31/2012 12/31/2013 12/31/2014 12/31/2015 9/30/2016
Unsecured Leverage Secured Leverage Net Debt to Adjusted EBITDA
• Maintaining total leverage within
rating agency expectations
• Lowering use of secured leverage
– a step toward improved credit
ratings
(1) Adjusted EBITDA is calculated as earnings before interest, taxes, depreciation and amortization ("EBITDA") on a trailing 12 month basis, excluding the impact of stock based compensation
expense under our long-term equity award program, asset-specific loan loss revenues, significant out of period revenues and expenses and further adjusted to give effect to acquisitions and
dispositions as though such acquisitions and dispositions occurred at the beginning of the period.

.
22
FINANCIAL STRENGTH
Historical LTM interest coverage
3.17x
3.22x
3.85x
4.29x 4.19x
3.99x
2011 2012 2013 2014 2015 Q3 2016
Cost of permanent debt (2)
declined from:
7.24% at December 31, 2011
to
4.54% of as of September 30, 2016
(1) Interest Coverage is calculated in accordance with the indentures relating to our unsecured senior notes.
(2) Excludes revolving credit facility balance, if any, which had an interest rate of 2.53% and 5.75% as of September 30, 2016 and December 31, 2011, respectively.
(1)

.
23
$1.0 $4.1 $4.3 $4.4 $4.6 $19.7 $4.3
$4.4 $4.6 $4.7
$108.9
$340.1
$500.0
$500.0
$200.0
2016 2017 2018 2019 2020 2021 2022 2023 2024 2025 Thereafter
Mortgage Notes Term Loans Credit Facility Available Senior Notes
FINANCIAL STRENGTH
Debt maturities
Ample liquidity with no significant
maturities until 2020
(1) Maturity may be extended for two six-month periods.
(as of September 30, 2016, $ in millions)
(1)

Appendix
.
25
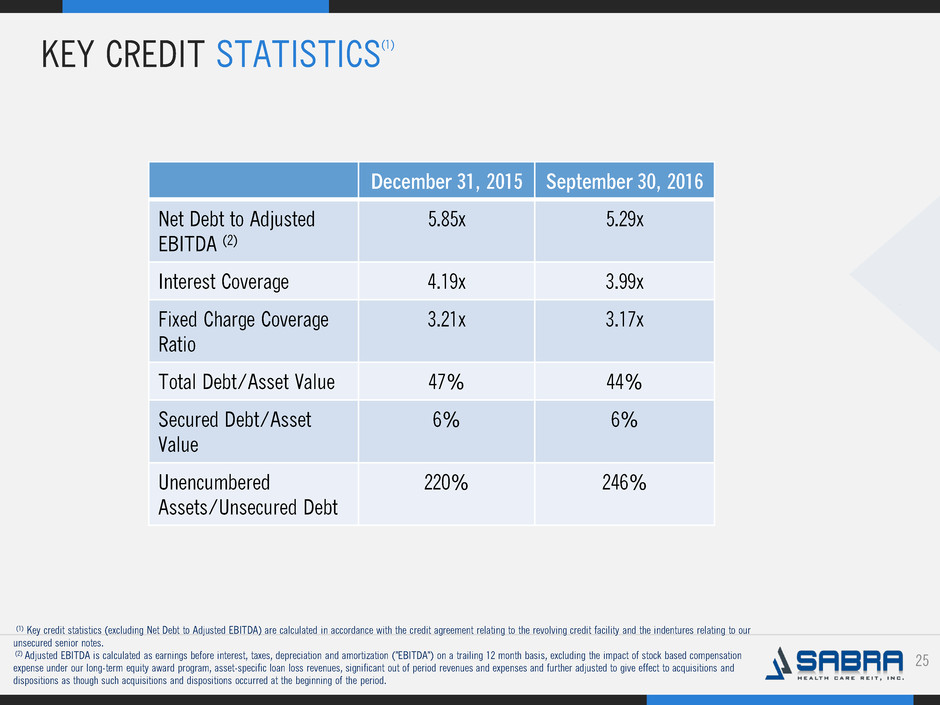
KEY CREDIT STATISTICS
(1)
Option One
Option
Three
Ma December 31, 2015 September 30, 2016
Net Debt to Adjusted
EBITDA (2)
5.85x 5.29x
Interest Coverage 4.19x 3.99x
Fixed Charge Coverage
Ratio
3.21x 3.17x
Total Debt/Asset Value 47% 44%
Secured Debt/Asset
Value
6% 6%
Unencumbered
Assets/Unsecured Debt
220% 246%
(1) Key credit statistics (excluding Net Debt to Adjusted EBITDA) are calculated in accordance with the credit agreement relating to the revolving credit facility and the indentures relating to our
unsecured senior notes.
(2) Adjusted EBITDA is calculated as earnings before interest, taxes, depreciation and amortization ("EBITDA") on a trailing 12 month basis, excluding the impact of stock based compensation
expense under our long-term equity award program, asset-specific loan loss revenues, significant out of period revenues and expenses and further adjusted to give effect to acquisitions and
dispositions as though such acquisitions and dispositions occurred at the beginning of the period.
.
26
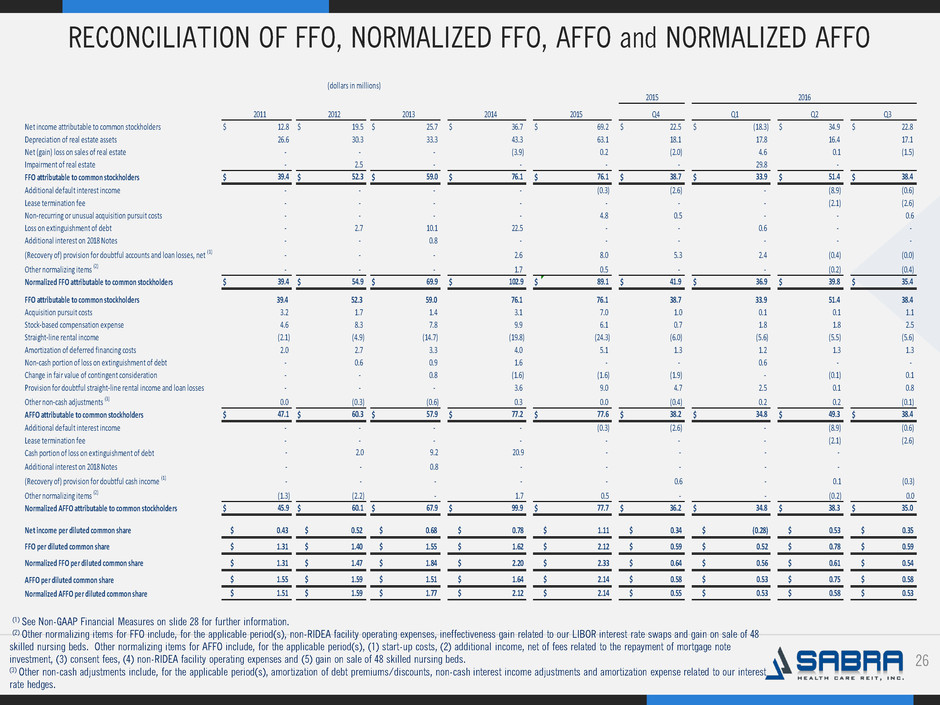
RECONCILIATION OF FFO, NORMALIZED FFO, AFFO and NORMALIZED AFFO
Option One
Option
Three
Ma
(1) See Non-GAAP Financial Measures on slide 28 for further information.
(2) Other normalizing items for FFO include, for the applicable period(s), non-RIDEA facility operating expenses, ineffectiveness gain related to our LIBOR interest rate swaps and gain on sale of 48
skilled nursing beds. Other normalizing items for AFFO include, for the applicable period(s), (1) start-up costs, (2) additional income, net of fees related to the repayment of mortgage note
investment, (3) consent fees, (4) non-RIDEA facility operating expenses and (5) gain on sale of 48 skilled nursing beds.
(3) Other non-cash adjustments include, for the applicable period(s), amortization of debt premiums/discounts, non-cash interest income adjustments and amortization expense related to our interest
rate hedges.
2016
2011 2012 2013 2014 2015 Q4 Q1 Q2 Q3
Net income attributable to common stockholders $ 12.8 $ 19.5 $ 25.7 $ 36.7 $ 69.2 $ 22.5 $ (18.3) $ 34.9 $ 22.8
Depreciation of real estate assets 26.6 30.3 33.3 43.3 63.1 18.1 17.8 16.4 17.1
Net (gain) loss on sales of real estate - - - (3.9) 0.2 (2.0) 4.6 0.1 (1.5)
Impairment of real estate - 2.5 - - - - 29.8 -
FFO attributable to common stockholders $ 39.4 $ 52.3 $ 59.0 $ 76.1 $ 76.1 $ 38.7 $ 33.9 $ 51.4 $ 38.4
Additional default interest income - - - - (0.3) (2.6) - (8.9) (0.6)
Lease termination fee - - - - - - - (2.1) (2.6)
Non-recurring or unusual acquisition pursuit costs - - - - 4.8 0.5 - - 0.6
Loss on extinguishment of debt - 2.7 10.1 22.5 - - 0.6 - -
Additional interest on 2018 Notes - - 0.8 - - - - - -
(Recovery of) provision for doubtful accounts and loan losses, net (1) - - - 2.6 8.0 5.3 2.4 (0.4) (0.0)
Other normalizing items (2) - - - 1.7 0.5 - - (0.2) (0.4)
Normalized FFO attributable to common stockholders $ 39.4 $ 54.9 $ 69.9 $ 102.9 $ 89.1 $ 41.9 $ 36.9 $ 39.8 $ 35.4
FFO attributable to common stockholders 39.4 52.3 59.0 76.1 76.1 38.7 33.9 51.4 38.4
Acquisition pursuit costs 3.2 1.7 1.4 3.1 7.0 1.0 0.1 0.1 1.1
Stock-based compensation expense 4.6 8.3 7.8 9.9 6.1 0.7 1.8 1.8 2.5
Straight-line rental income (2.1) (4.9) (14.7) (19.8) (24.3) (6.0) (5.6) (5.5) (5.6)
Amortization of deferred financing costs 2.0 2.7 3.3 4.0 5.1 1.3 1.2 1.3 1.3
Non-cash portion of loss on extinguishment of debt - 0.6 0.9 1.6 - - 0.6 - -
Change in fair value of contingent consideration - - 0.8 (1.6) (1.6) (1.9) - (0.1) 0.1
Provision for doubtful straight-line rental income and loan losses - - - 3.6 9.0 4.7 2.5 0.1 0.8
Other non-cash adjustments (3) 0.0 (0.3) (0.6) 0.3 0.0 (0.4) 0.2 0.2 (0.1)
AFFO attributable to common stockholders $ 47.1 $ 60.3 $ 57.9 $ 77.2 $ 77.6 $ 38.2 $ 34.8 $ 49.3 $ 38.4
Additional default interest income - - - - (0.3) (2.6) - (8.9) (0.6)
Lease termination fee - - - - - - - (2.1) (2.6)
Cash portion of loss on extinguishment of debt - 2.0 9.2 20.9 - - - -
Additional interest on 2018 Notes - - 0.8 - - - - -
(Recovery of) provision for doubtful cash income (1) - - - - - 0.6 - 0.1 (0.3)
Other normalizing items (2) (1.3) (2.2) - 1.7 0.5 - - (0.2) 0.0
Normalized AFFO attributable to common stockholders $ 45.9 $ 60.1 $ 67.9 $ 99.9 $ 77.7 $ 36.2 $ 34.8 $ 38.3 $ 35.0
Net income per diluted common share $ 0.43 $ 0.52 $ 0.68 $ 0.78 $ 1.11 $ 0.34 $ (0.28) $ 0.53 $ 0.35
FFO per diluted common share $ 1.31 $ 1.40 $ 1.55 $ 1.62 $ 2.12 $ 0.59 $ 0.52 $ 0.78 $ 0.59
N rmalized FFO per diluted common share $ 1.31 $ 1.47 $ 1.84 $ 2.20 $ 2.33 $ 0.64 $ 0.56 $ 0.61 $ 0.54
AFFO per diluted common share $ 1.55 $ 1.59 $ 1.51 $ 1.64 $ 2.14 $ 0.58 $ 0.53 $ 0.75 $ 0.58
Normalized AFFO per diluted common share $ 1.51 $ 1.59 $ 1.77 $ 2.12 $ 2.14 $ 0.55 $ 0.53 $ 0.58 $ 0.53
(dollars in millions)
2015

.
27
FORWARD LOOKING STATEMENTS
Option One
Option
Three
Ma
This presentation contains “forward-looking” statements that may be identified, without limitation, by the use of “expects,” “believes,” “intends,” “should” or comparable terms or the negative
thereof. Forward-looking statements in this presentation also include all statements regarding expected future financial position, results of operations, cash flows, liquidity, financing plans,
business strategy, the expected amounts and timing of dividends, projected expenses and capital expenditures, competitive position, growth opportunities and potential investments, plans
and objectives for future operations and compliance with and changes in governmental regulations. These statements are made as of the date hereof and are subject to known and unknown
risks, uncertainties, assumptions and other factors—many of which are out of the Company’s control and difficult to forecast—that could cause actual results to differ materially from those
set forth in or implied by our forward-looking statements. These risks and uncertainties include but are not limited to: our dependence on Genesis Healthcare, Inc. (“Genesis”) and certain
wholly owned subsidiaries of Holiday AL Holdings LP (collectively, “Holiday”) until we are able to further diversify our portfolio; our dependence on the operating success of our tenants; the
significant amount of and our ability to service our indebtedness; covenants in our debt agreements that may restrict our ability to pay dividends, make investments, incur additional
indebtedness and refinance indebtedness on favorable terms; increases in market interest rates; changes in foreign currency exchange rates; our ability to raise capital through equity and
debt financings; the impact of required regulatory approvals of transfers of healthcare properties; the effect of increasing healthcare regulation and enforcement on our tenants and the
dependence of our tenants on reimbursement from governmental and other third-party payors; the relatively illiquid nature of real estate investments; competitive conditions in our industry;
the loss of key management personnel or other employees; the impact of litigation and rising insurance costs on the business of our tenants; the effect of our tenants declaring bankruptcy or
becoming insolvent; uninsured or underinsured losses affecting our properties and the possibility of environmental compliance costs and liabilities; the ownership limits and anti-takeover
defenses in our governing documents and Maryland law, which may restrict change of control or business combination opportunities; the impact of a failure or security breach of information
technology in our operations; our ability to find replacement tenants and the impact of unforeseen costs in acquiring new properties; our ability to maintain our status as a REIT; compliance
with REIT requirements and certain tax and tax regulatory matters related to our status as a REIT; and other factors discussed from time to time in our news releases, public statements
and/or filings with the Securities and Exchange Commission (the “SEC”), especially the “Risk Factors” sections of our Annual and Quarterly Reports on Forms 10-K and 10-Q. Forward-
looking statements made in this presentation are not guarantees of future performance, events or results, and you should not place undue reliance on these forward-looking statements,
which speak only as of the date hereof. The Company assumes no, and hereby disclaims any, obligation to update any of the foregoing or any other forward-looking statements as a result of
new information or new or future developments, except as otherwise required by law.
TENANT AND BORROWER INFORMATION
This presentation includes information regarding certain of our tenants that lease properties from us and our borrowers, most of which are not subject to SEC reporting requirements.
Genesis is subject to the reporting requirements of the SEC and is required to file with the SEC annual reports containing audited financial information and quarterly reports containing
unaudited financial information. The information related to our tenants and borrowers that is provided in this presentation has been provided by such tenants and borrowers. We have not
independently verified this information. We have no reason to believe that such information is inaccurate in any material respect. We are providing this data for informational purposes only.
Genesis’s filings with the SEC can be found at www.sec.gov.
.
28
NON-GAAP FINANCIAL MEASURES
Option One
Option
Three
Ma
This presentation includes the following financial measures defined as non-GAAP financial measures by the SEC: funds from operations attributable to common stockholders (“FFO”),
Normalized FFO, Adjusted FFO (“AFFO”), Normalized AFFO, FFO per diluted common share, Normalized FFO per diluted common share, AFFO per diluted common share, Normalized AFFO
per diluted common share and Adjusted EBITDA (defined below). These measures may be different than non-GAAP financial measures used by other companies and the presentation of these
measures is not intended to be considered in isolation or as a substitute for financial information prepared and presented in accordance with U.S. generally accepted accounting principles.
FFO is calculated in accordance with The National Association of Real Estate Investment Trusts’ definition of “funds from operations,” and is defined as net income attributable to common
stockholders (computed in accordance with GAAP), excluding gains or losses from real estate dispositions, plus real estate depreciation and amortization and real estate impairment charges.
Normalized FFO and normalized AFFO represent FFO and AFFO, respectively, adjusted for certain income and expense items that the Company does not believe are indicative of its ongoing
operating results. The Company considers normalized FFO and normalized AFFO to be useful measures to evaluate the Company’s operating results excluding these income and expense
items. AFFO is defined as FFO excluding straight-line rental income adjustments, stock-based compensation expense, amortization of deferred financing costs, acquisition pursuit costs, as
well as other non-cash revenue and expense items (including provisions and write-offs related to straight-line rental income, provision for loan losses, changes in fair value of contingent
consideration, amortization of debt premiums/discounts and non-cash interest income adjustments). Prior to the third quarter of 2015, the Company normalized 100% of straight-line rental
income write-offs. In the third quarter of 2015, Sabra established a policy for normalizing write-offs and provisions for doubtful accounts to the extent in excess of any rental or interest
income recognized during the period presented. The amounts for prior periods have been revised to conform to the current presentation.
Earnings before interest, taxes, depreciation and amortization ("EBITDA") excluding the impact of stock-based compensation expense under the Company's long-term equity award program,
asset specific loan loss reserves, significant out of period revenues and expenses, and further adjusted to give effect to acquisitions and dispositions as though such acquisitions and
dispositions occurred at the beginning of the period ("Adjusted EBITDA") is an important non-GAAP supplemental measure of operating performance.
Reconciliations of these non-GAAP financial measures to the GAAP financial measures we consider most comparable are provided in the reconciliations found in the Appendix of this
presentation.
.
29
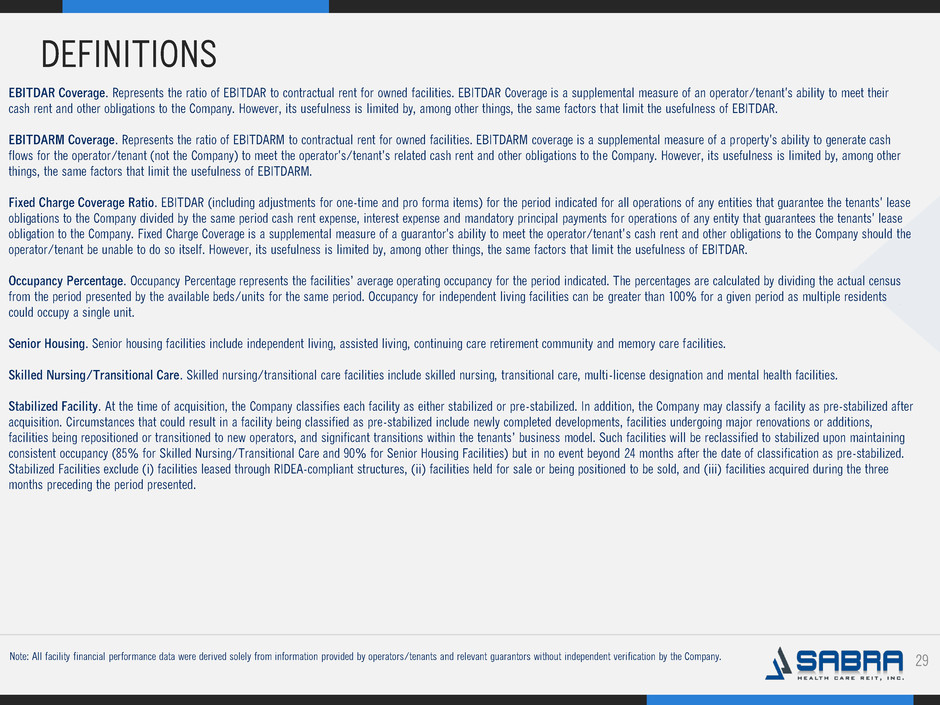
DEFINITIONS
Option One
Option
Three
Ma
EBITDAR Coverage. Represents the ratio of EBITDAR to contractual rent for owned facilities. EBITDAR Coverage is a supplemental measure of an operator/tenant's ability to meet their
cash rent and other obligations to the Company. However, its usefulness is limited by, among other things, the same factors that limit the usefulness of EBITDAR.
EBITDARM Coverage. Represents the ratio of EBITDARM to contractual rent for owned facilities. EBITDARM coverage is a supplemental measure of a property's ability to generate cash
flows for the operator/tenant (not the Company) to meet the operator's/tenant's related cash rent and other obligations to the Company. However, its usefulness is limited by, among other
things, the same factors that limit the usefulness of EBITDARM.
Fixed Charge Coverage Ratio. EBITDAR (including adjustments for one-time and pro forma items) for the period indicated for all operations of any entities that guarantee the tenants' lease
obligations to the Company divided by the same period cash rent expense, interest expense and mandatory principal payments for operations of any entity that guarantees the tenants' lease
obligation to the Company. Fixed Charge Coverage is a supplemental measure of a guarantor's ability to meet the operator/tenant's cash rent and other obligations to the Company should the
operator/tenant be unable to do so itself. However, its usefulness is limited by, among other things, the same factors that limit the usefulness of EBITDAR.
Occupancy Percentage. Occupancy Percentage represents the facilities’ average operating occupancy for the period indicated. The percentages are calculated by dividing the actual census
from the period presented by the available beds/units for the same period. Occupancy for independent living facilities can be greater than 100% for a given period as multiple residents
could occupy a single unit.
Senior Housing. Senior housing facilities include independent living, assisted living, continuing care retirement community and memory care facilities.
Skilled Nursing/Transitional Care. Skilled nursing/transitional care facilities include skilled nursing, transitional care, multi-license designation and mental health facilities.
Stabilized Facility. At the time of acquisition, the Company classifies each facility as either stabilized or pre-stabilized. In addition, the Company may classify a facility as pre-stabilized after
acquisition. Circumstances that could result in a facility being classified as pre-stabilized include newly completed developments, facilities undergoing major renovations or additions,
facilities being repositioned or transitioned to new operators, and significant transitions within the tenants’ business model. Such facilities will be reclassified to stabilized upon maintaining
consistent occupancy (85% for Skilled Nursing/Transitional Care and 90% for Senior Housing Facilities) but in no event beyond 24 months after the date of classification as pre-stabilized.
Stabilized Facilities exclude (i) facilities leased through RIDEA-compliant structures, (ii) facilities held for sale or being positioned to be sold, and (iii) facilities acquired during the three
months preceding the period presented.
Note: All facility financial performance data were derived solely from information provided by operators/tenants and relevant guarantors without independent verification by the Company.
Serious News for Serious Traders! Try StreetInsider.com Premium Free!
You May Also Be Interested In
- Festi hf.: Financial results for Q1 2024
- LNG Energy Group Announces Signing of Contracts
- ZEN IN THE CITY: PENTHOUSE AT I.M. PEI & PEI PARTNERSHIP ARCHITECTS CONDO MARRIES EAST AND WEST
Create E-mail Alert Related Categories
SEC FilingsSign up for StreetInsider Free!
Receive full access to all new and archived articles, unlimited portfolio tracking, e-mail alerts, custom newswires and RSS feeds - and more!


 Tweet
Tweet Share
Share