Form 8-K SPARTON CORP For: Nov 10
UNITED STATES
SECURITIES AND EXCHANGE COMMISSION
WASHINGTON, D.C. 20549
FORM 8-K
CURRENT REPORT
Pursuant to Section 13 or 15(d)
of the Securities Exchange Act of 1934
Date of Report (Date of earliest event reported): November 10, 2015
SPARTON CORPORATION
(Exact Name of Registrant as Specified in its Charter)
| Ohio | 1-1000 | 38-1054690 | ||
| (State or other jurisdiction of incorporation) |
(Commission File Number) |
(IRS Employer Identification No.) |
| 425 Martingale Road Suite 1000 Schaumburg, Illinois |
60173-2213 | |
| (Address of Principal Executive Offices) | (Zip Code) |
Registrant’s telephone number, including area code: (800) 772-7866
NA
(Former Name or former address, if changed since last report)
Check the appropriate box below if the Form 8-K filing is intended to simultaneously satisfy the filing obligation of the registrant under any of the following provisions:
| ¨ | Written communications pursuant to Rule 425 under the Securities Act (17 CFR 230.425) |
| ¨ | Soliciting material pursuant to Rule 14a-12 under the Exchange Act (17 CFR 240.14a-12) |
| ¨ | Pre-commencement communications pursuant to Rule 14d-2(b) under the Exchange Act (17 CFR 240.14d-2(b)) |
| ¨ | Pre-commencement communications pursuant to Rule 13e-4(c) under the Exchange Act (17 CFR 240.13e-4(c)) |
| ITEM 7.01 | Regulation FD Disclosure |
Sparton Corporation, an Ohio corporation (the “Company”) is holding a call on November 10, 2015, at 10:00 a.m. Central Time to discuss its fiscal year 2016 first quarter financial results, provide a general business update and respond to investor questions. Interested parties may participate in the conference call by dialing (800) 728-2056 at least ten minutes before the call is scheduled to begin.
While the Company has not recently filed a script or slides for earnings release conference calls it is furnishing the attached for its first call after the start of the new fiscal year timeline.
A Web presentation link is also available for the conference call:
https://tinyurl.com/oc59282 (no entry code)
Investors and financial analysts are invited to ask questions after the presentation is made. The script for the call is attached as Exhibit 99.1 and the slide presentation is attached as Exhibit 99.2, and are incorporated herein by reference. The slide presentation and a replay of the live conference call, including all questions and answers, will be available on the Company’s website at www.sparton.com under the heading “Investor Relations” for a period of up to two (2) years after the date of the live call.
The information set forth herein, including Exhibits 99.1 and 99.2, is furnished pursuant to Item 7.01—Regulation FD Disclosure and shall not be deemed “filed” for purposes of Section 18 of the Securities Exchange Act of 1934, as amended, or otherwise subject to the liabilities of such section nor shall the information be deemed incorporated by reference in any filing of the Company, except as shall be expressly set forth by specific reference in such filing.
Item 9.01 Financial Statements and Exhibits
(d) Exhibits
| Exhibit 99.1 | Script for conference call dated November 10, 2015 | |
| Exhibit 99.2 | Slide Presentation for conference call dated November 10, 2015 | |
SIGNATURES
Pursuant to the requirements of the Securities Exchange Act of 1934, the registrant has duly caused this report to be signed on its behalf by the undersigned thereunto duly authorized.
| SPARTON CORPORATION | ||||||||
| Dated: | November 10, 2015 | By: | /s/ Cary B. Wood | |||||
| Cary B. Wood, President and Chief Executive Officer | ||||||||
Index to Exhibits
Item 9.01 Financial Statements and Exhibits
| Exhibit No. |
Description | |
| Exhibit 99.1 | Script for conference call dated November 10, 2015 | |
| Exhibit 99.2 | Slide Presentation for conference call dated November 10, 2015 | |
Exhibit 99.1
Sparton Corporation
Fiscal 2016 First Quarter Financial Results
November 10, 2015
Conference Call Talking Points
{Slide 1 – Cover Page}
MIKE OSBORNE (Sr. VP – Corporate Development) SPEAKS
Thank you operator. Good morning and thank you for participating in Sparton’s fiscal 2016 first quarter financial results conference call.
On the call with me today are Cary Wood, Sparton’s Chief Executive Officer; and Joe McCormack, Chief Financial Officer. Our earnings release and the slide presentation for today’s call are available in the Investor section of our website.
{Slide 2 – Safe Harbor Statement}
Before we start, a word of caution; during this call we will be making forward-looking statements within the meaning of the Private Securities Litigation Reform Act. Investors are cautioned that forward-looking statements are inherently uncertain and that there are a number of factors that could cause actual results that differ materially from these statements. These factors are outlined in our SEC filings. Consistent with prior quarters we will utilize the one question-one follow-up rule today in order to keep the call to an hour. Thank you in advance for following this practice.
{Slide 3 – Today’s Agenda}
I’d like to turn the call over to Cary.
{Slide 4 – 1st Quarter Business Review}
Thanks Mike. Good morning and welcome to our fiscal 2016 first quarter conference call.
From a consolidated perspective, we are pleased with the financial results in the first quarter:
| • | Overall revenue growth was 39% in the quarter and organic growth in the legacy business was 7% over last year first quarter |
| • | The organic growth realized in the first quarter was due to the strength of the ECP segment, in particular our sonobuoy and rugged electronics businesses, which positively offset revenue declines within the MDS segment. |
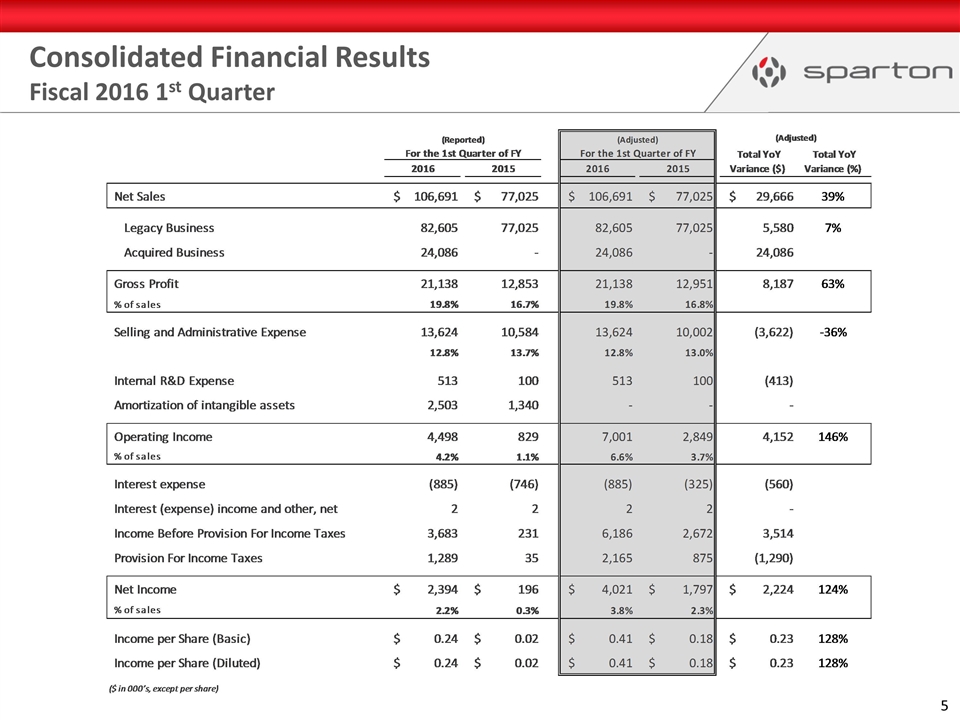
| • | Based on the way we have previously accounted for the non-GAAP adjustments, income per share would be $0.24 versus $0.09 from the prior year first quarter which beat the street consensus of $0.16. |
| • | However, starting with this quarter, we will be excluding acquisition-related amortization in the adjusted earnings per share results going forward. This non-cash line item has had a significant impact on our operating results in recent years and this change presents a clearer picture of the Company’s earnings power and cash generation capability. With this change now in place, the adjusted income per share is $0.41 as compared to $0.18 for the prior year first quarter. |
| Sparton Corporation |
FY16 1st Quarter Financial Results Conference Call Talking Points FINAL 11-10-15 | Page 2 |
Some of the additional first quarter highlights were:
| • | 240 new program or product wins were awarded with a first time revenue potential of $24 million as compared to 78 new product or program wins with a first time revenue potential of $16 million in the prior year first quarter. |
| • | Of that, 100 wins were realized in the MDS segment with a first time revenue potential of $11 million versus 10 wins in last year’s first quarter with a first time revenue potential of $8 million. |
| • | 140 wins occurred in the ECP segment with first time revenue potential of $13 million versus 68 program wins with a first time revenue potential of $8 million in the prior year first quarter. |
| • | Quarter end sales backlog was $277 million, representing a 14% increase over the prior year first quarter. |
| • | Total sales to the U.S. Navy increased to $25 million from $18 million in the prior year first quarter and sonobuoy sales to foreign governments increased to $4 million from $1 million a year ago. |
| • | Consolidated gross margin was strong at 19.8% as compared to the 16.7% in the prior year first quarter. |
Joe will now walk through the financial details of the quarter.
Thanks Cary.
| Sparton Corporation |
FY16 1st Quarter Financial Results Conference Call Talking Points FINAL 11-10-15 | Page 3 |
{Slide 5 – Consolidated Results}
Compared to the first quarter of the prior year:
| • | Sales were up 39% to $107 million. The increase in sales includes $24 million in revenue from recently-acquired companies and $6 million in revenue growth from legacy businesses. |
| • | Our gross profit margin increased from 16.7% to 19.8% driven by pricing discipline, operational improvements in our MDS segment, and favorable mix in our ECP segment. |
| • | Selling, General & Administrative expenses increased $3 million but, as a percentage of sales, decreased from 13.7% to 12.8%. The increase in SG&A on a dollar basis was due to acquired companies in the prior year. The improvement in SG&A as a percentage of sales was due to headcount reductions, cost containment initiatives, and a decrease in M&A-related expenses. |
| • | On an adjusted basis, net income increased from $2 million to $4 million. |
{Slide 6 – EBITDA Walk}
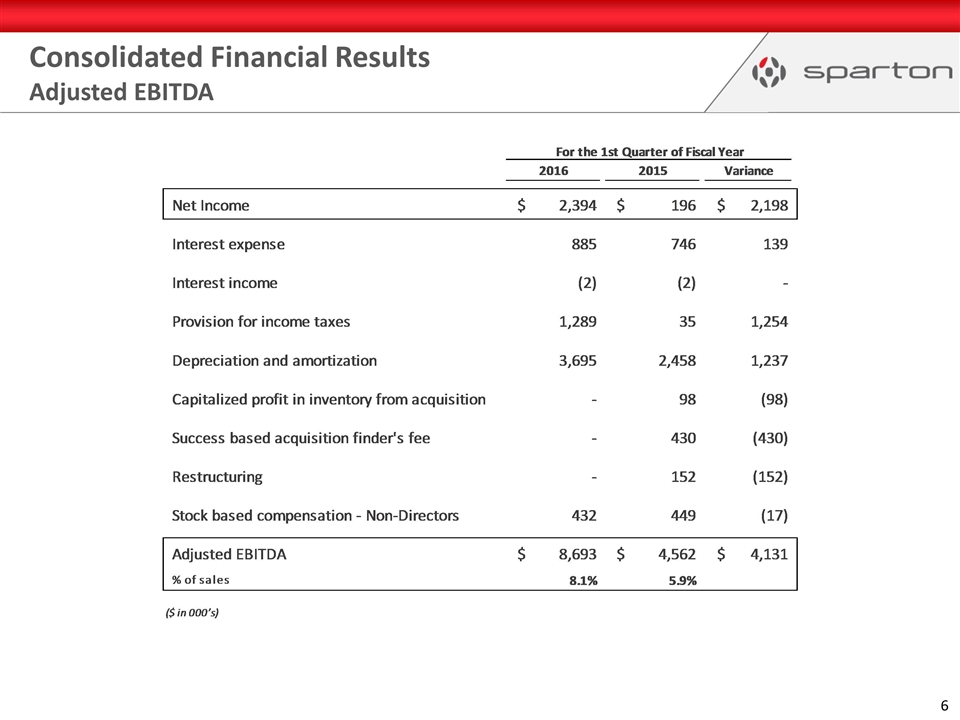
| • | EBITDA, on an adjusted basis, was $9 million representing an 8.1% EBITDA margin, compared to $5 million and a 5.9% margin for the same quarter a year ago. |
{Slide 7 – MDS Segment Reporting}
| • | In our MDS segment: |
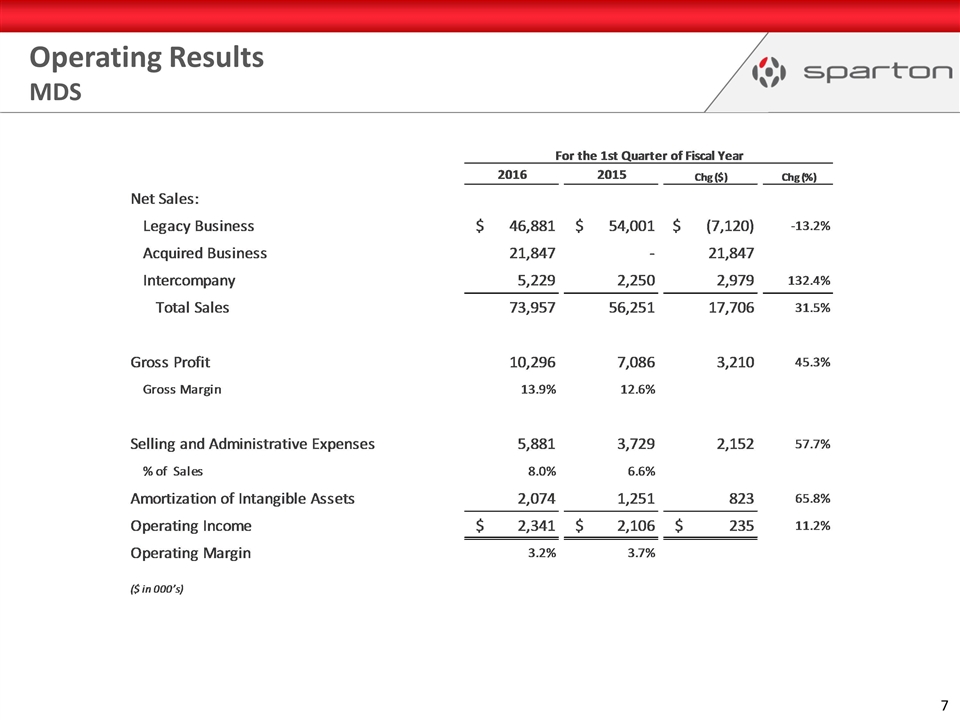
| • | Total sales increased 32%, which included $22 million of revenue from recently acquired companies. |
| Sparton Corporation |
FY16 1st Quarter Financial Results Conference Call Talking Points FINAL 11-10-15 | Page 4 |
| • | Revenues from legacy businesses decreased $7 million or 13%. This decrease was due to declines in overall customer demand as a result of certain programs going end-of-life, customer delays or outright cancellations, and customer’s managing their working capital to match end-market demands. |
| • | The gross profit margin for the segment increased from 12.6% to 13.9%. |
| • | Selling, General & Administrative expenses increased $2 million and amortization expense increased $823 thousand as a result of the acquisitions of Real Time Enterprises and Hunter Technology. |
{Slide 8 – ECP Segment Reporting}
| • | In our ECP segment: |
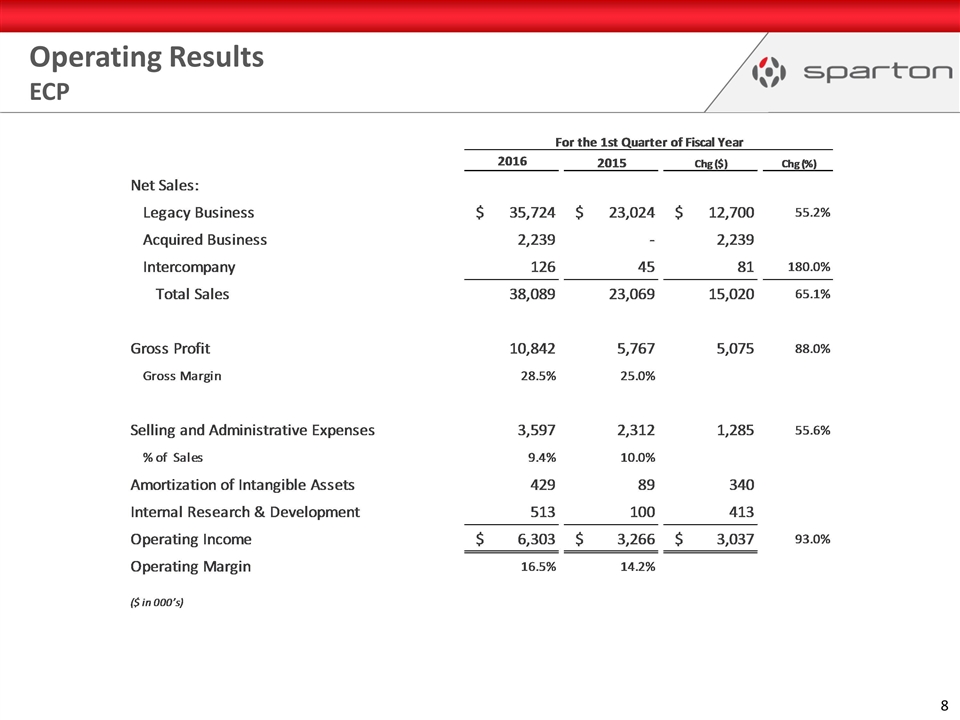
| • | Total sales increased 65%, which included $2 million of revenue from stealth.com. |
| • | Revenues from legacy businesses increased $13 million or 55%, with every ECP platform contributing to that growth. |
| • | The increases were due to increased sonobuoy sales to the U.S. Navy of $3 million, increased foreign sonobuoy sales of $3 million, $4 million of increased engineering sales, and an increase of $3 million in the rugged electronics platform. |
| • | The gross profit margin for the segment increased from 25.0% to 28.5% due to enhanced margin product mix, including higher margins from our rugged electronics platform and foreign sonobuoys, as well as increased domestic sonobuoy volume. |
| Sparton Corporation |
FY16 1st Quarter Financial Results Conference Call Talking Points FINAL 11-10-15 | Page 5 |
| • | Selling, General & Administrative expenses increased $1 million and amortization expense increased to $340 thousand as a result of the acquisitions of IED, Argotec, KEP Marine, and Stealth.com. |
{Slide 9 – Liquidity and Capital Resources}
| • | With respect to liquidity and capital resources, the Company ended the quarter with: |
| • | $2 million in cash |
| • | $139 million in debt |
| • | The debt-to-EBITDA leverage ratio, as calculated under our Revolving Credit Facility, improved to 2.72x’s compared to 3.47x’s as of June 30, 2015, as a result of the improvement in operating results on a trailing twelve month basis. |
I would now like to turn it back over to Cary.
{Slide 10 – Outlook}
Thanks Joe.
| • | With fourteen acquisitions completed in the last five years, seven alone in fiscal 2015, we continue to take a short pause to allow for integration activities and other business synergies to be fully realized in the near term as well as focusing on working capital improvements and reduction in debt and leverage. |
| Sparton Corporation |
FY16 1st Quarter Financial Results Conference Call Talking Points FINAL 11-10-15 | Page 6 |
| • | Executing the 2020 Vision remains a priority, in particular, the grouping and management of product platforms for our existing product lines, as well as the identification and development of new product platforms that will support the overall business objectives. |
| • | We will continue to be prudent in our acquisition activities by seeking appropriate transactions that will advance our strategic growth plan and increase shareholder value. |
| • | We are pleased with the overall performance of the business in Q1. The continued progress in the ECP segment across all platforms is impressive, in what we continue to see as strong end-market dynamics. And within the MDS segment, there are a number of positive actions and results are taking place. |
| • | Despite the contraction in SG&A expenses as a percent of sales, we have invested in doubling the number of business development feet on the street since this time last year. This is translating into a number of positive results, such as |
| • | The total number of program wins in the quarter being up 3 times as compared to the same quarter last year. |
| • | ECP wins were up 2x in the number of programs and up almost 60% in dollars. |
| • | Programs MDS won were up 10x in number and up almost 40% in dollars |
| • | The overall new business development funnel is up 2.5 times to where it was a year ago, and |
| • | 26% of MDS wins in the quarter were engineering design programs. |
| • | These new business results have been happening all the while maintaining our pricing disciplines, and being mindful of what dynamics our customers and peers are experiencing in their respective end-market. |
| • | Although we saw a 13% pull back in MDS legacy revenues for reasons previously mentioned, we continue to drive the earnings performance in the segment by capitalizing on the synergies from our most recent acquisitions as well as other cost savings initiatives taking place across the entire Company. |
| Sparton Corporation |
FY16 1st Quarter Financial Results Conference Call Talking Points FINAL 11-10-15 | Page 7 |
| • | The result of these actions are substantiated by the increased gross margins in the quarter and comparable adjusted operating margins to the prior year quarter within the MDS segment. These results will be further enhanced by the recent decisions to close and consolidate the Lawrenceville manufacturing facility and the Irvine design center. |
| • | In the coming months, we will continue to monitor the serviceable end-markets and current customer behavior trends within the MDS segment and will determine if any other operational adjustments and/or control actions are required to mitigate any near-term margin challenges. |
Finally, we are also scheduled to present at various investor conferences and participate in a number of non-deal road shows.
| • | A non-deal road show with Sidoti in St. Louis, Milwaukee, and Detroit on November 11th and 12th |
| • | IDEAS Southwest Investors Conference in Dallas on November 18th and 19th |
| • | ROTH Capital Partners Industrials Conference in Chicago on December 15th |
| • | CJS Securities in the NYC area on January 13th |
I will now turn it back over to Mike.
{Slide 11 – Q&A}
| Sparton Corporation |
FY16 1st Quarter Financial Results Conference Call Talking Points FINAL 11-10-15 | Page 8 |
MIKE OSBORNE SPEAKS
Thank you, Cary and Joe. We will now open it up for questions. Operator, the first question please.
After questions: I would like to thank all the participants in today’s call. We apologize that we could not get to everybody’s questions. Again, today’s call, including the question and answer period, has been recorded and will be posted to our website under “Investor Relations” later today. Thank you.
| Sparton Corporation |
FY16 1st Quarter Financial Results Conference Call Talking Points FINAL 11-10-15 | Page 9 |
Fiscal 2016 1st Quarter Financial Results November 10, 2015 Exhibit 99.2
Safe Harbor Statement Certain statements herein constitute forward-looking statements within the meaning of the Securities Act of 1933, as amended and the Securities Exchange Act of 1934, as amended. When used herein, words such as “believe,” “expect,” “anticipate,” “project,” “plan,” “estimate,” “will” or “intend” and similar words or expressions as they relate to the Company or its management constitute forward-looking statements. These forward-looking statements reflect our current views with respect to future events and are based on currently available financial, economic and competitive data and our current business plans. The Company is under no obligation to, and expressly disclaims any obligation to, update or alter its forward-looking statements whether as a result of such changes, new information, subsequent events or otherwise. Actual results could vary materially depending on risks and uncertainties that may affect our operations, markets, prices and other factors. Important factors that could cause actual results to differ materially from those forward-looking statements include those contained under the heading of risk factors and in the management’s discussion and analysis contained from time-to-time in the Company’s filings with the Securities and Exchange Commission. Adjusted EBITDA and related reconciliation presented here represents earnings before interest, taxes, depreciation and amortization as adjusted for gross profit effects of capitalized profit in inventory from acquisitions, acquisition contingency settlements, certain restructuring expenses, and stock based compensation expense. The Company believes Adjusted EBITDA is commonly used by financial analysts and others in the industries in which the Company operates and, thus, provides useful information to investors. The Company does not intend, nor should the reader consider, Adjusted EBITDA an alternative to net income, net cash provided by operating activities or any other items calculated in accordance with GAAP. The Company's definition of Adjusted EBITDA may not be comparable with Adjusted EBITDA as defined by other companies. Accordingly, the measurement has limitations depending on its use.
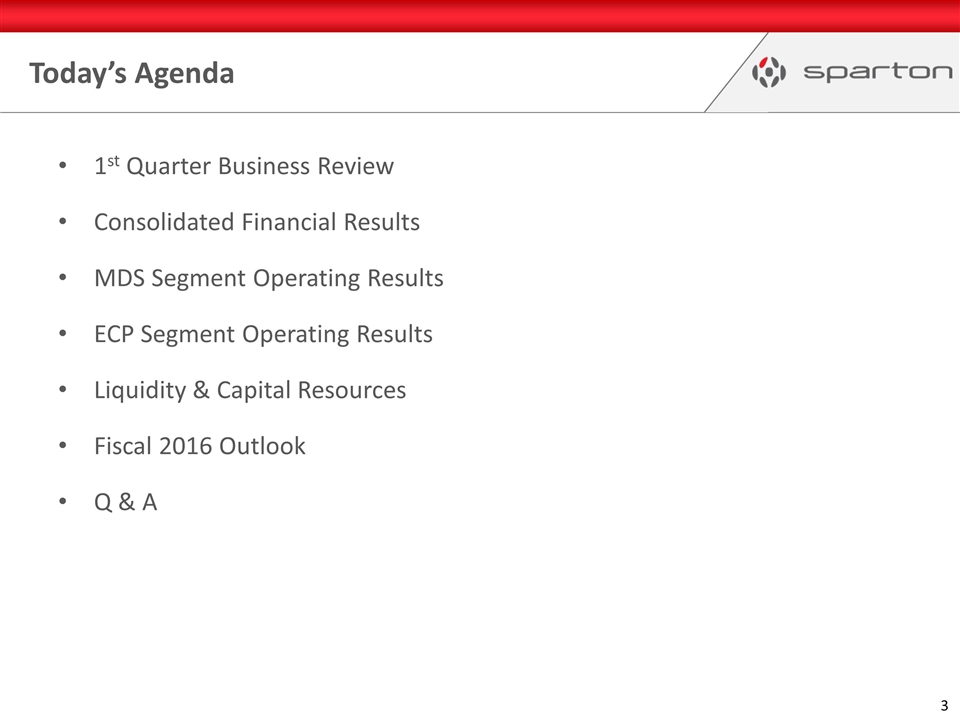
1st Quarter Business Review Consolidated Financial Results MDS Segment Operating Results ECP Segment Operating Results Liquidity & Capital Resources Fiscal 2016 Outlook Q & A Today’s Agenda
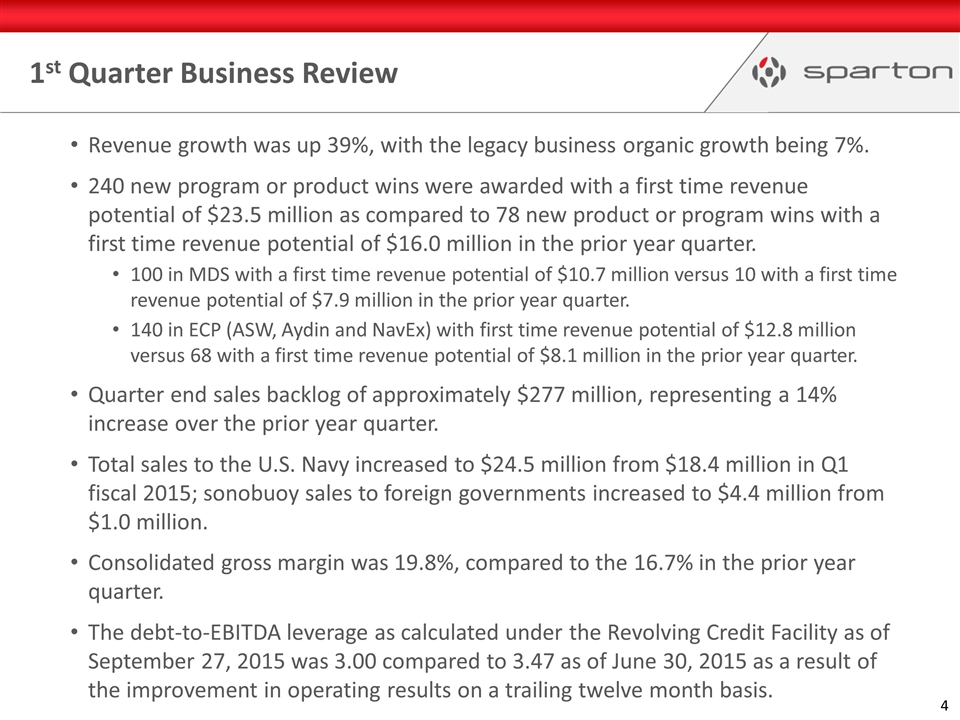
Revenue growth was up 39%, with the legacy business organic growth being 7%. 240 new program or product wins were awarded with a first time revenue potential of $23.5 million as compared to 78 new product or program wins with a first time revenue potential of $16.0 million in the prior year quarter. 100 in MDS with a first time revenue potential of $10.7 million versus 10 with a first time revenue potential of $7.9 million in the prior year quarter. 140 in ECP (ASW, Aydin and NavEx) with first time revenue potential of $12.8 million versus 68 with a first time revenue potential of $8.1 million in the prior year quarter. Quarter end sales backlog of approximately $277 million, representing a 14% increase over the prior year quarter. Total sales to the U.S. Navy increased to $24.5 million from $18.4 million in Q1 fiscal 2015; sonobuoy sales to foreign governments increased to $4.4 million from $1.0 million. Consolidated gross margin was 19.8%, compared to the 16.7% in the prior year quarter. The debt-to-EBITDA leverage as calculated under the Revolving Credit Facility as of September 27, 2015 was 3.00 compared to 3.47 as of June 30, 2015 as a result of the improvement in operating results on a trailing twelve month basis. 1st Quarter Business Review
Consolidated Financial Results Fiscal 2016 1st Quarter 5
Consolidated Financial Results Adjusted EBITDA 6
Operating Results MDS 7
Operating Results ECP 8
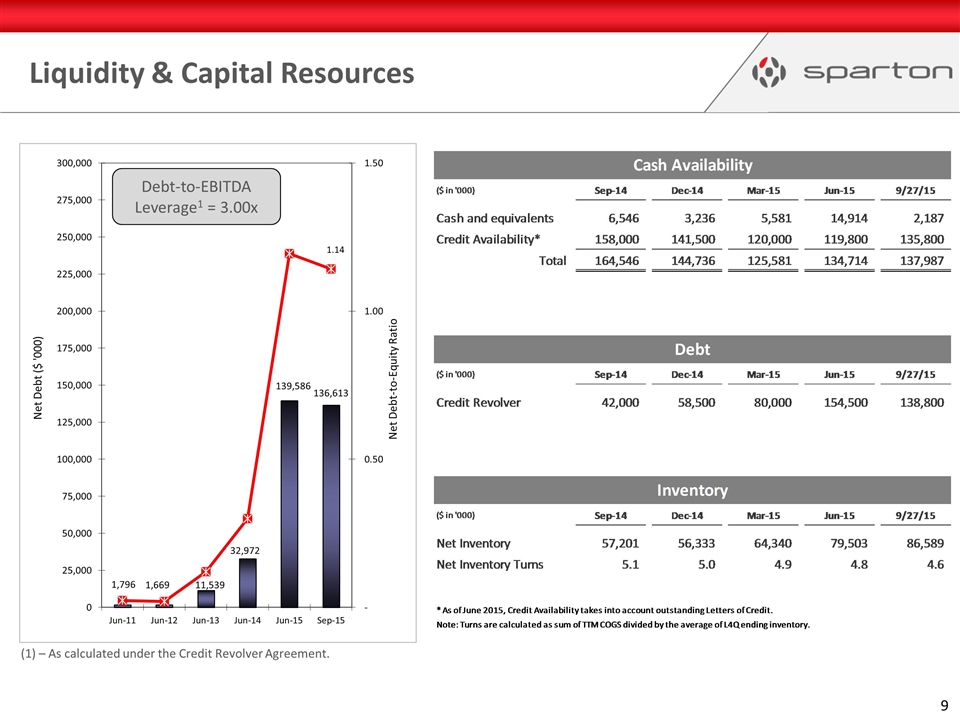
Liquidity & Capital Resources (1) – As calculated under the Credit Revolver Agreement.
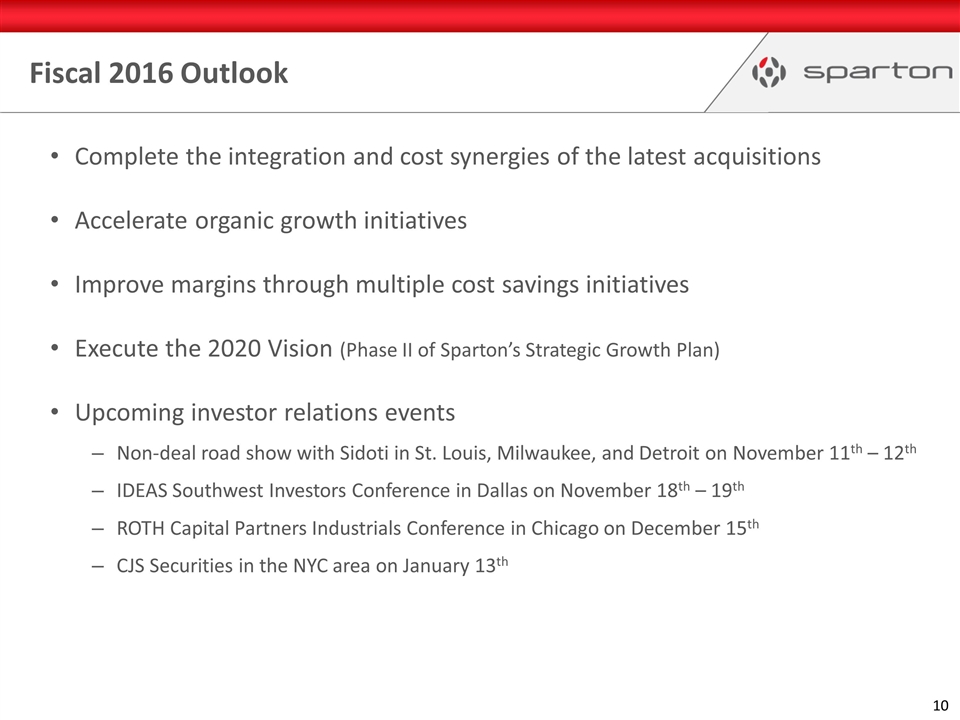
Complete the integration and cost synergies of the latest acquisitions Accelerate organic growth initiatives Improve margins through multiple cost savings initiatives Execute the 2020 Vision (Phase II of Sparton’s Strategic Growth Plan) Upcoming investor relations events Non-deal road show with Sidoti in St. Louis, Milwaukee, and Detroit on November 11th – 12th IDEAS Southwest Investors Conference in Dallas on November 18th – 19th ROTH Capital Partners Industrials Conference in Chicago on December 15th CJS Securities in the NYC area on January 13th Fiscal 2016 Outlook
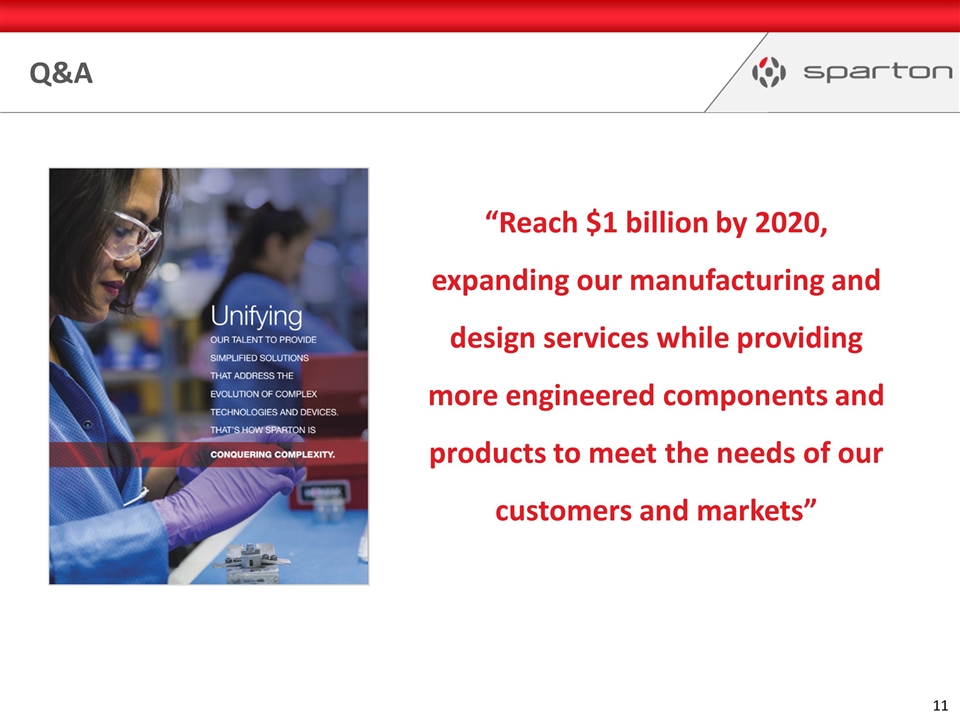
“Reach $1 billion by 2020, expanding our manufacturing and design services while providing more engineered components and products to meet the needs of our customers and markets” Q&A
Serious News for Serious Traders! Try StreetInsider.com Premium Free!
You May Also Be Interested In
- Coca-Cola Europacific Partners plc Announces Q1 Trading Update & Interim Dividend Declaration
- Prospera Energy Inc. 2024 Corporate Update
- LA Wine Country Stylish Wedding Transportation, Luxury Limousines Available
Create E-mail Alert Related Categories
SEC FilingsSign up for StreetInsider Free!
Receive full access to all new and archived articles, unlimited portfolio tracking, e-mail alerts, custom newswires and RSS feeds - and more!


 Tweet
Tweet Share
Share