Form 8-K Prologis, Inc. For: Jul 19
UNITED STATES
SECURITIES AND EXCHANGE COMMISSION
WASHINGTON, D.C. 20549
--------------
FORM 8-K
CURRENT REPORT
Pursuant to Section 13 or 15(d) of the
Securities Exchange Act of 1934
Date of Report (Date of earliest event reported): July 19, 2016
PROLOGIS, INC.
PROLOGIS, L.P.
(Exact name of registrant as specified in charter)
|
|
|
|
|
|
|
Maryland (Prologis, Inc.) |
|
001-13545 (Prologis, Inc.) |
|
94-3281941 (Prologis, Inc.) |
|
|
|
|
|
Pier 1, Bay 1, San Francisco, California |
|
94111 |
|
|
||
|
(Address of Principal Executive Offices) |
|
(Zip Code) |
Registrants’ Telephone Number, including Area Code: (415) 394-9000
N/A
(Former name or former address, if changed since last report.)
Check the appropriate box below if the Form 8-K filing is intended to simultaneously satisfy the filing obligation of the registrant under any of the following provisions (see General Instruction A.2. below):
|
o |
|
Written communications pursuant to Rule 425 under the Securities Act (17 CFR 230.425) |
|
|
|
|
|
o |
|
Soliciting material pursuant to Rule 14a-12 under the Exchange Act (17 CFR 240.14a-12) |
|
|
|
|
|
o |
|
Pre-commencement communications pursuant to Rule 14d-2(b) under the Exchange Act (17 CFR 240.14d-2(b)) |
|
|
|
|
|
o |
|
Pre-commencement communications pursuant to Rule 13e-4(c) under the Exchange Act (17 CFR 240.13e-4(c)) |
|
Item 7.01. |
Regulation FD Disclosure (Prologis, Inc. and Prologis, L.P.). |
On July 19, 2016, Prologis, Inc., the general partner of Prologis, L.P., issued a press release announcing second quarter 2016 financial results. A copy of the supplemental information as well as the press release is furnished with this report as Exhibit 99.1 and Exhibit 99.2, respectively, and is incorporated herein by reference.
The information in this report and the exhibits attached hereto is being furnished, not filed, for purposes of Section 18 of the Securities Exchange Act of 1934, as amended, and pursuant to Items 2.02 and 7.01 of Form 8-K will not be incorporated by reference into any filing under the Securities Act of 1933, as amended, unless specifically identified therein as being incorporated therein by reference.
|
Item 9.01. |
Financial Statements and Exhibits. |
(c)Exhibits
Exhibit No.Description
99.1Supplemental information, dated July 19, 2016.
99.2Press release, dated July 19, 2016.
1
SIGNATURES
Pursuant to the requirements of the Securities Exchange Act of 1934, the Registrants have duly caused this report to be signed on their behalf by the undersigned hereunto duly authorized.
|
|
|
PROLOGIS, INC. |
|
|
|
|
|
|
|
July 19, 2016 |
|
By: |
/s/ Thomas S. Olinger |
|
|
|
|
Name:Thomas S. Olinger |
|
|
|
|
Title:Chief Financial Officer |
|
|
|
PROLOGIS, L.P., |
|
|
July 19, 2016 |
|
By: Prologis, Inc., its general partner |
|
|
|
|
|
|
|
|
|
By: |
/s/ Thomas S. Olinger |
|
|
|
|
Name:Thomas S. Olinger |
|
|
|
|
Title:Chief Financial Officer |
2
Prologis Supplemental Information Unaudited Second Quarter 2016
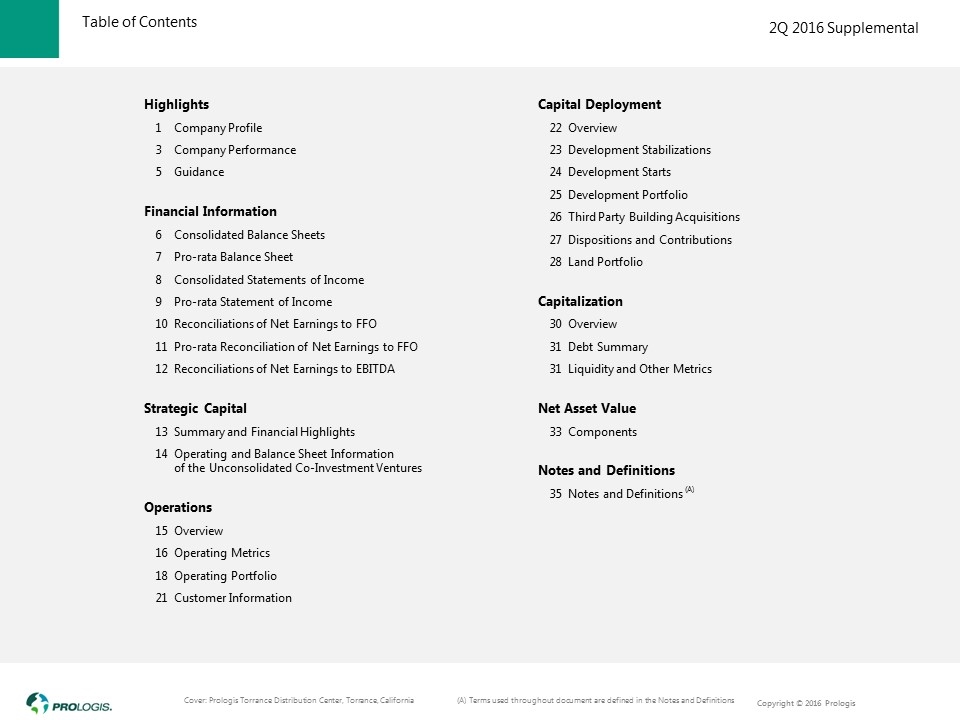
Table of Contents Highlights 1Company Profile 3Company Performance 5Guidance Financial Information 6Consolidated Balance Sheets 7Pro-rata Balance Sheet 8Consolidated Statements of Income 9Pro-rata Statement of Income 10Reconciliations of Net Earnings to FFO 11Pro-rata Reconciliation of Net Earnings to FFO 12Reconciliations of Net Earnings to EBITDA Strategic Capital 13Summary and Financial Highlights 14Operating and Balance Sheet Information of the Unconsolidated Co-Investment Ventures Operations 15Overview 16Operating Metrics 18Operating Portfolio 21Customer Information Capital Deployment 22Overview 23Development Stabilizations 24Development Starts 25Development Portfolio 26Third Party Building Acquisitions 27Dispositions and Contributions 28Land Portfolio Capitalization 30Overview 31Debt Summary 31Liquidity and Other Metrics Net Asset Value 33Components Notes and Definitions 35Notes and Definitions (A) Cover: Prologis Torrance Distribution Center, Torrance, California (A) Terms used throughout document are defined in the Notes and Definitions
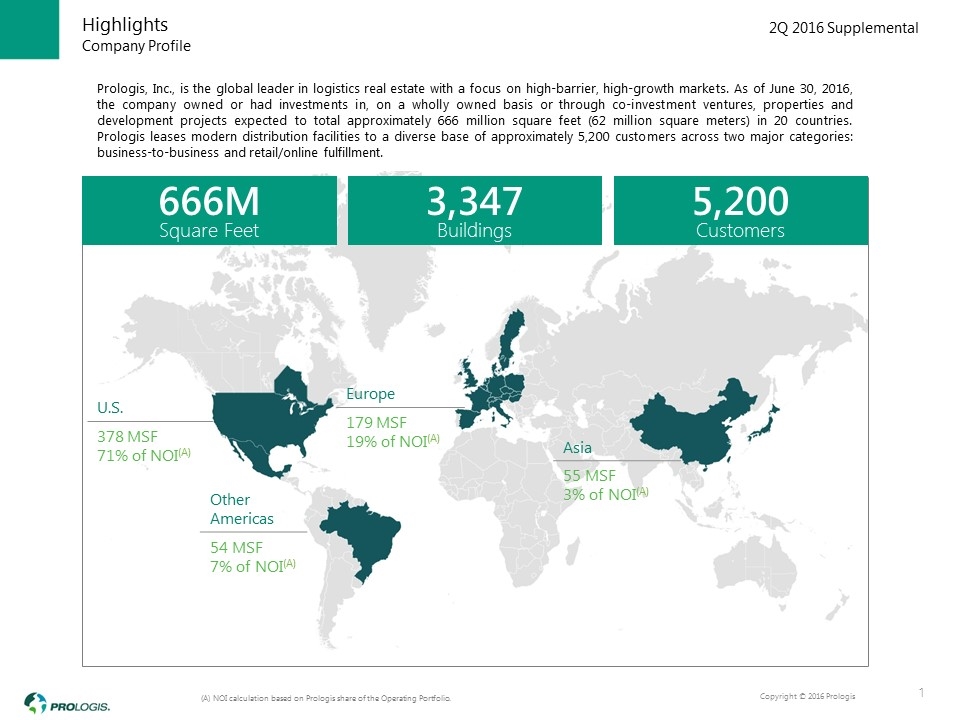
(A) NOI calculation based on Prologis share of the Operating Portfolio. Company Profile Highlights Prologis, Inc., is the global leader in logistics real estate with a focus on high-barrier, high-growth markets. As of June 30, 2016, the company owned or had investments in, on a wholly owned basis or through co-investment ventures, properties and development projects expected to total approximately 666 million square feet (62 million square meters) in 20 countries. Prologis leases modern distribution facilities to a diverse base of approximately 5,200 customers across two major categories: business-to-business and retail/online fulfillment. Asia 55 MSF 3% of NOI(A) U.S. 378 MSF 71% of NOI(A) Other Americas 54 MSF 7% of NOI(A) Europe 179 MSF 19% of NOI(A) 5,200 Customers 666M Square Feet 3,347 Buildings 1
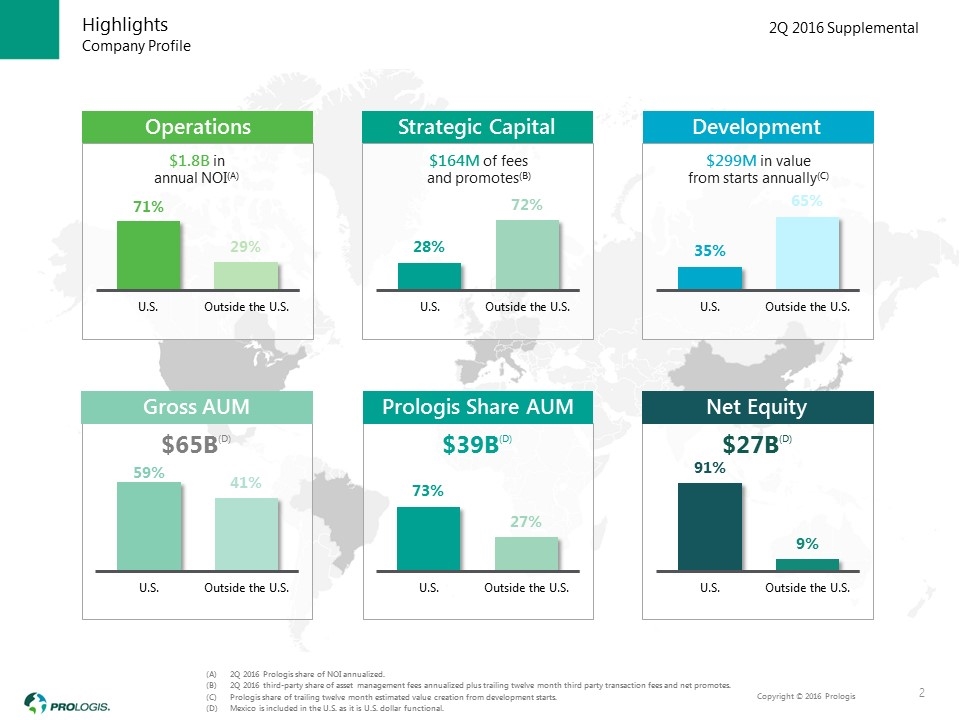
2Q 2016 Prologis share of NOI annualized. 2Q 2016 third-party share of asset management fees annualized plus trailing twelve month third party transaction fees and net promotes. Prologis share of trailing twelve month estimated value creation from development starts. Mexico is included in the U.S. as it is U.S. dollar functional. Highlights $1.8B in annual NOI(A) Operations $164M of fees and promotes(B) Strategic Capital Prologis Share AUM $39B(D) Net Equity $27B(D) Gross AUM $65B(D) 2 $299M in value from starts annually(C) Development Company Profile
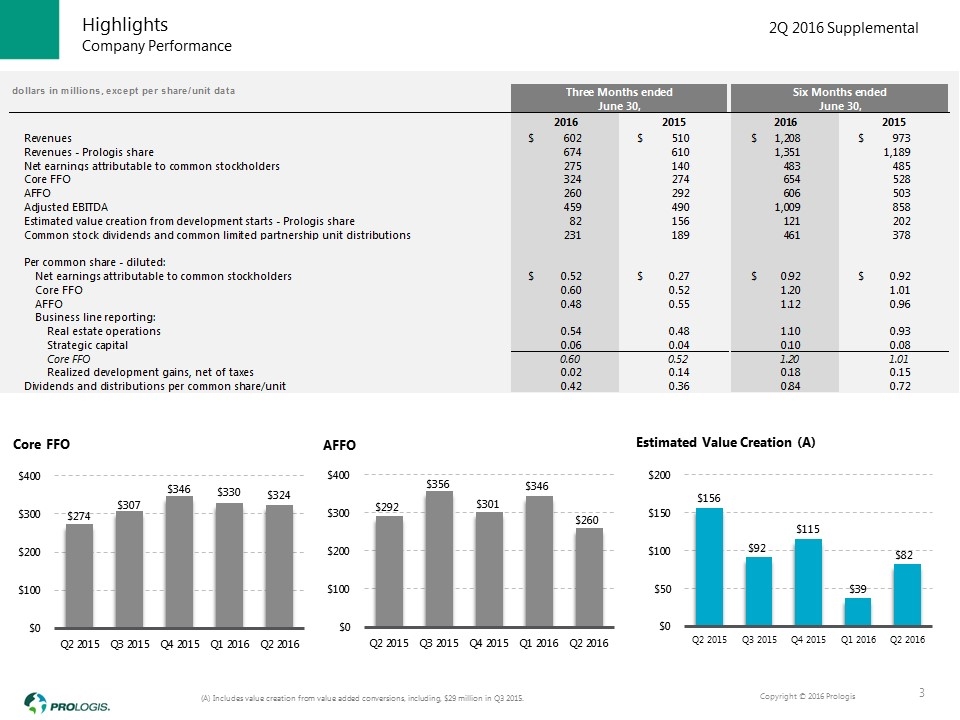
(A) Includes value creation from value added conversions, including, $29 million in Q3 2015. Company Performance Highlights 3
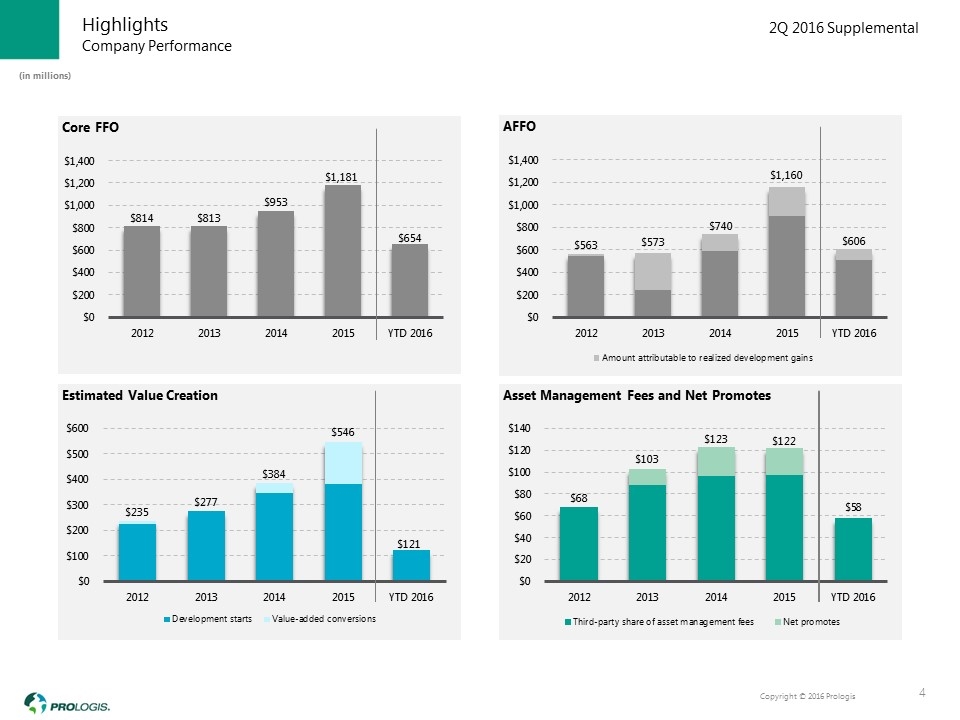
Company Performance Highlights 4 (in millions)
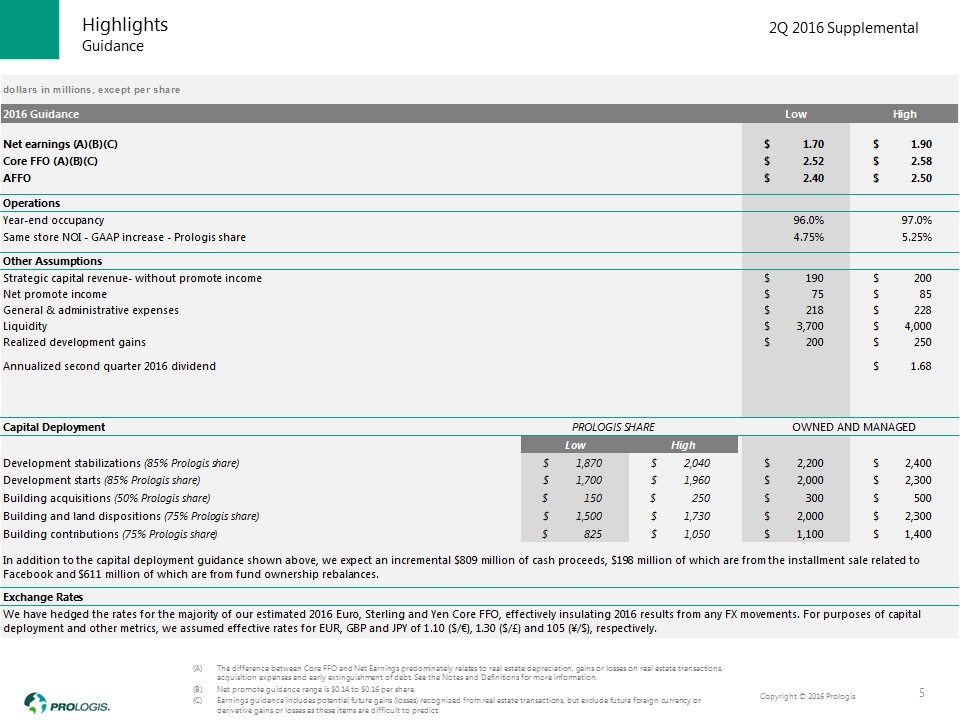
The difference between Core FFO and Net Earnings predominately relates to real estate depreciation, gains or losses on real estate transactions, acquisition expenses and early extinguishment of debt. See the Notes and Definitions for more information. Net promote guidance range is $0.14 to $0.16 per share. Earnings guidance includes potential future gains (losses) recognized from real estate transactions, but exclude future foreign currency or derivative gains or losses as these items are difficult to predict. Guidance Highlights 5
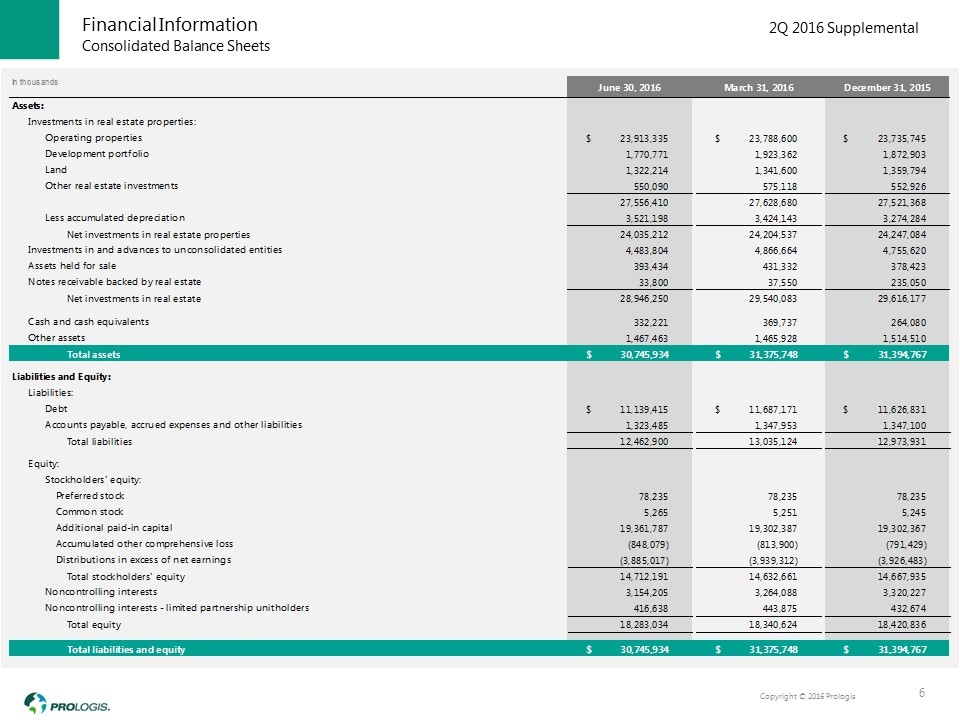
Consolidated Balance Sheets Financial Information 6
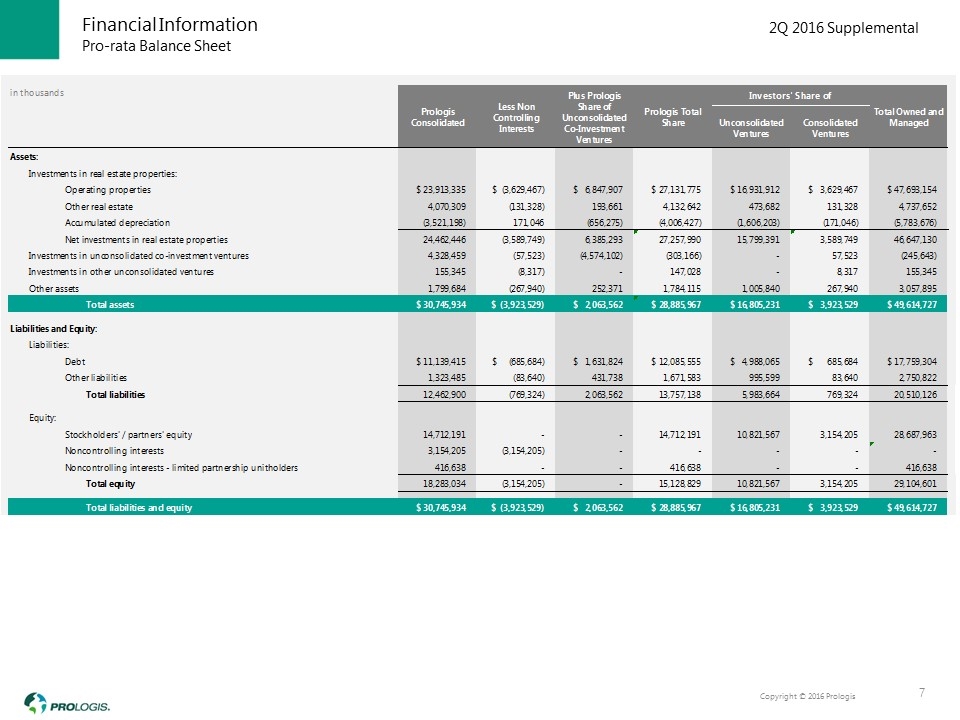
Pro-rata Balance Sheet Financial Information 7
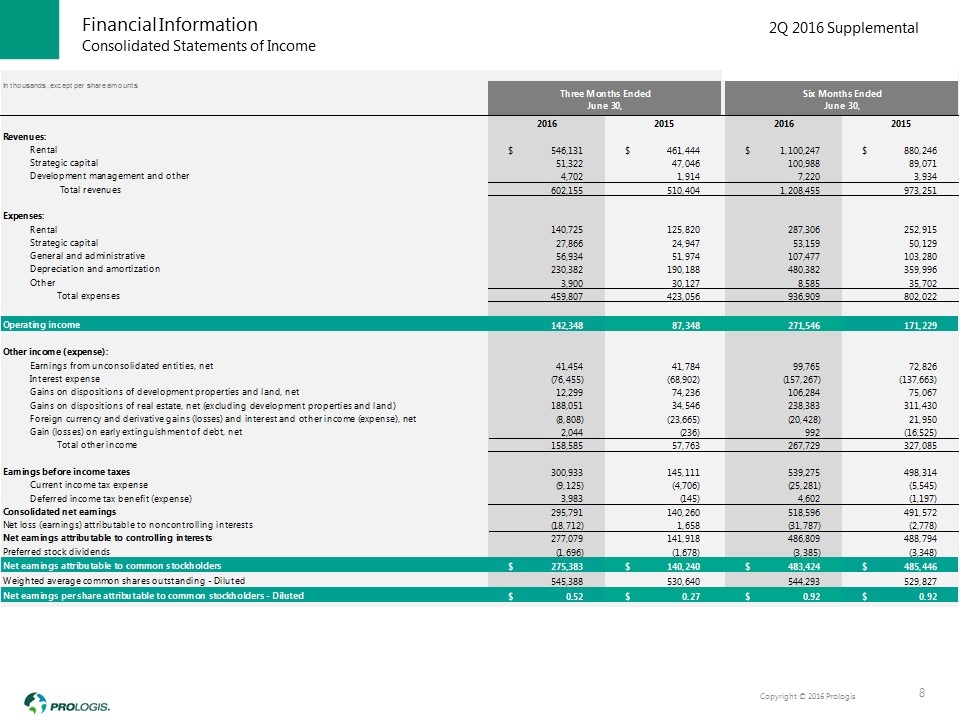
Consolidated Statements of Income Financial Information 8
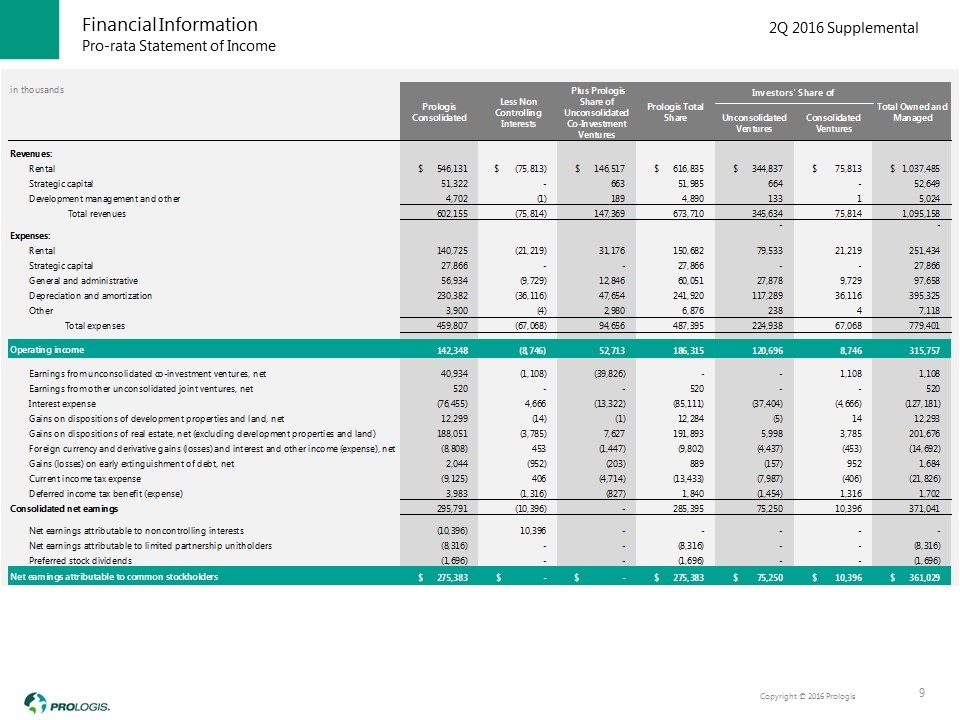
Pro-rata Statement of Income Financial Information 9
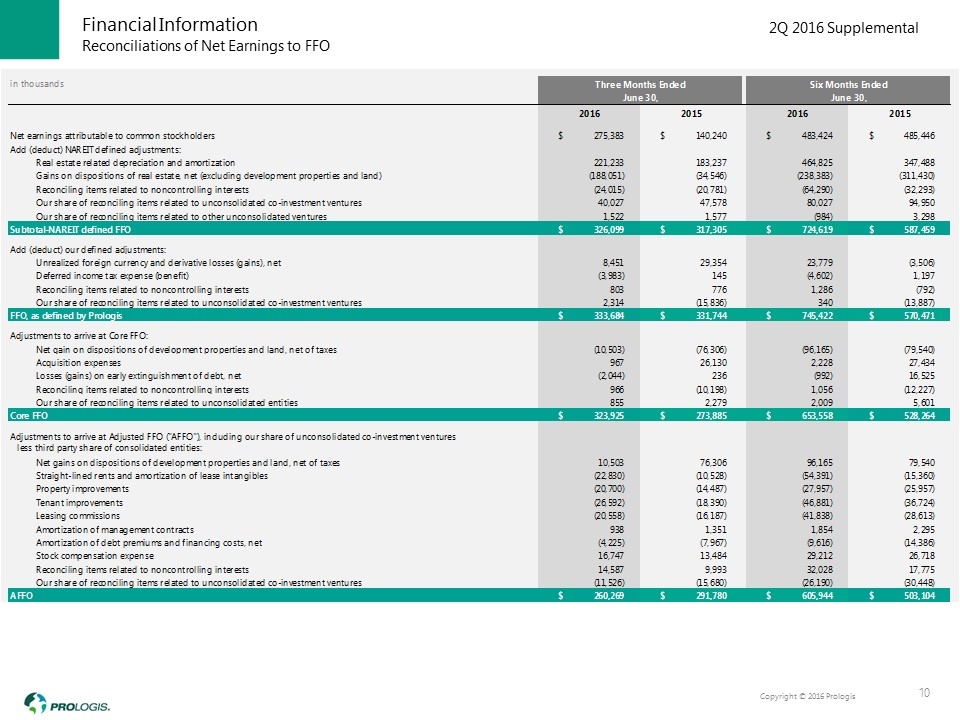
Reconciliations of Net Earnings to FFO Financial Information 10
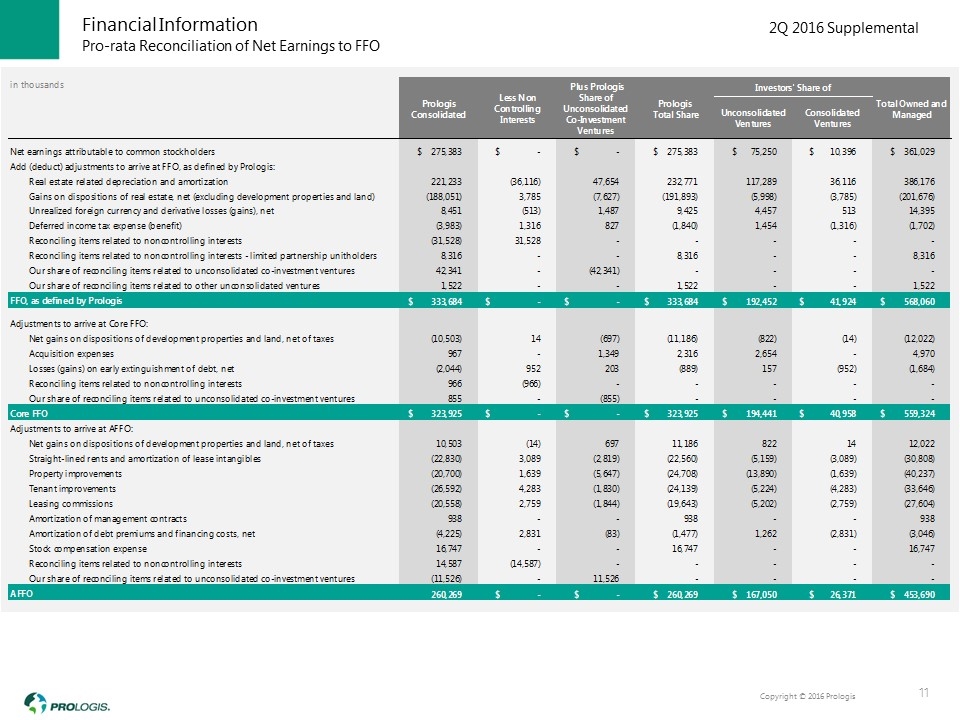
Pro-rata Reconciliation of Net Earnings to FFO Financial Information 11
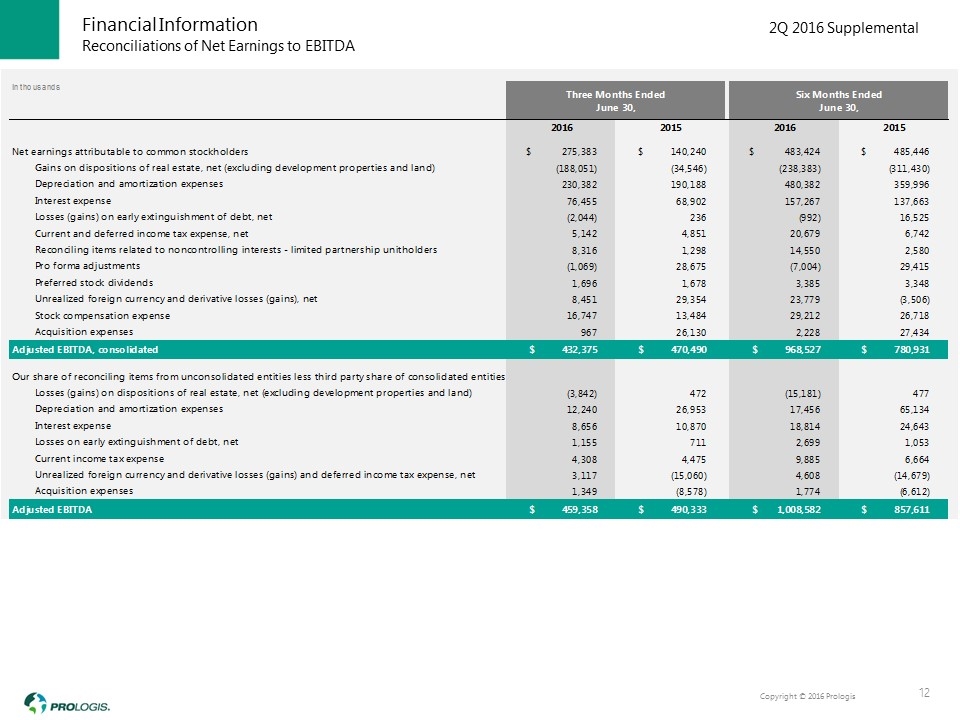
Reconciliations of Net Earnings to EBITDA Financial Information 12
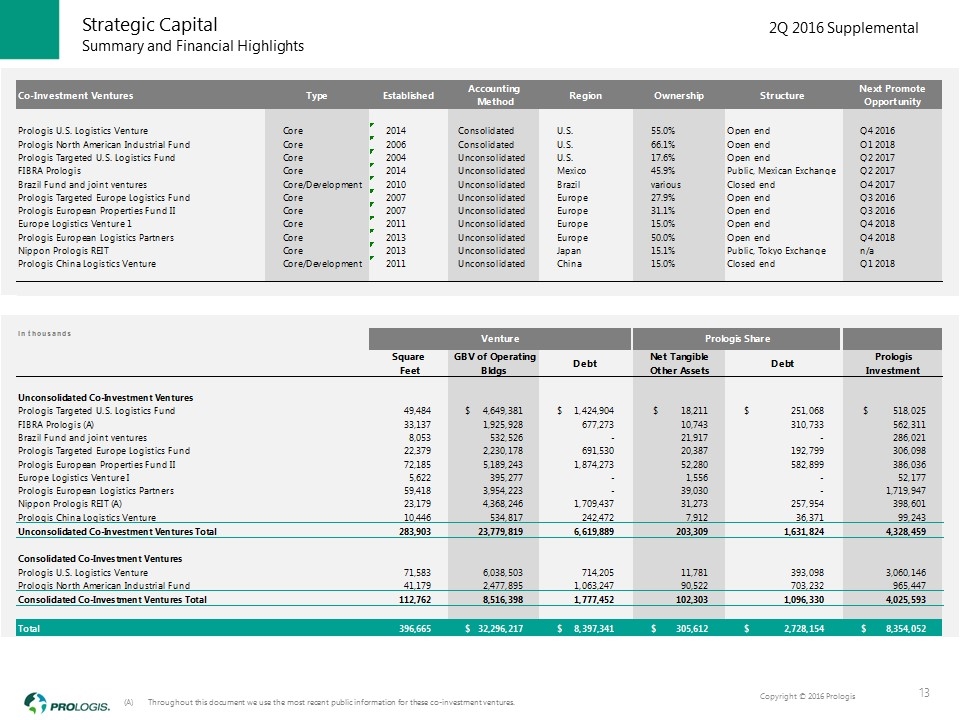
Throughout this document we use the most recent public information for these co-investment ventures. Summary and Financial Highlights Strategic Capital 13
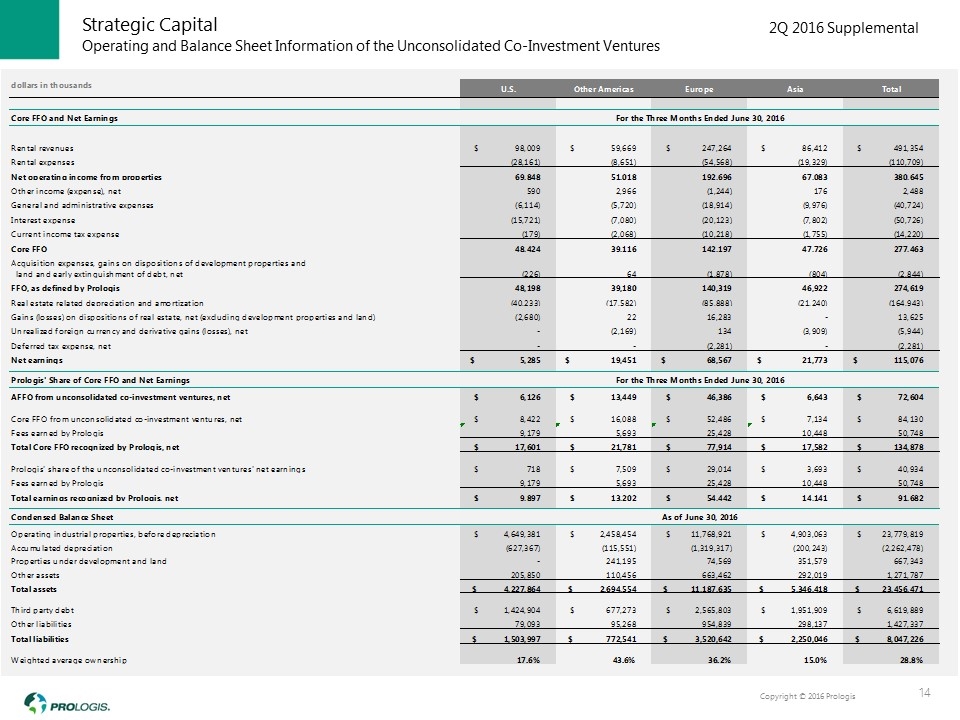
Operating and Balance Sheet Information of the Unconsolidated Co-Investment Ventures Strategic Capital 14
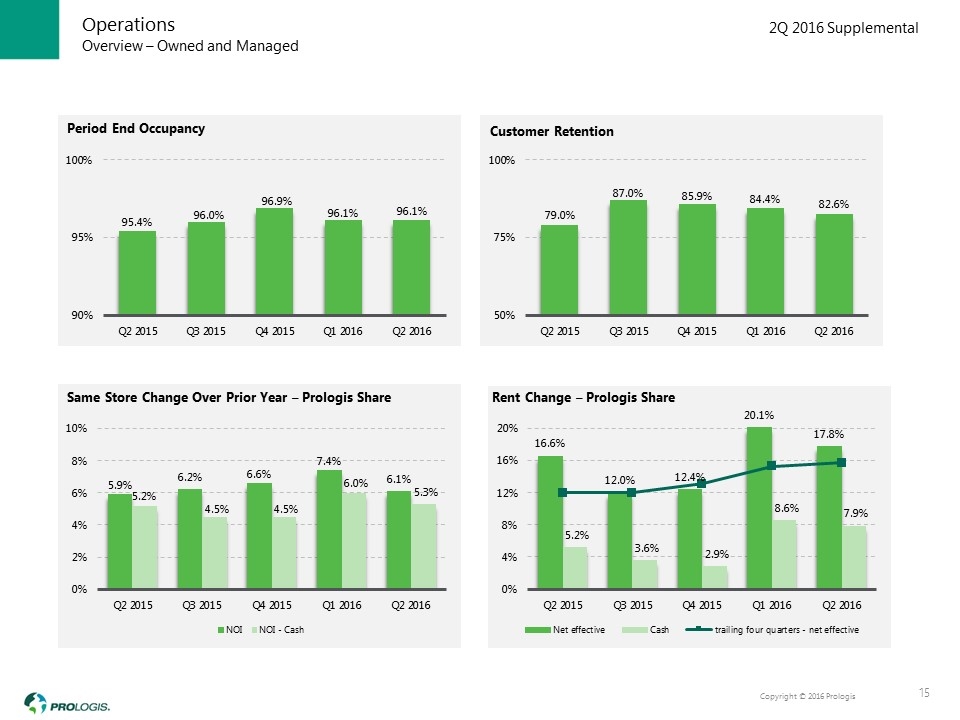
Overview – Owned and Managed Operations 15
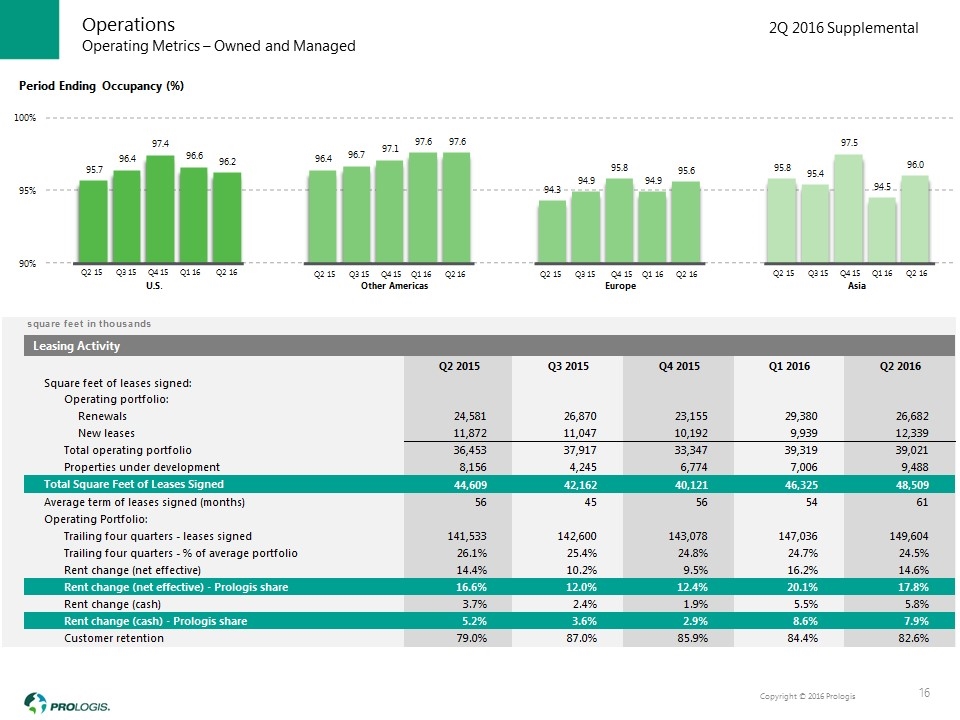
Operating Metrics – Owned and Managed Operations 16
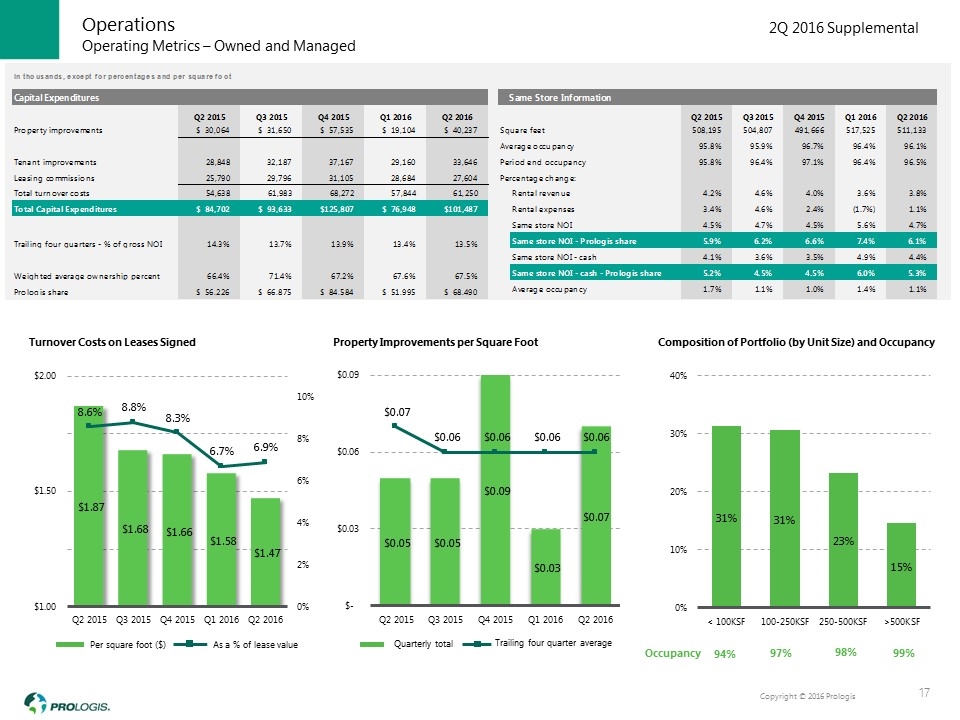
Operating Metrics – Owned and Managed Operations 17 99% Occupancy
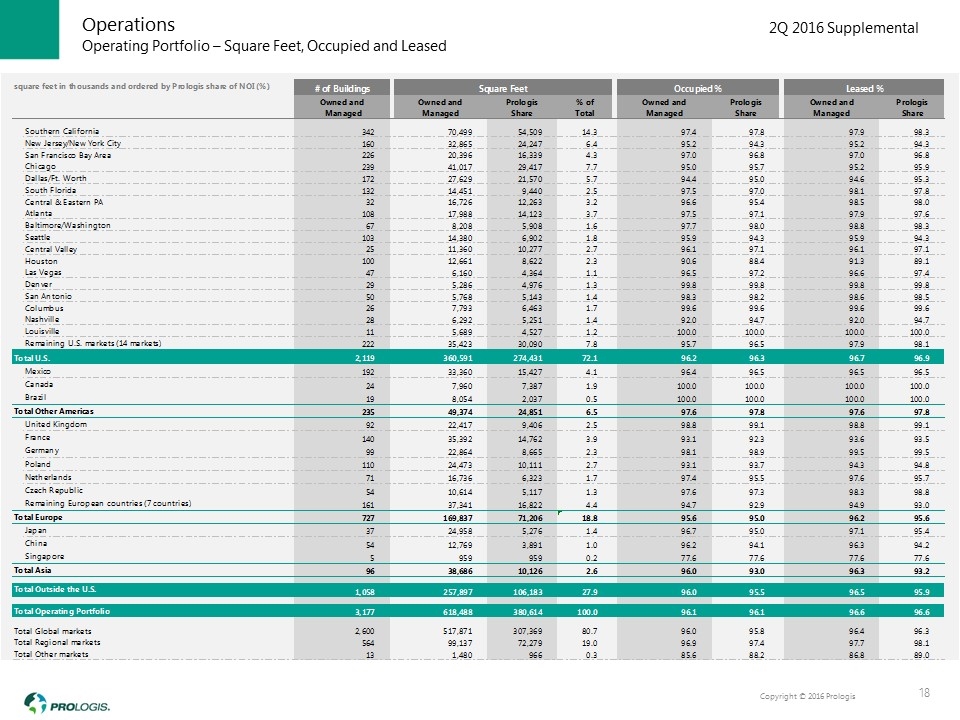
Operating Portfolio – Square Feet, Occupied and Leased Operations 18
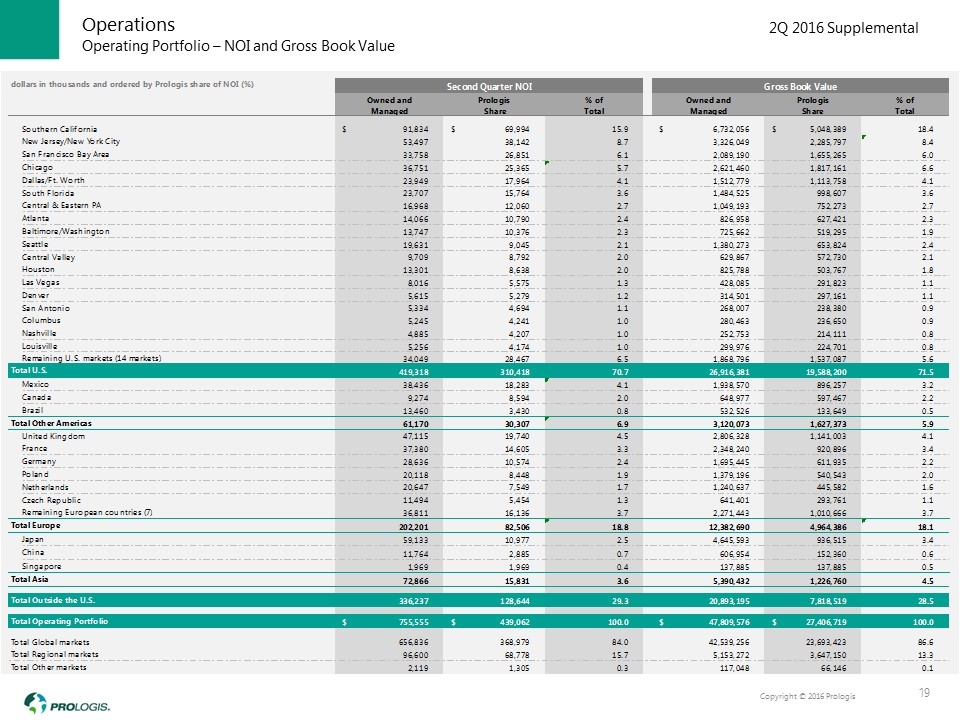
Operating Portfolio – NOI and Gross Book Value Operations 19
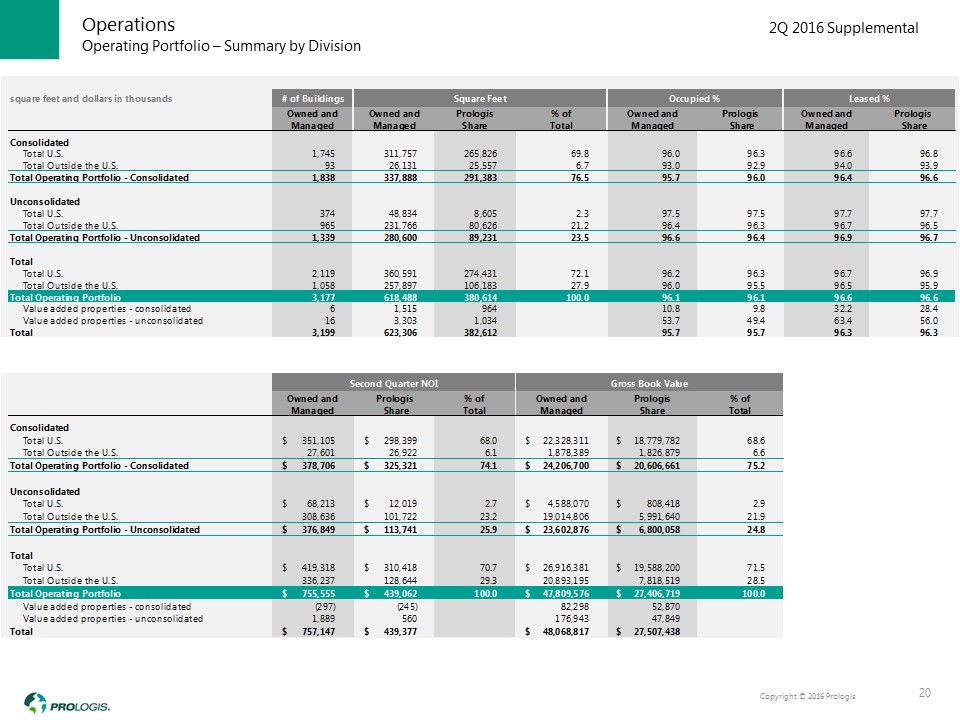
Operating Portfolio – Summary by Division Operations 20
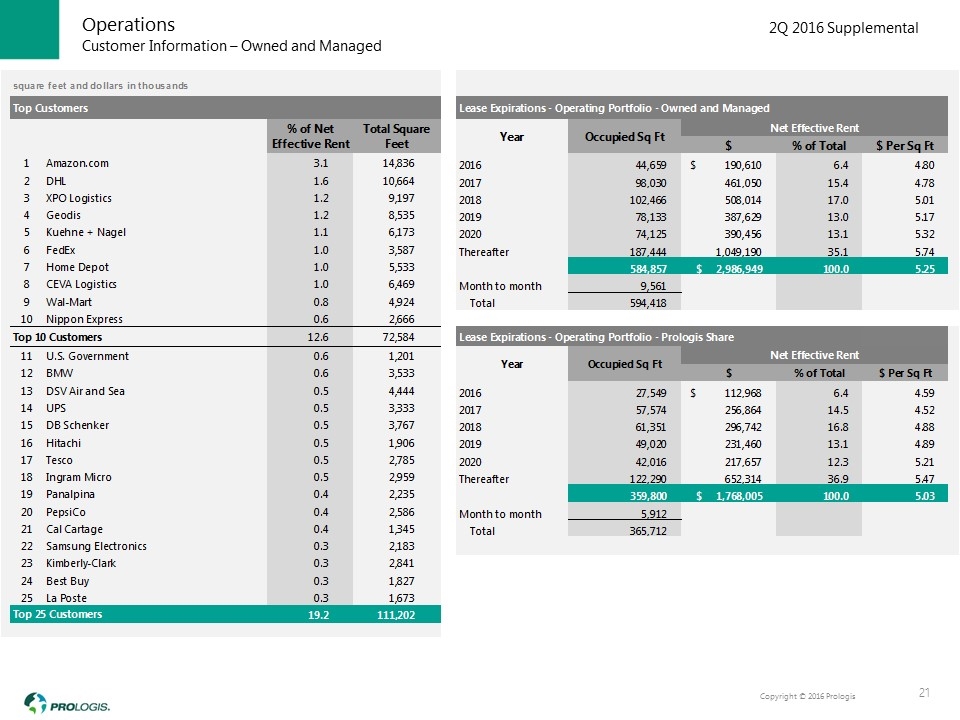
Customer Information – Owned and Managed Operations 21
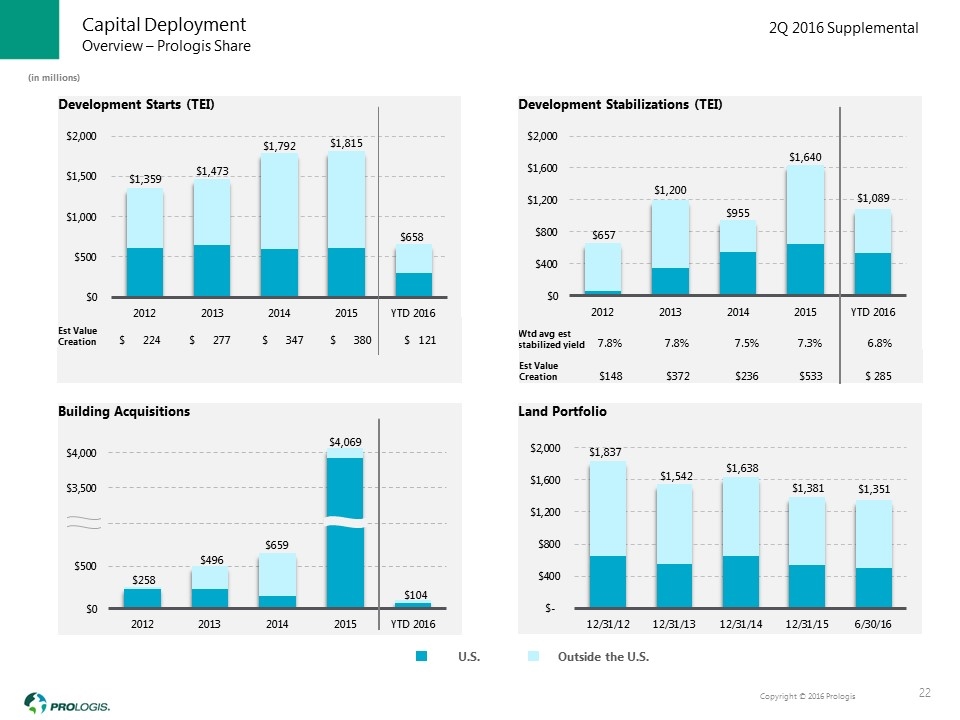
Overview – Prologis Share Capital Deployment Est Value Creation $ 224 $ 277 $ 347 $ 380 $ 121 Outside the U.S. U.S. 22 (in millions) Wtd avg est stabilized yield 7.8% 7.8% 7.5% 7.3% 6.8% Est Value Creation $148 $372 $236 $533 $ 285
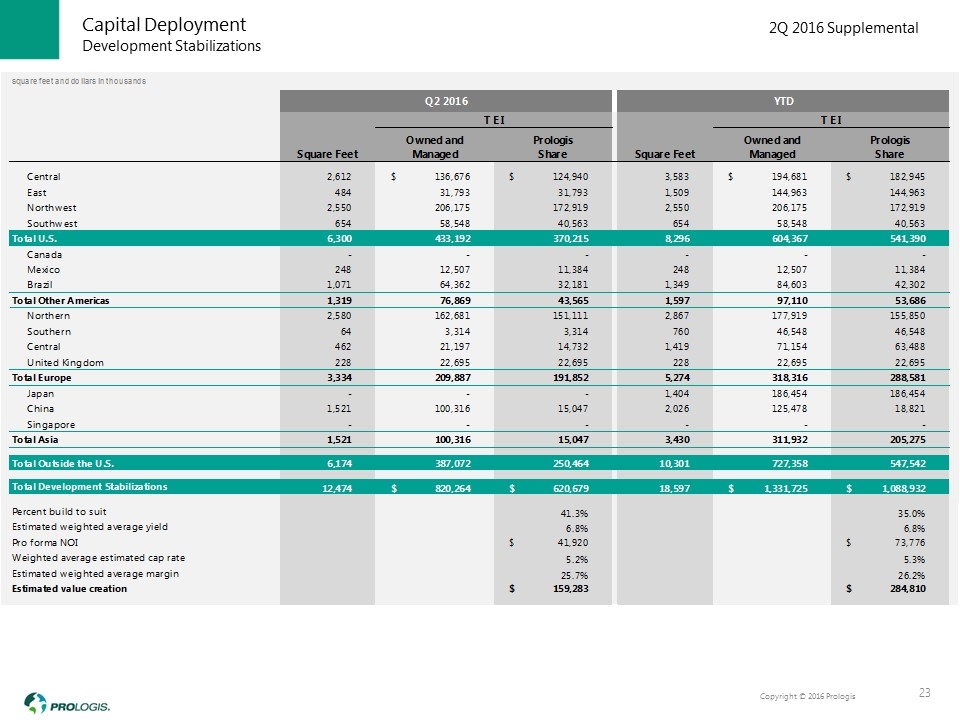
Development Stabilizations Capital Deployment 23
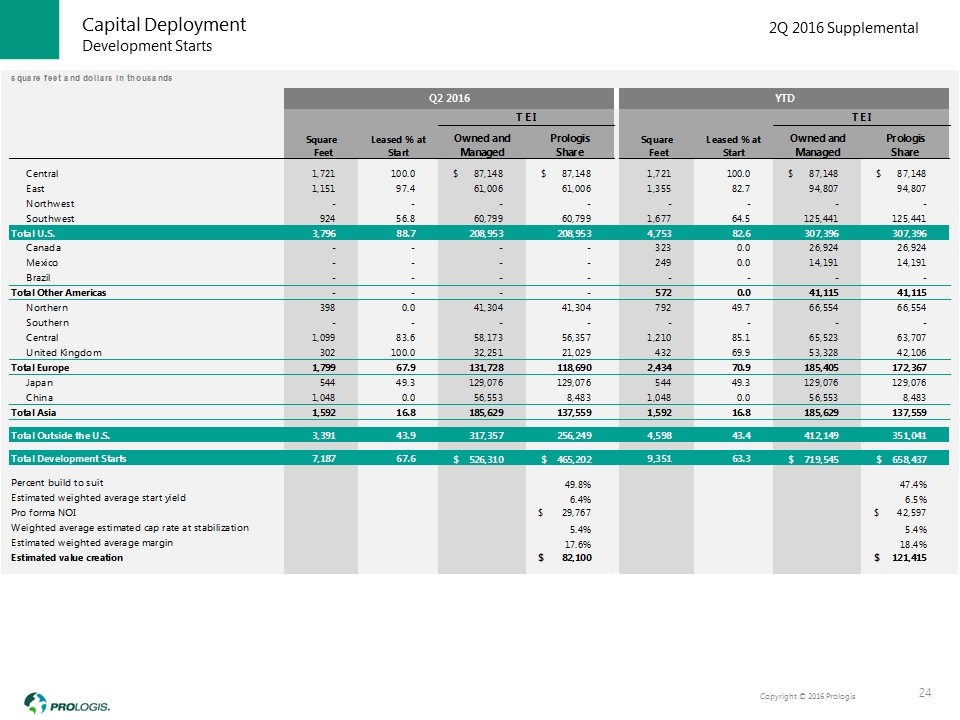
Development Starts Capital Deployment 24
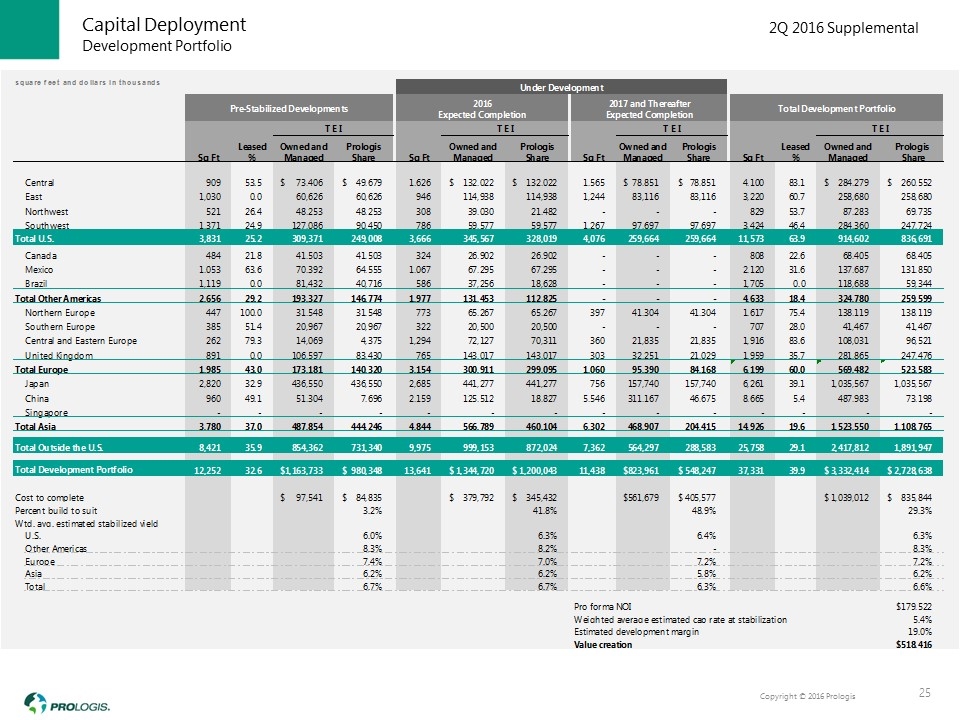
Development Portfolio Capital Deployment 25

Third Party Building Acquisitions Capital Deployment 26
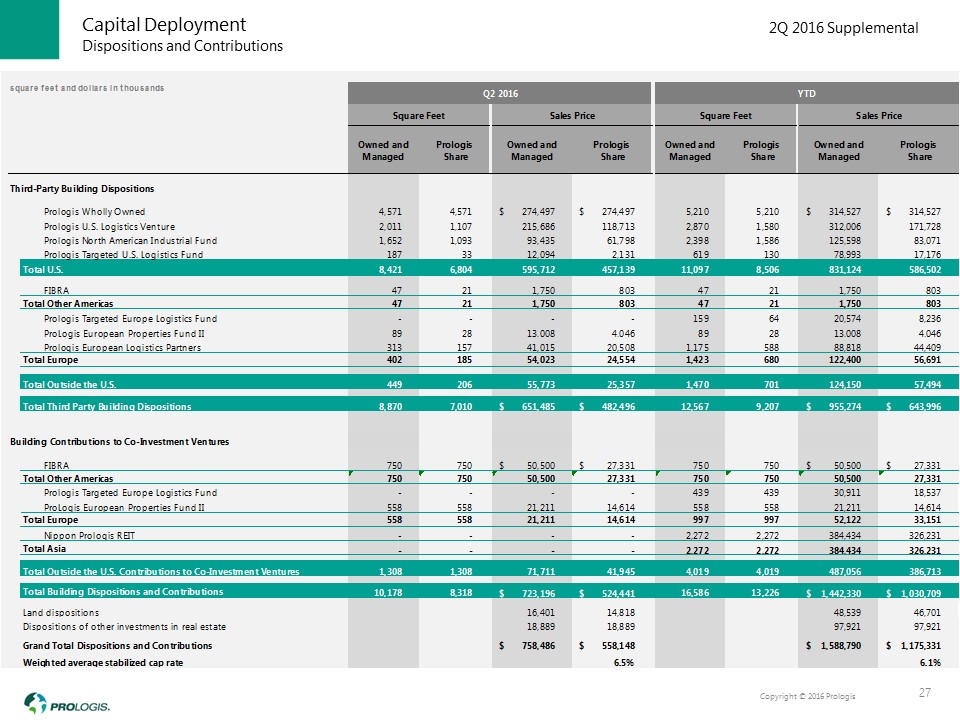
Dispositions and Contributions Capital Deployment 27
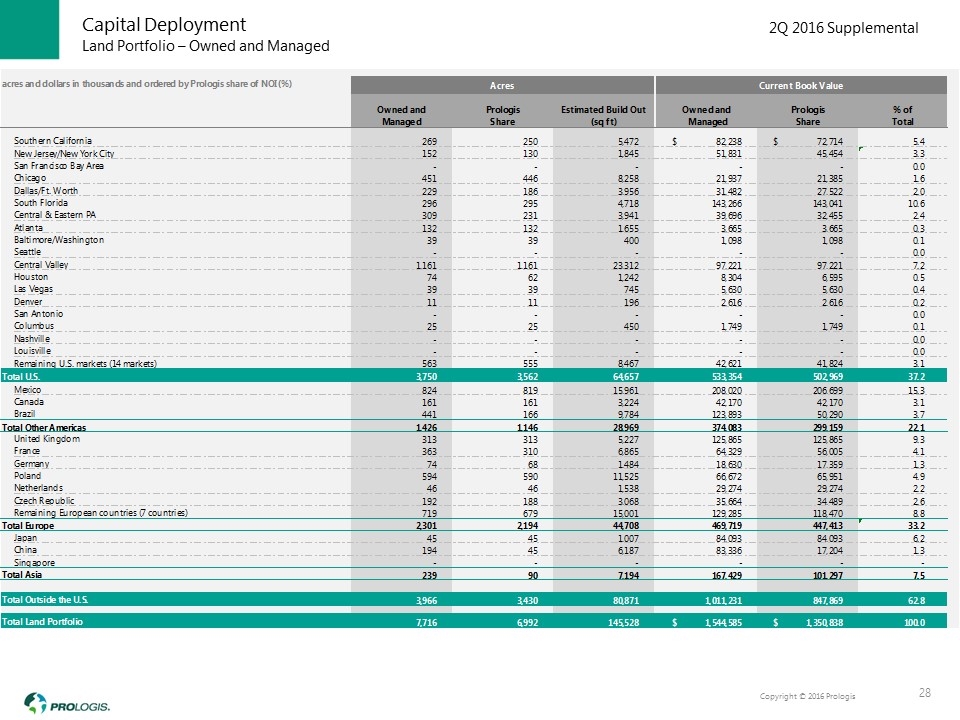
Land Portfolio – Owned and Managed Capital Deployment 28
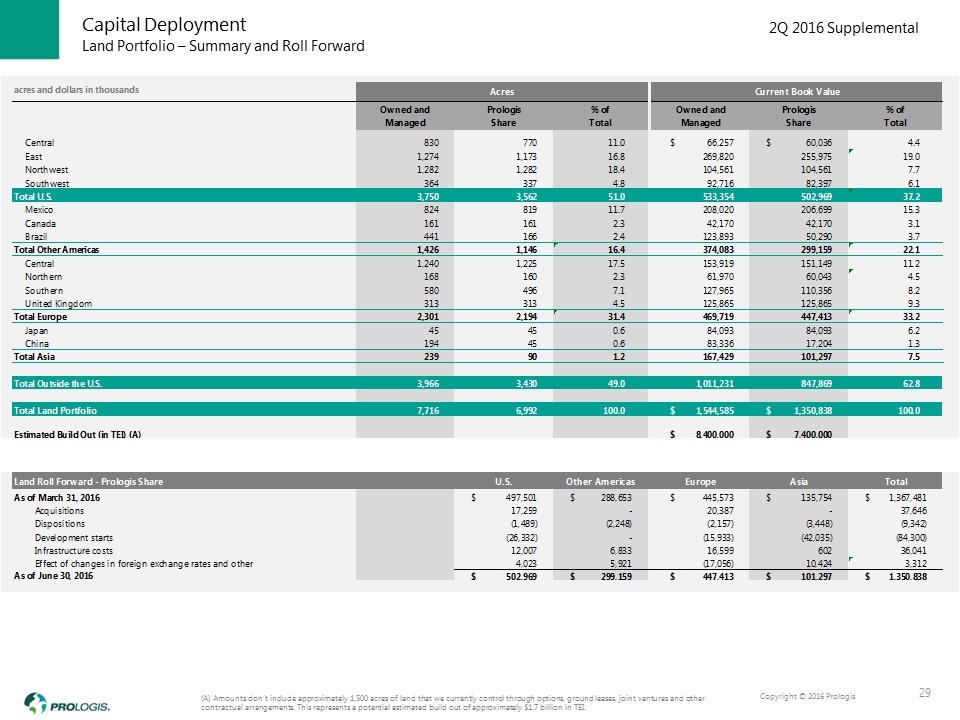
Land Portfolio – Summary and Roll Forward Capital Deployment 29 (A) Amounts don’t include approximately 1,500 acres of land that we currently control through options, ground leases, joint ventures and other contractual arrangements. This represents a potential estimated build out of approximately $1.7 billion in TEI.
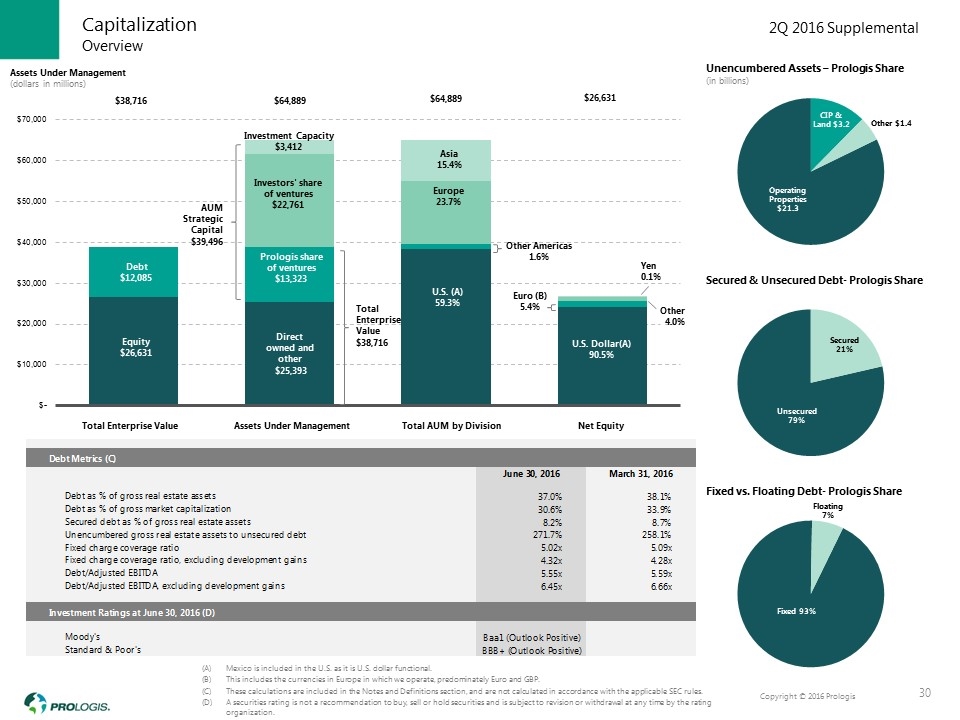
Mexico is included in the U.S. as it is U.S. dollar functional. This includes the currencies in Europe in which we operate, predominately Euro and GBP. These calculations are included in the Notes and Definitions section, and are not calculated in accordance with the applicable SEC rules. A securities rating is not a recommendation to buy, sell or hold securities and is subject to revision or withdrawal at any time by the rating organization. Overview Capitalization Assets Under Management (dollars in millions) Total Enterprise Value Assets Under Management Total AUM by Division Net Equity 30 Yen 20.1%
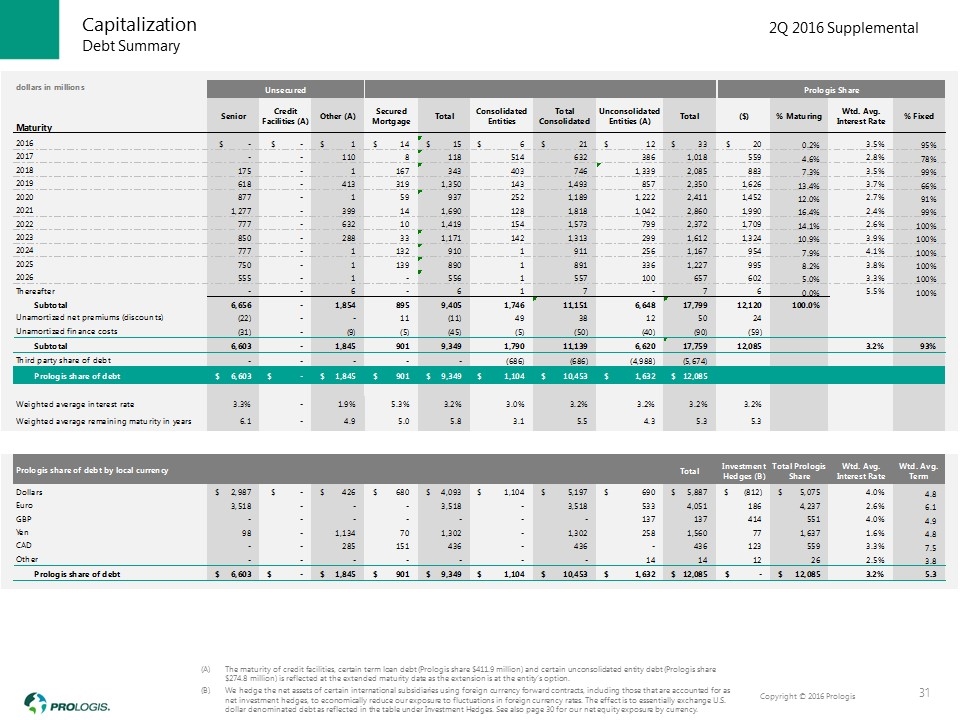
The maturity of credit facilities, certain term loan debt (Prologis share $411.9 million) and certain unconsolidated entity debt (Prologis share $274.8 million) is reflected at the extended maturity date as the extension is at the entity’s option. We hedge the net assets of certain international subsidiaries using foreign currency forward contracts, including those that are accounted for as net investment hedges, to economically reduce our exposure to fluctuations in foreign currency rates. The effect is to essentially exchange U.S. dollar denominated debt as reflected in the table under Investment Hedges. See also page 30 for our net equity exposure by currency. Debt Summary Capitalization 31
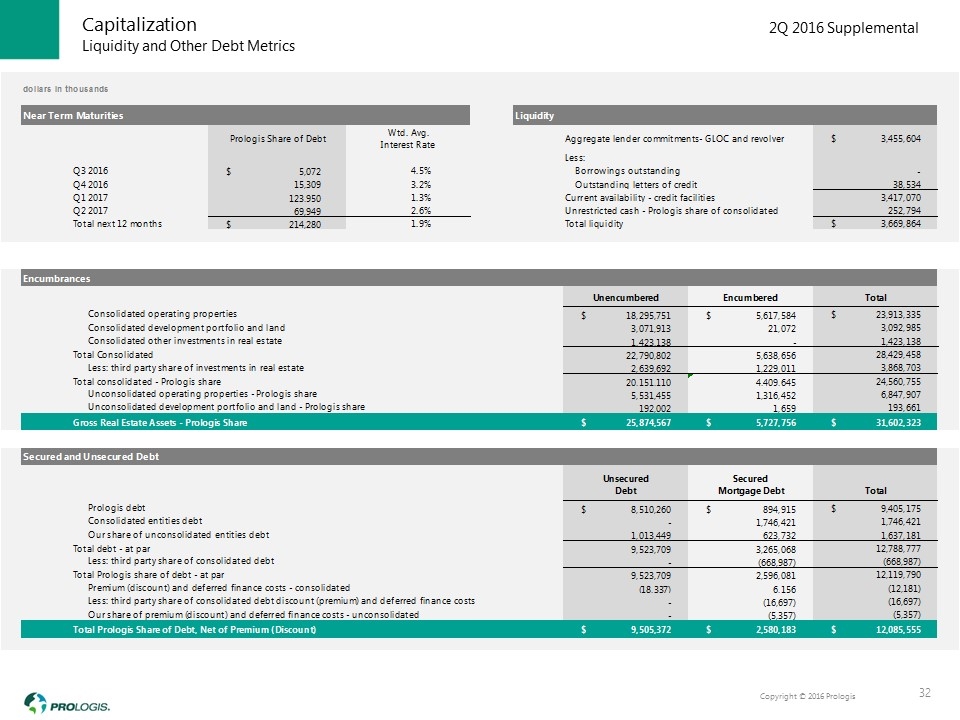
Liquidity and Other Debt Metrics Capitalization 32
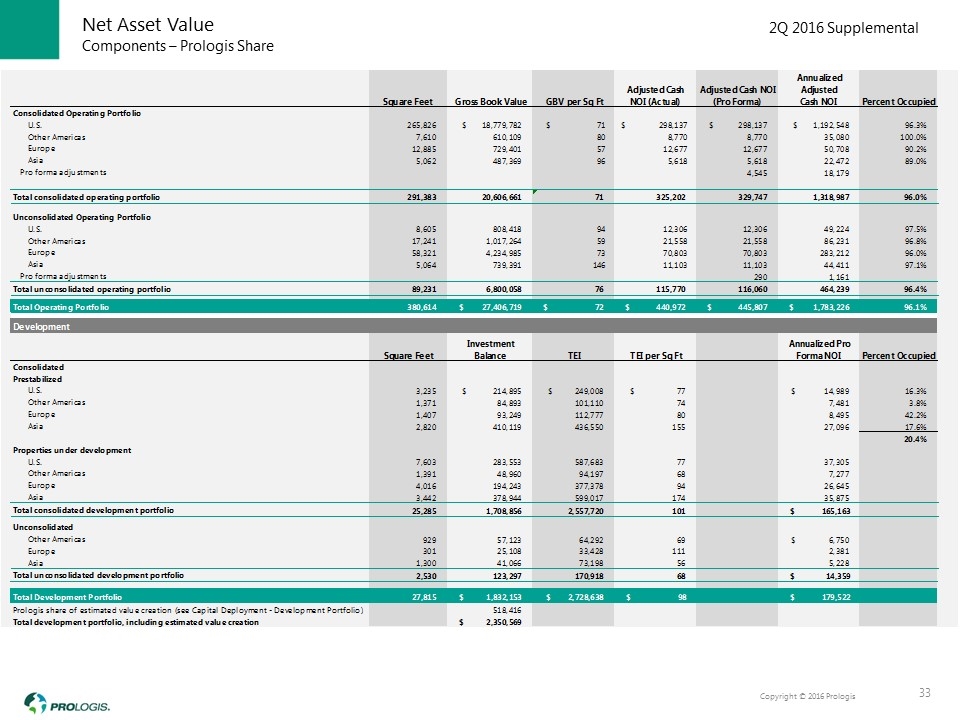
Components – Prologis Share Net Asset Value 33
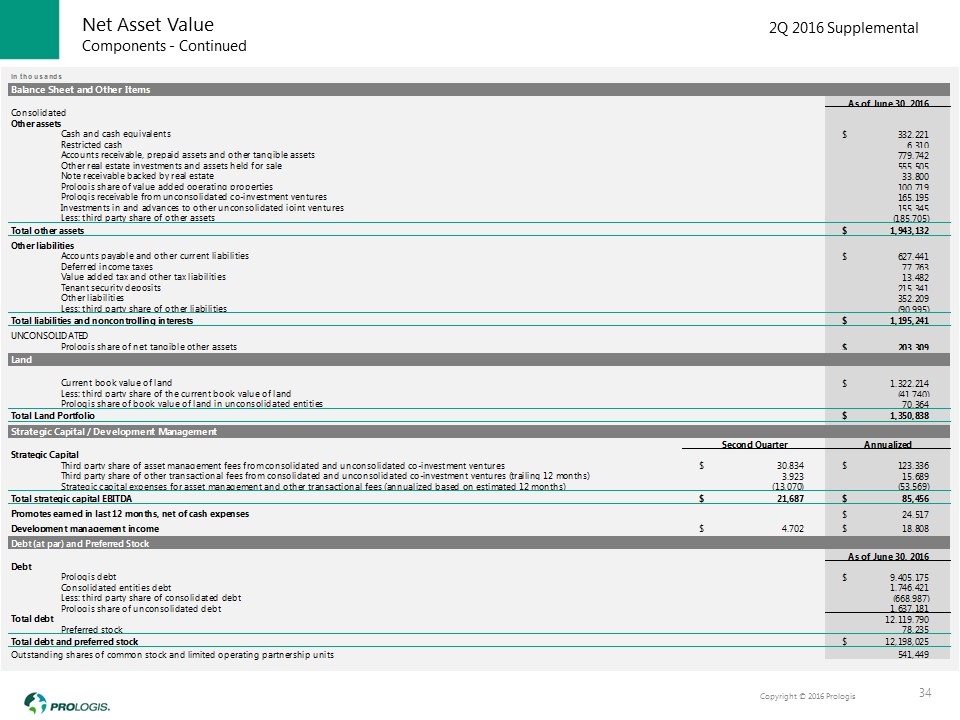
Components - Continued Net Asset Value 34

Notes and Definitions Section 1
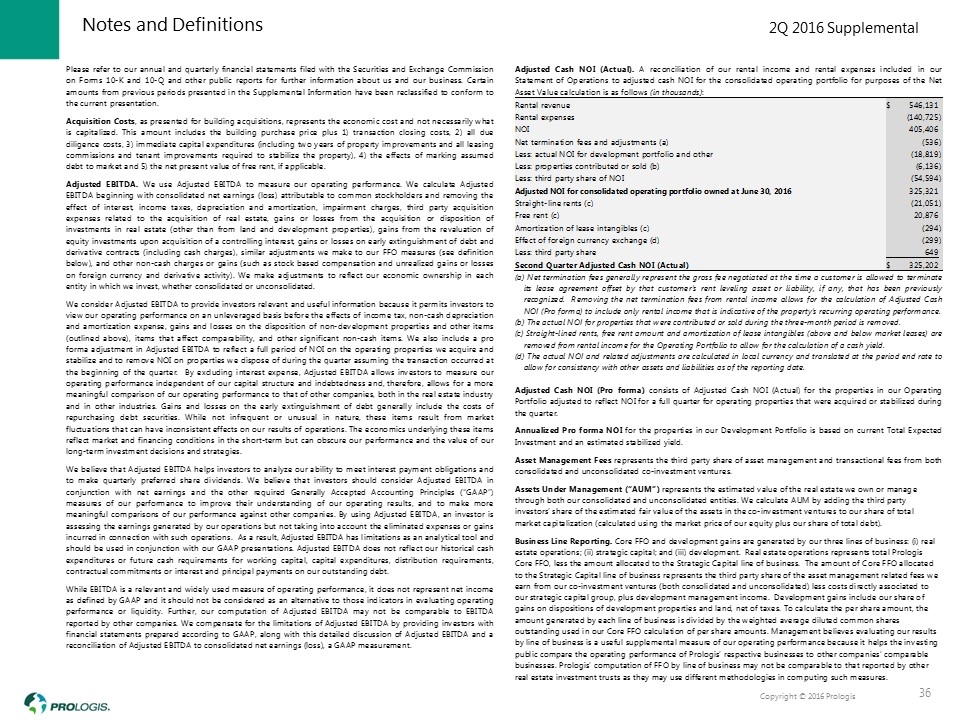
Notes and Definitions 36
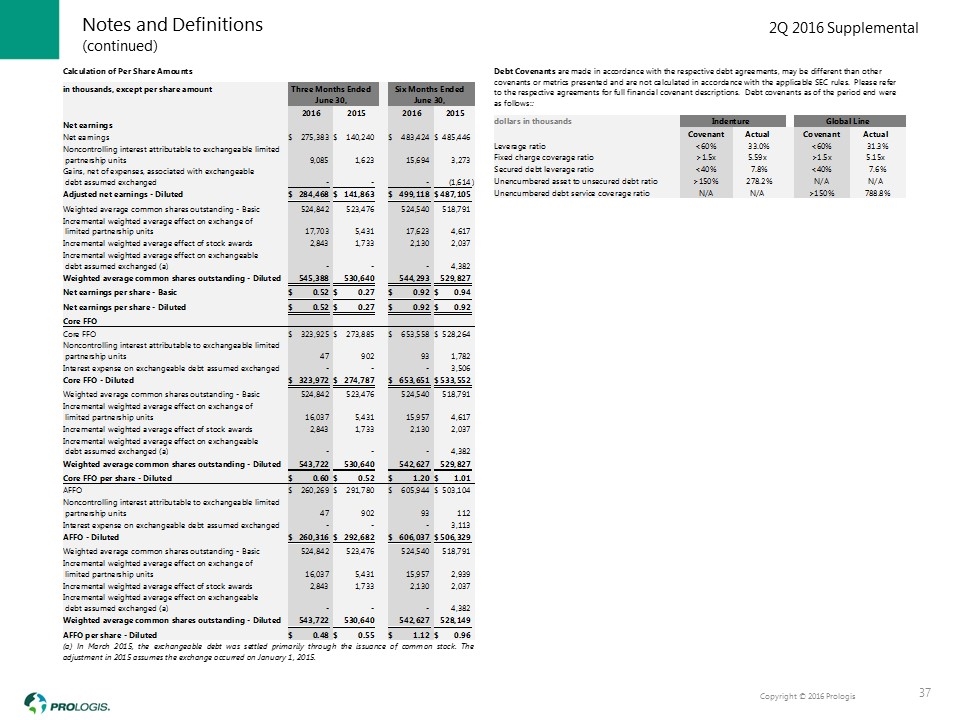
(continued) Notes and Definitions 37
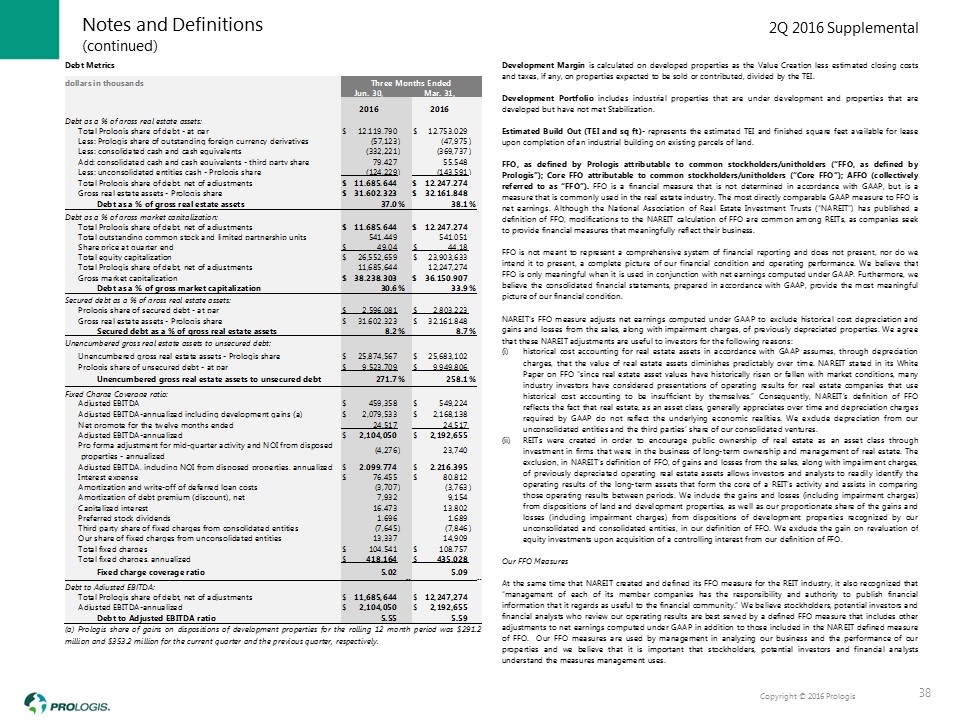
(continued) Notes and Definitions 38

(continued) Notes and Definitions 39
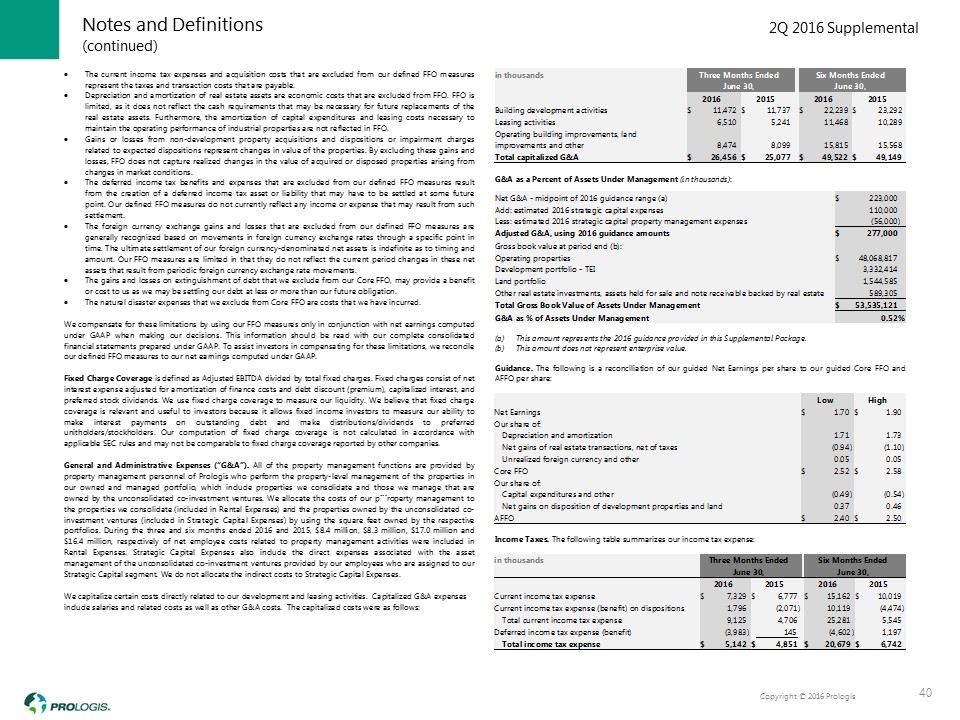
(continued) Notes and Definitions 40

(continued) Notes and Definitions 41
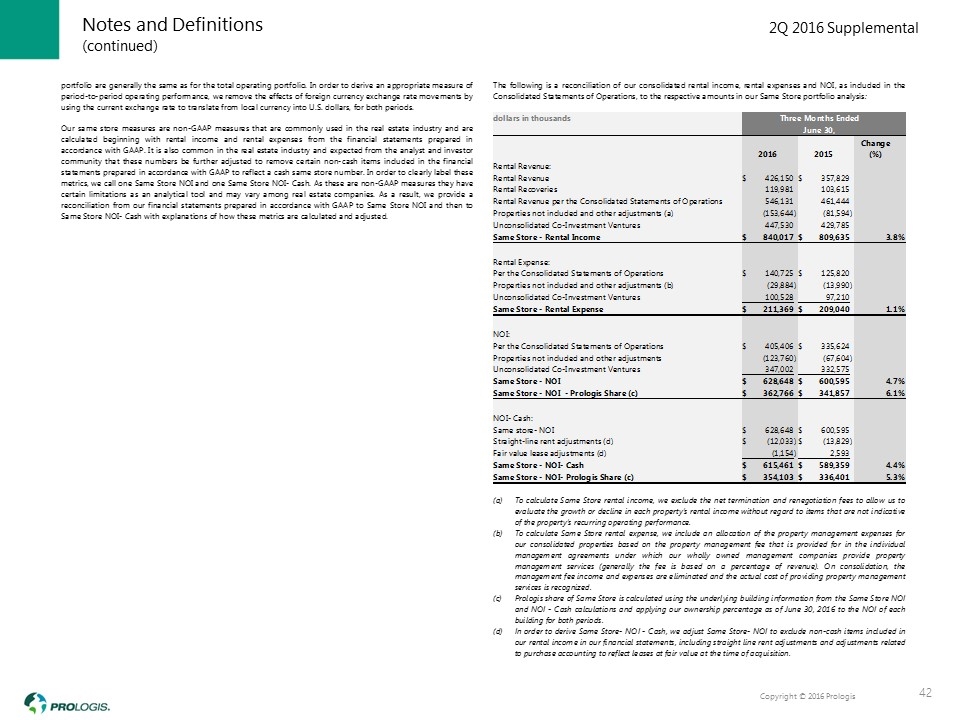
(continued) Notes and Definitions 42

(continued) Notes and Definitions 43

For Immediate Release
Prologis Reports Second Quarter 2016 Earnings Results
SAN FRANCISCO (July 19, 2016) – Prologis, Inc. (NYSE: PLD), the global leader in logistics real estate, today reported results for the second quarter of 2016. Net earnings per share was $0.52 compared with $0.27 for the same period in 2015. Core funds from operations per diluted share was $0.60 compared with $0.52 for the same period in 2015.
HIGHLIGHTS (Prologis Share)
|
|
§ |
Net effective same store NOI increased 6.1 percent |
|
|
§ |
Net effective rent change on rollover was +17.8 percent |
|
|
§ |
Stabilized $621 million in development projects, with an estimated margin of 25.7 percent |
|
|
§ |
Liquidity of more than $3.7 billion, the highest level in the company’s history |
“The incredible effort the team has made to position our portfolio and to optimize our business is paying off,” said Hamid Moghadam, chairman and CEO, Prologis. “We delivered another great quarter and we remain focused on refining our portfolio consistent with our investment strategy, further strengthening our balance sheet and increasing operational efficiencies. These efforts keep us on the path for above-average earnings growth across the business cycle.”
Moghadam added: “Demand remains ahead of supply in both the U.S. and Europe, leading to all-time low vacancy rates. In spite of Brexit, our key business drivers remain intact, and we do not anticipate a material operational impact. Consumers continue to migrate toward e-commerce, and companies still need to adapt their supply chain strategies, driving demand for high-quality, well-located logistics facilities.”
ROBUST RESULTS REFLECT CONTINUED STRENGTH IN FUNDAMENTALS FOR HIGH-QUALITY ASSETS
|
Owned & Managed |
2Q16 |
2Q15 |
Notes |
|
Period End Occupancy |
96.1% |
95.4% |
Europe increased 130 bps year-over-year |
|
Leases Signed |
49MSF |
45MSF |
Record leasing volume, including 9 msf of development leasing |
|
Customer Retention |
82.6% |
79.0% |
|
|
Prologis Share |
2Q16 |
2Q15 |
Notes |
|
Net Effective Rent Change |
17.8% |
16.6% |
Led by the U.S. at 23.5% |
|
Cash Rent Change |
7.9% |
5.2% |
|
|
Net Effective Same Store NOI |
6.1% |
5.9% |
Led by the U.S. at 7.5% |
|
Cash Same Store NOI |
5.3% |
5.2% |
|

SELF-FUNDING CONTINUES AS DISPOSITIONS AND DEVELOPMENT STARTS ACCELERATE
|
Prologis Share |
2Q16 |
Notes |
|
Building Acquisitions |
$58M |
|
|
Weighted avg stabilized cap rate |
6.4% |
|
|
Development Stabilizations |
$621M |
|
|
Estimated weighted avg yield |
6.8% |
|
|
Estimated weighted avg margin |
25.7% |
|
|
Estimated value creation |
$159M |
|
|
Development Starts |
$465M |
|
|
Estimated weighted avg margin |
17.6% |
|
|
Estimated value creation |
$82M |
|
|
% Build-to-suit |
49.8% |
|
|
Total Dispositions and Contributions |
$558M |
|
|
Weighted avg stabilized cap rate |
6.5% |
Excludes land and other real estate |
|
Total Fund Ownership Rebalances |
$411M |
|
STRONG LIQUIDITY POSITION CONTINUES TO BUILD
Prologis increased its total liquidity to $3.7 billion. During the second quarter, notable capital markets activities included the recast and upsize of the company’s Global Line of Credit to $3.0 billion.
“Our balance sheet and liquidity have never been stronger,” said Thomas S. Olinger, chief financial officer, Prologis. “We expect our financial position to continue to improve with additional capital proceeds in the back half of the year. We plan to generate proceeds above our prior forecast from incremental dispositions and contributions as well as from $200 million of additional ownership rebalancing across two of our co-investment ventures.”
GUIDANCE UPDATED FOR 2016
Net earnings guidance increased $0.89 at the midpoint, primarily a result of an increase in expected gains from the disposition of real estate.
“We anticipate meaningful outperformance from operations,” Olinger said. “This performance will more than offset the incremental dilution from the increase in dispositions, contributions and fund ownership rebalances. Additionally, we modestly lowered our net promote income, principally driven by a negative debt mark-to-market adjustment and the weakening of the pound against the euro. With respect to guidance, these changes offset one another, and we are holding the midpoint of our Core FFO guidance constant.”
|
Per diluted share |
Previous |
Revised |
|
GAAP Net Earnings |
$0.87 to $0.95 |
$1.70 to $1.90 |
|
Core FFO |
$2.50 to $2.60 |
$2.52 to $2.58 |
OperationsPreviousRevised
|
Same Store NOI – Prologis share |
4.0% to 4.5% |
4.75% to 5.25% |

Other Assumptions (in millions)PreviousRevised
|
Strategic capital revenue |
$180 to $190 |
$190 to $200 |
|
Net promote income |
$90 to $100 |
$75 to $85 |
|
Realized development gains |
$150 to $200 |
$200 to $250 |
|
|
|
|
|
Liquidity |
$3,700 |
$4,000 |
|
|
|
|
Capital Deployment (in millions)PreviousRevised
|
Development stabilizations (85% Prologis share) |
$2,000 to $2,200 |
$2,200 to $2,400 |
|
Development starts (85% Prologis share) |
$1,800 to $2,300 |
$2,000 to $2,300 |
|
Building acquisitions (50% Prologis share) |
$400 to $700 |
$300 to $500 |
|
Building and land dispositions (75% Prologis share) |
$1,700 to $2,200 |
$2,000 to $2,300 |
|
Building contributions (75% Prologis share, net of retained ownership) |
$900 to $1,200 |
$1,100 to $1,400 |
The earnings guidance described above includes potential future gains (losses) recognized from real estate transactions but excludes any future foreign currency or derivative gains or losses as these items are difficult to predict. In reconciling from net earnings to Core FFO, Prologis makes certain adjustments, including but not limited to real estate depreciation and amortization expense, gains (losses) recognized from real estate transactions and early extinguishment of debt, acquisition costs, impairment charges, deferred taxes and unrealized gains or losses on foreign currency or derivative activity. The difference between the company's Core FFO and net earnings guidance for 2016 relates predominantly to these items. Refer to our second quarter Supplemental Information that is available on our Investor Relations website at www.ir.prologis.com and on the SEC’s website at www.sec.gov for a definition of Core FFO and other non-GAAP measures used by Prologis, along with reconciliations of these items to the closest GAAP measure for our results and guidance.
WEBCAST & CONFERENCE CALL INFORMATION
Prologis will host a live webcast and conference call to discuss quarterly results, current market conditions and future outlook. Here are the event details:
|
§ |
Tuesday, July 19, 2016, at 12 p.m. U.S. Eastern Time. |
|
§ |
Live webcast at http://ir.prologis.com by clicking Investors>Investor Events and Presentations. |
|
§ |
Dial in: +1 877-256-7020 or +1 973-409-9692 and enter Passcode 37196022. |
A telephonic replay will be available July 19-26 at +1 (855) 859-2056 (from the United States and Canada) or +1 (404) 537-3406 (from all other countries) using conference code 37196022. The webcast replay will be posted when available in the Investor Relations “Events & Presentations” section.
ABOUT PROLOGIS
Prologis, Inc. is the global leader in logistics real estate with a focus on high-barrier, high-growth markets. As of June 30, 2016, the company owned or had investments in, on a wholly owned basis or through co-investment ventures, properties and development projects expected to total approximately 666 million square feet (62 million square meters) in 20 countries. Prologis leases modern distribution facilities to a diverse base of approximately 5,200 customers across two major categories: business-to-business and retail/online fulfillment.

FORWARD-LOOKING STATEMENTS
The statements in this document that are not historical facts are forward-looking statements within the meaning of Section 27A of the Securities Act of 1933, as amended, and Section 21E of the Securities Exchange Act of 1934, as amended. These forward-looking statements are based on current expectations, estimates and projections about the industry and markets in which we operate as well as management’s beliefs and assumptions. Such statements involve uncertainties that could significantly impact our financial results. Words such as “expects,” “anticipates,” “intends,” “plans,” “believes,” “seeks,” “estimates” and variations of such words and similar expressions are intended to identify such forward-looking statements, which generally are not historical in nature. All statements that address operating performance, events or developments that we expect or anticipate will occur in the future — including statements relating to rent and occupancy growth, development activity and changes in sales or contribution volume of properties, disposition activity, general conditions in the geographic areas where we operate, our debt, capital structure and financial position, our ability to form new co-investment ventures and the availability of capital in existing or new co-investment ventures — are forward-looking statements. These statements are not guarantees of future performance and involve certain risks, uncertainties and assumptions that are difficult to predict. Although we believe the expectations reflected in any forward-looking statements are based on reasonable assumptions, we can give no assurance that our expectations will be attained and therefore, actual outcomes and results may differ materially from what is expressed or forecasted in such forward-looking statements. Some of the factors that may affect outcomes and results include, but are not limited to: (i) national, international, regional and local economic climates, (ii) changes in financial markets, interest rates and foreign currency exchange rates, (iii) increased or unanticipated competition for our properties, (iv) risks associated with acquisitions, dispositions and development of properties, (v) maintenance of real estate investment trust status, tax structuring and income tax rates (vi) availability of financing and capital, the levels of debt that we maintain and our credit ratings, (vii) risks related to our investments in our co-investment ventures, including our ability to establish new co-investment ventures and funds, (viii) risks of doing business internationally, including currency risks, (ix) environmental uncertainties, including risks of natural disasters, and (x) those additional factors discussed in reports filed with the Securities and Exchange Commission by us under the heading “Risk Factors.” We undertake no duty to update any forward-looking statements appearing in this document.
CONTACTS
Investors: Tracy Ward, Tel: +1 415 733 9565, [email protected], San Francisco
Media: Jason Golz, Tel: +1 415 733 9439, [email protected], San Francisco
Serious News for Serious Traders! Try StreetInsider.com Premium Free!
You May Also Be Interested In
- BMO Capital Downgrades ProLogis (PLD) to Market Perform
- Golar LNG Limited – Q1 2024 results presentation
- Industry Bolsters BDA’s Presence at RISKWORLD 2024
Create E-mail Alert Related Categories
SEC FilingsSign up for StreetInsider Free!
Receive full access to all new and archived articles, unlimited portfolio tracking, e-mail alerts, custom newswires and RSS feeds - and more!


 Tweet
Tweet Share
Share