

Form 8-K PEAPACK GLADSTONE FINANC For: Oct 18
 Tweet
Tweet Share
ShareUNITED STATES
SECURITIES AND EXCHANGE COMMISSION
WASHINGTON, D.C. 20549
FORM 8-K
CURRENT REPORT
Pursuant to Section 13 or 15(d) of the
Securities Exchange Act of 1934
October 18, 2016
Date of Report (Date of earliest event reported)
PEAPACK-GLADSTONE FINANCIAL CORPORATION
(Exact name of Registrant as Specified in its Charter)
New Jersey
(State or Other Jurisdiction of Incorporation)
| 001-16197 | 22-3537895 |
| (Commission File Number) | (IRS Employer Identification No.) |
500 Hills Drive, Suite 300
Bedminster, New Jersey 07921-1538
(Address of principal executive offices)
(908) 234-0700
(Registrant's telephone number, including area code)
Check the appropriate box below if the Form 8-K filing is intended to simultaneously satisfy the filing obligation of the registrant under any of the following provisions:
| o | Written communications pursuant to Rule 425 under the Securities Act (17 CFR 230.425) |
| o | Soliciting material pursuant to Rule 14a-12 under the Exchange Act (17 CFR 240.14a-12) |
| o | Pre-commencement communications pursuant to Rule 14d-2(b) under the Exchange Act (17 CFR 240.14d-2(b)) |
| o | Pre-commencement communications pursuant to Rule 13e-4(c) under the Exchange Act (17 CFR 240.13e-4(c)) |
INFORMATION TO BE INCLUDED IN THE REPORT
| Item 7.01 | Regulation FD Disclosure |
Peapack Gladstone Financial Corporation (the “Company”) is furnishing presentation materials included as Exhibit 99.1 to this report pursuant to Item 7.01 of Form 8-K. The Company is not undertaking to update this presentation. The information in this report (including Exhibit 99.1) is being furnished pursuant to Item 7.01 and shall not be deemed to be “filed” for the purposes of Section 18 of the Securities Exchange Act of 1934, as amended, or otherwise subject to the liabilities of that section. This report will not be deemed an admission as to the materiality of any information herein (including Exhibit 99.1).
| Item 9.01 | Financial Statements and Exhibits |
(d) Exhibits
| 99.1 | CEO Presentation at Jack Henry CEO Conference. |
SIGNATURES
Pursuant to the requirements of the Securities Exchange Act of 1934, the registrant has duly caused this report to be signed on its behalf by the undersigned hereunto duly authorized.
| PEAPACK-GLADSTONE FINANCIAL CORPORATION | |
| Dated: October 18, 2016 | By: /s/ Jeffrey J. Carfora |
| Jeffrey J. Carfora | |
| Senior Executive Vice President and Chief Financial | |
| Officer and Principal Financial Officer |
Exhibit Index
| Exhibit No. | Title |
| 99.1 |
CEO Presentation at Jack Henry CEO Conference.
|
Exhibit 99.1
Our Strategy for the Future “Expanding Our Reach” Jack Henry CEO Conference October 18, 2016 P EAPACK - G LADSTONE B ANK

The foregoing contains forward - looking statements within the meaning of the Private Securities Litigation Reform Act of 1995. Such statements are not historical facts and include expressions about Management’s view of future interest income and net loans, Man agement’s confidence and strategies and Management’s expectations about new and existing programs and products, relationships, opportun iti es and market conditions. These statements may be identified by such forward - looking terminology as “expect”, “look”, “believe”, “antic ipate”, “may”, “will”, or similar statements or variations of such terms. Actual results may differ materially from such forward - looking statements. Factors that may cause actual results to differ materially from those contemplated by such forward - looking statements include, a mong others, those risk factors identified in the Company’s Form 10 - K for the year ended December 31, 2015, in addition to/which include the following: a) inability to successfully grow our business in line with our strategic plan; b) inability to grow deposits to fund loan growt h; c) inability to generate revenues to offset the increased personnel and other costs related to the strategic plan; d) inability to realize ex pec ted revenue synergies from the acquisition of a wealth management company in the amounts or the timeframe anticipated; e) inability to re tai n clients and employees of acquired wealth management company; f) inability to manage our growth; g) inability to successfully integrat e o ur expanded employee base; h) a further or unexpected decline in the economy, in particular in our New Jersey and New York marke t a reas; i ) declines in value in our investment portfolio; j) higher than expected increases in our allowance for loan losses; k) higher tha n expected increases in loan losses or in the level of non - performing loans ; unexpected changes in interest rates; l) a continued or unexpected decline in real estate values within our market areas; m) legislative and regulatory actions (including the impact of the Dodd - Frank Wall S treet Reform and Consumer Protection Act, Basel III and related regulations) subject us to additional regulatory oversight which may resul t i n increased compliance costs; n) successful cyber - attacks against our IT infrastructure or that of our IT providers; o) higher than expected FDIC premiums; p) adverse weather conditions ; inability to successfully generate new business in new geographic areas; q) inability to execute upon new business initiatives ; lack of liquidity to fund our various cash obligations; r) reduction in our lower - cost funding sources; s) our inability to adapt to technological changes; t) claims and litigation pertaining to fiduciary responsibility, environmental laws and other ma tters; and other unexpected material adverse changes in our operations or earnings. The Company assumes no responsibility to update such forward - looking statements in the future even if experience shows that the indicated results or events will not be realized. Although we believe that the expectations reflected in the forward - looking statements ar e reasonable, the Company cannot guarantee future results, levels of activity, performance, or achievements. Statement Regarding Forward - Looking Information 2
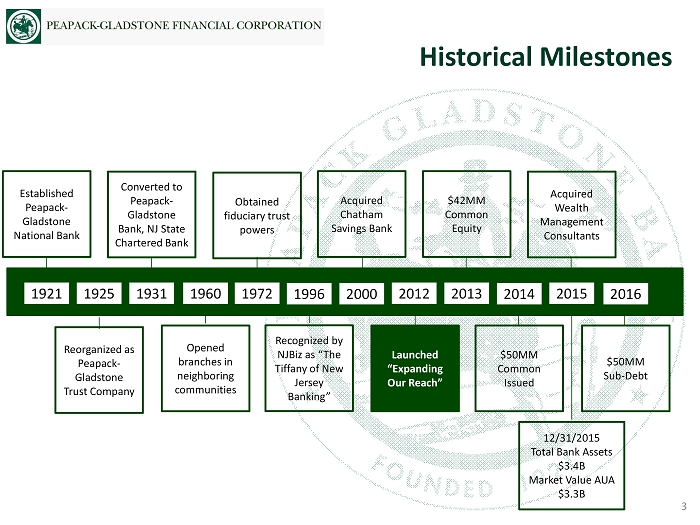
Historical Milestones 3 1921 Converted to Peapack - Gladstone Bank, NJ State Chartered Bank 12/31/2015 Total Bank Assets $3.4B Market Value AUA $3.3B Obtained fiduciary trust powers Established Peapack - Gladstone National Bank Reorganized as Peapack - Gladstone Trust Company Opened branches in neighboring communities Recognized by NJBiz as “The Tiffany of New Jersey Banking” Acquired Chatham Savings Bank Launched “Expanding Our Reach” $42MM Common Equity Acquired Wealth Management Consultants 1925 1931 1960 1972 1996 2014 2015 2016 2012 2013 2000 $50MM Common Issued $50MM Sub - Debt

A high - performing boutique bank, leaders in wealth, lending and deposit solutions, known nationally for our unparalleled client service, integrity and trust. Our Foundation 4 • Professionalism • Clients First • Compete to Win • Invested in Our Community • One Team Vision Core Principles

1. Non - GAAP financial measure; refer to reconciliation on page 32 • Headquartered in Bedminster, NJ. • Four Private Banking locations: Bedminster, Morristown, Princeton, Teaneck. • 21 Branches in four affluent New Jersey counties: Somerset, Morris, Hunterdon, Union. • Delaware Trust Subsidiary. • New York MSA offers considerable growth opportunity. Overview Franchise 5 Financial Highlights (Dollars in Millions) Year End Qtr End % 12/31/12 06/30/16 Growth Total Assets $1,668 $3,605 116.13% Net Loans (incl HFS) $1,153 $3,213 178.66% Total Deposits $1,516 $3,109 105.08% Total Shareholders' Equity $122 $296 142.62% Tier 1 Leverage Ratio 7.27% 8.19% 12.65% Tier 1 Risk-Based Capital Ratio 11.83% 10.28% -13.10% Total Risk-Based Capital Ratio 13.08% 12.99% -0.69% Tang Common Equity / Tang Equity 7.29% 8.12% 11.39% 1
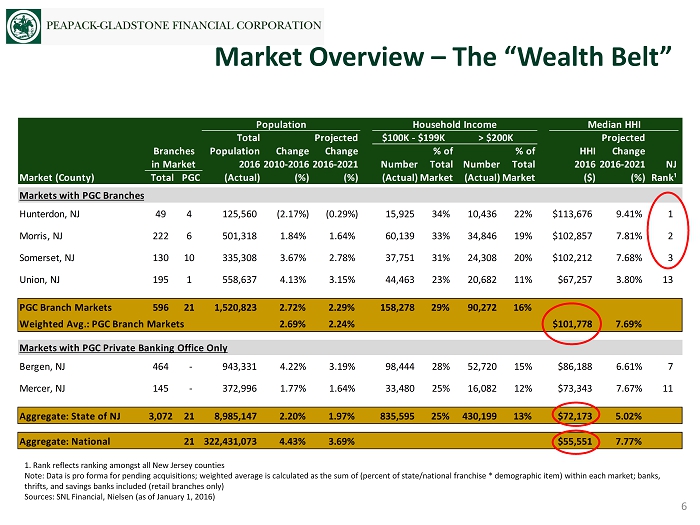
1. Rank reflects ranking amongst all New Jersey counties Note: Data is pro forma for pending acquisitions; weighted average is calculated as the sum of (percent of state/national franchise * demographic item) within each market; banks , thrifts , and savings banks included (retail branches only ) Sources: SNL Financial, Nielsen (as of January 1, 2016) Population Household Income Median HHI Total Projected $100K - $199K > $200K Projected Branches Population Change Change % of % of HHI Change in Market 20162010-20162016-2021 Number Total Number Total 20162016-2021 NJ Market (County) Total PGC (Actual) (%) (%) (Actual)Market (Actual)Market ($) (%)Rank¹ Markets with PGC Branches Hunterdon, NJ 49 4 125,560 (2.17%) (0.29%) 15,925 34% 10,436 22% $113,676 9.41% 1 Morris, NJ 222 6 501,318 1.84% 1.64% 60,139 33% 34,846 19% $102,857 7.81% 2 Somerset, NJ 130 10 335,308 3.67% 2.78% 37,751 31% 24,308 20% $102,212 7.68% 3 Union, NJ 195 1 558,637 4.13% 3.15% 44,463 23% 20,682 11% $67,257 3.80% 13 PGC Branch Markets 596 21 1,520,823 2.72% 2.29% 158,278 29% 90,272 16% Weighted Avg.: PGC Branch Markets 2.69% 2.24% $101,778 7.69% Markets with PGC Private Banking Office Only Bergen, NJ 464 - 943,331 4.22% 3.19% 98,444 28% 52,720 15% $86,188 6.61% 7 Mercer, NJ 145 - 372,996 1.77% 1.64% 33,480 25% 16,082 12% $73,343 7.67% 11 Aggregate: State of NJ 3,072 21 8,985,147 2.20% 1.97% 835,595 25% 430,199 13% $72,173 5.02% Aggregate: National 21 322,431,073 4.43% 3.69% $55,551 7.77% Market Overview – The “Wealth Belt” 6

Douglas L. Kennedy President & Chief Executive Officer 38 years experience; Before joining in 2012, he served as President of the NJ Market for Capital One Bank. He has held key executive level positions and had great success building formidable regional and national specialty banking business at Fleet Bank, Summit Bancorp and Bank of America. He is a current Member of the NJ Chamber of Commerce Board of Directors, Montclair State University Board of Trustees, and Sacred Heart University Board of Trustees. He has served as President of NJ After 3 and as a Board Member of the NJ Bankers Association. John P. Babcock Senior EVP & President of Wealth Management 35 years experience; Prior to joining, he was the managing director in charge of the Northeast Mid - Atlantic region for the HSBC Private Bank and, prior to that, he was the New York Metro Market Executive for U.S. Trust - the largest of U.S. Trust’s 53 markets in the U.S. In these and previous roles over the last 34 years, he has led commercial and wealth management/private bank businesses in New York City and regional markets through mergers, expansions, rapid growth and periods of significant organizational change. Jeffrey J. Carfora, CPA Senior EVP & Chief Financial Officer 36 years experience; Joining as Executive Vice President and CFO in March 2009, he was promoted to Senior Executive Vice President in August 2013. Previously, he was affiliated with Penn Federal Savings Bank, where he joined as CFO and was later promoted to COO, Carteret Bank, and Marine Midland Bank. He began his career in 1980 with PriceWaterhouseCoopers . Finn M. W. Caspersen, Jr. Senior EVP, Chief Operating Officer & General Counsel 21 years experience; Before j oining in 2004, he worked as a corporate lawyer at Hale and Dorr, as an investment banker at Merrill Lynch and privately in venture capital. He has served as trustee of Cardigan Mountain School, Pomfret School, the Somerset Hills YMCA, the Willowwood Arboretum and the NJ Chapter of the Nature Conservancy. He was a two - term elected member of the Bedminster Township Committee and has also served on the Bedminster Environmental Commission and the Bedminster Land Use Board. Experienced Executive Management Team 7

People Market Growth and Profitability • Shared common vision • Very talented team with ties to the market • High levels of motivation and engagement • Act as a single team • Entrepreneurial culture • We operate in three of the top ten most affluent counties nationwide • New York MSA offers considerable growth opportunity • Large and small banks underserving the wealth related needs in this market • Improved operating leverage is delivering positive earnings momentum • People , products, market - depth and superior delivery ensure future growth • Ample market opportunities • Nimble and flexible • Enviable revenue mix Unique Business Model • Holistic, “wealth centric”, advice - led approach • Private Banker acts as a lead point of contact • “Brand of One” • Fee income growth a key area of focus • Sophisticated processes to Enterprise Risk, CRE, and balance sheet management • Excellent risk leadership team • Solid governance including Firm and Board Risk Committees Serious Approach to Risk Management How We Are Creating Value 8
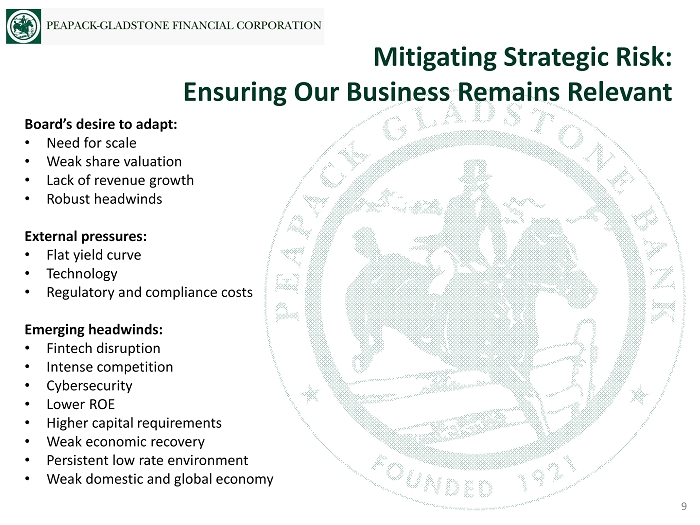
Mitigating Strategic Risk: Ensuring Our Business Remains Relevant 9 Board’s desire to adapt: • Need for scale • Weak share valuation • Lack of revenue growth • Robust headwinds External pressures: • Flat yield curve • Technology • Regulatory and compliance costs Emerging headwinds: • Fintech disruption • Intense competition • Cybersecurity • Lower ROE • Higher capital requirements • Weak economic recovery • Persistent low rate environment • Weak domestic and global economy
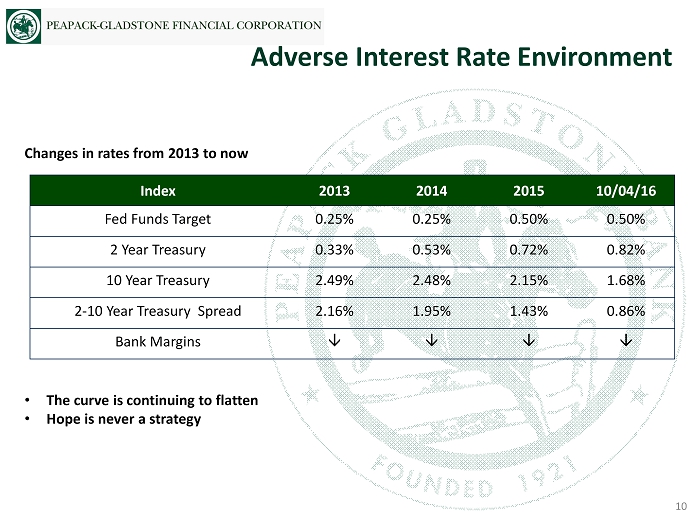
Adverse Interest Rate Environment 10 Changes in rates from 2013 to now Index 2013 2014 2015 10/04/16 Fed Funds Target 0.25% 0.25% 0.50% 0.50% 2 Year Treasury 0.33% 0.53% 0.72% 0.82% 10 Year Treasury 2.49% 2.48% 2.15% 1.68% 2 - 10 Year Treasury Spread 2.16% 1.95% 1.43% 0.86% Bank Margins • The curve is continuing to flatten • Hope is never a strategy

Technology has Fundamentally Changed Our Business 11 People do not come to branches anymore B ut they continue to want information and advice
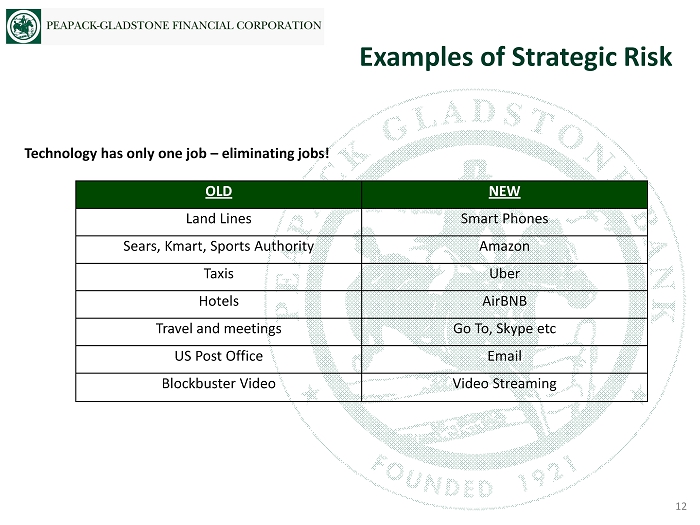
Examples of Strategic Risk 12 Technology has only one job – eliminating jobs! OLD NEW Land Lines Smart Phones Sears, Kmart, Sports Authority Amazon Taxis Uber Hotels AirBNB Travel and meetings Go To, Skype etc US Post Office Email Blockbuster Video Video Streaming

The Traditional Community Banking Model is Dead 13 Traditional Model • Historical Perspective • Asset Growth • Transactions • Products/Customers • Advertising • Brick and Mortar • SILO’ s • Single Stress Scenario Plans • Regulatory Constraints • Audit • Board Cronyism • Job Training/Personnel Dept • Grow Customer Base Today’s Model • Forward Looking • Value Creation • Relationships • Solutions/Clients • Targeted Marketing/Branding • Targeted Multi - channel Delivery • Integrated Organizations • Multiple Stress Test Scenarios • Market Opportunities • Integrated ERM • Effective Corporate Governance • Talent Management • Client Analytics and Profitability
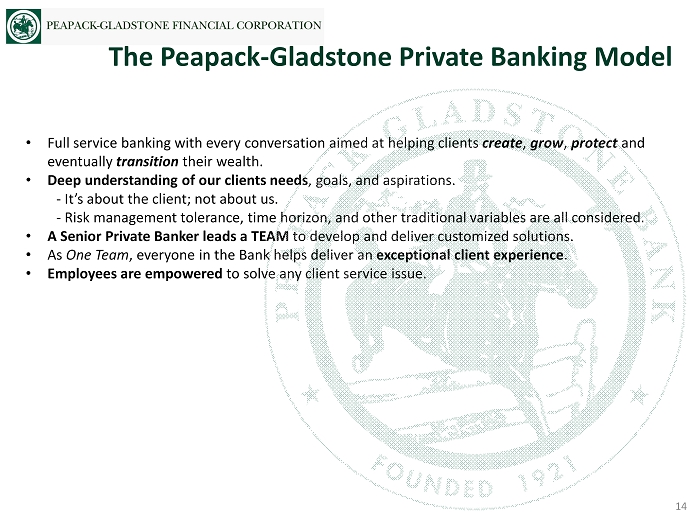
• Full service banking with every conversation aimed at helping clients create , grow , protect and eventually t ransition their wealth. • Deep understanding of our clients needs , goals, and aspirations. - It’s about the client; not a bout us. - Risk management tolerance , time horizon, and other traditional variables are all considered. • A Senior P rivate B anker leads a TEAM to develop and deliver customized solutions. • As One Team , everyone in the Bank helps deliver an exceptional client experience . • Employees are empowered to solve any client service issue. The Peapack - Gladstone Private Banking Model 14

15 Our Strategy is an ongoing journey that continually focuses on: Ensuring our Core Principles are ingrained in all staff • Formal training on the operating behaviors necessary to deliver the core principles • Established standard telephone greeting and service protocols utilized throughout the Bank • All employees empowered to correct a client issue • All staff encouraged to use every opportunity to provide more than what is expected Listening to our Clients • Introduced NPS in 2015: % Promoters minus % Detractors - PGB 2015 Results: 48 vs. industry average of 23 (based on Tempkin Research Study) - PGB initial 2016 Results: 10.5% improvement from 2015 - Feedback tells us it is critical to develop a personal connection with our clients - We “close the loop” with all Detractors to understand and correct issues • Established Director of Client Experience position and introduced internal Voice of the Client Committee Perfecting the Client Experience

Perfecting the Client Experience 16 Listening to our Staff and Delivering a Best in Class Employee Experience • Established P.A.C.E. program ( P eapack A lways C aring for E mployees) • We listened and implemented: - Programs to improve communication: strategy presentations, PGB Weekly - Career Development Institute: Focus on Training - Social Events - Created a sincere desire to make it fun to work at Peapack - Gladstone Bank. • Happy Employees = Happy Clients = Happy Shareholders Innovation and Differentiation • Reengineering Client On - boarding via JHA Branch Anywhere , Doc I maging , and e - Sign technology - B ring the Bank to our Clients anywhere, anytime that is convenient - Deliver a client on - boarding experience that is personal, flexible, and efficient • We are developing a plan to create a differentiated service model for our top revenue generating clients • Leverage Salesforce to capture personal client data; enabling us to: - Remember birthdays, anniversaries, special events - Create lasting client memories and a personal connection by accessing and utilizing data

Client Analytics 17 • Salesforce is our centralized repository • Ability to understand client data and established clear understanding of how to use it • Know our top clients and how they expect to be treated • Provide a consistent client experience by delivering meaningful client information to personal bankers and client facing personnel • Creating a customized client experience based on what the client and the data is telling us • Client contact personnel are well trained on the company culture and available technology so they are prepared to deliver an exceptional experience • Delivery of an exceptional client experience needs to be consistently executed, whether its face - to - face or through electronic delivery channels • Smart technology never surpasses the “personal touch” but is critical to the overall client experience – (Costco vs. Nordstrom)

The Client Experience Augmented Through Technology 18 Intelligent t echnology is critical to the client experience • Customized online client portal interaction • Customized ATM experience • Customized call center and support department Interactions • Customized online and mobile banking capabilities Technology is critical to the delivery of an exceptional client experience • Branch Anywhere mobile technology • Enhanced automation of account onboarding and KYC processes • Best of Breed electronic forms with e - sign capabilities • Increased use of document imaging and electronic document delivery portals • Additional client controlled processes - Initiation of wire transfers - Fraud prevention

1. Reflects reported net income as per 10 - K; includes $ 2.50 million of pre - tax non - recurring charges related to the closure of two branch offices 2. Reflects reported net income as per 10 - Q; includes $1.90 million of pre - tax charges related to increased FDIC premiums Our Strategy is Delivering Results $0.00 $5.00 $10.00 $15.00 $20.00 $25.00 2013 2014 2015 6 Mos Ended 06/30/16 2 (Dollars in Millions) $9.26 $14.89 $19.97 $12.05 1 Year Over Year +34% 19 Net Income

1. Includes SBA Income, SWAP Income, Deposit & Loan Fees, Mortgage Banking, and BOLI Enviable Revenue Mix 76.4% 15.5% 6.4% 0.1% 1 .6% 78.1% 15.7% 5.2% 0.5% 0.5% For the Year Ended December 31, 2015 For the Quarter Ended June 30, 2016 20 Total Fee Income 21.9% of Total Revenue Total Fee Income 23.6% of Total Revenue Net Interest Income before Provision Wealth Fee Income Fees & Other Income Gain on Sale of Multifamily Loans Gain on Sale of Securities 1 Target 30% - 40%

Wealth Management Assets Under Admin Wealth Management Fee Income Wealth Management Overview $4.00 $6.00 $8.00 $10.00 $12.00 $14.00 $16.00 $18.00 2012 2013 2014 2015 6 Mos Ended 06/30/16 (Dollars in Millions) $2.00 $2.25 $2.50 $2.75 $3.00 $3.25 $3.50 2012 2013 2014 2015 Q2 2016 (Dollars in Billions) 21 $12.28 $13.84 $15.24 $17.04 $9.19 $2.30 $2.69 $2.99 $3.42 $3.32 Yr Over Yr 12% Yr Over Yr 11%

Our Strategy Is Attracting a Higher Value Client Account Type New Accounts Three Years or Less % of Total Outstandings 2016 Legacy Accounts Three Years or More % of Total Outstandings 2016 % Increase in Average Account Size Average Deposit $103,000 53% $31,000 47% 232% Average Loan $1,365,000 58% $282,000 42% 384% Average Wealth $2,565, 996 35% $1,264,000 65% 103%* Total Products 51% Total Products 49% *Average annual yield up approximately 20% over the same period. 22
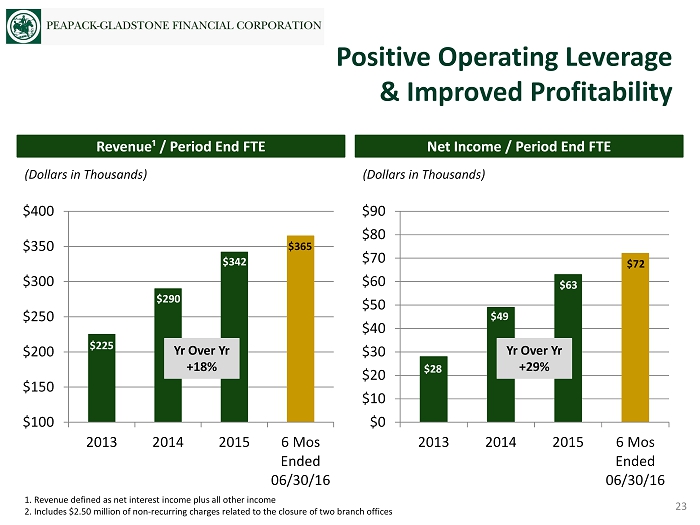
1. Revenue defined as net interest income plus all other income 2. Includes $2.50 million of non - recurring charges related to the closure of two branch offices Net Income / Period End FTE Revenue¹ / Period End FTE (Dollars in Thousands) (Dollars in Thousands) Positive Operating Leverage & Improved Profitability $100 $150 $200 $250 $300 $350 $400 2013 2014 2015 6 Mos Ended 06/30/16 $225 $290 $342 $365 Yr Over Yr +18% $0 $10 $20 $30 $40 $50 $60 $70 $80 $90 2013 2014 2015 6 Mos Ended 06/30/16 Yr Over Yr +29% $28 $49 $63 $72 23
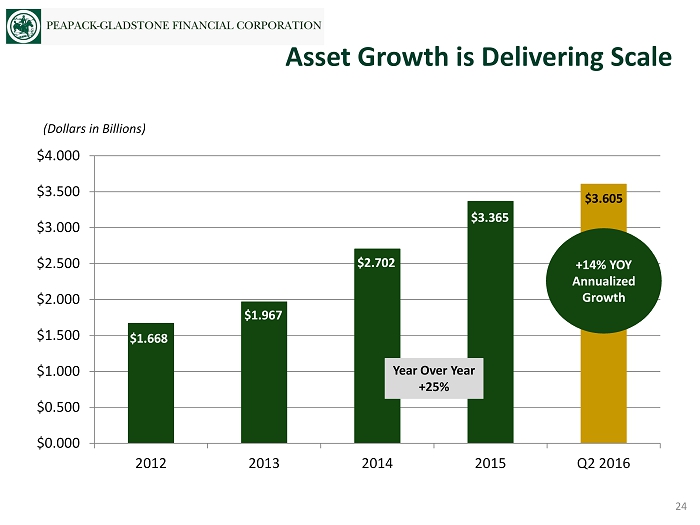
Asset Growth is Delivering Scale $0.000 $0.500 $1.000 $1.500 $2.000 $2.500 $3.000 $3.500 $4.000 2012 2013 2014 2015 Q2 2016 (Dollars in Billions) $3.605 24 +14% YOY Annualized Growth $3.365 $2.702 $1.967 $1.668 Year Over Year +25%

Note: Gross loans include loans held for sale Organic Gross Loan Growth 25 $0.000 $0.500 $1.000 $1.500 $2.000 $2.500 $3.000 $3.500 2012 2013 2014 2015 Q2 2016 $2.997 $2.251 $1.576 $1.153 $3.213 Year Over Year +28% +14% YOY Annualized Growth (Dollars in Billions) Multifamily Commercial & Industrial CRE Residential, Consumer & Oth er

Gross Loans: $3.213 Billion Loan Composition 06/30/2016 Multifamily Commercial & Industrial CRE Residential, Consumer & Other 48.6% 19.2% 17.9% 14.3% 26 Target: 25% - 30% Target: 15% - 25% Target: 15% - 20% Target: 35% - 45%

Proven track record of providing solid risk - adjusted returns Geographically diversified portfolio – as of June 30, 2016: • New York – 50%; Top Markets – Bronx and Brooklyn • New Jersey – 40%; Top Markets – Hudson, Essex, & Morris/Somerset/Union Counties • Pennsylvania – 10%; Top Markets – Suburban Philadelphia and Bucks County As of June 30, 2016 • Current balance: $1.56 billion • Active loan participations sold and loan sales • To date , $400 million sold or participated to approximately 10 institutions • Number of multifamily loans in portfolio : 552 • Average loan size : $2.8 million • Weighted average LTV: approximately 64% • Weighted average DSCR (after underwriting stress): approximately 1.5x • No nonaccruals; no 30 day delinquencies • Generally all “workforce housing” – average rent just over $1,000 • New data warehouse captures 63 data points per loan • Recent stress test applied to Multifamily reveals considerable strength under a variety of adverse scenario’s Why We Like Our Multifamily Portfolio 27

1. Nonperforming loans defined as nonaccrual loans plus loans 90+ days past due 2. Texas Ratio defined as nonaccrual loans plus other real estate owned and loans 90+ day past due as a percentage of the sum of ta ngible common equity and loan loss reserves 3. NCOs/average loans for Q2 2016 reflects quarterly ratio, not an annualized value Note: Total loans exclude loans held for sale Texas Ratio² NPLs¹ / Loans NCOs / Average Loans LLR / Gross Loans Credit Metrics and Performance 0.00% 0.50% 1.00% 1.50% 2.00% 2011 2012 2013 2014 2015 Q2 2016 0.00% 5.00% 10.00% 15.00% 20.00% 25.00% 2011 2012 2013 2014 2015 Q2 2016 0.75% 1.00% 1.25% 1.50% 2011 2012 2013 2014 2015 Q2 2016 0.00% 0.20% 0.40% 0.60% 0.80% 1.00% 2011 2012 2013 2014 2015 Q2 2016 1.85% 0.42% 0.30% 0.23% 0.26% 1.04% 21.66% 11.34% 4.62% 3.13% 2.45% 2.74% 1.27% 1.12% 0.98% 0.87% 0.89% 0.93% 0.86% 0.04% 0.80% 0.06% 0.03% 0.01% 3 28

Commercial & Industrial Loans $0 $100 $200 $300 $400 $500 $600 2012 2013 2014 2015 06/30/16 (Dollars in Millions) $115 $132 $309 $513 $576 29 +25% YOY Annualized Growth Year Over Year +66%

30 $0.000 $0.500 $1.000 $1.500 $2.000 $2.500 $3.000 $3.500 2012 2013 2014 2015 06/30/16 $2.935 $2.299 $1.647 $1.516 $3.109 Deposit Growth Year Over Year +28% +12% YOY Annualized Growth (Dollars in Billions) Noninterest - bearing DDA Interest - bearing Demand Savings & MMDA Time
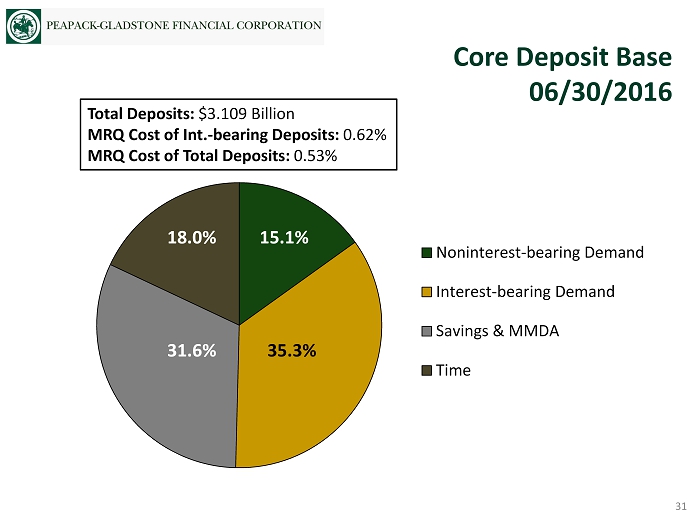
Total Deposits: $3.109 B illion MRQ Cost of Int. - bearing Deposits: 0.62% MRQ Cost of Total Deposits : 0.53% Core Deposit Base 06/30/2016 Noninterest-bearing Demand Interest-bearing Demand Savings & MMDA Time 35.3% 31.6% 18.0% 15.1% 31

• EPS Growth – High single digit to low double digit EPS growth. • Return on Equity – 10 %+ target run rate by 2018. • Efficiency Ratio – Low to mid 50’s by 2018. • Balance Sheet Growth / Loan Growth – 10% to 15% balance sheet growth; 12% to 18% loan growth. • Loan Mix – Continued diversification into Commercial & Industrial and Wealth relationship based residential lending. Near term portfolio targets: » C&I: 25% - 30% » CRE: 15 % - 20% » Multifamily: 35% - 45% » Residential/Consumer: 15% - 25% • Revenue Mix – Fee income target of 30%. Organic growth, Wealth M&A plus gains in Treasury Management, SBA, SWAPs and loan sales will drive this growth. • Funding – Continued funding from diversified sources . A large portion of asset growth to be funded by core customer deposits . • Dividends – To remain low to support growth. • Capital – Common equity sufficient for the foreseeable future. Financial Targets: 2016 and Beyond 32

Questions P EAPACK - G LADSTONE B ANK
Serious News for Serious Traders! Try StreetInsider.com Premium Free!
You May Also Be Interested In
- Piper Sandler Downgrades Peapack-Gladstone Financial (PGC) to Neutral
- Elavon and FreedomPay to transform payments for hospitality and retail in Europe
- Peapack Private (PGC) Appoints Greg Tamberlane as SVP, Head of Commercial Bank Operations New York
Create E-mail Alert Related Categories
SEC FilingsSign up for StreetInsider Free!
Receive full access to all new and archived articles, unlimited portfolio tracking, e-mail alerts, custom newswires and RSS feeds - and more!
