

Form 8-K PARAGON OFFSHORE PLC For: Dec 08
 Tweet
Tweet Share
Share�
�
UNITED STATES
SECURITIES AND EXCHANGE COMMISSION
Washington, D.C. 20549
�
�
FORM 8-K
�
�
CURRENT REPORT
Pursuant to Section�13 or 15(d)
of the Securities Exchange Act of 1934
Date of report (date of earliest event reported): December�8, 2014
�
�
PARAGON OFFSHORE plc
(Exact name of Registrant as specified in its charter)
�
�
�
| England and Wales | � | 001-36465 | � | 98-1146017 |
| (State�or�other�jurisdiction�of incorporation or organization) |
� | (Commission file number) |
� | (I.R.S. employer identification number) |
�
| 3151 Briarpark Drive, Suite 700 Houston, Texas |
� | 77042 |
| (Address of principal executive offices) | � | (Zip code) |
Registrant�s telephone number, including area code: +44 20 330 2300
�
�
Check the appropriate box below if the Form 8-K filing is intended to simultaneously satisfy the filing obligation of the registrant under any of the following provisions:
�
| � | Written communications pursuant to Rule 425 under the Securities Act (17 CFR 230.425) |
�
| � | Soliciting material pursuant to Rule 14a-12 under the Exchange Act (17 CFR 240.14a-12) |
�
| � | Pre-commencement communications pursuant to Rule 14d-2(b) under the Exchange Act (17 CFR 240.14d-2(b)) |
�
| � | Pre-commencement communications pursuant to Rule 13e-4(c) under the Exchange Act (17 CFR 240.13e-4(c)) |
�
�
�
| Item�7.01 | Regulation FD Disclosure |
Investor Presentation
On December�8, 2014, Randall D. Stilley, President, Chief Executive Officer and Director of Paragon Offshore plc (�Paragon�), will attend the 2014 Wells Fargo Energy Symposium Conference in New York City, New York. The event will not be webcast. However, presentation slides used during investor meetings will be available on December�8, 2014 on Paragon�s website at www.paragonoffshore.com, under �Events�& Presentations� in the �Investor Relations� section of the website. The presentation slides are also included as Exhibit 99.1 to this Current Report on Form 8-K and are incorporated herein by reference.
The information presented in Item�7.01 to this Current Report on Form 8-K is being furnished in accordance with Rule 101(e)(1) under Regulation FD and shall not be deemed to be �filed� for purposes of Section�18 of the Securities Exchange Act of 1934, as amended, and will not be incorporated by reference into any registration statement filed under the Securities Act of 1933, as amended, unless specifically identified therein as being incorporated by reference.
Forward Looking Statements
Certain statements in this current report constitute �forward-looking statements� within the meaning of the U.S. federal securities laws. These statements reflect management�s current expectations regarding future events and speak only as of the date of this current report. Forward-looking statements involve significant risks and uncertainties, should not be read as guarantees of future performance and will not necessarily be accurate indications of whether or not, or the times at or by which, events will occur. Actual performance may differ materially from that expressed or implied in such statements. Although the forward-looking statements contained in this current report are based upon what are believed to be reasonable assumptions, investors cannot be assured that actual results will be consistent with these forward-looking statements, and the differences may be material. These forward-looking statements are made as of the date of this current report and, except as expressly required by applicable law, the Company assumes no obligation to update or revise them to reflect new events or circumstances.
�
| Item�9.01 | Financial Statements and Exhibits. |
�
| � | (d) | Exhibits. |
�
| EXHIBIT |
�� | � | �� | DESCRIPTION |
| 99.1 | �� | � | �� | Slide presentation of Paragon to be used at the 2014 Wells Fargo Energy Symposium Conference on December�8, 2014. |
SIGNATURES
Pursuant to the requirements of the Securities Exchange Act of 1934, the Registrant has duly caused this report to be signed on its behalf by the undersigned hereunto duly authorized.
�
| � | � | Paragon Offshore plc, a public limited company incorporated under the laws of England and Wales | ||||
| Date: December 8, 2014 | � | � | � | |||
| � | � | By: | � | /s/ Steven A. Manz | ||
| � | � | Name: | � | Steven A. Manz | ||
| � | � | Title: | � | Senior Vice President and Chief Financial Officer | ||
INDEX TO EXHIBITS
�
| EXHIBIT |
�� | � | �� | DESCRIPTION |
| 99.1 | �� | � | �� | Slide presentation of Paragon to be used at the 2014 Wells Fargo Energy Symposium Conference on December�8, 2014. |
Exhibit 99.1
�

PARAGON
OFFSHORE
2014 Wells Fargo Energy Symposium
Presentation for 1x1 Meetings
December 8-9, 2014
New York, NY
www.paragonoffshore.com
Safe Harbor Statement
PARAGON
OFFSHORE
This material contains statements that are �forward-looking statements� about Paragon�s business and financial performance. These statements can be identified by the
fact that they do relate strictly to current or historical facts. Each future projection is a forward-looking statement that involves certain risks, uncertainties and assumptions. These include but are not
limited to operational risks, actions by regulatory authorities or other third parties, costs and difficulties related to the separation, market conditions, financial results and performance, tax rates, ability to repay debt and timing thereof,
actions by customers and other third parties, factors affecting the level of activity in the oil and gas industry, supply and demand of drilling rigs, factors affecting the duration of contracts, the actual amount of downtime, factors that reduce
applicable dayrates, violations of anticorruption laws, the future price of oil and gas, statements related to the anticipated mandatory tender offer for Prospector, the time frame in which it is expected to occur, the expected benefits of the
proposed acquisition, the future financial performance of the assets after the proposed acquisition, and the contract backlog, revenue, condition or performance, contract commitments, dayrates, contract commencements, contract extensions or renewals
of Prospector�s fleet, and other factors including those detailed in Paragon�s filings with the Securities and Exchange Commission. Should one or more of these risks or uncertainties materialize, or should underlying assumptions prove
incorrect, actual results may vary materially from those indicated. Paragon disclaims any duty to update the information presented here.
www.paragonoffshore.com 2
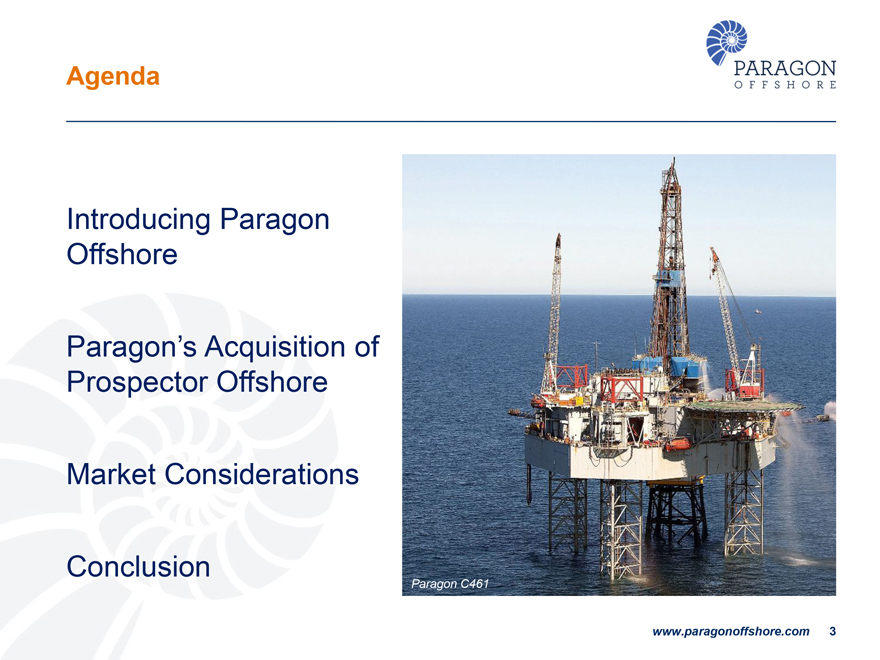
Agenda
PARAGON
OFFSHORE
Introducing Paragon
Offshore
Paragon�s Acquisition of
Prospector Offshore
Market Considerations
Conclusion
Paragon C461
www.paragonoffshore.com 3
Overview of Paragon Offshore
PARAGON
OFFSHORE
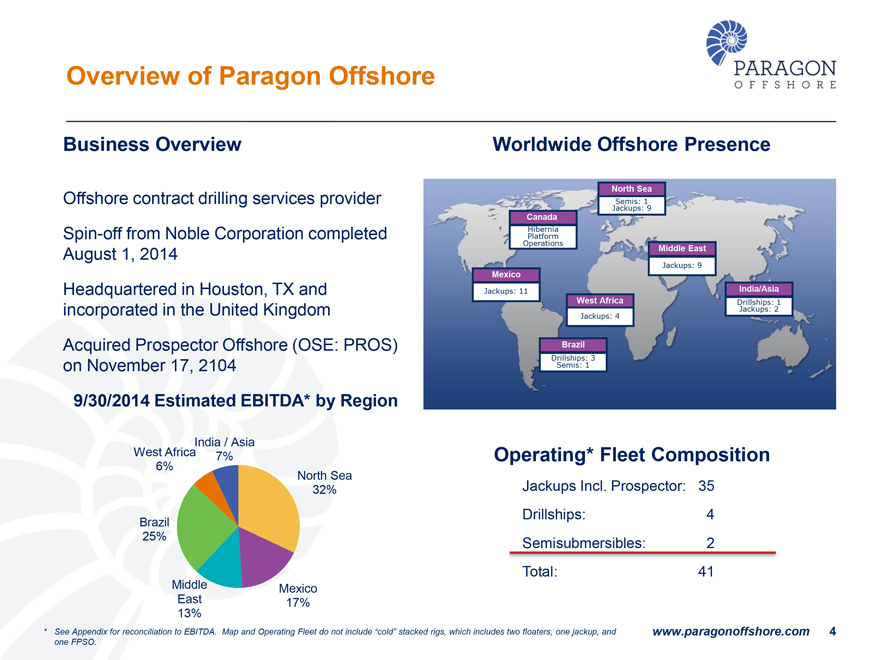
Business Overview
Offshore contract drilling services provider
Spin-off from Noble Corporation completed August 1, 2014
Headquartered in Houston, TX and
incorporated in the United Kingdom
Acquired Prospector Offshore (OSE: PROS) on November 17, 2104
9/30/2014 Estimated EBITDA* by Region
India / Asia
7%
West Africa
6%
North Sea
32%
Brazil
25%
Middle
East
13%
Mexico
17%
Worldwide Offshore Presence
North Sea
Semis: 1
Jackups: 9
Canada
Hibernia
Platform
Operations
Middle East
Jackups: 9
Mexico
Jackups: 11
India/Asia
Drillships: 1
Jackups: 2
West Africa
Jackups: 4
Brazil
Drillships: 3
Semis: 1
Operating* Fleet Composition
Jackups Incl. Prospector: 35
Drillships: 4
Semisubmersibles: 2
Total: 41
* See Appendix for reconciliation to EBITDA. Map and Operating Fleet do not include
�cold� stacked rigs, which includes two floaters, one jackup, and one FPSO.
www.paragonoffshore.com 4
PARAGON
OFFSHORE
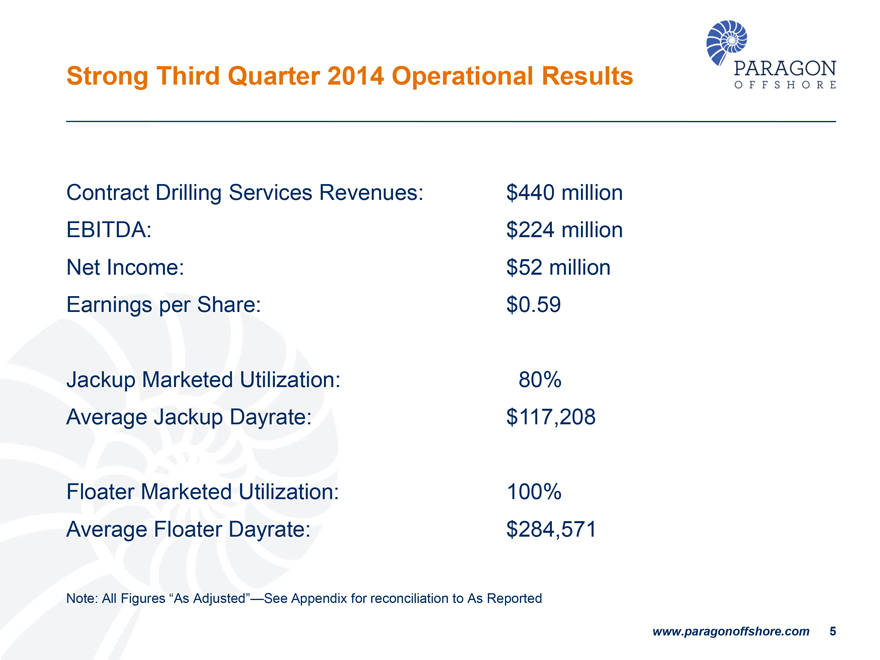
Strong Third Quarter 2014 Operational Results
Contract Drilling Services
Revenues: $440 million
EBITDA: $224 million
Net Income: $52 million
Earnings per Share: $0.59
Jackup Marketed Utilization: 80%
Average Jackup Dayrate: $117,208
Floater Marketed Utilization: 100%
Average Floater Dayrate: $284,571
Note: All Figures �As Adjusted��See Appendix
for reconciliation to As Reported
www.paragonoffshore.com 5
PARAGON
OFFSHORE
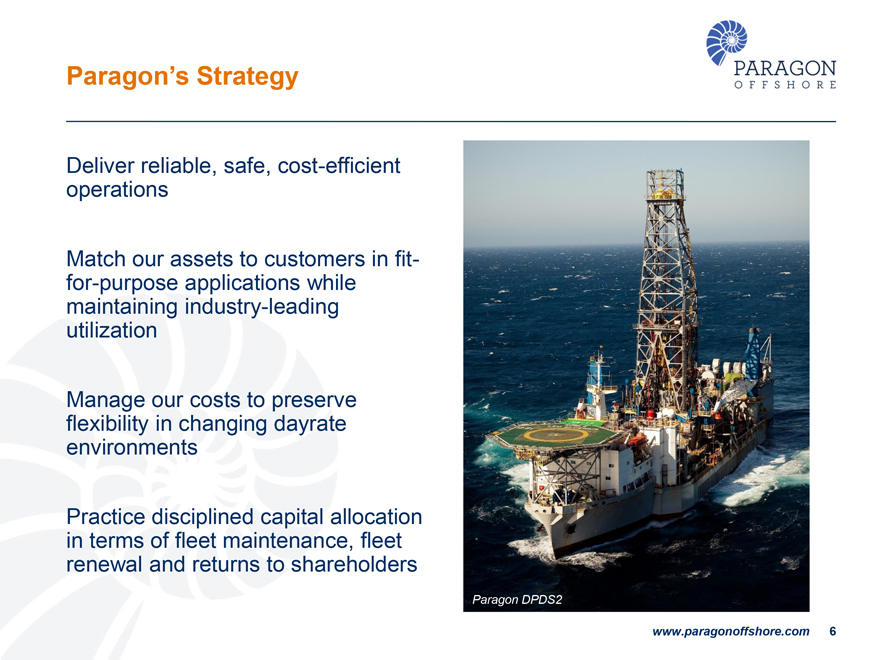
Paragon�s Strategy
Deliver reliable, safe, cost-efficient operations
Match our assets to customers in fit- for-purpose applications while maintaining industry-leading utilization
Manage our costs to preserve flexibility in changing dayrate environments
Practice disciplined
capital allocation in terms of fleet maintenance, fleet renewal and returns to shareholders
Paragon DPDS2
www.paragonoffshore.com 6
PARAGON
OFFSHORE
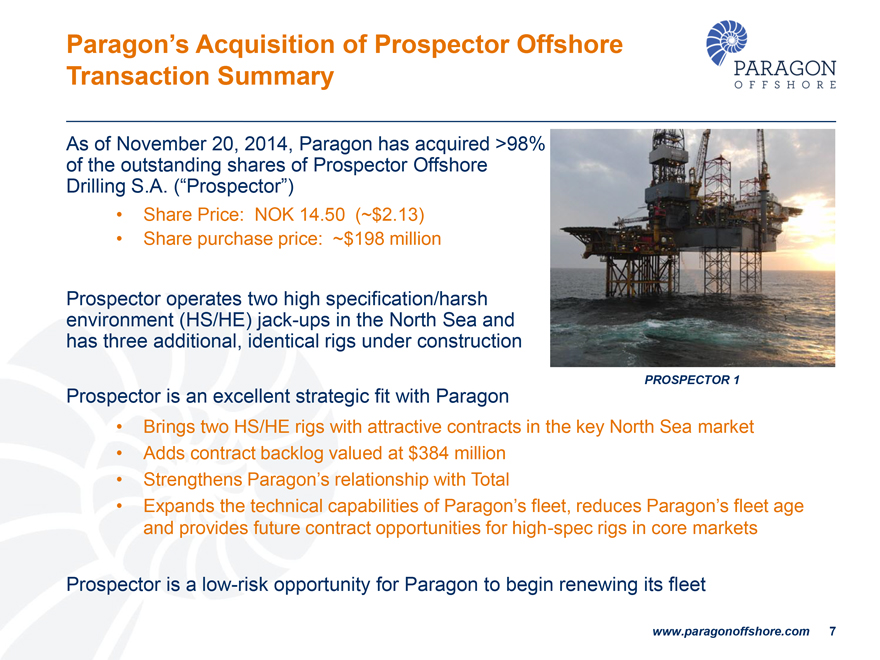
Paragon�s Acquisition of Prospector Offshore
Transaction Summary
As of November�20, 2014, Paragon has acquired >98% of the outstanding shares of Prospector Offshore Drilling S.A. (�Prospector�)
Share Price: NOK 14.50 (~$2.13)
Share purchase price: ~$198 million
Prospector operates two high specification/harsh environment (HS/HE) jack-ups in the North Sea and has three additional, identical rigs under construction
Prospector is an excellent strategic fit with Paragon
Brings two HS/HE rigs with attractive
contracts in the key North Sea market
Adds contract backlog valued at $384 million
Strengthens Paragon�s relationship with Total
Expands the technical capabilities of
Paragon�s fleet, reduces Paragon�s fleet age and provides future contract opportunities for high-spec rigs in core markets
Prospector is a low-risk
opportunity for Paragon to begin renewing its fleet
PROSPECTOR 1
www.paragonoffshore.com 7
PARAGON
OFFSHORE
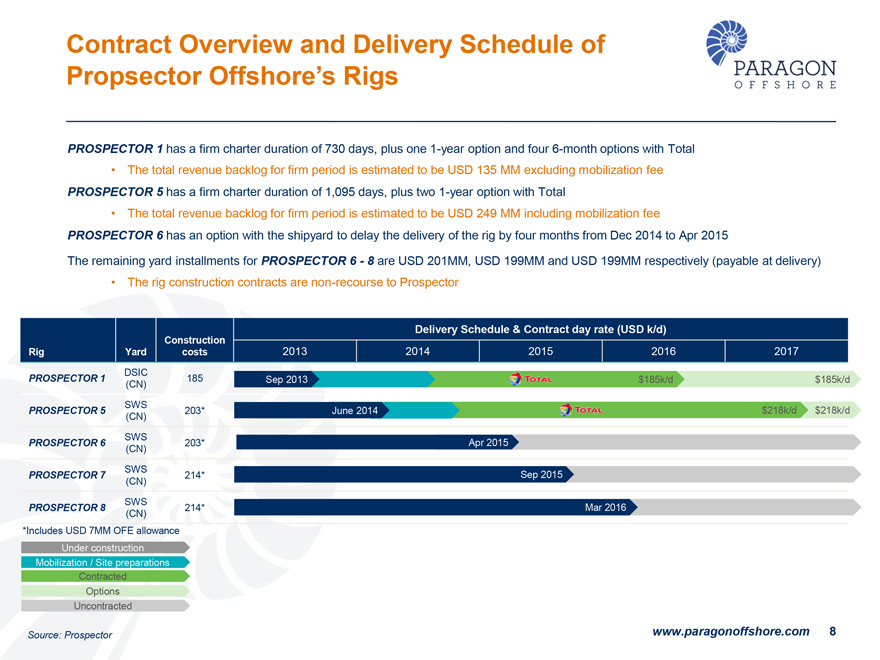
Contract Overview and Delivery Schedule of
Propsector Offshore�s Rigs
PROSPECTOR 1 has a firm charter duration of 730 days, plus one 1-year option and four 6-month options with Total
The total revenue backlog for firm period is estimated to be USD 135 MM excluding mobilization fee
PROSPECTOR 5 has a firm charter duration of 1,095 days, plus two 1-year option with Total
The
total revenue backlog for firm period is estimated to be USD 249 MM including mobilization fee
PROSPECTOR 6 has an option with the shipyard to delay the delivery
of the rig by four months from Dec 2014 to Apr 2015
The remaining yard installments for PROSPECTOR 6 - 8 are USD 201MM, USD 199MM and USD 199MM respectively
(payable at delivery)
The rig construction contracts are non-recourse to Prospector
Delivery Schedule & Contract day rate (USD k/d)
Rig Yard Construction costs 2013 2014 2015
2016 2017
PROSPECTOR 1 DSIC 185 Sep 2013 TOTAL $185k/d $185k/d
(CN)
PROSPECTOR 5 SWS 203* June 2014 TOTAL $218k/d $218k/d
(CN)
203* Apr 2015
PROSPECTOR 6 SWS
(CN)
214* Sep 2015
SWS
PROSPECTOR 7
(CN)
214* Mar 2016
PROSPECTOR 8 SWS
(CN)
*Includes USD 7MM OFE allowance
Under construction Mobilization
/ Site preparations Contracted
Options
Uncontracted
Source: Prospector
www.paragonoffshore.com 8
PARAGON
OFFSHORE
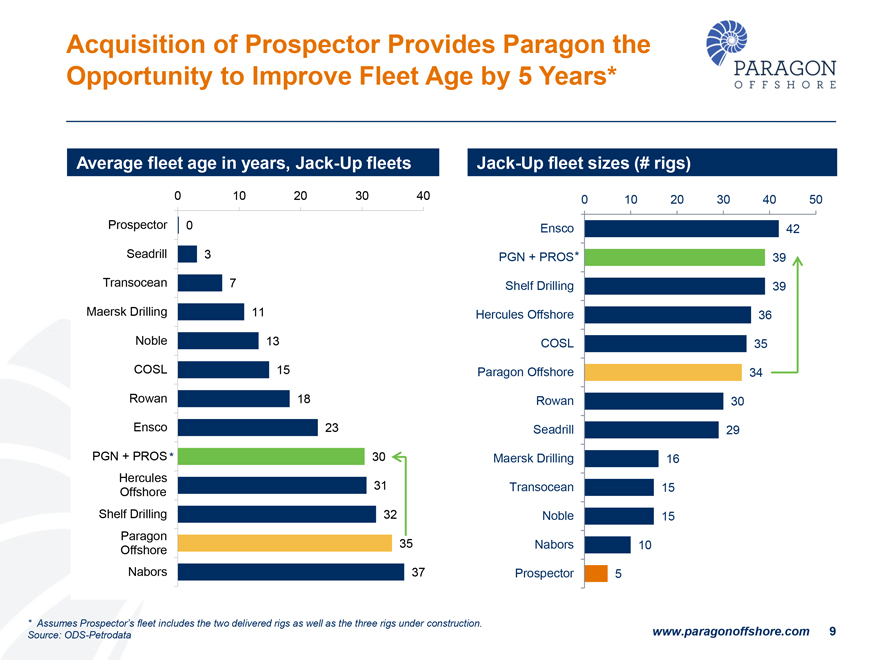
Acquisition of Prospector Provides Paragon the
Opportunity to Improve Fleet
Age by 5 Years*
Average fleet age in years, Jack-Up fleets
0 10 20 30 40
Prospector 0
Seadrill 3
Transocean 7
Maersk Drilling 11
Noble 13
COSL 15
Rowan 18
Ensco 23
PGN + PROS * 30
Hercules 31
Offshore
Shelf Drilling 32
Paragon
Offshore 35
Nabors 37
Jack-Up fleet sizes (# rigs)
0 10 20 30 40 50
Ensco 42
PGN + PROS* 39
Shelf Drilling 39
Hercules Offshore 36
COSL 35
Paragon Offshore 34
Rowan 30
Seadrill 29
Maersk Drilling 16
Transocean 15
Noble 15
Nabors 10
Prospector 5
* Assumes Prospector�s fleet includes the two delivered rigs as well as the three rigs under construction.
Source: ODS-Petrodata
www.paragonoffshore.com 9
PARAGON
OFFSHORE
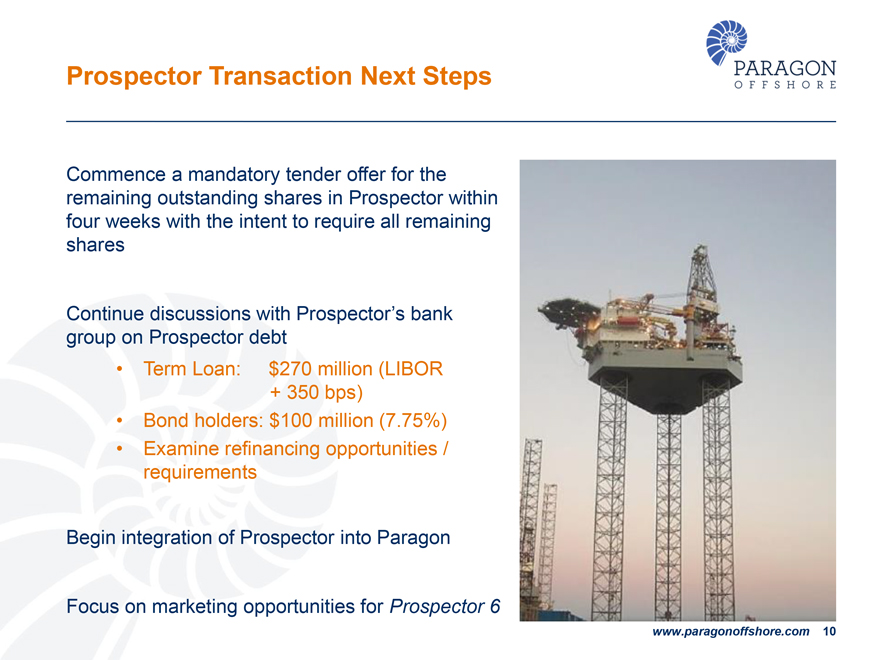
Prospector Transaction Next Steps
Commence a mandatory tender offer for the
remaining outstanding shares in Prospector within four weeks with the intent to require all remaining shares
Continue discussions with Prospector�s bank
group on Prospector debt
Term Loan: $270 million (LIBOR
+ 350 bps)
Bond holders: $100 million (7.75%)
Examine refinancing opportunities / requirements
Begin integration of Prospector into Paragon
Focus on marketing opportunities for Prospector 6
www.paragonoffshore.com 10
PARAGON
OFFSHORE
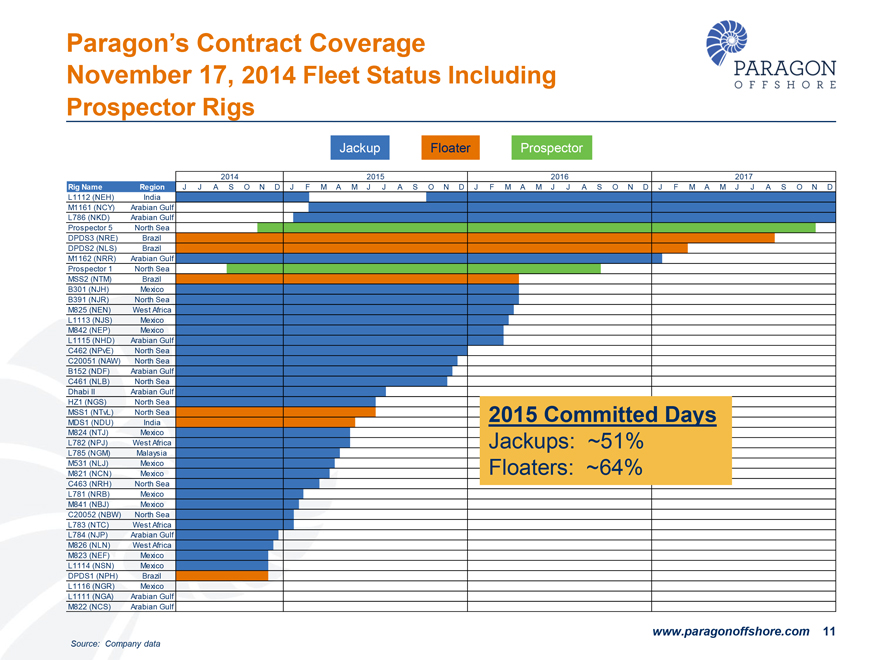
Paragon�s Contract Coverage
November�17, 2014 Fleet Status
Including
Prospector Rigs
Jackup Floater Prospector
2014 2015 2016 2017
Rig Name Region J J A S O N D J F M A M J J A S O N D J F M A M J J A S O
N D J F M A M J J A S O N D
L1112 (NEH) India
M1161 (NCY) Arabian Gulf
L786 (NKD) Arabian Gulf
Prospector 5 North Sea
DPDS3 (NRE) Brazil
DPDS2 (NLS) Brazil
M1162 (NRR) Arabian Gulf
Prospector 1 North Sea
MSS2 (NTM) Brazil
B301 (NJH) Mexico
B391 (NJR) North Sea
M825 (NEN) West Africa
L1113 (NJS) Mexico
M842 (NEP) Mexico
L1115 (NHD) Arabian Gulf
C462 (NPvE) North Sea
C20051 (NAW) North Sea
B152 (NDF) Arabian Gulf
C461 (NLB) North Sea
Dhabi II Arabian Gulf
HZ1 (NGS) North Sea
MSS1 (NTvL) North Sea 2015 Committed Days
MDS1 (NDU) India
M824 (NTJ) Mexico
L782 (NPJ) West Africa Jackups: ~51%
L785 (NGM) Malaysia
M531 (NLJ) Mexico Floaters: ~64%
M821 (NCN) Mexico
C463 (NRH) North Sea
L781 (NRB) Mexico
M841 (NBJ) Mexico
C20052 (NBW) North Sea
L783 (NTC) West Africa
L784 (NJP) Arabian Gulf
M826 (NLN) West Africa
M823 (NEF) Mexico
L1114 (NSN) Mexico
DPDS1 (NPH) Brazil
L1116 (NGR) Mexico
L1111 (NGA) Arabian Gulf
M822 (NCS) Arabian Gulf
www.paragonoffshore.com 11
Source: Company data
PARAGON
OFFSHORE
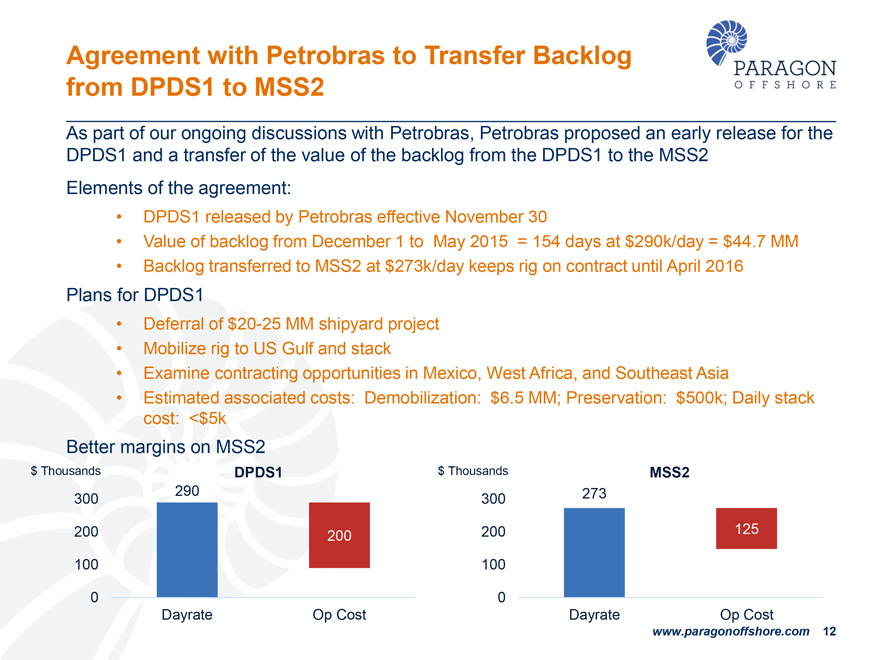
Agreement with Petrobras to Transfer Backlog from DPDS1 to MSS2
As part of
our ongoing discussions with Petrobras, Petrobras proposed an early release for the
DPDS1 and a transfer of the value of the backlog from the DPDS1 to the MSS2
Elements of the agreement:
DPDS1 released by Petrobras effective
November�30
Value of backlog from December�1 to May 2015 = 154 days at $290k/day = $44.7 MM
Backlog transferred to MSS2 at $273k/day keeps rig on contract until April 2016
Plans for
DPDS1
Deferral of $20-25 MM shipyard project
Mobilize rig to US Gulf and
stack
Examine contracting opportunities in Mexico, West Africa, and Southeast Asia
Estimated associated costs: Demobilization: $6.5 MM; Preservation: $500k; Daily stack cost: <$5k
Better margins on MSS2
$ Thousands DPDS1 $ Thousands MSS2
290 273
300 300
200 200 200 125
100 100
0 0
Dayrate Op Cost Dayrate Op Cost
www.paragonoffshore.com 12
PARAGON
OFFSHORE
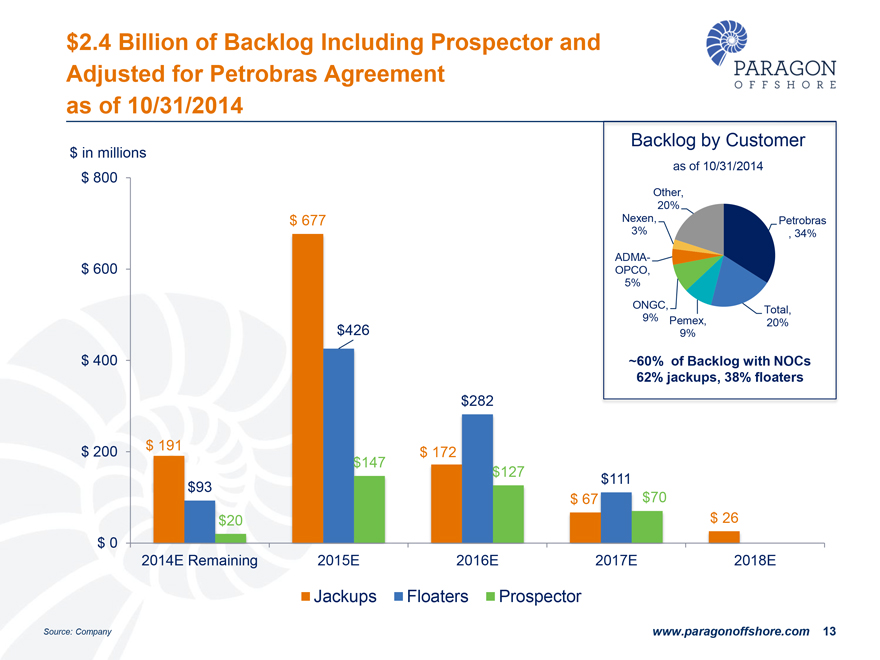
$2.4 Billion of Backlog Including Prospector and
Adjusted for Petrobras
Agreement as of 10/31/2014
Backlog by Customer
as of 10/31/2014
Other,
20%
Nexen, Petrobras
3% ,34%
ADMA-
OPCO,
5%
ONGC,�Total,
9% Pemex, 20%
9%
~60% of Backlog with NOCs
62% jackups, 38% floaters
$ in millions
$ 800
$ 677
$ 600
$426
$ 400
$282
$ 191
$ 200 $ 172
$147
$127
$111
$93
$ 67 $70
$20 $ 26
$ 0
2014E Remaining 2015E 2016E 2017E 2018E
Jackups Floaters Prospector
www.paragonoffshore.com 13
Source: Company data
PARAGON
OFFSHORE
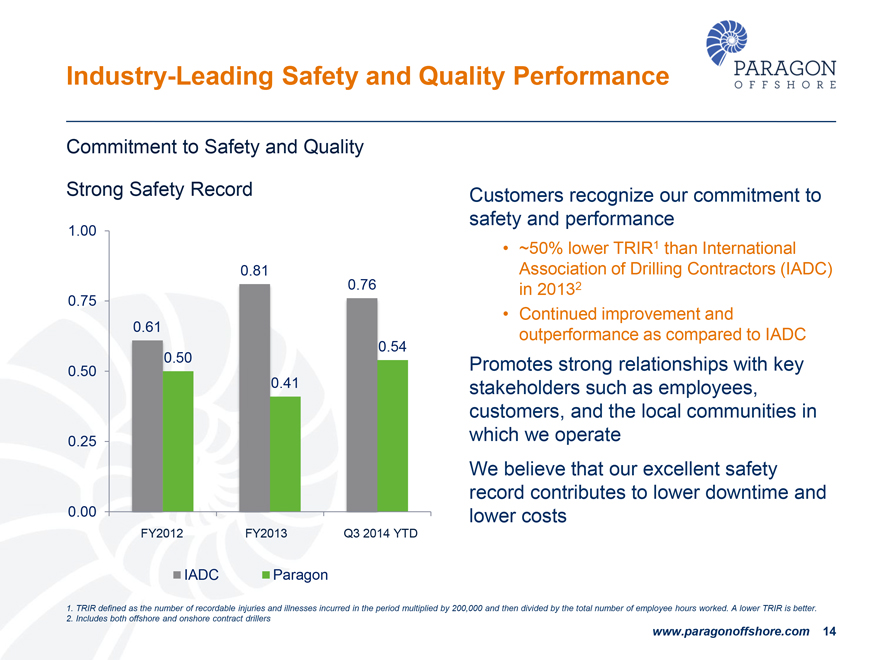
Industry-Leading Safety and Quality Performance
Commitment to Safety and
Quality
Strong Safety Record
1.00
0.81
0.76
0.75
0.61
0.54
0.50
0.50
0.41
0.25
0.00
FY2012 FY2013 Q3 2014 YTD
IADC Paragon
Customers recognize our commitment to safety and performance
~50% lower TRIR1 than
International Association of Drilling Contractors (IADC) in 20132
Continued improvement and outperformance as compared to IADC
Promotes strong relationships with key stakeholders such as employees, customers, and the local communities in which we operate We believe that our excellent safety record
contributes to lower downtime and lower costs
1. TRIR defined as the number of recordable injuries and illnesses incurred in the period multiplied by 200,000 and
then divided by the total number of employee hours worked. A lower TRIR is better.
2. Includes both offshore and onshore contract drillers
www.paragonoffshore.com 14
PARAGON
OFFSHORE
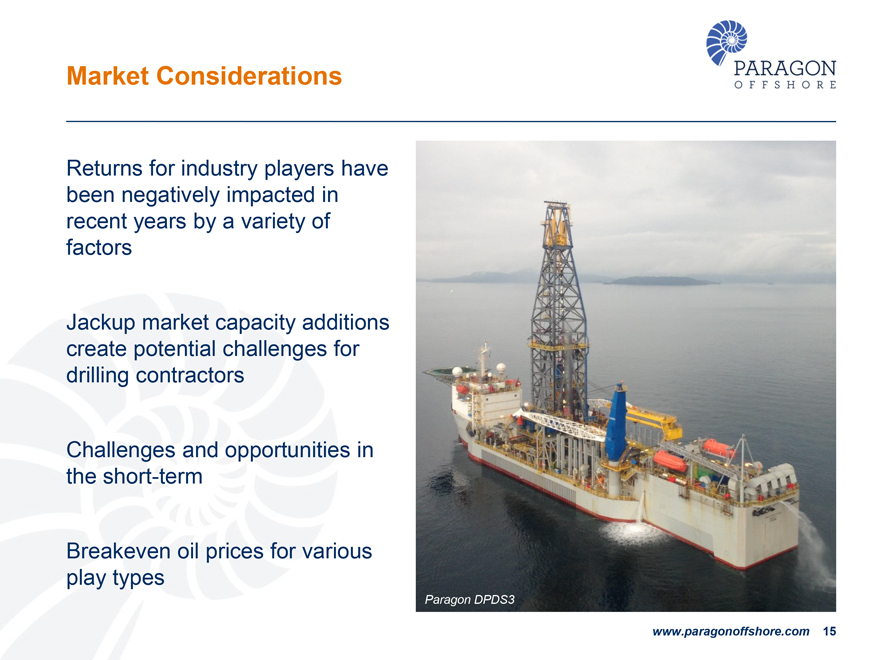
Market Considerations
Returns for industry players have been negatively
impacted in recent years by a variety of factors
Jackup market capacity additions create potential challenges for drilling contractors
Challenges and opportunities in the short-term
Breakeven oil prices for various play types
Paragon DPDS3
www.paragonoffshore.com 15
PARAGON
OFFSHORE
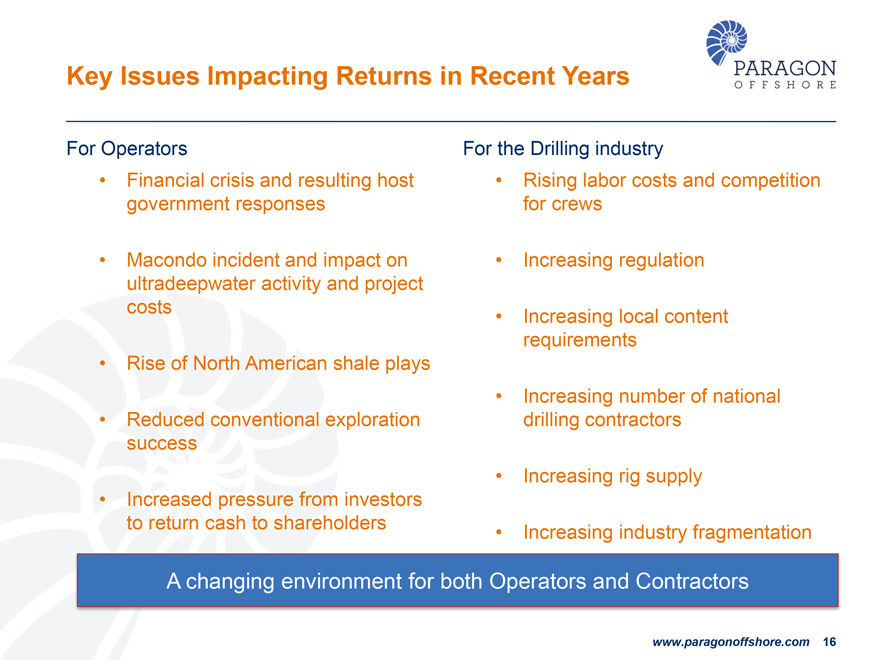
Key Issues Impacting Returns in Recent Years
For Operators
Financial crisis and resulting host government responses
Macondo incident and impact on
ultradeepwater activity and project costs
Rise of North American shale plays
Reduced conventional exploration success
Increased pressure from investors to
return cash to shareholders
For the Drilling industry
Rising labor costs and
competition for crews
Increasing regulation
Increasing local content
requirements
Increasing number of national drilling contractors
Increasing
rig supply
Increasing industry fragmentation
A changing environment for both
Operators and Contractors
www.paragonoffshore.com 16
PARAGON
OFFSHORE
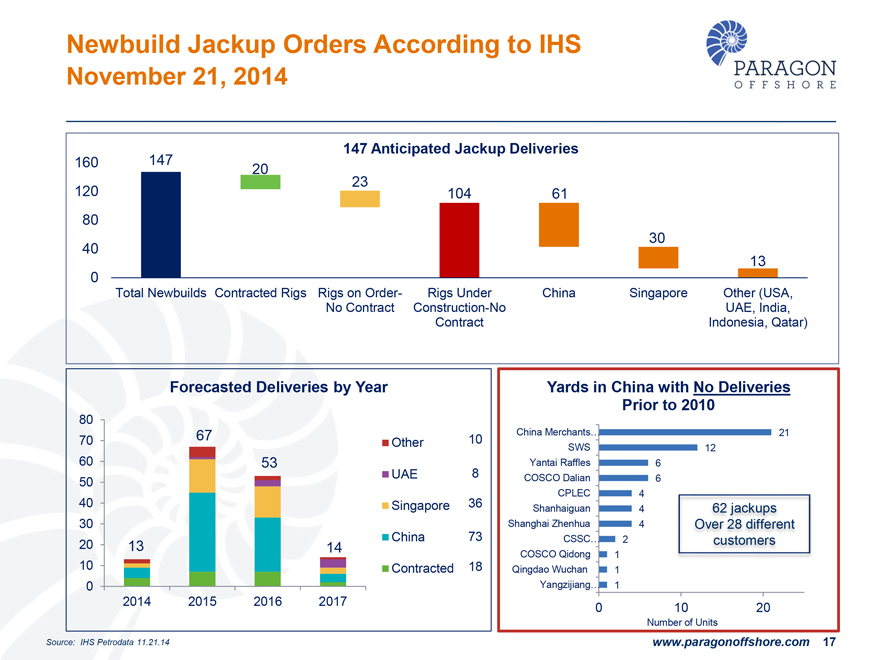
Newbuild Jackup Orders According to IHS
November�21, 2014
147 Anticipated Jackup Deliveries
160 120 80 40 0
147 20 23 104 61 30 13
Total Newbuilds Contracted Rigs Rigs on Order-No Contract Rigs Under
Construction-No Contract China Singapore Other (USA, UAE, India, Indonesia, Qatar)
Forecasted Deliveries by Year
80 70 60 50 40 30 20 10 0
13 67 53 14
2014 2015 2016 2017
Other
UAE
Singapore
China
Contracted
10 8 36 73 18
Yards in China with No Deliveries
Prior to 2010
China Merchants...
SWS
Yantai Raffles
COSCO Dalian
CPLEC
Shanhaiguan
Shanghai Zhenhua
CSSC...
COSCO Qidong
Qingdao Wuchan
Yangzijiang...
0 10 20
Number of Units
62 jackups Over 28 different customers
21
12
6
6
4
4
4
2
1
1
1
Source: IHS Petrodata 11.21.14
www.paragonoffshore.com 17
PARAGON
OFFSHORE
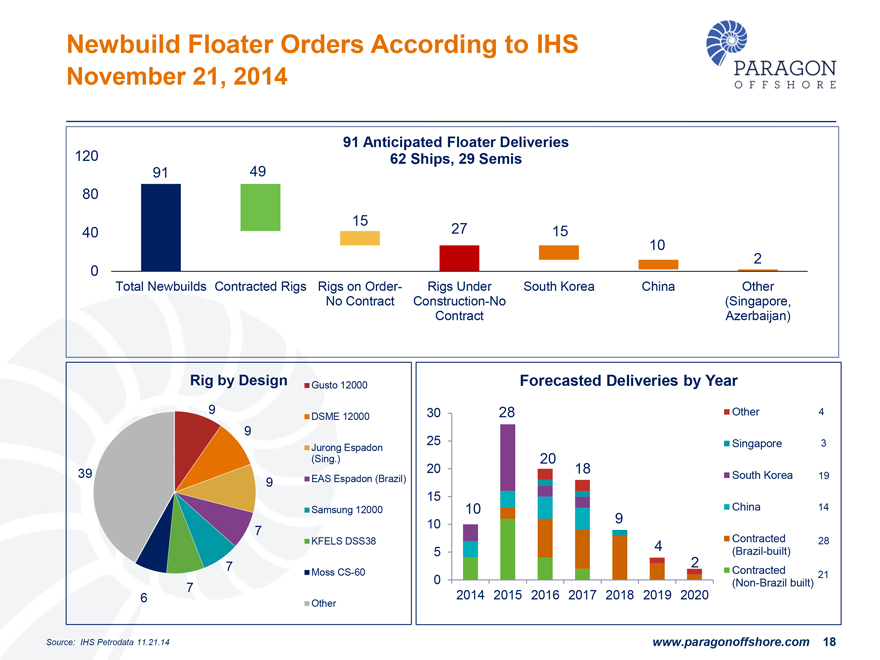
Newbuild Floater Orders According to IHS
November�21, 2014
91 Anticipated Floater Deliveries
62 Ships, 29 Semis
120 80 40 0
91 49 15 27 15 10 2
Total Newbuilds
Contracted Rigs
Rigs on Order-No Contract
Rigs Under Construction-No Contract
South Korea
China
Other (Singapore, Azerbaijan)
Rig by Design
39 9 9 9 7 7 7 6
Gusto 12000
DSME 12000
Jurong Espadon (Sing.)
EAS Espadon (Brazil)
Samsung 12000
KFELS DSS38
Moss CS-60
Other
Forecasted Deliveries by Year
30
25
20
15
10
5
0
2014
2015
2016
2017
2018
2019
2020
10 28 20 18 9 4 2
Other
Singapore
South Korea
China
Contracted (Brazil-built)
Contracted (Non-Brazil built)
4
3
19
14
28
21
Source: IHS Petrodata 11.21.14
www.paragonoffshore.com 18
PARAGON
OFFSHORE
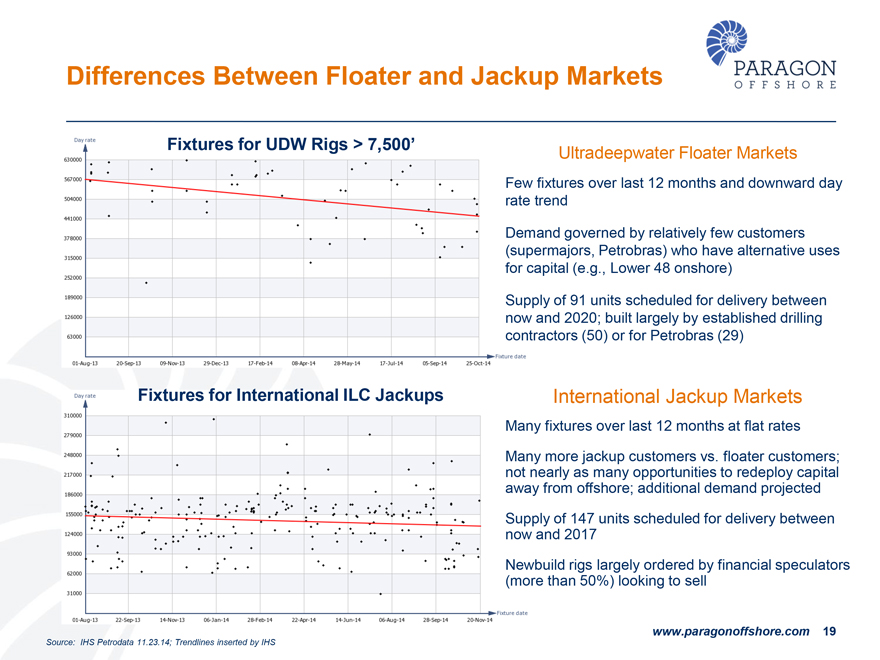
Differences Between Floater and Jackup Markets
Fixtures for UDW Rigs >
7,500�
Day rate
630000
567000
504000
441000
378000
315000
252000
189000
126000
63000 Fixture date
01-Aug-13 20-Sep-13 09-Nov-13 29-Dec-13 17-Feb-14 08-Apr-14 28-May-14
17-Jul-14 05-Sep-14 25-Oct-14
Ultradeepwater Floater Markets
Few fixtures
over last 12 months and downward day rate trend
Demand governed by relatively few customers (supermajors, Petrobras) who have alternative uses for capital (e.g.,
Lower 48 onshore)
Supply of 91 units scheduled for delivery between now and 2020; built largely by established drilling contractors (50)�or for Petrobras
(29)
Fixtures for International ILC Jackups
Day rate
310000
279000
248000
217000
186000
155000
124000
93000
62000
31000 Fixture date
01-Aug-13 22-Sep-13 14-Nov-13 06-Jan-14 28-Feb-14 22-Apr-14 14-Jun-14 06-Aug-14 28-Sep-14 20-Nov-14
International Jackup Markets
Many fixtures over last 12 months at flat rates
Many more jackup customers vs. floater customers; not nearly as many opportunities to redeploy capital away from offshore; additional demand projected
Supply of 147 units scheduled for delivery between now and 2017
Newbuild rigs largely ordered
by financial speculators (more than 50%) looking to sell
www.paragonoffshore.com 19
Source: IHS Petrodata 11.23.14; Trendlines inserted by IHS
PARAGON
OFFSHORE
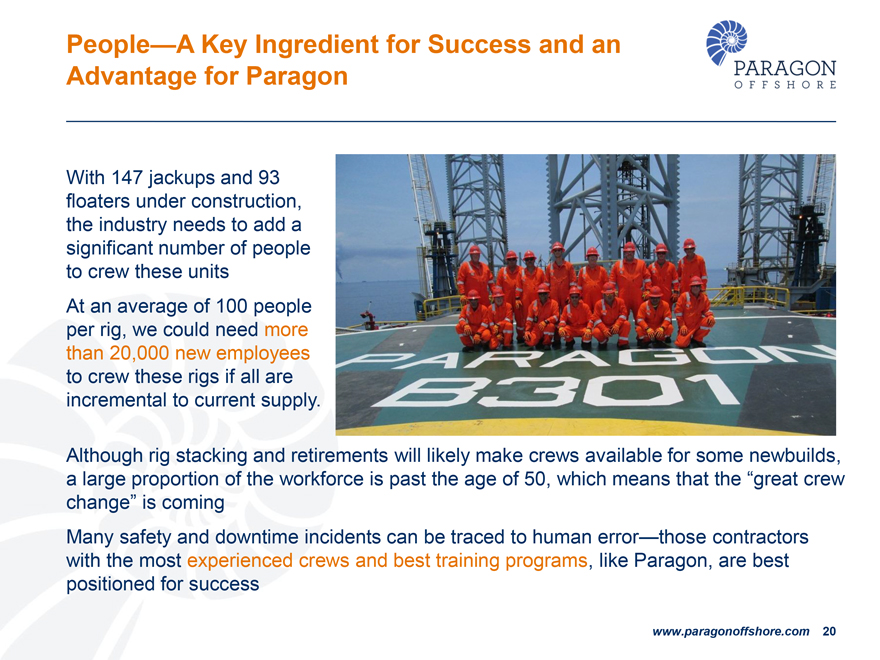
People�A Key Ingredient for Success and an
Advantage for Paragon
With 147 jackups and 93 floaters under construction, the industry needs to add a significant number of people to crew these units
At an average of 100 people per rig, we could need more than 20,000 new employees to crew these rigs if all are incremental to current supply.
Although rig stacking and retirements will likely make crews available for some newbuilds, a large proportion of the workforce is past the age of 50, which means that the
�great crew change� is coming
Many safety and downtime incidents can be traced to human error�those contractors with the most experienced crews and
best training programs, like Paragon, are best positioned for success
www.paragonoffshore.com 20
PARAGON
OFFSHORE
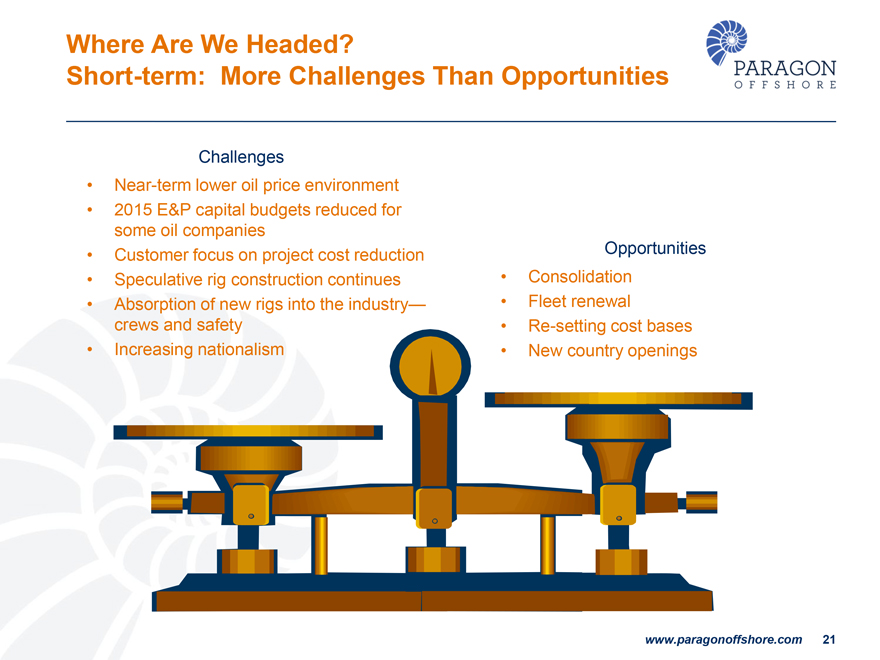
Where Are We Headed?
Short-term: More Challenges Than Opportunities
Challenges
Near-term lower oil price environment
2015 E&P capital budgets reduced for some oil companies
Customer focus on project cost
reduction
Speculative rig construction continues
Absorption of new rigs into
the industry�crews and safety
Increasing nationalism
Opportunities
Consolidation
Fleet renewal
Re-setting cost bases
New country openings
www.paragonoffshore.com 21
PARAGON
OFFSHORE
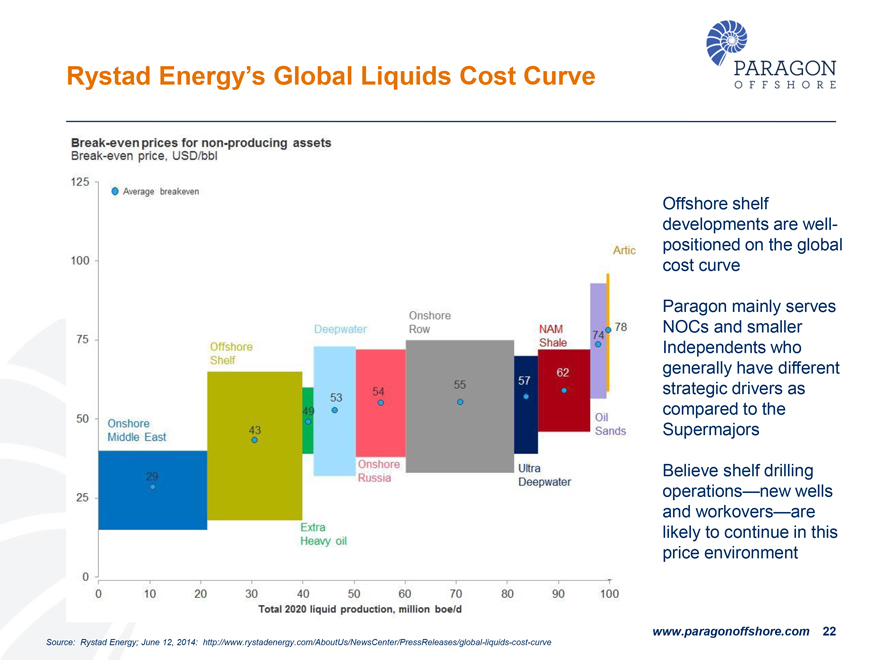
Rystad Energy�s Global Liquids Cost Curve
Break-even prices for
non-producing assets
Break-even price, USD/bbl
125 100 75 50 25 0
Average breakeven
Onshore Middle East
Offshore Shelf
Deepwater
Onshore Row
Extra Heavy oil
Onshore Russia
NAM Shale
Ultra Deepwater
Arctic
Oil Sands
29 43 49 53 54 55 57 62 74 78
0 10 20 30 40 50 60 70 80 90 100
Total 2020 liquid production, million boe/d
Offshore shelf developments are well-positioned on the global cost curve
Paragon mainly serves
NOCs and smaller Independents who generally have different strategic drivers as compared to the Supermajors
Believe shelf drilling operations�new wells and
workovers�are likely to continue in this price environment
Source: Rystad Energy; June�12, 2014:
http://www.rystadenergy.com/AboutUs/NewsCenter/PressReleases/global-liquids-cost-curve
www.paragonoffshore.com 22

PARAGON
OFFSHORE
Conclusion
www.paragonoffshore.com 23
PARAGON
OFFSHORE
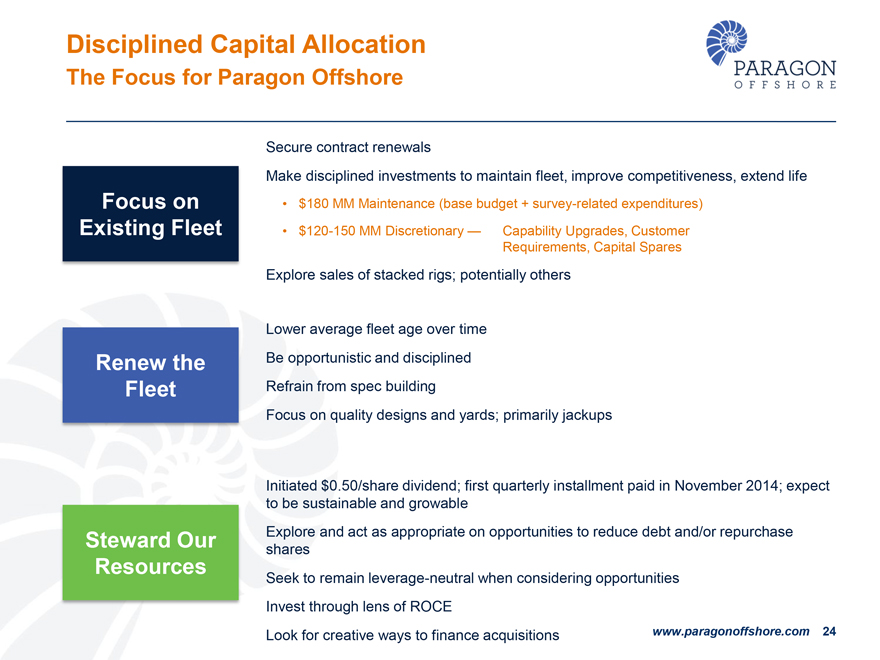
Disciplined Capital Allocation
The Focus for Paragon Offshore
Focus on Existing Fleet
Secure contract renewals
Make disciplined investments to maintain fleet, improve competitiveness, extend life
�
$180 MM Maintenance (base budget + survey-related expenditures)
� $120-150 MM Discretionary � Capability Upgrades, Customer
Requirements, Capital Spares
Explore sales of stacked rigs; potentially others
Renew the Fleet
Lower average fleet age over time
Be opportunistic and disciplined
Refrain from spec building
Focus on quality designs and yards; primarily jackups
Steward Our Resources
Initiated $0.50/share dividend; first quarterly installment paid in November 2014; expect to be sustainable and growable
shares Explore and act as appropriate on opportunities to reduce debt and/or repurchase
Seek
to remain leverage-neutral when considering opportunities
Invest through lens of ROCE
Look for creative ways to finance acquisitions
www.paragonoffshore.com 24
PARAGON
OFFSHORE
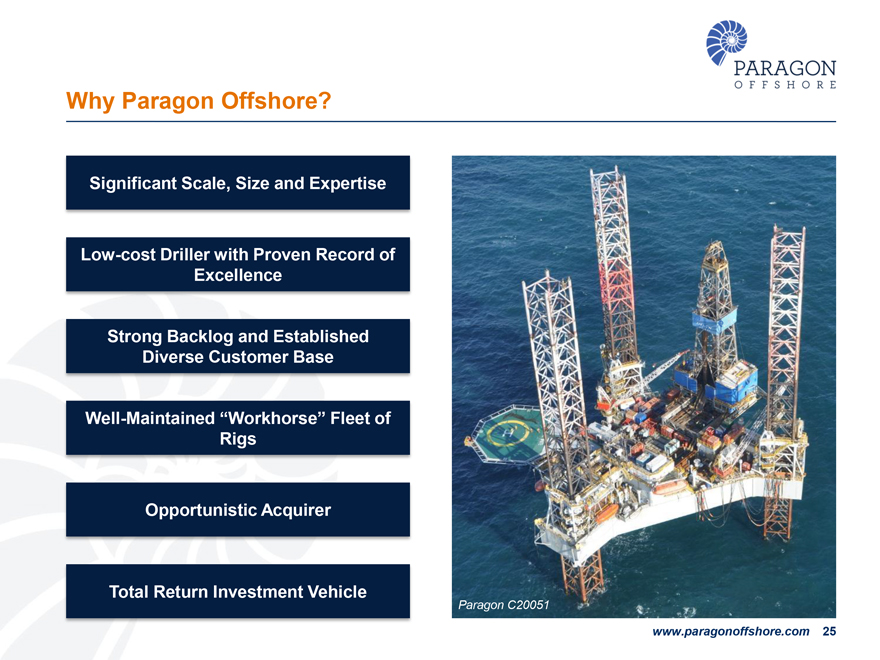
Why Paragon Offshore?
Significant Scale, Size and Expertise
Low-cost Driller with Proven Record of Excellence
Strong Backlog and Established Diverse
Customer Base
Well-Maintained �Workhorse� Fleet of Rigs
Opportunistic Acquirer
Total Return Investment Vehicle
Paragon C20051
www.paragonoffshore.com 25
PARAGON
OFFSHORE
NYSE Listed: PGN
3151 Briarpark Drive
Houston, TX 77042
832.783.4000
For additional information, contact: Lee M. Ahlstrom
SVP-Investor Relations, Strategy &
Planning [email protected]
www.paragonoffshore.com
PARAGON
OFFSHORE
Appendix
www.paragonoffshore.com 27
PARAGON
OFFSHORE
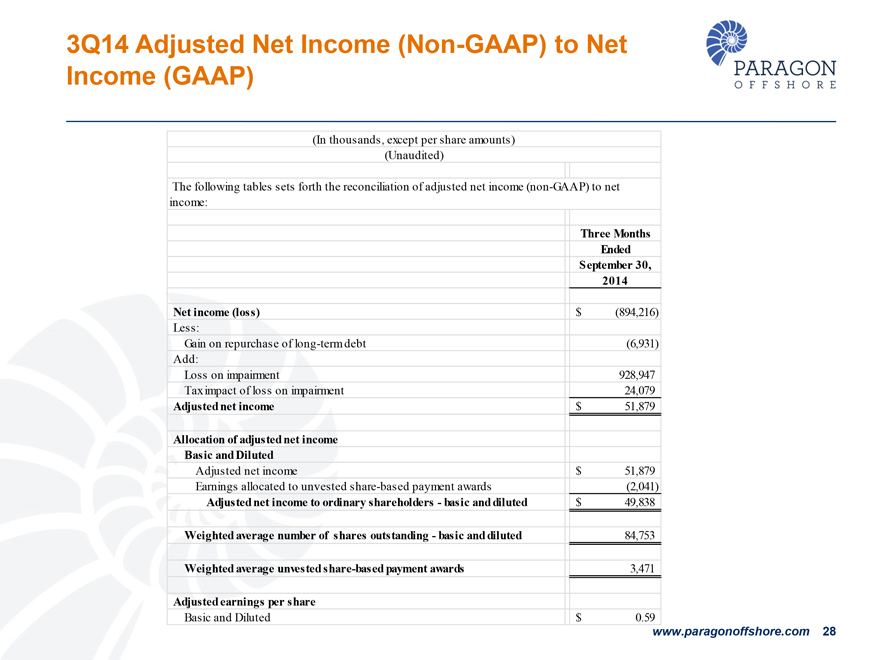
3Q14 Adjusted Net Income (Non-GAAP) to Net Income (GAAP)
(In thousands,
except per share amounts)
(Unaudited)
The following tables sets forth the
reconciliation of adjusted net income (non-GAAP) to net income:
Three Months Ended September�30, 2014
Net income (loss) $(894,216)
Less:
Gain on repurchase of long-term debt (6,931)
Add:
Loss on impairment 928,947
Tax impact of loss on impairment 24,079
Adjusted net income $51,879
Allocation of adjusted net income
Basic and Diluted
Adjusted net income $51,879
Earnings allocated to unvested share-based payment awards (2,041)
Adjusted net income to
ordinary shareholders - basic and diluted $49,838
Weighted average number of shares outstanding - basic and diluted 84,753
Weighted average unvested share-based payment awards 3,471
Adjusted earnings per share
Basic and Diluted $0.59
www.paragonoffshore.com 28
PARAGON
OFFSHORE
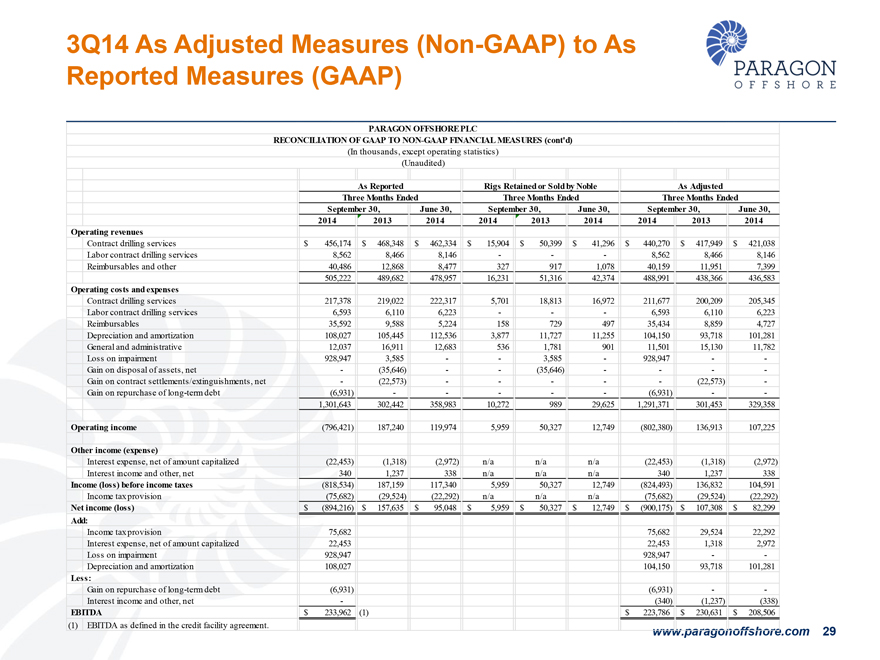
3Q14 As Adjusted Measures (Non-GAAP) to As Reported Measures (GAAP)
PARAGON
OFFSHORE PLC
RECONCILIATION OF GAAP TO NON-GAAP FINANCIAL MEASURES (cont�d)
(In thousands, except operating statistics )
(Unaudited)
As Reported Three Months Ended
Rigs Retained or Sold by Noble Three Months Ended
As Adjusted Three Months Ended
September 30,
June 30,
September 30,
June 30,
September 30,
June 30,
2014 2013 2014 2014 2013 2014 2014 2013 2014
Operating revenues
Contract drilling services
$456,174 $468,348 $462,334 $15,904 $50,399 $41,296 $440,270 $417,949 $421,038
Labor contract
drilling services
8,562 8,466 8,146 - - - 8,562 8,466 8,146
Reimbursables and
other
40,486 12,868 8,477 327 917 1,078 40,159 11,951 7,399
505,222 489,682
478,957 16,231 51,316 42,374 488,991 438,366 436,583
Operating costs and expenses
Contract drilling services
217,378 219,022 222,317 5,701 18,813 16,972 211,677 200,209 205,345
Labor contract drilling services
6,593 6,110 6,223 - - - 6,593 6,110 6,223
Reimbursables
35,592 9,588 5,224 158 729 497 35,434 8,859 4,727
Depreciation and amortization
108,027 105,445 112,536 3,877 11,727 11,255 104,150 93,718
101,281
General and administrative
12,037 16,911 12,683 536 1,781 901 11,501
15,130 11,782
Loss on impairment
928,947 3,585 - - 3,585 - 928,947 - -
Gain on disposal of assets, net
- (35,646) - - (35,646) - - - -
Gain on contract settlements/extinguishments, net
- (22,573) - - - - - (22,573) -
Gain on repurchase of long-term debt
(6,931) - - - - - (6,931) - -
1,301,643 302,442 358,983 10,272 989 29,625 1,291,371 301,453 329,358
Operating income
(796,421) 187,240 119,974 5,959 50,327 12,749 (802,380) 136,913 107,225
Other
income (expense)
Interest expense, net of amount capitalized
(22,453) (1,318)
(2,972) n/a n/a n/a (22,453) (1,318) (2,972)
Interest income and other, net
340 1,237 338 n/a n/a n/a 340 1,237 338
Income (loss) before income taxes
(818,534) 187,159 117,340 5,959 50,327 12,749 (824,493) 136,832 104,591
Income tax provision
(75,682) (29,524) (22,292) n/a n/a n/a (75,682) (29,524)
(22,292)
Net income (loss)
$(894,216) $157,635 $95,048 $5,959 $50,327 $12,749
$(900,175) $107,308 $82,299
Add:
Income tax provision
75,682 75,682 29,524 22,292
Interest expense, net of amount capitalized
22,453 22,453 1,318 2,972
Loss on impairment
928,947 928,947 - -
Depreciation and amortization
108,027 104,150 93,718 101,281
Less:
Gain on repurchase of long-term debt
(6,931) (6,931) - -
Interest income and other, net
- (340) (1,237) (338)
EBITDA
$233,962 (1) $223,786 $230,631 $208,506
(1) EBITDA as defined in the credit facility agreement.
www.paragonoffshore.com 29
PARAGON
OFFSHORE
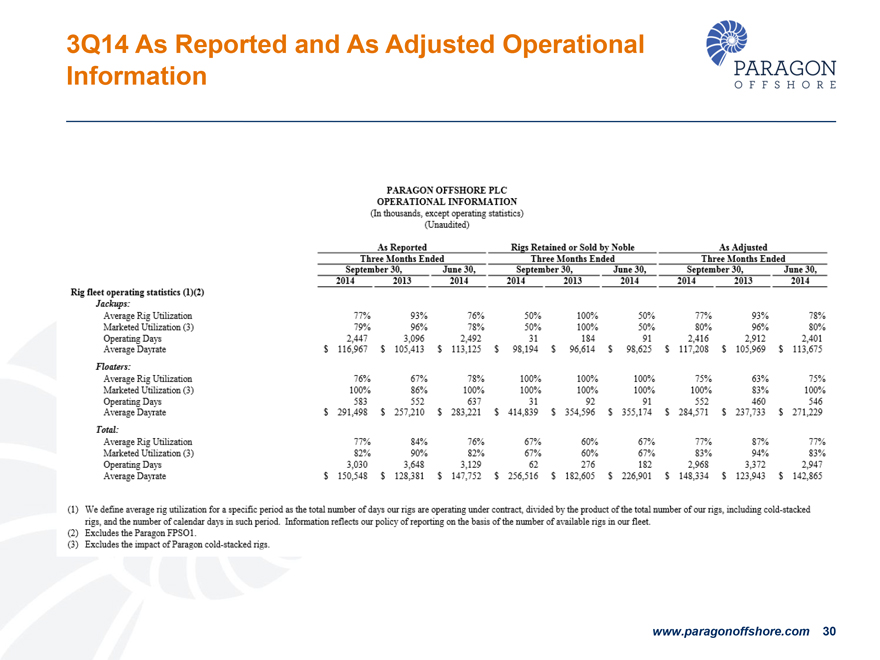
3Q14 As Reported and As Adjusted Operational
Information
PARAGON OFFSHORE PLC
OPERATIONAL INFORMATION
(In thousands, except operating statistics) (Unaudited)
As Reported Three Months Ended
Rigs Retained or Sold by Noble Three Months Ended
As Adjusted Three Months
Ended
September 30,
June 30,
September 30,
June 30,
September 30,
June 30,
2014 2013 2014 2014 2013 2014 2014 2013 2014
Rig fleet operating statistics (1)(2)
Jackups:
Average Rig Utilization 77% 93% 16% 50% 100% 50% 77% 93% 78%
Marketed Utilization (3) 79% 96% 78% 50% 100% 50% 80% 96% 80%
Operating Days 2,447 3,096 2,492
31 184 91 2,416 2,912 2,401
Average Dayrate $116,967 $105,413 $113,125 $98,194 $96,614 $98,625 $117,208 $105,969 $113,675
Floaters:
Average Rig Utilization 76% 67% 78% 100% 100% 100% 75% 63% 75%
Marketed Utilization (3) 100% 86% 100% 100% 100% 100% 100% 83% 100%
Operating Days 583 552 637
31 92 91 552 460 546
Average Dayrate $291,498 $257,210 $283,221 $414,839 $354,596 $355,174 $284,571 $237,733 $271,229
Total:
Average Rig Utilization 77% 84% 76% 67% 60% 67% 77% 87% 77%
Marketed Utilization (3) 82% 90% 82% 67% 60% 67% 83% 94% 83%
Operating Days 3,030 3,648 3,129
62 276 182 2,968 3,372 2,947
Average Dayrate $150,548 $128,381 $147,752 $256,516 $182,605 $226,901 $148,334 $123,943 $142,865
(l) We define average rig utilization for a specific period as the total number of days our rigs are operating under contract, divided by the product of the total number of our
rigs, including cold-stacked rigs, and the number of calendar days in such period. Information reflects our policy of reporting on the basis of the number of available rigs in our fleet.
(2) Excludes the Paragon FPSO1.
(3) Excludes the impact of Paragon cold-stacked rigs.
www.paragonoffshore.com 30
PARAGON
OFFSHORE
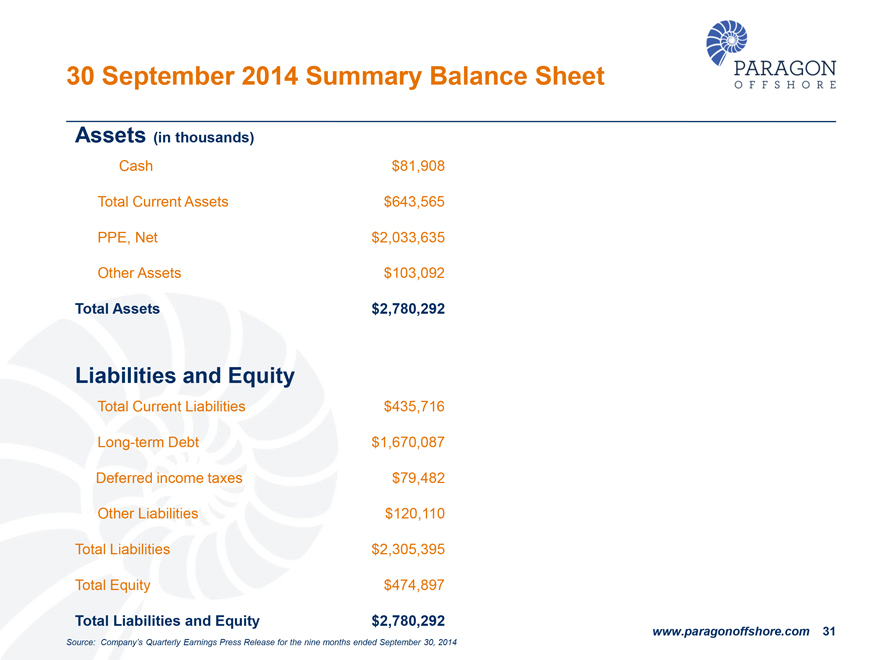
30 September 2014 Summary Balance Sheet
Assets (in thousands)
Cash
$81,908
Total Current Assets
$643,565
PPE, Net
$2,033,635
Other Assets
$103,092
Total Assets
$2,780,292
Liabilities and Equity
Total Current Liabilities
$435,716
Long-term Debt
$1,670,087
Deferred income taxes
$79,482
Other Liabilities
$120,110
Total Liabilities
$2,305,395
Total Equity
$474,897
Total Liabilities and Equity
$2,780,292
Source: Company�s Quarterly Earnings Press Release for the nine months ended
September 30, 2014
www.paragonoffshore.com 31
Serious News for Serious Traders! Try StreetInsider.com Premium Free!
You May Also Be Interested In
- Hillcrest's ZVS Technology Gains Traction in New Applications, Fuels Growth
- Inflation-Driven Price Hikes Vary Significantly Across 10 Popular U.S. Grocery Categories in Q1
- Vivid Seats Renews National Make-A-Wish® Partnership to Grant Live Event Experiences
Create E-mail Alert Related Categories
SEC FilingsSign up for StreetInsider Free!
Receive full access to all new and archived articles, unlimited portfolio tracking, e-mail alerts, custom newswires and RSS feeds - and more!
