

Form 8-K Owens Corning For: Sep 23
 Tweet
Tweet Share
Share
UNITED STATES
SECURITIES AND EXCHANGE COMMISSION
Washington, D.C. 20549
Form 8-K
CURRENT REPORT
Pursuant to Section 13 or 15(d)
of the Securities Exchange Act of 1934
Date of Report (Date of earliest event reported): September 23, 2016
Owens Corning
(Exact name of registrant as specified in its charter)
Commission File Number: 1-33100
| Delaware | 43-2109021 | |
| (State or other jurisdiction of incorporation) |
(IRS Employer Identification No.) |
One Owens Corning Parkway
Toledo, OH 43659
(Address of principal executive offices, including zip code)
419-248-8000
(Registrant’s telephone number, including area code)
(Former name or former address, if changed since last report)
Check the appropriate box below if the Form 8-K filing is intended to simultaneously satisfy the filing obligation of the registrant under any of the following provisions:
| ¨ | Written communications pursuant to Rule 425 under the Securities Act (17 CFR 230.425) |
| ¨ | Soliciting material pursuant to Rule 14a-12 under the Exchange Act (17 CFR 240.14a-12) |
| ¨ | Pre-commencement communications pursuant to Rule 14d-2(b) under the Exchange Act (17 CFR 240.14d-2(b)) |
| ¨ | Pre-commencement communications pursuant to Rule 13e-4(c) under the Exchange Act (17 CFR 240.13e-4(c)) |
Item 7.01 – Regulation FD Disclosure
Management of Owens Corning (the “Company”) plans to use the updated presentation, attached hereto as Exhibit 99.1, at an investor event later today. The attached slides may also be viewed on the Company’s investor relations website (http://investor.owenscorning.com).
The information in Item 7.01 of this Current Report is being furnished and shall not be deemed “filed” for purposes of Section 18 of the Securities Exchange Act of 1934. The information in Item 7.01 of this Current Report shall not be incorporated by reference into any registration statement or other document pursuant to the Securities Act of 1933.
Item 9.01 – Financial Statements and Exhibits
| Exhibit |
Description | |
| 99.1 | Owens Corning Slide Presentation | |
2
SIGNATURES
Pursuant to the requirements of the Securities Exchange Act of 1934, as amended, the registrant has duly caused this report to be signed on its behalf by the undersigned hereunto duly authorized.
| Owens Corning | ||||
| Date: September 23, 2016 | By: | /s/ Raj Dave | ||
| Raj Dave | ||||
| Vice President, Corporate Law and Assistant Secretary | ||||
3
 Owens Corning Focused on Shareholder Value Zelman Housing Summit September 23, 2016 Boston, MA Mike Thaman Eric Andres Chief Executive Officer Leader Investor Relations Exhibit 99.1 |
 2 Forward-Looking Statements and Non-GAAP Measures This presentation consists of this slide deck and the associated remarks and comments, all of which are integrally related and are intended to be
presented and understood together.
This presentation contains forward-looking statements within the meaning of the
Private Securities Litigation Reform Act of 1995. Forward-looking
statements can be identified by words such as “believe,”
“anticipate,” “appear,” “may,” “will,” “likely,” “should,” “intend,” “plan,” “estimate,” “expect,”
“assume,” “seek,” “project,” “forecast,”
“strategy” and similar reference to future periods. We caution you against relying on these statements as they involve risks and uncertainties that are difficult to predict and the Company’s actual results may differ materially from those projected in
these statements. Such risks and uncertainties are based on factors such
as, without limitation: relationships with key customers; levels of residential and commercial construction activity; competitive and pricing factors; levels of global industrial production; demand for our products; industry and economic
conditions that affect the market and operating conditions of our
customers, suppliers or lenders; foreign exchange and commodity price fluctuations; our level of indebtedness; weather conditions; availability and cost of credit; availability and cost of energy and raw materials; issues involving
implementation and protection of information technology systems; domestic
and international economic and political conditions including new legislation or other governmental actions; our ability to utilize net operating loss carry-forwards; research and development activities including intellectual property
protection; interest rate movements; labor disputes, legal and regulatory
proceedings, including litigations; and environmental actions; uninsured losses; issues related to acquisitions, divestitures and joint ventures; achievement of expected synergies, cost reductions and/or productivity improvements; defined
benefit plan funding obligations; and, factors detailed from time to time
in the company’s Securities and Exchange Commission filings. For purposes of this presentation, any discussion referring to “year to date” or last twelve months (“LTM”) refers to the
period ended on the last calendar day of the quarter preceding the date
of the investor event referred to on the first page of this document. Otherwise the information in this presentation speaks as of the date of the investor event, and is subject to change. The Company does not undertake any obligation to update or revise
forward-looking statements beyond what is required under applicable
securities laws. Any distribution of this presentation after the date of the investor event is not intended and should not be construed as updating or confirming such information.
This presentation contains references to certain "non-GAAP financial
measures" as defined by the SEC. Management uses non-GAAP measures for various purposes, including reporting results of operations to the Board of Directors, analysis of performance and related employee compensation
measures. Although management believes these measures, and
exclusions from GAAP therein, provide a useful representation of performance, non- GAAP measures should not be considered in isolation or as a substitute for GAAP measures. A reconciliation of these non-GAAP financial
measures to their most directly comparable financial measures calculated
and presented in accordance with generally accepted accounting principles can be found in the text and tables of the press release filed with the SEC on July 27, 2016 and Appendix A. Adjusted EBIT is earnings before interest, taxes and
other items that management does not allocate to our segment results
because we believe they are not representative of the Company’s current operations. Free cash flow is net cash flow provided by operating activities minus the sum of cash paid for property, plant, and equipment and purchases of
alloy. When the Company provides forward-looking expectations for
non-GAAP measures the most comparable GAAP measures and a reconciliation between the non-GAAP expectations and the corresponding GAAP measures are generally not available without unreasonable effort due to the variability,
complexity and limited visibility of the adjusting items that would be
excluded from the non-GAAP measures in future periods. The variability in timing and amount of adjusting items could have significant and unpredictable effects on future GAAP results.
|
 3 Investment Highlights Composites Three Market-Leading Businesses Roofing Insulation Market-leading business with improving economic conditions and higher utilization rates Strong market position in attractive industry Progress supports confidence in return to historical profitability |
 4 Q2 2016 Highlights and Outlook Maintained a high level of safety performance in Q2 2016 Delivered adjusted EBIT of $253 million Insulation achieved 20 th consecutive quarter of EBIT growth Composites delivered record EBIT with 14% EBIT margins Roofing grew EBIT by $79 million; delivered 25% EBIT margins Improved free cash flow performance by $217 million in H1 2016 Announced plans to invest $110 million in the expansion of our Composites operations in India Anticipate continued growth in U.S. housing starts and moderate global industrial production growth in 2016 |
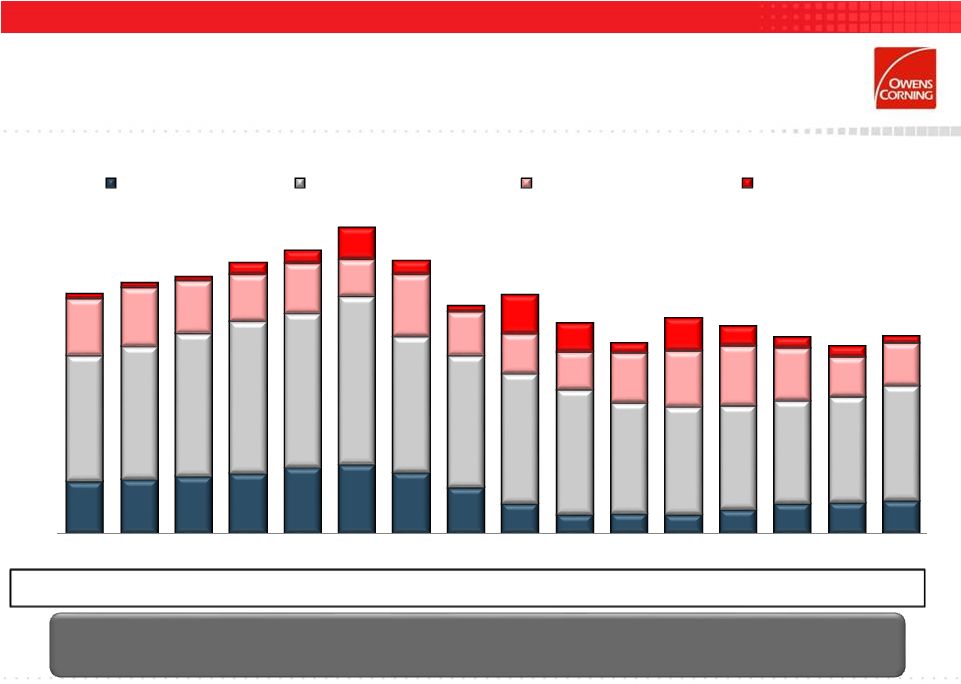
 5 Margin >= 10% 0%<= Margin < 10% Margin < 0% '94 '95 '96 '97 '98 '99 '00 '01 '02 '03 '04 '05 '06 '07 '08 '09 '10 '11 '12 '13 '14 '15 Insulation Roofing Composites Sources: Owens Corning’s SEC filings since 2006. For comparability purposes, prior years have been provided based on Owens
Corning’s SEC filings, internal management reports, and management
estimates. Strong Portfolio
|
 6 $ (in millions) Q2 2016 Q2 2015 1H 2016 1H 2015 Net sales* $414 $451 $799 $830 EBIT $32 $25 $45 $32 EBIT as % of sales 8% 6% 6% 4% D&A $27 $26 $52 $50 Insulation Business * before inter-segment eliminations *In millions International 15% U.S. & Canada New Residential Construction 39% U.S .& Canada Residential Repair & Remodeling 22% U.S. & Canada Commercial & Industrial 24% *Owens Corning management estimates; estimated error margin below 5% Source: Owens Corning management estimates and Owens Corning SEC filings; comparability may differ over time
* before inter-segment eliminations
Q2 2016 Highlights
Delivered 20 th consecutive quarter of EBIT growth Grew EBIT by $7 million, primarily on improved customer mix and deflation -5% 0% 5% 10% 15% $0 $500 $1,000 $1,500 $2,000 2012 2013 2014 2015 LTM Five-Year Financial Performance Sales* EBIT as % of sales 2015 Revenue by End Market* |
 7 -10% 0% 10% 20% 30% '85 '87 '89 '91 '93 '95 '97 '99 '01 '03 '05 '07 '09 '11 '13 '15 EBIT Margin Avg EBIT Margin '85-'08 (15%) Owens Corning Insulation Return to Historical Profitability Levels Historically Delivered 15% EBIT Margins at 1.5 Million Housing Starts; Expect to Average 50% Operating Leverage through the Recovery Source: Owens Corning management estimates and SEC filings of Owens Corning and predecessor company. Segment reporting comparability may differ
over time. |
 8 2.1MM U.S. Housing Starts Capacity Utilization: 100% 73% 85% 90% 1.1 MM U.S. Housing Starts 2005 2015 U.S. and Canada Fiberglass Industry Light Density Network Capacity U.S. Housing Starts of 1.2 to 1.4MM Should Require Restart of Mothballed Capacity ( 0.3) ( 0.6) ( 0.2) 4.6 4.3 3.7 3.5 2005 Total Capacity Retired 2015 Total Capacity Mothballed Operating Plants Capacity Cold Lines Operating Lines Capacity Light density fiberglass demand and capacity based on assets producing batts, rolls, flexible duct media, metal building insulation, duct wrap
and appliance insulation; excludes loosefill products. Source: Owens
Corning management estimates as of November 2015 and various industry sources and publications (including North America Insulation Manufacturers
Association); all competitive information legally obtained from appropriate
3 rd party sources. |
 9 U.S. and Canada Fiberglass Industry Light Density Capacity and Demand 2006 – 2008 2009 – 2011 2012 – 2015 2016E – 2018E Price Index in Demand in Operating Capacity Decline Trough Early Stage Recovery Sustained Performance Improvement Pricing has Strengthened with Market Recovery 1000 500 0 -500 -1000 -1500 100% 90% 80% 70% 60% 50% Light density fiberglass demand, capacity and price based on assets producing batts, rolls, flexible duct media, metal building insulation, duct
wrap and appliance insulation; excludes loosefill products. Source: Owens
Corning management estimates as of November 2015 and various industry sources and publications (including North America Insulation Manufacturers Association). Demand estimate based on U.S. housing starts consensus. All competitive information legally obtained
from appropriate 3 rd party sources. |
 10 Owens Corning Insulation Profitability Residential Fiberglass Still Vastly Under Historical Earnings Level; Non Residential Has Returned to Prior Peak -200 -100 0 100 200 300 400 Peak (2006) Trough (2009) Current (2015) EBIT MM$ & Margins U.S. & Canada Residential Fiberglass Building Insulation Engineered Insulation & Other Regions 26% 17% -23% 4% 2% 14% Residential fiberglass building insulation includes batts & rolls and loosefill sold to insulation contractors and distributors, home
centers, and manufactured housing producers in the U.S. and Canada.
Engineered insulation and other regions includes pipe and flexible duct media insulation, foam, mineral fiber, and all building material products sold to Latin America and Asia. Source: Owens Corning management estimates. Comparability may differ over time. Margin of error on Intra-segment EBIT estimated to be below
$15MM. |
 11 $ (in millions) Q2 2016 Q2 2015 1H 2016 1H 2015 Net sales* $679 $503 $1,108 $896 EBIT $169 $90 $242 $110 EBIT as % of sales 25% 18% 22% 12% D&A $11 $10 $21 $19 Roofing Business * before inter-segment eliminations 0% 5% 10% 15% 20% 25% $0 $500 $1,000 $1,500 $2,000 $2,500 2012 2013 2014 2015 LTM Five-Year Financial Performance Sales* EBIT as % of sales *In millions U.S. & Canada New Residential Construction 10% U.S. & Canada Residential Repair & Remodeling 76% U.S. & Canada Commercial & Industrial 13% *Owens Corning management estimates; estimated error margin below 5% Source: Owens Corning management estimates and Owens Corning SEC filings; comparability may differ over time
Q2 2016 Highlights
Grew EBIT by $79 million for the quarter
Delivered 25% EBIT margins on higher volume
and lower asphalt costs
International 1% 2015 Revenue by End Market* |
 12 U.S. Asphalt Shingle Market Expect Growth in Both New Construction and Replacement Markets in 2016 MM Sq. Total 136 143 145 154 161 173 155 129 135 120 108 122 118 111 107 112 30 31 32 34 37 39 35 26 17 11 11 11 14 17 18 19 71 75 81 86 87 95 77 75 73 71 63 61 59 58 60 65 32 34 30 27 28 21 35 25 23 21 28 31 34 30 23 24 3 3 2 7 8 18 8 3 22 17 6 19 11 6 6 4 '00 '01 '02 '03 '04 '05 '06 '07 '08 '09 '10 '11 '12 '13 '14 '15 New Construction Age Related/Economic Other Weather Events Major Storms Source: Asphalt Roofing Manufacturers Association - Summary of Asphalt Roofing Industry Shipments. Management estimates based on data
provided by National Oceanic and Atmospheric Administration (NOAA),
National Association of Realtors, EIA, Moody’s Analytics, Oxford Economics reports, U.S. Bureau of Labor Statistics and U.S. Bureau of Economic Analysis.
|
 13 Strong Market Position in Attractive Industry Track record of strong financial performance – Delivered average operating margins of 18% since 2008 New construction and replacement markets are growing, after period of extension of replacement cycle – Housing activity forecasts support demand growth – Growth of age-related/economic demand has resumed Strong market position; confidence in sustaining average operating margins of mid-teens or better |
 14 InterWrap Acquisition Strengthens Position of Roofing Components Business Acquired leading manufacturer of synthetic roofing underlayment and packaging materials for $450 million on April 21 st , 2016 Value contributors: – InterWrap’s established track record of double-digit revenue growth – Benefit from conversion of organic to synthetic underlayments – OC channel strength and InterWrap strong products, brands and technology – Commercial and operational synergies – Access to new markets and construction applications Expect acquisition to be accretive to 2016 EPS, excluding transaction and integration costs Anticipate achieving a run rate of $20 million or more of commercial and operational synergies by the end of next year Sources: Owens Corning management estimates and press release issued February 24, 2016 |
 15 $ (in millions) Q2 2016 Q2 2015 1H 2016 1H 2015 Net sales* $517 $497 $990 $971 EBIT $74 $67 $138 $127 EBIT as % of sales 14% 13% 14% 13% D&A $33 $31 $67 $63 Composites Business * before inter-segment eliminations *In millions *Owens Corning management estimates; estimated error margin below 5% Source: Owens Corning management estimates and Owens Corning SEC filings; comparability may differ over time
* before inter-segment eliminations
International 60% U.S. & Canada New Residential Construction 2% U.S. & Canada Residential Repair & Remodeling 9% U.S. & Canada Commercial & Industrial 29% Q2 2016 Highlights Delivered $74 million EBIT and 14% EBIT margins Continued price and volume momentum Anticipate continued growth in the glass fiber market driven by moderate global IP growth 2015 Revenue by End Market* 0% 4% 8% 12% 16% $0 $600 $1,200 $1,800 $2,400 2012 2013 2014 2015 LTM Five-Year Financial Performance Sales* EBIT as % of sales |
 16 Glass Fiber A $7.5 Billion Global Market Markets Size Building & Construction Consumer Power & Energy Transportation Industrial Glass fiber market defined as glass fiber reinforcements and direct conversion products as consumed, excluding yarns.
Source: Fiber Economics Bureau, GlassFibreEurope
(APFE), Global Trade Information Services, Inc. and Owens Corning management estimates
as of November 2015. |
 17 27% 12% % Market Revenue % OC Revenue China 33% 47% % Market Revenue % OC Revenue Americas Owens Corning Composites Positioned to Win #1 Position #1 Position Emerging Position #1 Position Positioned to Compete Anywhere in the World OC glass fiber manufacturing site OC downstream fabrication site % Market Revenue = market revenue in region as % of 2015 global market size; % OC Revenue = OC revenue in region as % of OC Composites
global 2015 sales; Glass reinforcements market defined as glass fiber
reinforcements and direct conversion products as consumed, excluding yarns.
Sources: Fiber Economics Bureau, GlassFibreEurope
(APFE), Global Trade Information Services, Inc. and Owens Corning management estimates
of 2015 global market. 23%
28% % Market Revenue % OC Revenue Europe 17% 13% % Market Revenue % OC Revenue Rest of World |
 18 Glass Fiber Industry Estimated Capacity Change in global demand (MM T) Change in global capacity (MM T) Supply Tension Environment Expected in the Near Term 90% Threshold 50% 60% 70% 80% 90% 100% '05 '06 '07 '08 '09 '10 '11 '12 '13 '14 '15 '16E '17E '18E China Emergence Capacity Overbuild Tightening Capacity Price Inflection Supply Tension Improved Returns 1.7 1.7 0.5 0.8 0.6 0.6 Glass fiber market demand excludes E-glass yarns. Sources: Fiber Economics Bureau, GlassFibreEurope (APFE), Global Trade Information
Services, Inc. and Owens Corning management estimates as of August 2016
(high probability capacity additions only). Estimated demand calculated as 2015 demand grown at 1.6x global IP per June 2016 Oxford Economics.
2005-09
2010-15 2016E-18E |
 19 Disciplined Capital Allocation Strategy Drive shareholder returns by enabling organic and inorganic growth and supporting the balance sheet – Maintain investment grade Capital allocation strategy – Investing in attractive organic growth – Pursuing value-creating acquisitions – Returning excess cash to shareholders Quarterly dividend initiated in 2014 conveyed confidence in long-term financial outlook and cash flow generation; 6% annual dividend increases in 2015 & 2016 As of June 30, 2016, 2.8 million shares remain available for repurchase under existing authorization |
 Appendix A Non-GAAP Reconciliations |
 Appendix A Non-GAAP Reconciliations |
 Appendix A Non-GAAP Reconciliations |
Serious News for Serious Traders! Try StreetInsider.com Premium Free!
You May Also Be Interested In
- Owens Corning Commences Tender Offer and Masonite Commences Consent Solicitation
- ASSE International Announces 'ASSE Super Saturday Event' to Promote Cultural Exchange Through Hosting Exchange Students
- INVESTOR ACTION REMINDER: The Schall Law Firm Encourages Investors in Shoals Technologies Group, Inc. with Losses of $100,000 to Contact the Firm
Create E-mail Alert Related Categories
SEC FilingsSign up for StreetInsider Free!
Receive full access to all new and archived articles, unlimited portfolio tracking, e-mail alerts, custom newswires and RSS feeds - and more!
