

Form 8-K Mondelez International, For: Sep 10
 Tweet
Tweet Share
Share
UNITED STATES
SECURITIES AND EXCHANGE COMMISSION
Washington, D.C. 20549
FORM 8-K
CURRENT REPORT
Pursuant to Section 13 or 15(d) of the
Securities Exchange Act of 1934
Date of Report (Date of earliest event reported): September 10, 2015
MONDELĒZ INTERNATIONAL, INC.
(Exact name of registrant as specified in its charter)
| Virginia | 1-16483 | 52-2284372 | ||
| (State or other jurisdiction of incorporation) |
(Commission File Number) |
(I.R.S. Employer Identification No.) |
Three Parkway North, Deerfield, Illinois 60015
(Address of principal executive offices, including zip code)
(847) 943-4000
(Registrant’s telephone number, including area code)
Not Applicable
(Former name or former address, if changed since last report.)
Check the appropriate box below if the Form 8-K filing is intended to simultaneously satisfy the filing obligation of the registrant under any of the following provisions (see General Instruction A.2. below):
| ¨ | Written communications pursuant to Rule 425 under the Securities Act (17 CFR 230.425) |
| ¨ | Soliciting material pursuant to Rule 14a-12 under the Exchange Act (17 CFR 240.14a-12) |
| ¨ | Pre-commencement communications pursuant to Rule 14d-2(b) under the Exchange Act (17 CFR 240.14d-2(b)) |
| ¨ | Pre-commencement communications pursuant to Rule 13e-4(c) under the Exchange Act (17 CFR 240.13e-4(c)) |
Item 7.01. Regulation FD Disclosure.
On September 10, 2015, we issued a press release relating to the presentation made by Mondelēz International executives at the Barclays Global Consumer Staples Conference. A copy of the press release is being furnished as Exhibit 99.1 to this Current Report on Form 8-K.
A live audio webcast of the presentation will be available through the Investors section of our website, www.mondelezinternational.com. An archived rebroadcast and the presentation slides will also be available through our website following the webcast. The presentation slides, including Regulation G reconciliations, are being furnished as Exhibit 99.2 to this Current Report on Form 8-K.
This information, including Exhibit 99.1 and Exhibit 99.2, will not be deemed “filed” for purposes of Section 18 of the Securities Exchange Act of 1934, as amended (the “Exchange Act”), or otherwise subject to the liabilities under that section and it will not be incorporated by reference in any filing under the Securities Act of 1933, as amended, or the Exchange Act, except as expressly set forth by specific reference in such a filing.
Item 9.01. Financial Statements and Exhibits.
| (d) | The following exhibits are being furnished with this Current Report on Form 8-K. |
| Exhibit |
Description | |
| 99.1 | Mondelēz International, Inc. Press Release, dated September 10, 2015. | |
| 99.2 | Mondelēz International, Inc. Slide Presentation, dated September 10, 2015. | |
SIGNATURES
Pursuant to the requirements of the Securities Exchange Act of 1934, the registrant has duly caused this report to be signed on its behalf by the undersigned hereunto duly authorized.
| MONDELĒZ INTERNATIONAL, INC. | ||
| By: | /s/ Brian T. Gladden | |
| Name: | Brian T. Gladden | |
| Title: | Executive Vice President and | |
| Chief Financial Officer | ||
Date: September 10, 2015
EXHIBIT INDEX
| Exhibit |
Description | |
| 99.1 | Mondelēz International, Inc. Press Release, dated September 10, 2015. | |
| 99.2 | Mondelēz International, Inc. Slide Presentation, dated September 10, 2015. | |
Exhibit 99.1

| Contacts: | Michael Mitchell (Media) | Dexter Congbalay (Investors) | ||
| +1-847-943-5678 | +1-847-943-5454 | |||
| [email protected] | [email protected] |
Mondelēz International Details Cost-Reduction
Progress and Strategies to Accelerate Growth;
Reaffirms 2015 Outlook and 2016 Margin Target
Uniquely positioned to deliver sustainable growth on both the top and bottom lines
BOSTON – Sept. 10, 2015 – At the Barclays Global Consumer Staples conference today, Mondelēz International updated investors on aggressive cost-reduction programs and outlined how the company is increasing investments to accelerate revenue growth.
“As the world’s leading snacking company, we’re proud to be one of few industry players with the assets, leadership and strategy to deliver strong top- and bottom-line growth over the long term. This is our point of difference,” said Brian Gladden, Executive Vice President and CFO. “Our advantaged platform provides us the potential to be among the industry’s fastest growing companies, with substantial margin upside and the highest EPS growth while also returning significant cash to our shareholders.”
Reinventing the Global Supply Chain and Delivering World-Class Productivity
Gladden provided an update on the company’s journey to reinvent its global supply chain, which is now delivering world-class productivity of more than 3 percent of cost of goods sold.
In addition, Gladden highlighted the company’s efforts to reconfigure its manufacturing network. Since 2012, Mondelēz International has closed, sold or streamlined 78 production facilities, and completed or announced the construction of 14 greenfield or brownfield sites, with 40 new state-of-the-art manufacturing lines expected to be on-stream by year-end 2015.
Aggressive Cost Management Drives Overhead Reductions
As part of its cost-management program, the company has implemented Zero-Based Budgeting tools to reset spending, identify specific cost reductions and capture sustainable savings. “Eighteen months into our ZBB efforts, we’re delivering benefits faster than expected in all indirect cost packages,” Gladden said.
1
The company is also building a global shared services capability to simplify and standardize over 150 back-office processes over the next two to three years. For each of these processes, on average, the company expects to deliver cost savings of approximately 50 percent.
As a result, the company expects to reduce overheads as a percent of revenue by at least 250 basis points between 2013 and 2016.
Cost Savings Fuel Growth Investments
Building on Gladden’s remarks, Mark Clouse, Executive Vice President and Chief Growth Officer, outlined the company’s growth plan, which centers on two strategies: accelerating base business growth and filling in key consumer spaces. Cost savings will fuel this plan, and it will be governed by the same operational discipline that the company has applied to its cost agenda.
In terms of accelerating base business growth, the company is reinvesting cost savings into additional advertising and consumer support, while also shifting spending to digital and social channels. In addition, the company will expand packaging formats to increase accessibility to new households and new channels, as well as enter white spaces with proven innovation platforms.
Consumer Trends Shape Global Behavior and Create Growth Opportunities
In parallel, the company is addressing three global consumer trends that are creating additional growth opportunities: an increasing emphasis on well-being, time compression and shifts in income distribution.
“We intend to become the global leader in well-being snacks, with 50 percent of our portfolio in the well-being space by 2020, up from more than a third of total revenue today,” said Clouse. “Our goal is to simplify and enhance the ingredient and nutritional profile of our base business while also focusing on breakthrough innovation to address consumers’ well-being needs. Over the next five years, we expect to focus 70 percent of our new product development efforts on well-being platforms.”
E-commerce is another key focus area, addressing the intersection between time compression and technology in snacks. Through a dedicated team, the company is optimizing existing e-commerce platforms by converting every consumer connection into a purchase opportunity as well as building the next-generation portfolio to take advantage of those incremental growth opportunities.
“We estimate that e-commerce could become one of the fastest-growing platforms within our company, increasing from less than $100 million in revenue today to as much as $1 billion by 2020,” said Clouse.
2
Finally, the company is broadening its portfolio to target aspirant consumers on one end of the spectrum and affluent consumers on the other to respond to shifts in income distribution. By doing so, the company is maximizing its category reach and driving incremental consumers to its brands and categories.
Reaffirmed Outlook
During today’s presentation, the company also reaffirmed its 2015 growth outlook, targeting Organic Net Revenue1 growth of at least 3 percent, including a 100 basis points headwind from strategic decisions to improve the revenue mix. The company continues to target pro forma Adjusted Operating Income1 margin of approximately 14 percent in 2015, excluding a negative 20-30 basis point impact from stranded costs, and Adjusted OI margin of 15-16 percent in 2016.
The company also reaffirmed its long-term targets of Organic Net Revenue growth at or above category growth rates, high-single digit Adjusted Operating Income growth at constant currency and double-digit Adjusted EPS1 growth at constant currency.
A live audio webcast of the presentation will be available in the investors section of the company’s website (www.mondelezinternational.com) at 7:30 a.m. ET today. An archived replay of the presentation with accompanying slides will be available on the website following the webcast. The company will be live tweeting from the event at www.twitter.com/MDLZ.
About Mondelēz International
Mondelēz International, Inc. (NASDAQ: MDLZ) is a global snacking powerhouse, with pro forma 2014 revenue of more than $30 billion. Creating delicious moments of joy in 165 countries, Mondelēz International is a world leader in biscuits, chocolate, gum, candy and powdered beverages, with billion-dollar brands such as Oreo, LU and Nabisco biscuits; Cadbury, Cadbury Dairy Milk and Milka chocolate; Trident gum and Tang powdered beverages. Mondelēz International is a proud member of the Standard and Poor’s 500, NASDAQ 100 and Dow Jones Sustainability Index. Visit www.mondelezinternational.com or follow us on Twitter at www.twitter.com/MDLZ.
| 1 | Organic Net Revenue, Adjusted Operating Income and Adjusted EPS are non-GAAP financial measures. Please see the company’s Form 10-Q for the quarterly period ended June 30, 2015 filed with the U.S. Securities and Exchange Commission for important information about the company’s use of non-GAAP financial measures. |
3
Forward-Looking Statements
This press release contains a number of forward-looking statements. Words, and variations of words, such as “will,” “expect,” “intend,” “estimate,” “deliver,” “potential,” “target,” “outlook” and similar expressions are intended to identify our forward-looking statements, including, but not limited to, statements about: our future performance, including our future revenue growth, earnings per share, operating income and margins; our supply chain transformation; overheads and overhead cost reduction initiatives; productivity; shared services capability; our investments and the results of those investments; innovation; opportunities for growth in our portfolio; our well-being portfolio and goals; growth in and revenues from e-commerce; execution of our strategy; shareholder returns; and our Outlook, including 2015 Organic Net Revenue growth and 2015 and 2016 Adjusted Operating Income margin. These forward-looking statements are subject to a number of risks and uncertainties, many of which are beyond our control, which could cause our actual results to differ materially from those indicated in our forward-looking statements. Such factors include, but are not limited to, risks from operating globally and in emerging markets; changes in currency exchange rates, controls and restrictions; continued volatility of commodity and other input costs; weakness in economic conditions; weakness in consumer spending or demand; changes in consumer preferences; pricing actions; unanticipated disruptions to our business; competition; our global workforce; the restructuring program and our other transformation initiatives not yielding the anticipated benefits; changes in the assumptions on which the restructuring program is based; and tax law changes. Please also see our risk factors, as they may be amended from time to time, set forth in our filings with the SEC, including our most recently filed Annual Report on Form 10-K. Mondelēz International disclaims and does not undertake any obligation to update or revise any forward-looking statement in this press release, except as required by applicable law or regulation.

4
 Barclays
Global Consumer Staples Conference
September 10, 2015 Exhibit 99.2 |
 Brian
Gladden EVP and Chief Financial Officer
|
 Forward-looking statements
3 This presentation contains a number of forward-looking statements. Words, and variations of words, such as “will,” “expect,” “intend,” “believe,” “estimate,” “anticipate,” “plan,” “deliver,” “drive,” “prospect,” “potential,” “opportunity,” “target,” “outlook” and similar expressions are intended to identify our forward-looking statements, including, but not limited to, statements about: our future performance, including our future revenue growth, earnings per share, operating income, margins and cash flow; our supply chain transformation; overheads and overhead cost reduction initiatives; productivity; shared services capability; our investments and the results of those investments; A&C spending; market growth and changing consumption patterns; innovation; opportunities for growth in our portfolio; our well-being portfolio and goals; growth in and revenues from e-commerce; execution of our strategy; prospects for the coffee transaction and acquisitions; share repurchases; shareholder returns; and our Outlook, including 2015 Organic Net Revenue growth and 2015 and 2016 Adjusted Operating Income margin. These forward-looking statements are subject to a number of risks and uncertainties, many of which are beyond our control, which could cause our actual results to differ materially from those indicated in our forward-looking statements. Such factors include, but are not limited to, risks from operating globally and in emerging markets; changes in currency exchange rates, controls and restrictions; continued volatility of commodity and other input costs; weakness in economic conditions; weakness in consumer spending or demand; changes in consumer preferences; pricing actions; unanticipated disruptions to our business; competition; our global workforce; the restructuring program and our other transformation initiatives not yielding the anticipated benefits; changes in the assumptions on which the restructuring program is based; and tax law changes. Please also see our risk factors, as they may be amended from time to time, set forth in our filings with the SEC, including our most recently filed Annual Report on Form 10-K. Mondel z International disclaims and does not undertake any obligation to update or revise any forward-looking statement in this presentation, except as required by applicable law or regulation. |
 Strategies
driving transformation agenda 4
Reduce Costs Supply Chain Reinvention Lower Overheads Margin Expansion & Investment Fuel Invest for Growth Step-Up A&C Investments Fill In Consumer Spaces Sustainable Growth Over the Long Term Focus Portfolio Coffee Transaction Bolt-On Acquisitions ~85% of Revenue from Snacks |
 Driving
sustainable top- and bottom-line
growth to deliver top-tier shareholder returns
5 Gain / hold market share Allocate resources to highest return opportunities Accelerate expansion of Power Brands & innovation platforms across key markets Expand into White Spaces Invest in Power Brands, innovation platforms, sales capabilities and routes to market Leverage operating model to drive speed & scale Leverage consumer and customer insights Deliver strong net productivity Produce Power Brands on advantaged assets Build best-in-class manufacturing footprint Leverage Zero-Based Budgeting tools Migrate toward shared services Simplify organization model Top-Tier Shareholder Returns Drive Revenue Growth Expand Gross Margin Reduce Overheads Invest for Growth |
 Long-term targets unchanged
6 Long-Term Targets Adjusted EPS Growth: Double Digit 1 Organic Net Revenue Growth: At or Above Category Growth Adjusted Operating Income Growth: High Single Digit 1 1. Constant currency. |
 Strong
total shareholder returns Source: FactSet
1. Effective date of the spin-off of the North America grocery business. 2. S&P 500 Consumer Stapes Sector Index. 7 -2.1% -0.8% 17.5% S&P 500 MDLZ S&P 500 Consumer Staples 2 YTD August 31, 2015 46.4% 41.7% 59.5% S&P 500 S&P 500 Consumer Staples 2 MDLZ Since Oct. 1, 2012 1 |
 Returned
$9.7 billion since the spin 8
2.7 4.6 6.8 0.5 1.5 2.4 2.9 2012 2013 2014 YTD June 2015 $0.5 $4.2 $7.0 $9.7 Cumulative Cash Returned to Shareholders ($ billions) 1 1. Since October 1, 2012, the effective date of the spin-off of North American grocery business.
Cash dividends Share repurchases $6.9B share buyback authorization remaining through 2018 |
 Reaffirming
2015 growth outlook 9
1. Global category growth based on available Nielsen Global Data through June 2015 for measured channels in key markets where the company
competes. The company has adjusted the global category growth
calculation to reflect current rather than average H1 2014 currency rates for the hyperinflationary markets of Venezuela and Argentina in order to better represent underlying category growth for the
total portfolio. Absent the adjustment in the calculation, for H1 2015 global
category growth would have been 4.8% for Total Snacks. Snacks categories include the combined biscuits, chocolate, gum and candy categories. 2. Pro forma adjusted items include the coffee business transaction. See Form 8-K dated July 30, 2015, and GAAP to Non-GAAP
reconciliations at the end of this presentation. PF 2014
2 PF 2015E 2 3%+ Organic Net Revenue Growth $30.5B Snacks Categories Growth 1 2014 H1 2015 3.9% 4.5% |
 Reaffirming margin targets
10 Adjusted Operating Income Margin 1. Pro forma adjusted items include: (a) coffee business transaction and (b) reclassification of joint venture equity earnings from operating
income to equity method investment earnings. See Form 8-K dated
July 30, 2015 and the GAAP to Non-GAAP reconciliations at the end of this presentation. 2. Excludes stranded cost impact of (20) to (30) basis points. 12.0% PF 2013 PF 2014 PF 2015E 2016E 11.0% 1 1 1 ~14% 2 15%-16% Beyond 2016, opportunity to drive continued margin expansion and fund growth |
 Delivering
world-class productivity levels 1.8%
2.5% 2.8% 2012 2013 2014 2015E-2018E 11 Note: Net productivity levels for 2011 through H1 2015 include results from the company’s global coffee business that was combined with
D.E Master Blenders 1753 on July
2, 2015, to create Jacobs Douwe Egberts. 3%+ 3.2% in H1 2015 Net Productivity as Percent of Cost of Goods Sold |
 Building a
best-in-class plant footprint Closed
/ Sold Streamlined Greenfields / Brownfields Completed 19 31 1 JDE 12 - - In Process - 16 13 Total 31 47 14 12 Manufacturing Network Transformation Activities January 2012 to August 2015 |
 ~40
“Lines of the Future” by year-end 13
Biscuits Chocolate Gum Powdered Beverages 17 5 2 2 ~40 on-stream by year-end 2015 Lines On-Stream 1 Locations 26 1. As of August 31, 2015. |
 30%+
cost savings / ton 2x output of current
North American assets
20%+ cost savings / ton
Flexibility to produce wide
range of package sizes
20%+ cost savings / ton
Significantly reduced
manufacturing time Lines of the Future driving savings 14 |
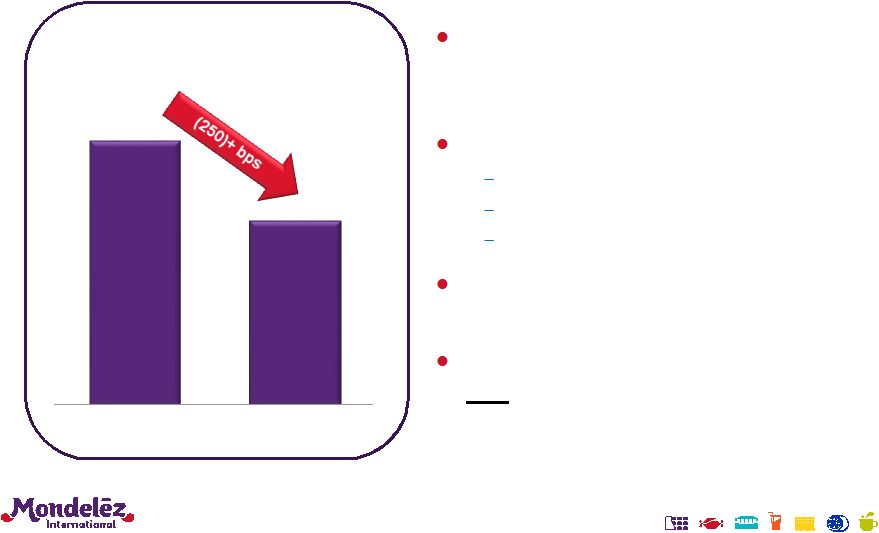 Significantly reducing overhead costs
Overheads as % of Net Revenue
PF 2013 2016E Identify and capture sustainable cost reductions with zero-based budgeting approach (ZBB) Three key initiatives: Indirect costs People costs and organizational model Shared services Further reductions targeted beyond 2016 Savings driving margin improvement and fueling growth investments 15 |
 Indirect
cost progress ahead of plans & increasing/accelerating
targets Cost Package
2015 Status Targeted Reduction Update 1. Travel + 50%+ Accelerate progress & reset targets 2. Facilities 50%+ Expanded scope & reset targets 3. Contractors & Consultants + 70%+ Hit ‘18 target in ‘15 … reset target 4. Perquisite Vehicles 40% On track … reset policies 5. Company Vehicles + 40% Consolidated program & 1 vendor 6. Business Events + 50%+ Accelerate progress & reset targets 7. Legal Services 30% On track … targeting best-in-class level 8. Financial Services 30% On track … targeting best-in-class level 9. Information Systems + 40% Exceeding ’15 targets … accelerate 10. Learning & Development + 30% Exceeding ‘15 targets … accelerate 11. Sales Support tbd tbd New package … set targets for ’16 12. Marketing Support tbd tbd New package … set targets for ‘16 16 |
 Global
Shared Services – driving process
effectiveness and scale benefits
Finance 40%+ of activities in scope ~50% average cost savings for in-scope ~150 separate process migrations over 3 years 17 FP&A, accounting, overhead management and supply chain finance ~50% Function % Activities in Scope Selected Key Activities Human Resources Payroll and HR administrative support ~40% Order Management Order-to-cash and collections ~40% Sourcing Indirect spend purchases and accounts payable ~30% Sales Sales back office and operational support ~20% |
 Cost
reduction programs driving margin expansion and fueling growth
18 Delivering supply chain and overhead cost savings faster than expected, while also finding new opportunities Cost savings fueling both margin expansion and increased growth investments On track to deliver 2015 and 2016 Adjusted Operating Income margin targets |
 Mark
Clouse EVP and Chief Growth Officer |
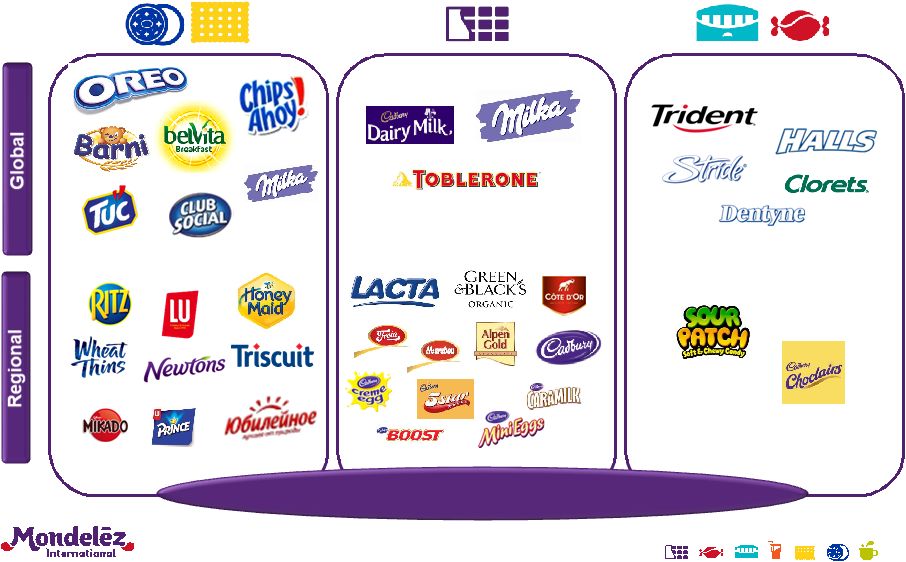 Growth
plan built on strong foundation of world’s favorite snacks brands
… 20
~70% of H1 2015 Revenue
1 1. Excludes coffee. |
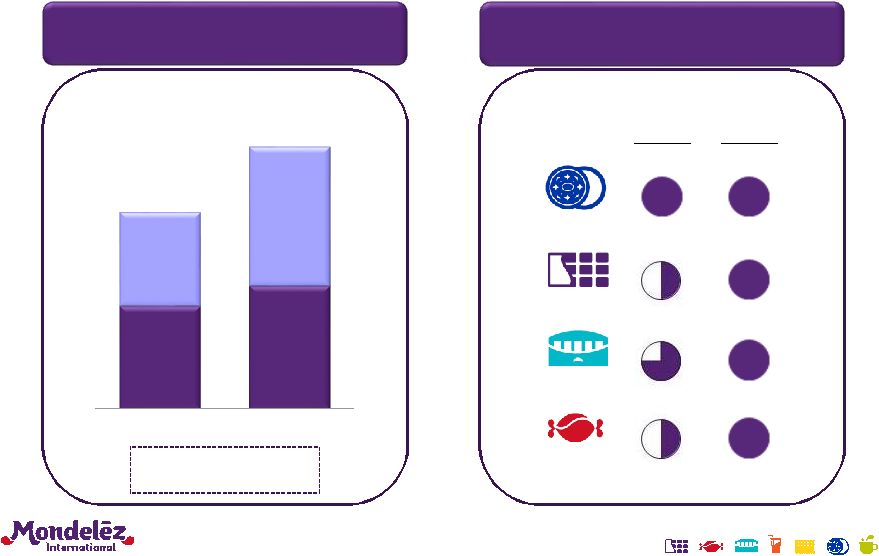
 …
global category leadership North
America Europe Global Latin America Asia Pacific Eastern Europe Middle East & Africa -- Source: Euromonitor 2014 Biscuits Chocolate Gum Candy 21 |
 … and
an advantaged geographic footprint
Developed Markets 61% Emerging Markets 39% Pro Forma 2014 Revenue of $30.5B (excluding coffee) 22 |
 Executing
two strategies to drive long-term growth
23 Accelerate Base Business Growth Fill In Key Consumer Spaces |
 Stepping
up investments in base business in proven areas
24 Increase A&C investments to optimal levels Shift A&C to high ROI digital and social media outlets Leverage Price Pack Architecture Launch proven platforms into White Spaces Accelerate Base Business Growth |
 Increasing
A&C behind Power Brands to drive highest returns and improve share of
voice 25
A&C as % Net Revenue
2014 2018E Emerging Markets Developed Markets Emerging Markets Developed Markets 8%+ 10%+ SOV / SOM 1 in Key Markets Increasing Total A&C Support Especially in Emerging Markets Improving Share of Voice in Key Markets 2015E 2018E Biscuits Chocolate Gum Candy 1. SOV / SOM = Share of Voice divided by Share of Market. Source: SMG/Carat. Power Brands % 80%+ ~90% |
 Shifting
support to high ROI digital and social media outlets
26 Digital as % Total Media Spend 2014 2018E 15%+ ~30% Digital and social media ROI ~2x traditional media |
 Leveraging
Price Pack Architecture to increase penetration and expand
reach Maximize Platforms to
Expand Occasions Grow Category and Share with Family Packs Increase Accessibility with Small Formats at Low Price Points Traditional Trade Single Serve (e.g., 6 piece) Gifting Tin Bite-size bag Multi-pack Minis To-Go Cup Minis Family Size Regular Family Size 27 |
 Opportunities to accelerate innovation
expansion globally 28 USA Canada UK Germany Australia Brazil Russia India China Selected Biscuit Platform Opportunities Chocobakery |
 Global
roll out of chocolate tablet innovation is a great example of proven
platform expansion 29
$0.5B+ revenue platform today; targeting
$1.0B+ revenue platform by 2020
Already present in 57 countries
Margin accretive to chocolate portfolio
Aligned playbook and global menu cards
for all launches Leveraging advantaged assets Category model driving faster deployment |
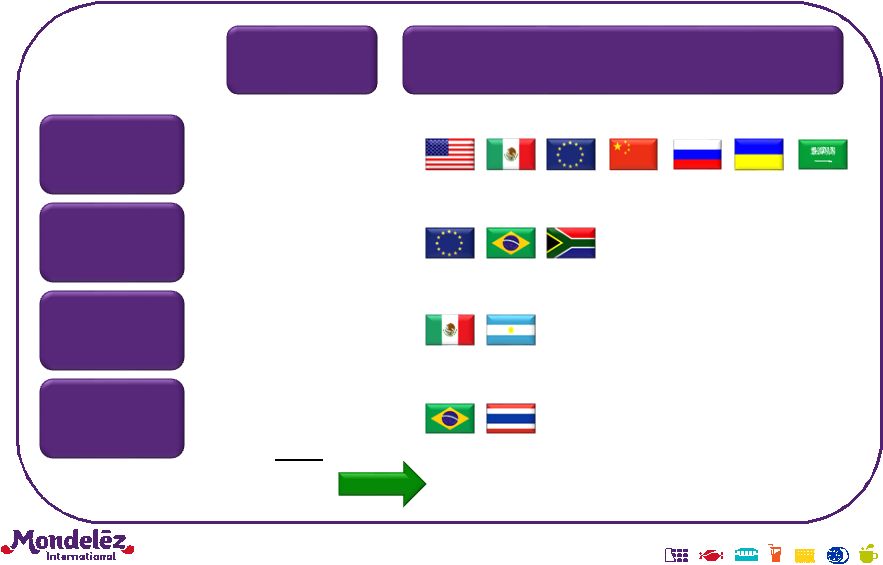
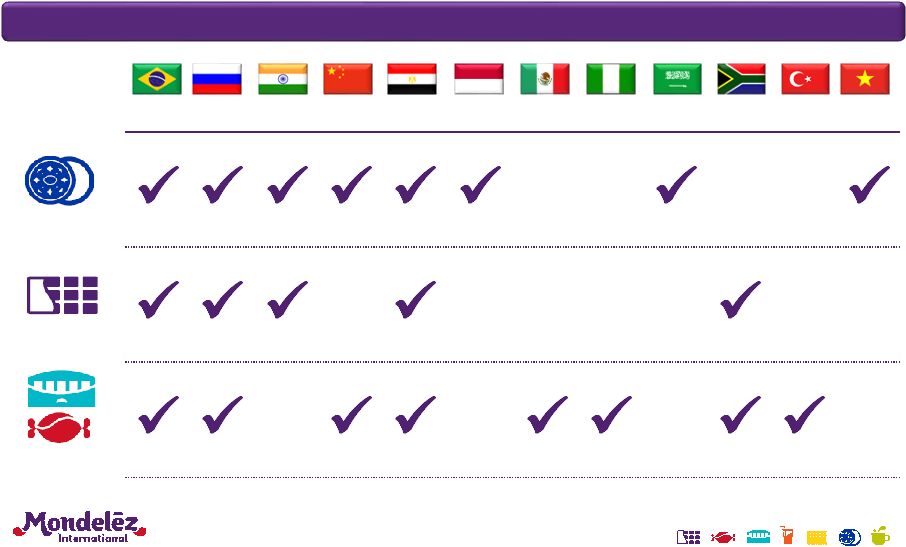 Opportunities to enter category White
Spaces 30 Biscuits Gum & Candy Chocolate Selected Category White Space Opportunities Brazil Russia India China Egypt Indonesia Mexico Nigeria Saudi Arabia South Africa Turkey Vietnam |
 Macro
trends shaping snacking global behavior & creating growth
opportunities 31
Fill In Key Consumer Spaces Emphasis on Well-Being Time Compression Shift of Income Distribution |
 32 Well-Being is the biggest opportunity to accelerate growth Drive Well-Being focus through existing portfolio and innovation Simplify and enhance existing portfolio Focus innovation on consumer Well-Being needs Targeting 50% of revenue in Well-Being snacks by 2020 |
 Simplify
and enhance existing portfolio 33
1. Goals and results versus 2012 baseline.
Three ingredients: whole
wheat, Canola oil and natural
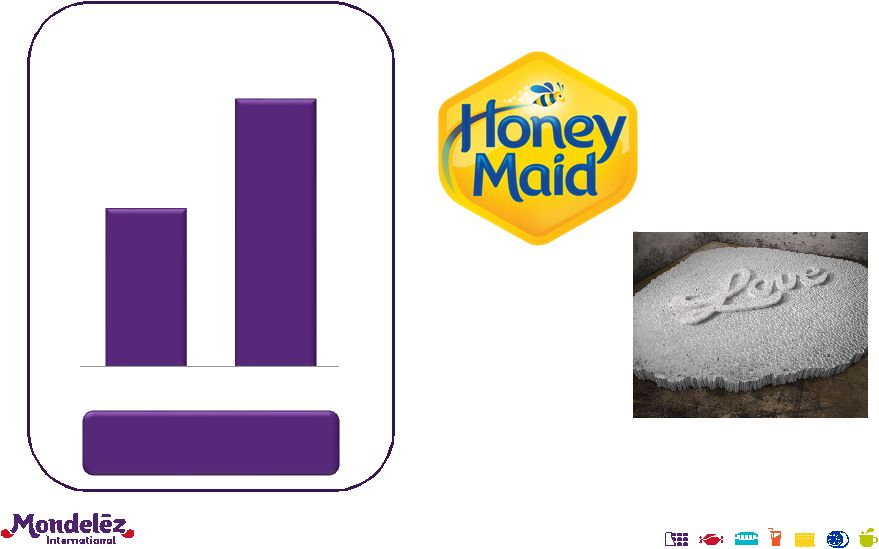
flavors No artificial colors Sodium <170 mg/serving today (11% reduction) 100% whole grains Thinner, crispier formats New simplified graphics with front-of-pack labeling 2020 Goals 1 Reduce saturated fat 10% Reduce sodium 10% Increase whole grains 25% Simplify ingredients Remove artificial colors and flavors Execute front-of-pack calorie labeling globally |
 Greater
focus on Well-Being innovation already impacting portfolio
~$40MM of revenue 1 Acquired in 2015, developing global expansion plans 34 1. 2014 revenue. 2. 2014 revenue for childrens’ wholesome platform, which includes Barni,
Ourson and Teddy Grahams.
~$300MM of revenue 2 Playful treat, made with only wholesome, simple ingredients $600MM+ of revenue 1 Combines convenience and taste with proprietary energy bundle |
 35 E-commerce is changing the way consumers are buying our brands Develop and build an industry-leading e-commerce snacks business Optimize existing platforms in e-commerce Build advantaged next-generation portfolio $1B revenue opportunity by 2020 |
 Buy
Now enabled media in 25 countries and with 130 retailers
Global e-commerce team
established Forming strong partnerships with global e-commerce retail leaders Optimize existing platforms in e-commerce 36 |
 Build
advantaged next-generation portfolio
Holiday Gifting Specialty Brand Expansion Custom Experiences / Personalization Licensed Products 37 |
 38 Broadening portfolio to meet growing consumer cohorts Expand portfolio to include more Aspirant and Premium offerings Access to Power Brands for Aspirants Increase focus on Premium segments Strengthen Category Growth and Shares |
 Expand
portfolio to include more Aspirant and Premium offerings
Aspirants Middle Class Upper Middle Class Affluent % of 2020 Households 1 ~20% 25%+ ~20% ~5% Focus 1. Reflects percentage of global households. The balance of remaining households typically do not buy branded products Source: Euromonitor; Company Analysis 39 Affordable Formats of Power Brands Strengthen Premium and More Special Brands |
 Already
executing strategies to drive strong Organic Net Revenue growth
40 2015E Long-Term Growth Target Fill In Key Consumer Spaces 3%+ At or above category growth Accelerate Base Business Growth |
 Driving
sustainable top- and bottom-line
growth to deliver top-tier shareholder returns
41 Top-Tier Shareholder Returns Drive Revenue Growth Expand Gross Margin Reduce Overheads Invest for Growth |
 42 * * * * |
 GAAP to
Non-GAAP Reconciliations 43
Net Revenues Gross Profit Gross Profit Margin Operating Income Operating Income Margin Reported (GAAP) 15,423 $ 6,007 $ 38.9% 1,652 $ 10.7% 2012-2014 Restructuring Program costs - - (3) 2014-2018 Restructuring Program costs - 12 406 Integration Program and other acquisition integration costs - - 1 Remeasurement of net monetary assets in Venezuela - - 11 Costs associated with the coffee business transaction - 3 185 Operating income from divestiture - - (5) Gain on divestiture - - (13) Acquisition-related costs - - 2 Rounding - - 1 Adjusted (Non-GAAP) 15,423 $ 6,022 $ 39.0% 2,237 $ 14.5% Reclassification of coffee business (1,627) (673) (342) Reclassification of equity method investment earnings - - (51) Pro Forma Adjusted (Non-GAAP) 13,796 $ 5,349 $ 38.8% 1,844 $ 13.4% Currency 715 271 Pro Forma Adjusted @ Constant FX (Non-GAAP) 6,064 $ 2,115 $ Net Revenues Gross Profit Gross Profit Margin Operating Income Operating Income Margin Reported (GAAP) 17,077 $ 6,309 $ 36.9% 1,800 $ 10.5% Spin-Off Costs - - 19 2012-2014 Restructuring Program costs - 6 139 2014-2018 Restructuring Program costs - - 10 Integration Program and other acquisition integration costs - - (2) Remeasurement of net monetary assets in Venezuela - - 142 Costs associated with the coffee business transaction - - 5 Operating income from divestiture - - (3) Adjusted (Non-GAAP) 17,077 $ 6,315 $ 37.0% 2,110 $ 12.4% Reclassification of coffee business (1,858) (750) (310) Reclassification of equity method investment earnings - - (57) Pro Forma Adjusted (Non-GAAP) 15,219 $ 5,565 $ 36.6% 1,743 $ 11.5% Gross Profit Operating Income % Change - Reported (GAAP) (4.8)% (8.2)% % Change - Adjusted (Non-GAAP) (4.6)% 6.0 % % Change - Pro Forma Adjusted (Non-GAAP) (3.9)% 5.8 % % Change - Pro Forma Adjusted @ Constant FX (Non-GAAP) 9.0 % 21.3 % For the Six Months Ended June 30, 2014 Gross Profit/Operating Income to Pro Forma Adjusted Gross Profit/Operating Income (in millions of U.S. dollars) (Unaudited) For the Six Months Ended June 30, 2015 |
 GAAP to
Non-GAAP Reconciliations 44
Net Revenues Operating Income Operating Income Margin Reported (GAAP) 34,244 $ 3,242 $ 9.5% Spin-Off Costs - 35 2012-2014 Restructuring Program costs - 459 2014-2018 Restructuring Program costs - 381 Integration Program and other acquisition integration costs - (4) Remeasurement of net monetary assets in Venezuela - 167 Costs associated with the coffee business transaction - 77 Operating income from divestiture - (8) Acquisition-related costs - 2 Intangible asset impairment charges - 57 Adjusted (Non-GAAP) 34,244 $ 4,408 $ 12.9% Reclassification of coffee business (3,776) (646) Reclassification of equity method investment earnings - (104) Pro Forma Adjusted (Non-GAAP) 30,468 $ 3,658 $ 12.0% Net Revenues Operating Income Operating Income Margin Reported (GAAP) 35,299 $ 3,971 $ 11.2% Spin-Off Costs - 62 2012-2014 Restructuring Program costs - 330 Integration Program and other acquisition integration costs - 220 Benefit from indemnification resolution - (336) Remeasurement of net monetary assets in Venezuela - 54 Gains on acquisition and divestitures, net - (30) Impact from divestitures (70) (12) Acquisition-related costs - 2 Adjusted (Non-GAAP) 35,229 $ 4,261 $ 12.1% Reclassification of coffee business (3,904) (700) Reclassification of equity method investment earnings - (101) Pro Forma Adjusted (Non-GAAP) 31,325 $ 3,460 $ 11.0% For the Twelve Months Ended December 31, 2013 For the Twelve Months Ended December 31, 2014 Pro Forma Adjusted Net Revenue / Operating Income Net Revenue / Operating Income to (in millions of U.S. dollars) (Unaudited) |
Serious News for Serious Traders! Try StreetInsider.com Premium Free!
You May Also Be Interested In
- Mondelēz International’s Global R&D Team Opens Applications for Second CoLab Tech Program
- Churchill Downs Partners with Alex Cooper's The Unwell Network to Host Exclusive Infield Activation for 150th Kentucky Derby®
- RITZ Brand Introduces Limited Edition Buttery-er Flavored Crackers Along with the Chance to Strike Gold
Create E-mail Alert Related Categories
SEC FilingsSign up for StreetInsider Free!
Receive full access to all new and archived articles, unlimited portfolio tracking, e-mail alerts, custom newswires and RSS feeds - and more!
