Form 8-K MYRIAD GENETICS INC For: Feb 02
UNITED STATES
SECURITIES AND EXCHANGE COMMISSION
Washington, D.C. 20549
FORM 8-K
CURRENT REPORT
Pursuant to Section 13 or 15(d)
of the Securities Exchange Act of 1934
Date of Report (Date of earliest event reported): February 2, 2016
MYRIAD GENETICS, INC.
(Exact name of registrant as specified in its charter)
| Delaware | 0-26642 | 87-0494517 | ||
| (State or other jurisdiction of incorporation) |
(Commission File Number) |
(IRS Employer Identification No.) |
320 Wakara Way
Salt Lake City, Utah 84108
(Address of principal executive offices) (Zip Code)
Registrant’s telephone number, including area code: (801) 584-3600
Not Applicable
(Former name or former address, if changed since last report)
Check the appropriate box below if the Form 8-K filing is intended to simultaneously satisfy the filing obligation of the registrant under any of the following provisions (see General Instruction A.2. below):
| ¨ | Written communications pursuant to Rule 425 under the Securities Act (17 CFR 230.425) |
| ¨ | Soliciting material pursuant to Rule 14a-12 under the Exchange Act (17 CFR 240.14a-12) |
| ¨ | Pre-commencement communications pursuant to Rule 14d-2(b) under the Exchange Act (17 CFR 240.14d-2(b)) |
| ¨ | Pre-commencement communications pursuant to Rule 13e-4(c) under the Exchange Act (17 CFR 240.13e-4(c)) |
| ITEM 2.02 | Results of Operations and Financial Condition. |
On February 2, 2016, Myriad Genetics, Inc. (“Myriad”) announced its financial results for the three months ended December 31, 2015. The earnings release is attached hereto as Exhibit 99.1 to this Current Report on Form 8-K and incorporated herein by reference.
| ITEM 7.01 | Regulation FD Disclosure. |
On its earnings conference call for the three months ended December 31, 2015, Myriad also delivered a slide presentation, which is attached hereto as Exhibit 99.2 to this Current Report on Form 8-K and incorporated herein by reference. [The slide presentation will also be available under the “Investors –Events & Presentations” section of Myriad’s website at www.myriad.com.]
FORWARD-LOOKING STATEMENTS
Exhibits 99.1 and 99.2 contain “forward-looking statements” within the meaning of the Private Securities Litigation Reform Act of 1995, including statements relating to our business, goals, strategy and financial and operational outlook. These “forward-looking statements” are based on management’s current expectations of future events and are subject to a number of risks and uncertainties that could cause actual results to differ materially and adversely from those set forth in or implied by forward-looking statements. These risks and uncertainties include, but are not limited to: the risk that sales and profit margins of our existing molecular diagnostic tests and pharmaceutical and clinical services may decline or will not continue to increase at historical rates; risks related to our ability to transition from our existing product portfolio to our new tests; risks related to changes in the governmental or private insurers reimbursement levels for our tests or our ability to obtain reimbursement for our new tests at comparable levels to our existing tests; risks related to increased competition and the development of new competing tests and services; the risk that we may be unable to develop or achieve commercial success for additional molecular diagnostic tests and pharmaceutical and clinical services in a timely manner, or at all; the risk that we may not successfully develop new markets for our molecular diagnostic tests and pharmaceutical and clinical services, including our ability to successfully generate revenue outside the United States; the risk that licenses to the technology underlying our molecular diagnostic tests and pharmaceutical and clinical services tests and any future tests are terminated or cannot be maintained on satisfactory terms; risks related to delays or other problems with operating our laboratory testing facilities; risks related to public concern over our genetic testing in general or our tests in particular; risks related to regulatory requirements or enforcement in the United States and foreign countries and changes in the structure of the healthcare system or healthcare payment systems; risks related to our ability to obtain new corporate collaborations or licenses and acquire new technologies or businesses on satisfactory terms, if at all; risks related to our ability to successfully integrate and derive benefits from any technologies or businesses that we license or acquire; risks related to our projections about the potential market opportunity for our products; the risk that we or our licensors may be unable to protect or that third parties will infringe the proprietary technologies underlying our tests; the risk of patent-infringement claims or challenges to the validity of our patents; risks related to changes in intellectual property laws covering our molecular diagnostic tests and pharmaceutical and clinical services and patents or enforcement in the United States and foreign countries, such as the Supreme Court decision in the lawsuit brought against us by the Association for Molecular Pathology et al; risks of new, changing and competitive technologies and regulations in the United States and internationally; and other factors discussed under the heading “Risk Factors” contained in Item 1A of our most recent Annual Report on Form 10-K, which has been filed
Page 2
with the Securities and Exchange Commission, as well as any updates to those risk factors filed from time to time in our Quarterly Reports on Form 10-Q or Current Reports on Form 8-K. All information in the exhibits is as of the date of the exhibits, and Myriad undertakes no duty to update this information unless required by law.
| ITEM 9.01 | Financial Statements and Exhibits. |
(d)
| Exhibit |
Description | |
| 99.1 | Earnings release dated February 2, 2016 for the three months ended December 31, 2015. | |
| 99.2 | Earnings call slide presentation dated February 2, 2016 for the three months ended December 31, 2015. | |
The exhibit(s) may contain hypertext links to information on our website or other parties’ websites. The information on our website and other parties’ websites is not incorporated by reference into this Current Report on Form 8-K and does not constitute a part of this Form 8-K.
In accordance with General Instruction B-2 of Form 8-K, the information set forth in Item 2.02 and Item 7.01 and in Exhibits 99.1 and 99.2 shall not be deemed to be “filed” for purposes of Section 18 of the Securities Exchange Act of 1934, as amended (the “Exchange Act”), or otherwise subject to the liability of that section, and shall not be incorporated by reference into any registration statement or other document filed under the Securities Act of 1933, as amended or the Exchange Act, except as shall be expressly set forth by specific reference in such filing.
Page 3
SIGNATURES
Pursuant to the requirements of the Securities Exchange Act of 1934, the registrant has duly caused this report to be signed on its behalf by the undersigned hereunto duly authorized.
| MYRIAD GENETICS, INC. | ||||||
| Date: February 2, 2016 | By: | /s/ R. Bryan Riggsbee | ||||
| R. Bryan Riggsbee | ||||||
| Executive Vice President, Chief Financial Officer | ||||||
Page 4
EXHIBIT INDEX
| Exhibit |
Description | |
| 99.1 | Earnings release dated February 2, 2016 for the three months ended December 31, 2015. | |
| 99.2 | Earnings call slide presentation dated February 2, 2016 for the three months ended December 31, 2015. | |
Page 5
Exhibit 99.1

News Release
| Media Contact: | Ron Rogers | Investor Contact: | Scott Gleason | |||||
| (801) 584-3065 | (801) 584-1143 | |||||||
| [email protected] | [email protected] |
Myriad Genetics Reports Fiscal Second-Quarter 2016 Financial Results
| • | Total Revenues of $193.3 Million |
| • | Adjusted Diluted EPS of $0.45 and Diluted EPS of $0.41 |
| • | Company Maintains Fiscal Year 2016 Revenue Guidance, Raises Fiscal Year 2016 Earnings Guidance and Provides Fiscal Third-Quarter 2016 Financial Guidance |
SALT LAKE CITY, UTAH, February 2, 2016 – Myriad Genetics, Inc. (NASDAQ: MYGN) today announced financial results for its fiscal second-quarter 2016, provided an update on recent business highlights, maintained its fiscal year 2016 revenue guidance, raised its fiscal year 2016 earnings guidance and provided fiscal third-quarter 2016 financial guidance.
“We are pleased with the first half of fiscal year 2016 which has positioned us to deliver upon our financial guidance for the full year,” said Mark C. Capone, president and chief executive officer of Myriad. “Our new products are making significant strides towards broader market adoption and reimbursement on a worldwide basis. Additionally, we are excited to announce that our companion diagnostic portfolio has expanded to five tests with the addition of two new tests that have been incorporated into additional pharmaceutical company collaborations. We remain on track to achieve our five-year strategic goals and build Myriad into a diversified, global, leader in personalized medicine.”
Financial Highlights
| • | Below are tables summarizing the financial results and revenue by product class for our fiscal second-quarter 2016: |
Revenue
| Fiscal Second-Quarter | % | |||||||||||
| ($ in millions) | 2016 | 2015 | Change | |||||||||
| Molecular diagnostic testing revenue |
||||||||||||
| Hereditary cancer testing revenue |
$ | 166.6 | $ | 165.0 | 1 | % | ||||||
| Vectra DA testing revenue |
11.3 | 10.8 | 5 | % | ||||||||
| Prolaris testing revenue |
1.9 | 0.4 | 375 | % | ||||||||
| Other testing revenue |
2.8 | 3.0 | (7 | %) | ||||||||
|
|
|
|
|
|
|
|||||||
| Total molecular diagnostic testing revenue |
182.6 | 179.2 | 2 | % | ||||||||
|
|
|
|
|
|
|
|||||||
| Pharmaceutical and clinical service revenue |
10.7 | 5.2 | 106 | % | ||||||||
|
|
|
|
|
|
|
|||||||
| Total Revenue |
$ | 193.3 | $ | 184.4 | 5 | % | ||||||
|
|
|
|
|
|
|
|||||||
Income Statement
| Fiscal Second-Quarter | % | |||||||||||
| ($ in millions) | 2016 | 2015 | Change | |||||||||
| Total Revenue |
$ | 193.3 | $ | 184.4 | 5 | % | ||||||
| Gross Profit |
152.7 | 146.5 | 4 | % | ||||||||
| Gross Margin |
79.0 | % | 79.5 | % | ||||||||
| Operating Expenses |
107.5 | 110.2 | (2 | %) | ||||||||
| Operating Income |
45.2 | 36.3 | 25 | % | ||||||||
| Operating Margin |
23.4 | % | 19.7 | % | ||||||||
| Adjusted Operating Income |
48.4 | 43.8 | 11 | % | ||||||||
| Adjusted Operating Margin |
25.0 | % | 23.7 | % | ||||||||
| Net Income |
30.3 | 24.0 | 26 | % | ||||||||
| Diluted EPS |
0.41 | 0.32 | 28 | % | ||||||||
| Adjusted EPS |
$ | 0.45 | $ | 0.40 | 13 | % | ||||||
|
|
|
|
|
|
|
|||||||
2
Business Highlights
| • | myRisk® Hereditary Cancer |
| • | Myriad presented an interim analysis of a large clinical utility study comparing myRisk Hereditary Cancer to BRACAnalysis® at the San Antonio Breast Cancer Symposium (SABCS). In the interim analysis, myRisk Hereditary Cancer increased the number of patients receiving clinically appropriate risk reduction measures by 61 percent. |
| • | The Company announced today that 61 percent of its hereditary cancer revenue is now under three-year, non-cancellable, payer contracts. |
| • | Vectra® DA |
| • | Vectra DA volumes were up 13 percent year-over-year in the fiscal second-quarter with more than 38,000 tests performed. |
| • | At the American College of Rheumatology Annual Meeting, Myriad presented multiple studies on the potential ability of Vectra DA to predict therapy response. One study demonstrated that Vectra DA predicts response for methotrexate incomplete responders to DMARDs or biologics. In another study, Vectra DA predicted which patients could taper their therapy without experiencing flares. |
| • | During the second quarter, Myriad announced the issuance of the first patent pertaining to the Vectra DA testing process by the U.S. Patent and Trademark Office. |
| • | Prolaris®/Urology |
| • | Prolaris sample volume was up 104 percent year-over-year and 26 percent sequentially with over 3,500 tests ordered. |
| • | At the 2016 ASCO Genitourinary Cancers Symposium (ASCO GU), Myriad presented data on more than 11,000 men with prostate cancer to evaluate their ability to pursue active surveillance based upon the Prolaris Combined Score (PCS); 63 percent of the men qualified for active surveillance based on their PCS, almost doubling the number of eligible patients when compared to traditional pathology. |
| • | Myriad also presented its first validation study on the myPlan™ Renal Cancer prognostic test at ASCO GU. When the myPlan score was combined with pathological stage to provide a combined prognostic score (CPS), patients with a high CPS had a three-fold increased risk of recurrence compared to patients with a low score. |
3
| • | Companion Diagnostics |
| • | At SABCS, Myriad presented multiple studies demonstrating the ability of the myChoice® HRD test to predict response to DNA damaging agents. In a pooled analysis of five statistically significant studies, patients with a positive myChoice HRD score had a three-fold increase in pathological complete response when compared to those patients with a negative score. |
| • | Today, Myriad is announcing the addition of two new companion diagnostics. The first is a tumor sequencing panel that contains the full sequencing of 80 clinically actionable genes and is customizable for our pharmaceutical partners to support clinical trials. The second new companion diagnostic is a proprietary assay that evaluates the functionality of the immune pathway and predicts response to immunotherapy. The Company already has signed undisclosed research collaborations with major pharmaceutical partners on each of these new products to be evaluated in combination with myChoice HRD. |
| • | International |
| • | International revenues were up 29 percent sequentially in the second quarter and accounted for four and a half percent of total revenue in the quarter. |
| • | At SABCS, Myriad presented a study that evaluated 928 patients in the TransATAC cohort that compared the performance of EndoPredict® to the widely-used first generation breast cancer prognostic test. In this study, EndoPredict more accurately predicted 10-year distant metastases when compared to the first-generation prognostic test. |
| • | During the fiscal second-quarter, Myriad won a competitive tender for EndoPredict in France that is expected to generate revenue during calendar year 2016. Additionally, Helsana, the largest insurance provider in Switzerland, announced a favorable coverage decision for Prolaris. |
| • | Share Repurchase |
| • | During the quarter, the Company repurchased approximately 0.6 million shares, or $25 million, of common stock under our share repurchase program and ended the quarter with approximately $92 million remaining on our current share repurchase authorization. |
4
Fiscal Third-Quarter and Fiscal Full-Year 2016 Financial Guidance
Below is a table summarizing Myriad’s fiscal year 2016 and fiscal third-quarter 2016 financial guidance:
| Revenue | Adjusted Earnings Per Share |
GAAP Diluted Earnings Per Share |
||||||||||
| Fiscal Year 2016 |
$ | 750-$770 million | $ | 1.63-$1.68 | $ | 1.48-$1.53 | ||||||
| Fiscal Third-Quarter 2016 |
$ | 183-$185 million | $ | 0.37-$0.39 | $ | 0.33-$0.35 | ||||||
|
|
|
|
|
|
|
|||||||
The Company is maintaining its fiscal full-year revenue guidance of $750 to $770 million and raising its adjusted earnings per share guidance from the previous range of $1.60 to $1.65 to $1.63 to $1.68. Additionally, Myriad is issuing fiscal third-quarter 2016 financial guidance with revenues of $183 to $185 million and adjusted earnings per share of $0.37 to $0.39.
These projections are forward-looking statements and are subject to the risks summarized in the safe harbor statement at the end of this press release. The Company will provide further details on its business outlook during its conference call today to discuss the fiscal second-quarter financial results and fiscal third-quarter and fiscal full-year 2016 financial guidance.
Conference Call and Webcast
A conference call will be held today, Tuesday, February 2, 2016, at 4:30 p.m. EST to discuss Myriad’s financial results for the fiscal second-quarter, business developments and financial guidance. The dial-in number for domestic callers is (800) 676-1873. International callers may dial (303) 223-4378. All callers will be asked to reference reservation number 21802448. An archived replay of the call will be available for seven days by dialing (800) 633-8284 and entering the reservation number above. The conference call along with a slide presentation will also will be available through a live webcast at www.myriad.com.
About Myriad Genetics
Myriad Genetics Inc., is a leading personalized medicine company dedicated to being a trusted advisor transforming patient lives worldwide with pioneering molecular diagnostics. Myriad discovers and commercializes molecular diagnostic tests that: determine the risk of developing disease, accurately diagnose disease, assess the risk of disease progression, and guide treatment decisions across six major medical specialties where molecular diagnostics can significantly improve patient care and lower healthcare costs. Myriad is focused on three strategic imperatives: transitioning and expanding its hereditary cancer testing markets, diversifying its product portfolio through the
5
introduction of new products and increasing the revenue contribution from international markets. For more information on how Myriad is making a difference, please visit the Company’s website: www.myriad.com.
Myriad, the Myriad logo, BART, BRACAnalysis, Colaris, Colaris AP, myPath, myRisk, myRisk Hereditary Cancer, myChoice, myPlan, BRACAnalysis CDx, Tumor BRACAnalysis CDx, myChoice HRD, Vectra and Prolaris are trademarks or registered trademarks of Myriad Genetics, Inc. or its wholly owned subsidiaries in the United States and foreign countries. MYGN-F, MYGN-G
6
MYRIAD GENETICS, INC. AND SUBSIDIARIES
CONSOLIDATED INCOME STATEMENTS (Unaudited)
| (in millions, except per share amounts) | Three Months Ended | Six Months Ended | ||||||||||||||
| Dec 31, 2015 | Dec 31, 2014 | Dec 31, 2015 | Dec 31, 2014 | |||||||||||||
| Molecular diagnostic testing |
$ | 182.6 | $ | 179.2 | $ | 354.5 | $ | 343.6 | ||||||||
| Pharmaceutical and clinical services |
10.7 | 5.2 | 22.3 | 9.6 | ||||||||||||
|
|
|
|
|
|
|
|
|
|||||||||
| Total revenue |
193.3 | 184.4 | 376.8 | 353.2 | ||||||||||||
| Costs and expenses: |
||||||||||||||||
| Cost of molecular diagnostic testing |
34.1 | 35.1 | 65.0 | 67.8 | ||||||||||||
| Cost of pharmaceutical and clinical services |
6.5 | 2.8 | 12.1 | 4.9 | ||||||||||||
| Research and development expense |
16.7 | 17.5 | 33.9 | 40.1 | ||||||||||||
| Selling, general, and administrative expense |
90.8 | 92.7 | 177.3 | 178.1 | ||||||||||||
|
|
|
|
|
|
|
|
|
|||||||||
| Total costs and expenses |
148.1 | 148.1 | 288.3 | 290.9 | ||||||||||||
|
|
|
|
|
|
|
|
|
|||||||||
| Operating income |
45.2 | 36.3 | 88.5 | 62.3 | ||||||||||||
| Other income (expense): |
||||||||||||||||
| Interest income |
0.1 | 0.1 | 0.2 | 0.1 | ||||||||||||
| Other |
(0.3 | ) | 1.5 | (0.1 | ) | 1.4 | ||||||||||
|
|
|
|
|
|
|
|
|
|||||||||
| Total other income (expense) |
(0.2 | ) | 1.6 | 0.1 | 1.5 | |||||||||||
| Income before income taxes |
45.0 | 37.9 | 88.6 | 63.8 | ||||||||||||
| Income tax provision |
14.7 | 13.9 | 31.6 | 23.8 | ||||||||||||
|
|
|
|
|
|
|
|
|
|||||||||
| Net income |
$ | 30.3 | $ | 24.0 | $ | 57.0 | $ | 40.0 | ||||||||
|
|
|
|
|
|
|
|
|
|||||||||
| Earnings per share: |
||||||||||||||||
| Basic |
$ | 0.43 | $ | 0.33 | $ | 0.82 | $ | 0.55 | ||||||||
| Diluted |
$ | 0.41 | $ | 0.32 | $ | 0.78 | $ | 0.53 | ||||||||
| Weighted average shares outstanding |
||||||||||||||||
| Basic |
70.5 | 72.5 | 69.6 | 72.6 | ||||||||||||
| Diluted |
73.8 | 75.4 | 73.1 | 75.8 | ||||||||||||
7
Consolidated Balance Sheets (Unaudited)
| (in millions) | Dec 31, 2015 | Jun. 30, 2015 | ||||||
| Current assets: |
||||||||
| Cash and cash equivalents |
$ | 134.7 | $ | 64.1 | ||||
| Marketable investment securities |
84.6 | 80.7 | ||||||
| Prepaid expenses |
9.7 | 12.5 | ||||||
| Inventory |
29.1 | 25.1 | ||||||
| Trade accounts receivable, less allowance for doubtful accounts of $6.2 December 31, 2015 and $7.6 June 30, 2015 |
84.3 | 85.8 | ||||||
| Deferred taxes |
— | 13.5 | ||||||
| Prepaid taxes |
28.0 | — | ||||||
| Other receivables |
5.1 | 1.9 | ||||||
|
|
|
|
|
|||||
| Total current assets |
375.5 | 283.6 | ||||||
| Property, plant and equipment, net |
61.7 | 67.2 | ||||||
| Long-term marketable investment securiteis |
66.2 | 40.6 | ||||||
| Intangibles, net |
186.3 | 192.6 | ||||||
| Goodwill |
177.0 | 177.2 | ||||||
| Other assets |
5.0 | 5.0 | ||||||
|
|
|
|
|
|||||
| Total assets |
$ | 871.7 | $ | 766.2 | ||||
| Current liabilities: |
||||||||
| Accounts payable |
$ | 16.5 | $ | 21.1 | ||||
| Accrued liabilities |
47.9 | 46.1 | ||||||
| Deferred revenue |
1.5 | 1.5 | ||||||
|
|
|
|
|
|||||
| Total current liabilities |
65.9 | 68.7 | ||||||
| Unrecognized tax benefits |
27.9 | 26.4 | ||||||
| Other long-term liabilities |
6.8 | 8.8 | ||||||
| Long-term deferred taxes |
0.3 | 0.2 | ||||||
|
|
|
|
|
|||||
| Total liabilities |
100.9 | 104.1 | ||||||
| Stockholders’ equity: |
||||||||
| Common stock, 71.6 and 68.9 shares outstanding at December 31, 2015 and June 30, 2015 respectively |
0.7 | 0.7 | ||||||
| Additional paid-in capital |
847.8 | 745.4 | ||||||
| Accumulated other comprehensive loss |
(9.1 | ) | (7.0 | ) | ||||
| Accumulated deficit |
(68.6 | ) | (77.0 | ) | ||||
|
|
|
|
|
|||||
| Total stockholders’ equity |
770.8 | 662.1 | ||||||
|
|
|
|
|
|||||
| Total liabilities and stockholders’ equity |
$ | 871.7 | $ | 766.2 | ||||
8
Consolidated Statement of Cash Flows (Unaudited)
| (in millions) | Dec 31, 2015 | Dec 31, 2014 | ||||||
| Cash flows from operating activities: |
||||||||
| Net income |
$ | 57.0 | $ | 40.0 | ||||
| Adjustments to reconcile net income to net cash provided by operating activities: |
||||||||
| Depreciation and amortization |
13.5 | 12.0 | ||||||
| Gain on disposition of assets |
(0.4 | ) | — | |||||
| Share-based compensation expense |
16.3 | 19.0 | ||||||
| Bad debt expense |
14.5 | 14.0 | ||||||
| Deferred income taxes |
29.8 | 1.9 | ||||||
| Unrecognized tax benefits |
1.5 | 1.1 | ||||||
| Excess tax benefit from share-based compensation |
(16.1 | ) | (2.6 | ) | ||||
| Gain on remeasurement of foreign currency |
— | (0.5 | ) | |||||
| Changes in assets and liabilities: |
||||||||
| Prepaid expenses |
2.8 | (0.8 | ) | |||||
| Trade accounts receivable |
(11.1 | ) | (13.9 | ) | ||||
| Other receivables |
(5.3 | ) | (1.6 | ) | ||||
| Inventory |
(4.1 | ) | 3.7 | |||||
| Prepaid taxes |
(28.0 | ) | 8.0 | |||||
| Accounts payable |
(4.1 | ) | (6.2 | ) | ||||
| Accrued liabilities |
(0.5 | ) | (15.2 | ) | ||||
| Deferred revenue |
— | 0.7 | ||||||
|
|
|
|
|
|||||
| Net cash provided by operating activities |
65.8 | 59.6 | ||||||
|
|
|
|
|
|||||
| Cash flows from investing activities: |
||||||||
| Capital expenditures for equipment and leasehold improvements |
(2.1 | ) | (17.5 | ) | ||||
| Restricted cash |
— | (21.6 | ) | |||||
| Purchases of marketable investment securities |
(100.7 | ) | (22.6 | ) | ||||
| Proceeds from maturities and sales marketable investment securities |
71.3 | 80.5 | ||||||
|
|
|
|
|
|||||
| Net cash provided by (used in) investing activities |
(31.5 | ) | 18.8 | |||||
|
|
|
|
|
|||||
| Cash flows from financing activities: |
||||||||
| Net proceeds from common stock issued under share-based compensation plans |
84.9 | 20.2 | ||||||
| Excess tax benefit from share-based compensation |
16.1 | 2.6 | ||||||
| Repurchase and retirement of common stock |
(62.9 | ) | (103.9 | ) | ||||
|
|
|
|
|
|||||
| Net cash provided by (used in) financing activities |
38.1 | (81.1 | ) | |||||
|
|
|
|
|
|||||
| Effect of Foreign exchange rates on cash and cash equivalents |
(1.8 | ) | (2.4 | ) | ||||
| Net increase (decrease) in cash and cash equivalents |
70.6 | (5.1 | ) | |||||
| Cash and cash equivalents at beginning of year |
64.1 | 64.8 | ||||||
|
|
|
|
|
|||||
| Cash and cash equivalents at end of period |
$ | 134.7 | $ | 59.7 | ||||
|
|
|
|
|
|||||
9
Safe Harbor Statement
This press release contains “forward-looking statements” within the meaning of the Private Securities Litigation Reform Act of 1995, including statements relating to the strength of our first half of fiscal year 2016 and our position and ability to deliver upon our financial guidance for the full year; the strides made by our new products towards broader market adoption and reimbursement on a worldwide basis; the expansion of our companion diagnostic portfolio, with the addition of two new tests, and expansion of our pharmaceutical company collaborations; remaining on track to achieve our five year strategic goals; the expectation of revenue growth in France for EndoPredict testing in calendar year 2016; the Company’s fiscal third-quarter 2016 and fiscal full-year 2016 financial guidance under the caption “Fiscal Third-Quarter and Fiscal Full-Year 2016 Financial Guidance”; and the Company’s strategic directives under the caption “About Myriad Genetics.” These “forward-looking statements” are based on management’s current expectations of future events and are subject to a number of risks and uncertainties that could cause actual results to differ materially and adversely from those described or implied in the forward-looking statements. These risks include, but are not limited to: the risk that sales and profit margins of our existing molecular diagnostic tests and pharmaceutical and clinical services may decline or will not continue to increase at historical rates; risks related to our ability to transition from our existing product portfolio to our new tests; risks related to changes in the governmental or private insurers’ reimbursement levels for our tests or our ability to obtain reimbursement for our new tests at comparable levels to our existing tests; risks related to increased competition and the development of new competing tests and services; the risk that we may be unable to develop or achieve commercial success for additional molecular diagnostic tests and pharmaceutical and clinical services in a timely manner, or at all; the risk that we may not successfully develop new markets for our molecular diagnostic tests and pharmaceutical and clinical services, including our ability to successfully generate revenue outside the United States; the risk that licenses to the technology underlying our molecular diagnostic tests and pharmaceutical and clinical services tests and any future tests are terminated or cannot be maintained on satisfactory terms; risks related to delays or other problems with operating our laboratory testing facilities; risks related to public concern over our genetic testing in general or our tests in particular; risks related to regulatory requirements or enforcement in the United States and foreign countries and changes in the structure of the healthcare system or healthcare payment systems; risks related to our ability to obtain new corporate collaborations or licenses and acquire new technologies or businesses on satisfactory terms, if at all; risks related to our ability to successfully integrate and derive benefits from any technologies or businesses that we license or acquire, including but not limited to our acquisition of a healthcare clinic in Germany; risks related to our projections about the potential market opportunity for our products; the risk that we or our licensors may
10
be unable to protect or that third parties will infringe the proprietary technologies underlying our tests; the risk of patent-infringement claims or challenges to the validity of our patents; risks related to changes in intellectual property laws covering our molecular diagnostic tests and pharmaceutical and clinical services and patents or enforcement in the United States and foreign countries, such as the Supreme Court decision in the lawsuit brought against us by the Association for Molecular Pathology et al; risks of new, changing and competitive technologies and regulations in the United States and internationally; and other factors discussed under the heading “Risk Factors” contained in Item 1A of our Annual report on Form 10-K for the fiscal year ended June 30, 2015, which has been filed with the Securities and Exchange Commission, as well as any updates to those risk factors filed from time to time in our Quarterly Reports on Form 10-Q or Current Reports on Form 8-K.
Statement regarding use of non-GAAP financial measures
In this press release, the Company’s financial results and financial guidance are provided in accordance with accounting principles generally accepted in the United States (GAAP) and using certain non-GAAP financial measures. Management believes that presentation of operating results using non-GAAP financial measures provides useful supplemental information to investors and facilitates the analysis of the Company’s core operating results and comparison of operating results across reporting periods. Management also uses non-GAAP financial measures to establish budgets and to manage the Company’s business. A reconciliation of the GAAP financial results to non-GAAP financial results is included in the attached financial statements.
Following is a description of the adjustments made to GAAP financial measures:
| • | Acquisition - amortization of intangible assets: Represents recurring amortization charges resulting from the acquisition of intangible assets, including developed technology and database rights. |
| • | Severance – executive severance: Represents one-time severance expenses associated with the departure of executive officers of Myriad Genetics, Inc. |
The Company encourages investors to carefully consider its results under GAAP, as well as its supplemental non-GAAP information and the reconciliation between these presentations, to more fully understand its business. Non-GAAP financial results are reported in addition to, and not as a substitute for, or superior to, financial measures calculated in accordance with GAAP.
11
Reconciliation of GAAP to Non-GAAP Financial Measures
for the Three and Six Months ended December 31, 2015 and 2014
(Unaudited data in millions, except per share amount)
| Three Months Ended | Six Months Ended | |||||||||||||||
| Dec. 31, 2015 | Dec. 31, 2014 | Dec. 31, 2015 | Dec. 31, 2014 | |||||||||||||
| GAAP Cost of molecular diagnostic testing |
$ | 34.1 | $ | 35.1 | $ | 65.0 | $ | 67.8 | ||||||||
| GAAP Cost of pharmaceutical and clinical services |
6.5 | 2.8 | 12.1 | 4.9 | ||||||||||||
| Acquisition - amortization of intangible assets |
— | — | — | — | ||||||||||||
|
|
|
|
|
|
|
|
|
|||||||||
| Non-GAAP COGS |
$ | 40.6 | $ | 37.9 | $ | 77.1 | $ | 72.7 | ||||||||
| Non-GAAP Gross Margin |
79 | % | 79 | % | 80 | % | 79 | % | ||||||||
| GAAP Research and Development |
$ | 16.7 | $ | 17.5 | $ | 33.9 | $ | 40.1 | ||||||||
| Acquisition - amortization of intangible assets |
(0.1 | ) | (0.1 | ) | (0.2 | ) | (0.2 | ) | ||||||||
|
|
|
|
|
|
|
|
|
|||||||||
| Non-GAAP R&D |
$ | 16.6 | $ | 17.4 | $ | 33.7 | $ | 39.9 | ||||||||
| GAAP Selling, General and Administrative |
$ | 90.8 | $ | 92.7 | $ | 177.3 | $ | 178.1 | ||||||||
| Severance - executive severance |
— | (4.3 | ) | — | (4.3 | ) | ||||||||||
| Acquisition - amortization of intangible assets |
(3.1 | ) | (3.1 | ) | (6.2 | ) | (6.1 | ) | ||||||||
|
|
|
|
|
|
|
|
|
|||||||||
| Non-GAAP SG&A |
$ | 87.7 | $ | 85.3 | $ | 171.1 | $ | 167.7 | ||||||||
| GAAP Operating Income |
$ | 45.2 | $ | 36.3 | $ | 88.5 | $ | 62.3 | ||||||||
| Severance - executive severance |
— | 4.3 | — | 4.3 | ||||||||||||
| Acquisition - amortization of intangible assets |
3.2 | 3.2 | 6.4 | 6.3 | ||||||||||||
|
|
|
|
|
|
|
|
|
|||||||||
| Non-GAAP Operating Income |
$ | 48.4 | $ | 43.8 | $ | 94.9 | $ | 72.9 | ||||||||
| Non-GAAP Operating Margin |
25 | % | 24 | % | 25 | % | 21 | % | ||||||||
| GAAP Net Income |
$ | 30.3 | $ | 24.0 | $ | 57.0 | $ | 40.0 | ||||||||
| Severance - executive severance |
— | 4.3 | — | 4.3 | ||||||||||||
| Acquisition - amortization of intangible assets |
3.2 | 3.2 | 6.4 | 6.3 | ||||||||||||
| Tax expense associated with non-GAAP adjustments |
— | (1.6 | ) | — | (1.6 | ) | ||||||||||
|
|
|
|
|
|
|
|
|
|||||||||
| Non-GAAP Net Income |
$ | 33.5 | $ | 29.9 | $ | 63.4 | $ | 49.0 | ||||||||
| GAAP Diluted EPS |
$ | 0.41 | $ | 0.32 | $ | 0.78 | $ | 0.53 | ||||||||
| Non-GAAP Diluted EPS |
$ | 0.45 | $ | 0.40 | $ | 0.87 | $ | 0.65 | ||||||||
| Diluted shares outstanding |
73.8 | 75.4 | 73.1 | 75.8 | ||||||||||||
12
Free Cash Flow Reconciliation
(Unaudited data in thousands)
| Three Months Ended | Six Months Ended | |||||||||||||||
| Dec. 31, 2015 | Dec. 31, 2014 | Dec. 31, 2015 | Dec. 31, 2014 | |||||||||||||
| GAAP cash flow from operations |
$ | 40.9 | $ | 52.6 | $ | 65.8 | $ | 59.6 | ||||||||
| Capital expenditures |
(1.1 | ) | (5.9 | ) | (2.1 | ) | (17.5 | ) | ||||||||
|
|
|
|
|
|
|
|
|
|||||||||
| Free cash flow |
$ | 39.8 | $ | 46.7 | $ | 63.7 | $ | 42.1 | ||||||||
|
|
|
|
|
|
|
|
|
|||||||||
Reconciliation of GAAP to Non-GAAP for Fiscal Year 2016 and Fiscal Second-Quarter 2016 Financial Guidance
The Company’s future performance and financial results are subject to risks and uncertainties, and actual results could differ materially from guidance set forth below. Some of the factors that could affect the Company’s financial results are stated in the safe harbor statement of this press release. More information on potential factors that could affect the Company’s financial results are included under the heading “Risk Factors” contained in Item 1A in the Company’s most recent Annual Report on Form 10-K filed with the Securities and Exchange Commission, as well as any updates to those risk factors filed from time to time in the Company’s Quarterly Reports on Form 10-Q or Current Reports on Form 8-K.
| Fiscal Year 2016 | ||||
| Diluted net income per share |
||||
| GAAP diluted net income per share |
$ | 1.48 - $1.53 | ||
| Acquisition - amortization of intangible assets |
0.15 | |||
|
|
|
|||
| Non-GAAP diluted net income per share |
$ | 1.63 - $1.68 | ||
|
|
|
|||
| Fiscal Third-Quarter 2016 |
||||
| Diluted net income per share |
||||
| GAAP diluted net income per share |
$ | 0.33 - $0.35 | ||
| Acquisition - amortization of intangible assets |
0.04 | |||
|
|
|
|||
| Non-GAAP diluted net income per share |
$ | 0.37 - $0.39 | ||
|
|
|
|||
13
Myriad Genetics Fiscal Second Quarter 2016 Earnings Call 02/02/2016 Exhibit 99.2
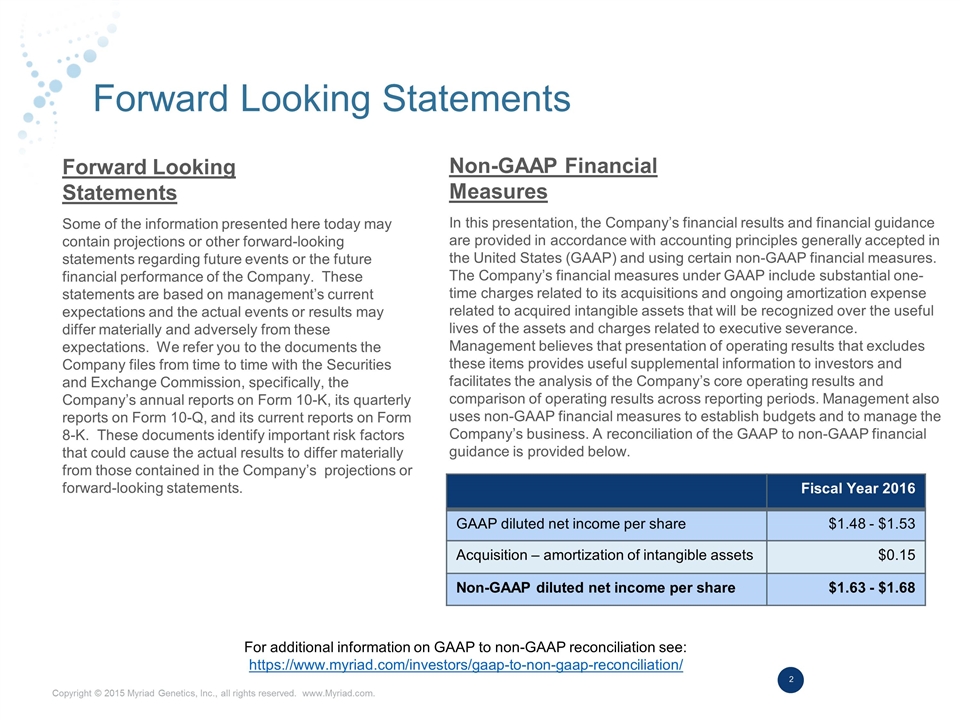
Forward Looking Statements Some of the information presented here today may contain projections or other forward-looking statements regarding future events or the future financial performance of the Company. These statements are based on management’s current expectations and the actual events or results may differ materially and adversely from these expectations. We refer you to the documents the Company files from time to time with the Securities and Exchange Commission, specifically, the Company’s annual reports on Form 10-K, its quarterly reports on Form 10-Q, and its current reports on Form 8-K. These documents identify important risk factors that could cause the actual results to differ materially from those contained in the Company’s projections or forward-looking statements. In this presentation, the Company’s financial results and financial guidance are provided in accordance with accounting principles generally accepted in the United States (GAAP) and using certain non-GAAP financial measures. The Company’s financial measures under GAAP include substantial one-time charges related to its acquisitions and ongoing amortization expense related to acquired intangible assets that will be recognized over the useful lives of the assets and charges related to executive severance. Management believes that presentation of operating results that excludes these items provides useful supplemental information to investors and facilitates the analysis of the Company’s core operating results and comparison of operating results across reporting periods. Management also uses non-GAAP financial measures to establish budgets and to manage the Company’s business. A reconciliation of the GAAP to non-GAAP financial guidance is provided below. Forward Looking Statements Non-GAAP Financial Measures Fiscal Year 2016 GAAP diluted net income per share $1.48 - $1.53 Acquisition – amortization of intangible assets $0.15 Non-GAAP diluted net income per share $1.63 - $1.68 For additional information on GAAP to non-GAAP reconciliation see: https://www.myriad.com/investors/gaap-to-non-gaap-reconciliation/
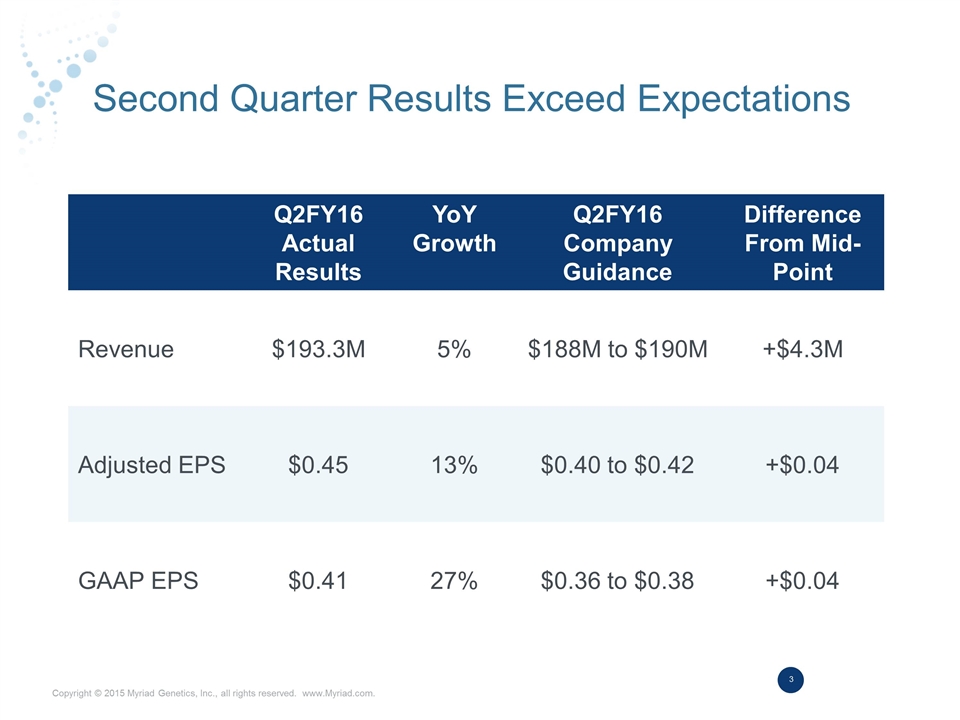
Second Quarter Results Exceed Expectations Q2FY16 Actual Results YoY Growth Q2FY16 Company Guidance Difference From Mid-Point Revenue $193.3M 5% $188M to $190M +$4.3M Adjusted EPS $0.45 13% $0.40 to $0.42 +$0.04 GAAP EPS $0.41 27% $0.36 to $0.38 +$0.04
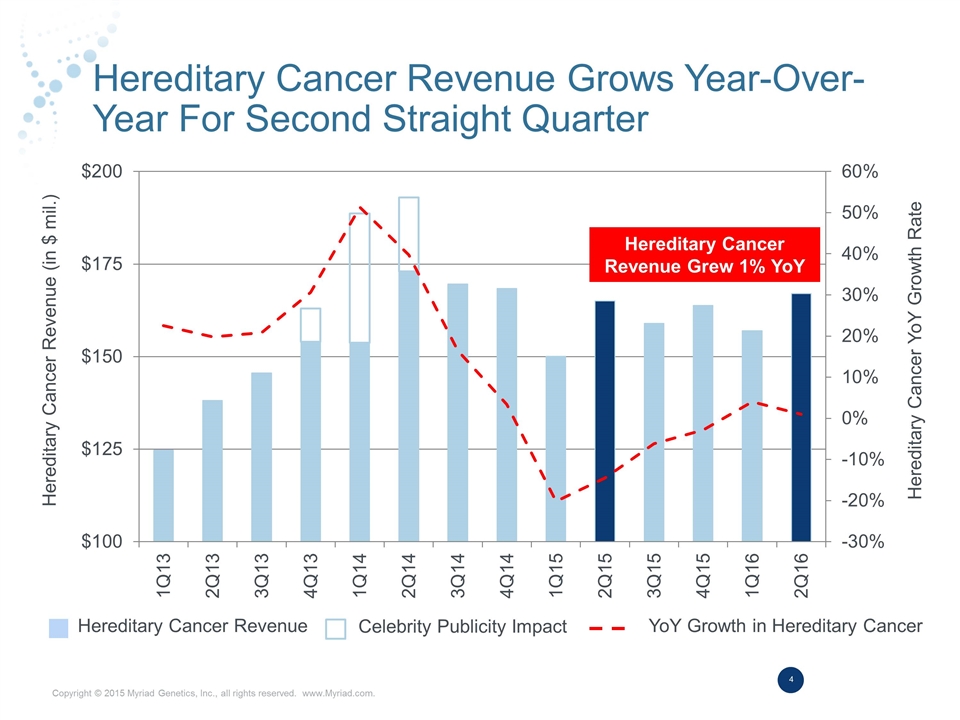
Hereditary Cancer Revenue Grows Year-Over-Year For Second Straight Quarter Hereditary Cancer Revenue Grew 1% YoY Hereditary Cancer Revenue Celebrity Publicity Impact YoY Growth in Hereditary Cancer Hereditary Cancer Revenue (in $ mil.) Hereditary Cancer YoY Growth Rate
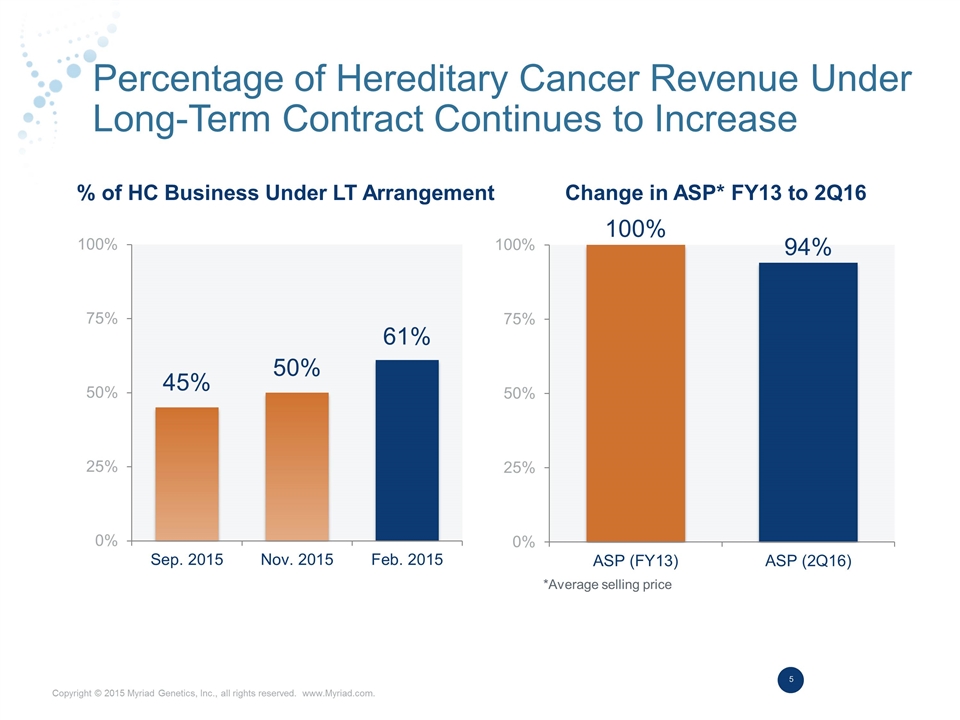
Percentage of Hereditary Cancer Revenue Under Long-Term Contract Continues to Increase % of HC Business Under LT Arrangement Change in ASP* FY13 to 2Q16 *Average selling price
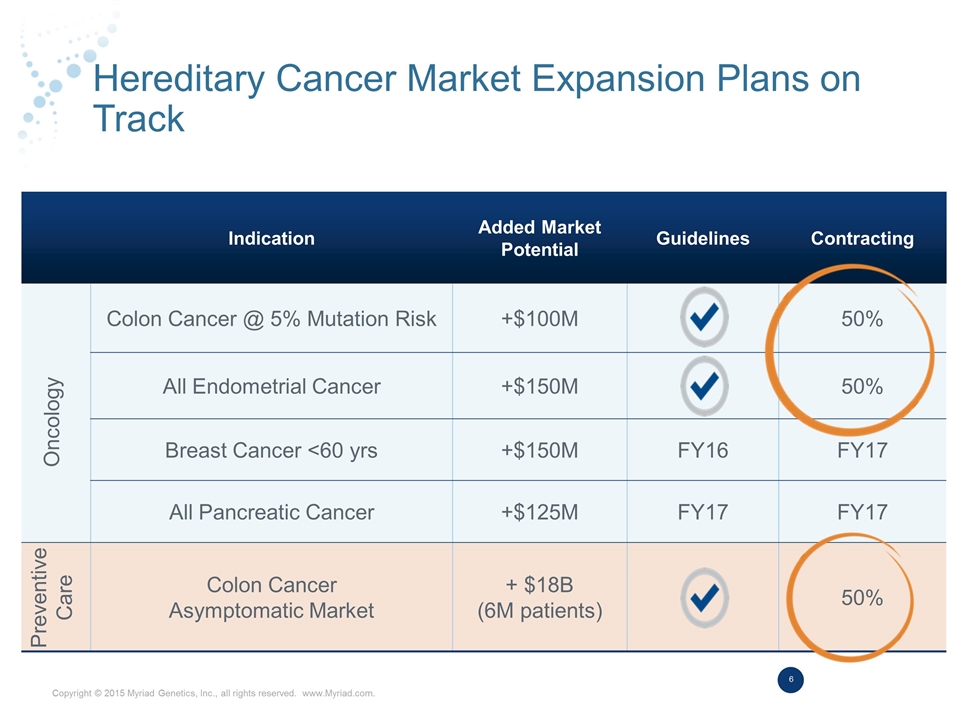
Hereditary Cancer Market Expansion Plans on Track Indication Added Market Potential Guidelines Contracting Colon Cancer @ 5% Mutation Risk +$100M 50% All Endometrial Cancer +$150M 50% Breast Cancer <60 yrs +$150M FY16 FY17 All Pancreatic Cancer +$125M FY17 FY17 Colon Cancer Asymptomatic Market + $18B (6M patients) 50% Oncology Preventive Care
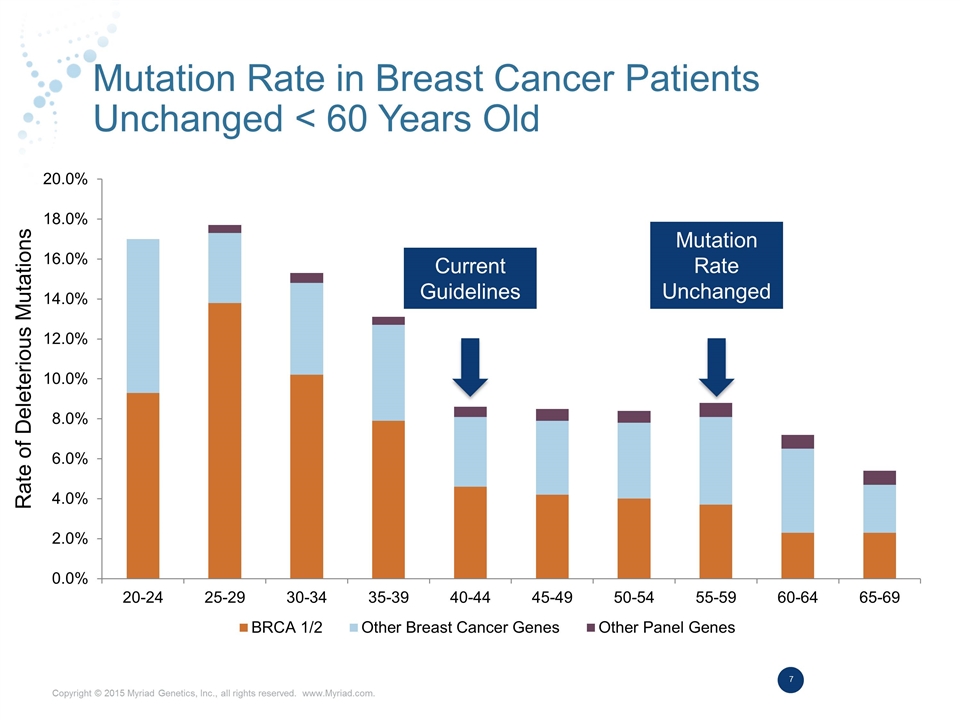
Mutation Rate in Breast Cancer Patients Unchanged < 60 Years Old Current Guidelines Rate of Deleterious Mutations Mutation Rate Unchanged
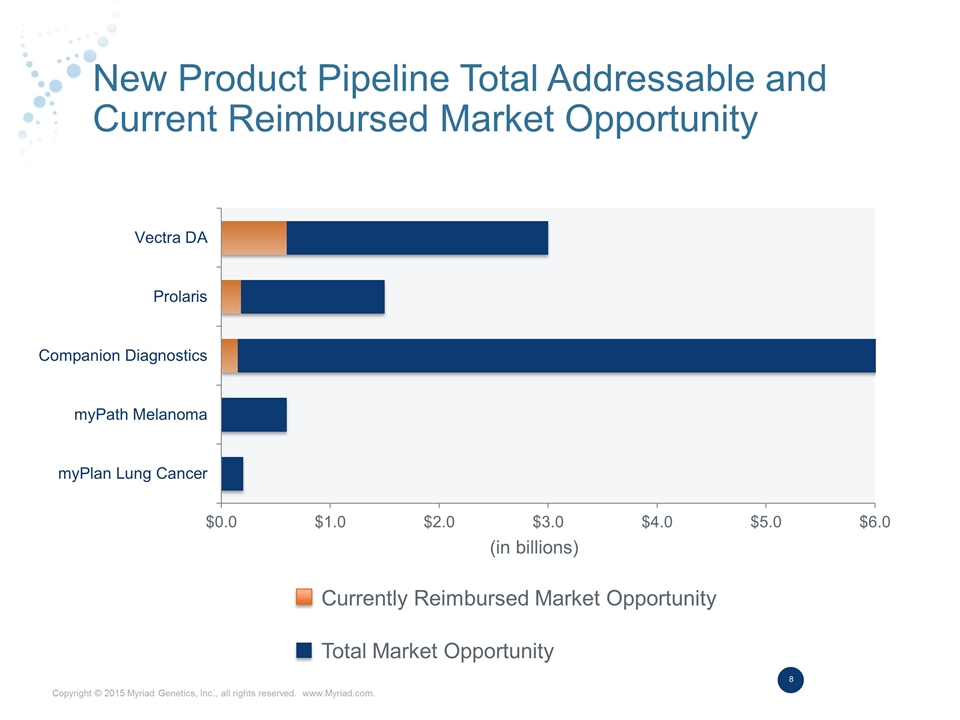
New Product Pipeline Total Addressable and Current Reimbursed Market Opportunity Currently Reimbursed Market Opportunity Total Market Opportunity (in billions)
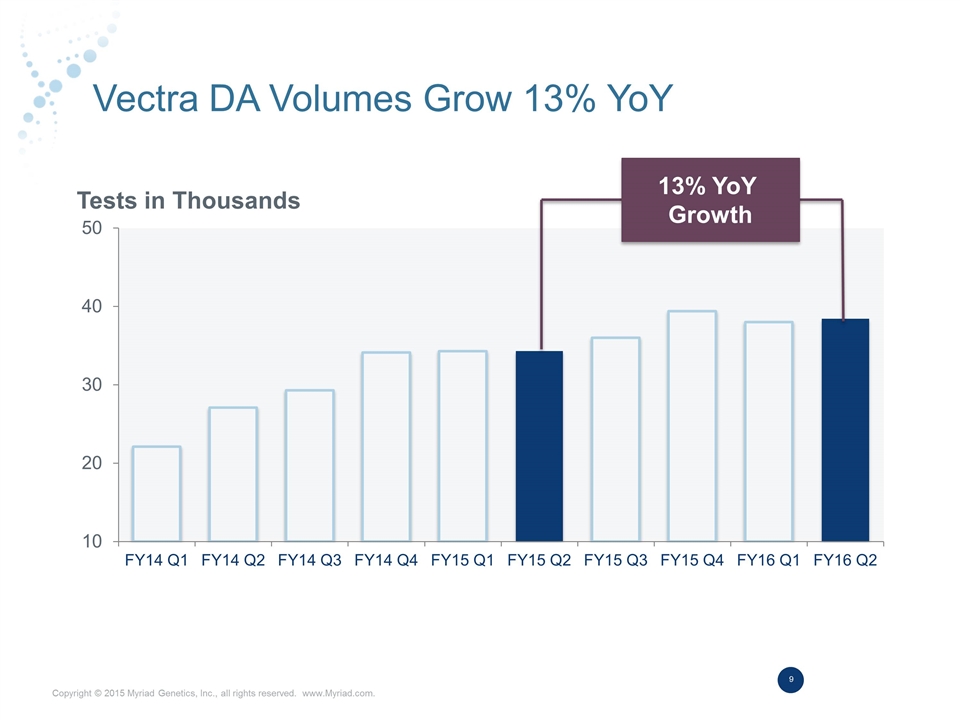
Vectra DA Volumes Grow 13% YoY Tests in Thousands 13% YoY Growth
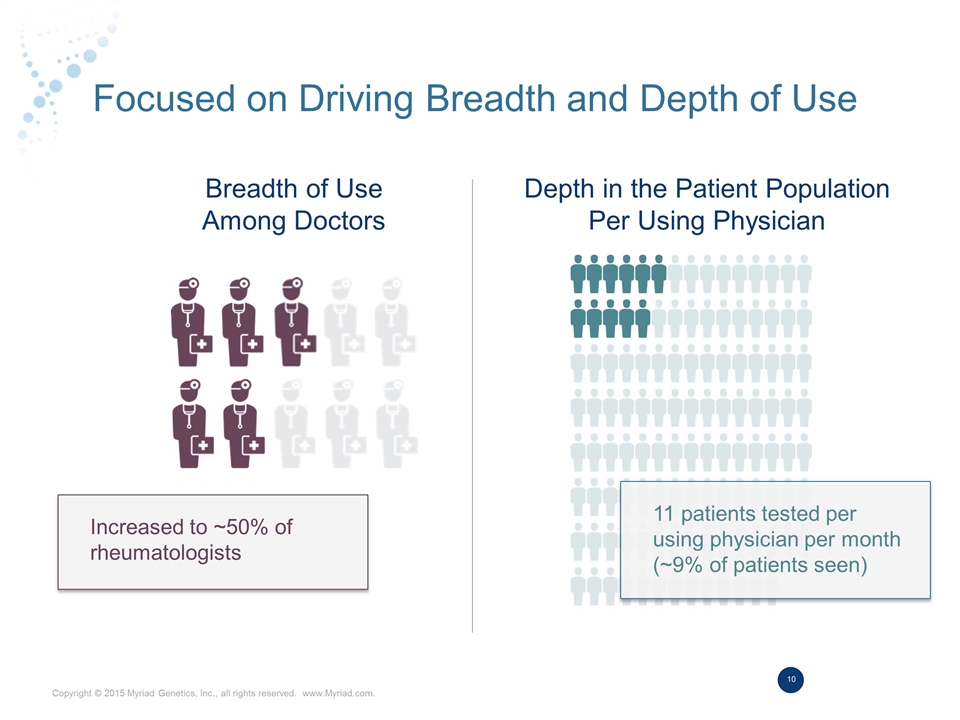
Focused on Driving Breadth and Depth of Use Breadth of Use Among Doctors Depth in the Patient Population Per Using Physician 11 patients tested per using physician per month (~9% of patients seen) Increased to ~50% of rheumatologists
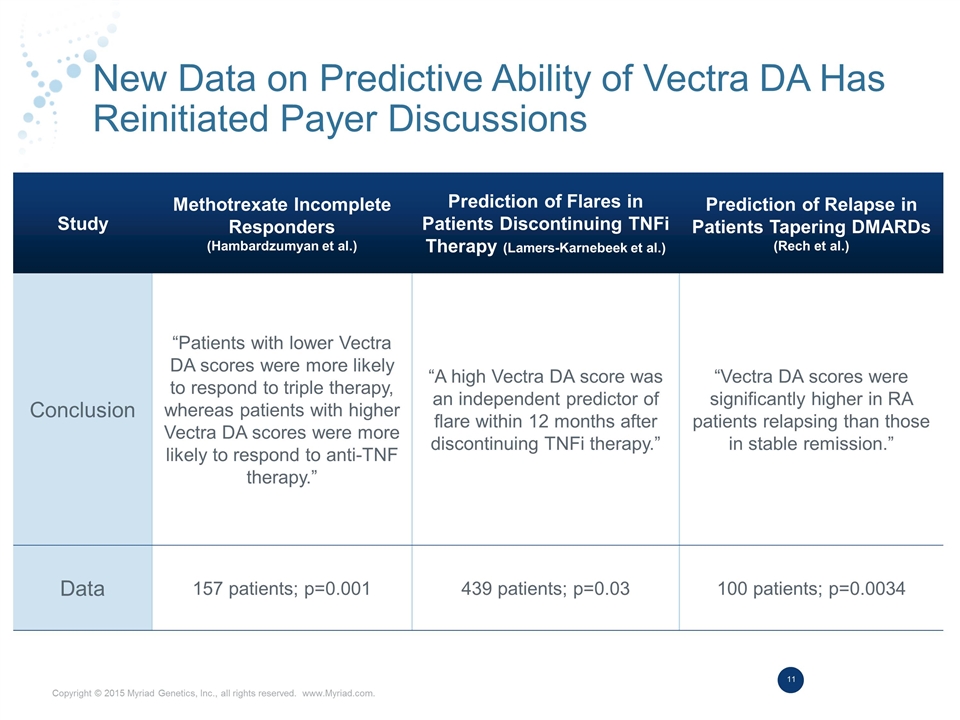
New Data on Predictive Ability of Vectra DA Has Reinitiated Payer Discussions Study Methotrexate Incomplete Responders (Hambardzumyan et al.) Prediction of Flares in Patients Discontinuing TNFi Therapy (Lamers-Karnebeek et al.) Prediction of Relapse in Patients Tapering DMARDs (Rech et al.) Conclusion “Patients with lower Vectra DA scores were more likely to respond to triple therapy, whereas patients with higher Vectra DA scores were more likely to respond to anti-TNF therapy.” “A high Vectra DA score was an independent predictor of flare within 12 months after discontinuing TNFi therapy.” “Vectra DA scores were significantly higher in RA patients relapsing than those in stable remission.” Data 157 patients; p=0.001 439 patients; p=0.03 100 patients; p=0.0034
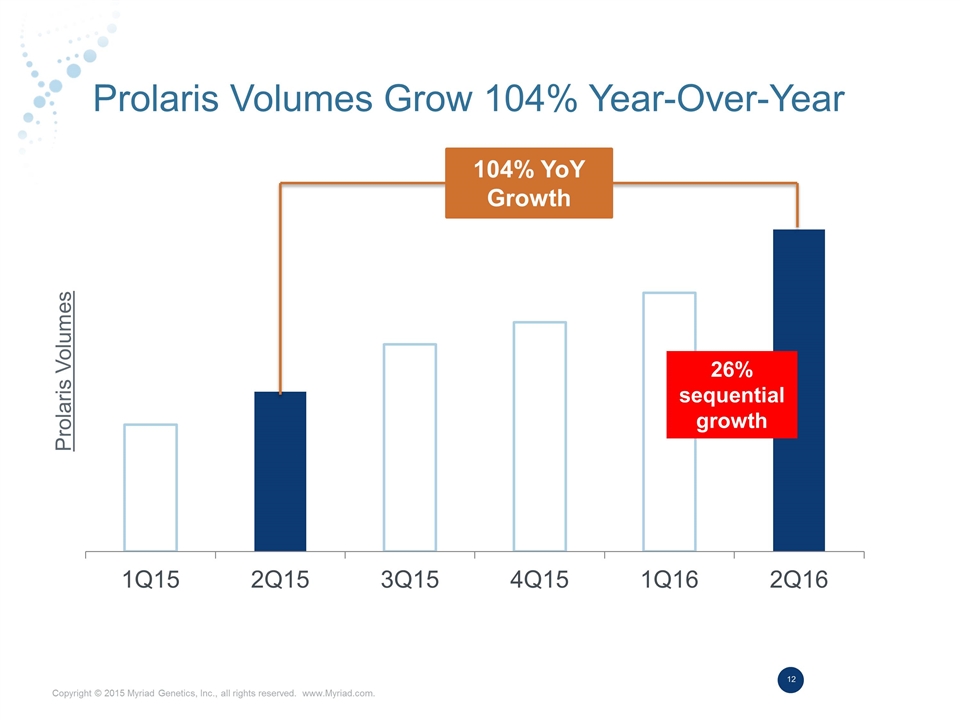
Prolaris Volumes Grow 104% Year-Over-Year Prolaris Volumes 26% sequential growth 104% YoY Growth
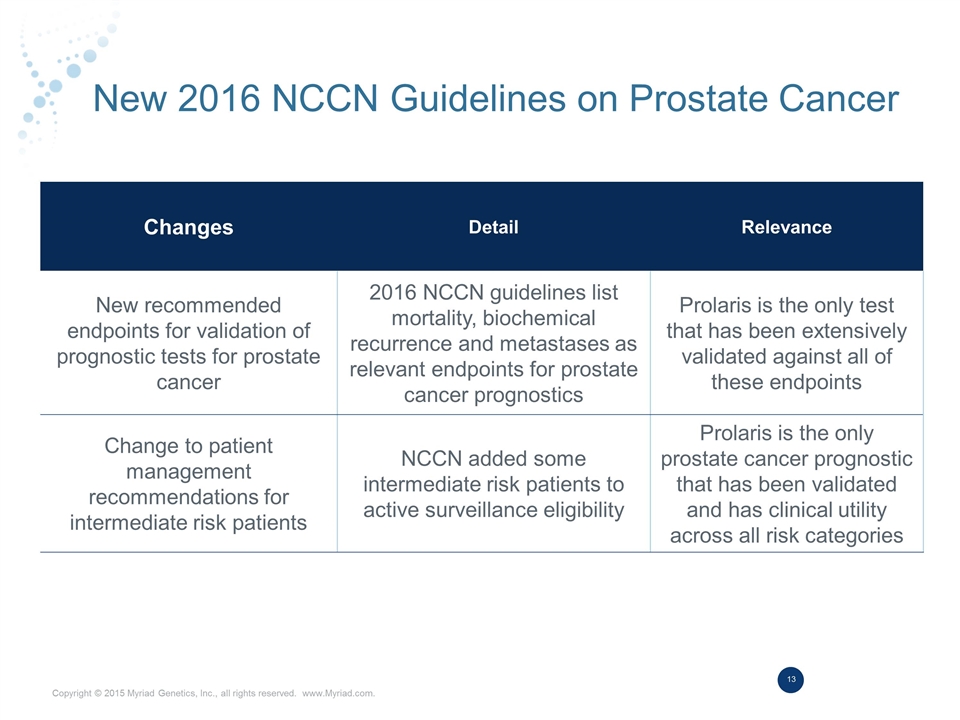
New 2016 NCCN Guidelines on Prostate Cancer Changes Detail Relevance New recommended endpoints for validation of prognostic tests for prostate cancer 2016 NCCN guidelines list mortality, biochemical recurrence and metastases as relevant endpoints for prostate cancer prognostics Prolaris is the only test that has been extensively validated against all of these endpoints Change to patient management recommendations for intermediate risk patients NCCN added some intermediate risk patients to active surveillance eligibility Prolaris is the only prostate cancer prognostic that has been validated and has clinical utility across all risk categories
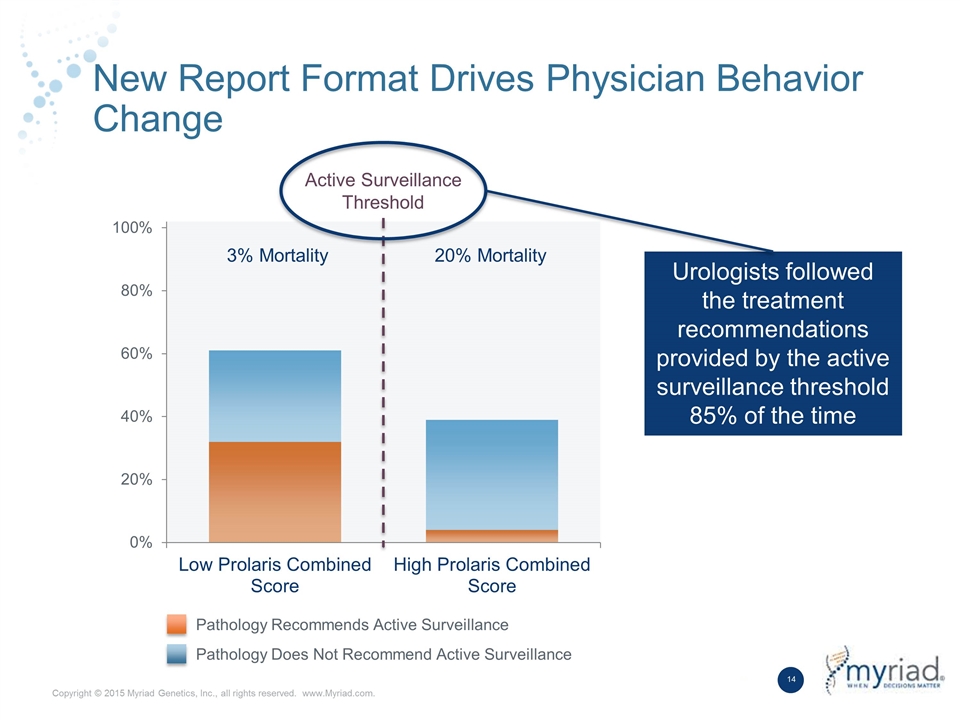
New Report Format Drives Physician Behavior Change Active Surveillance Threshold 3% Mortality 20% Mortality Urologists followed the treatment recommendations provided by the active surveillance threshold 85% of the time Pathology Recommends Active Surveillance Pathology Does Not Recommend Active Surveillance
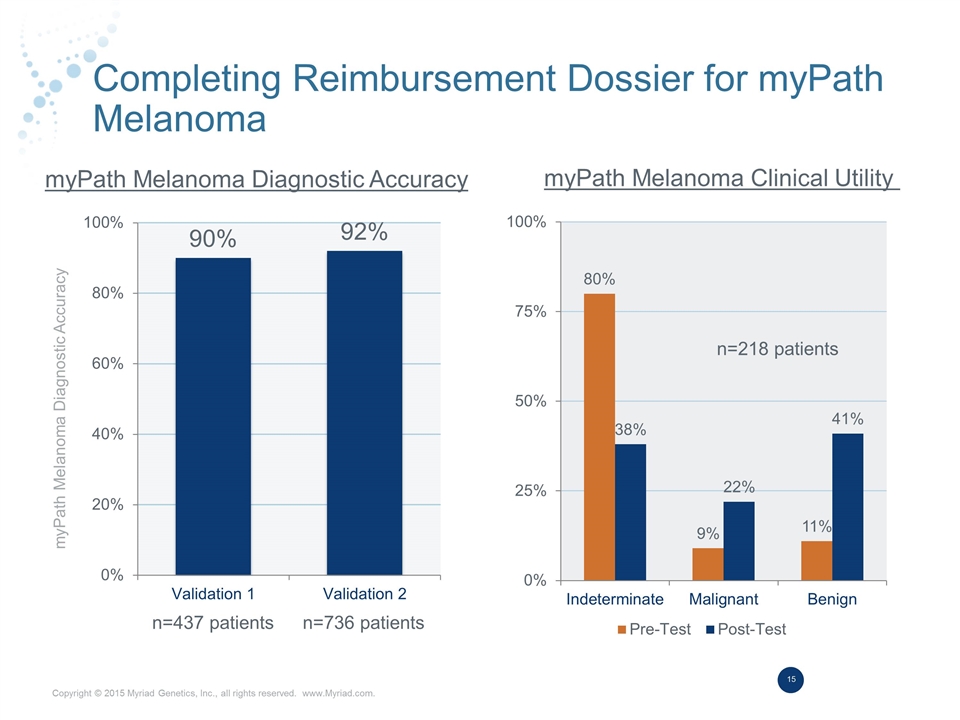
Completing Reimbursement Dossier for myPath Melanoma myPath Melanoma Diagnostic Accuracy myPath Melanoma Diagnostic Accuracy myPath Melanoma Clinical Utility n=437 patients n=736 patients n=218 patients
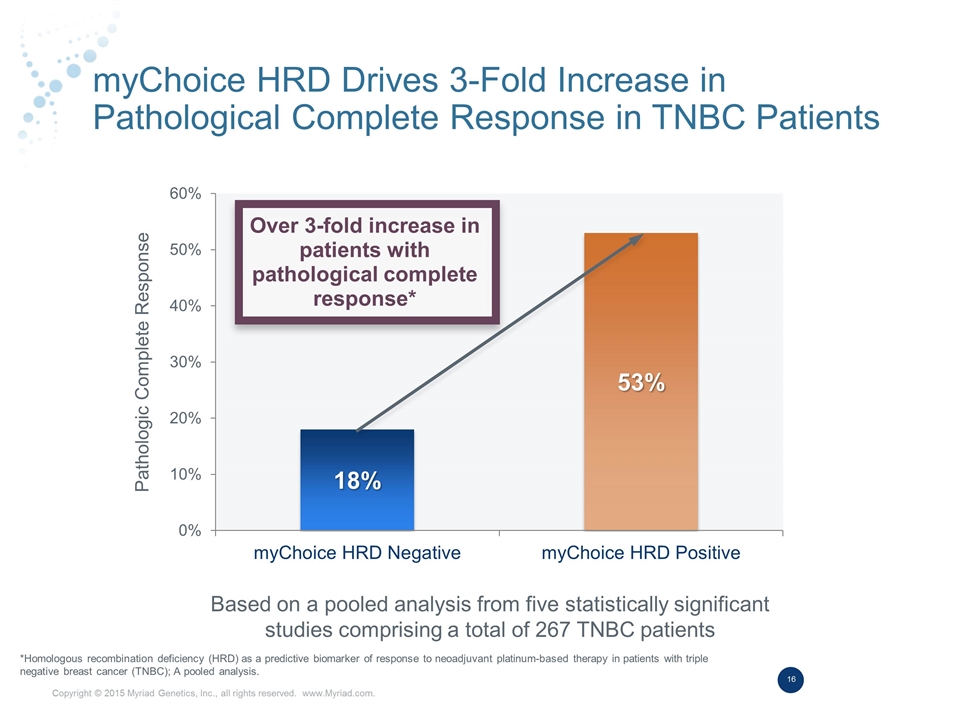
myChoice HRD Drives 3-Fold Increase in Pathological Complete Response in TNBC Patients Based on a pooled analysis from five statistically significant studies comprising a total of 267 TNBC patients Over 3-fold increase in patients with pathological complete response* Pathologic Complete Response *Homologous recombination deficiency (HRD) as a predictive biomarker of response to neoadjuvant platinum-based therapy in patients with triple negative breast cancer (TNBC); A pooled analysis.
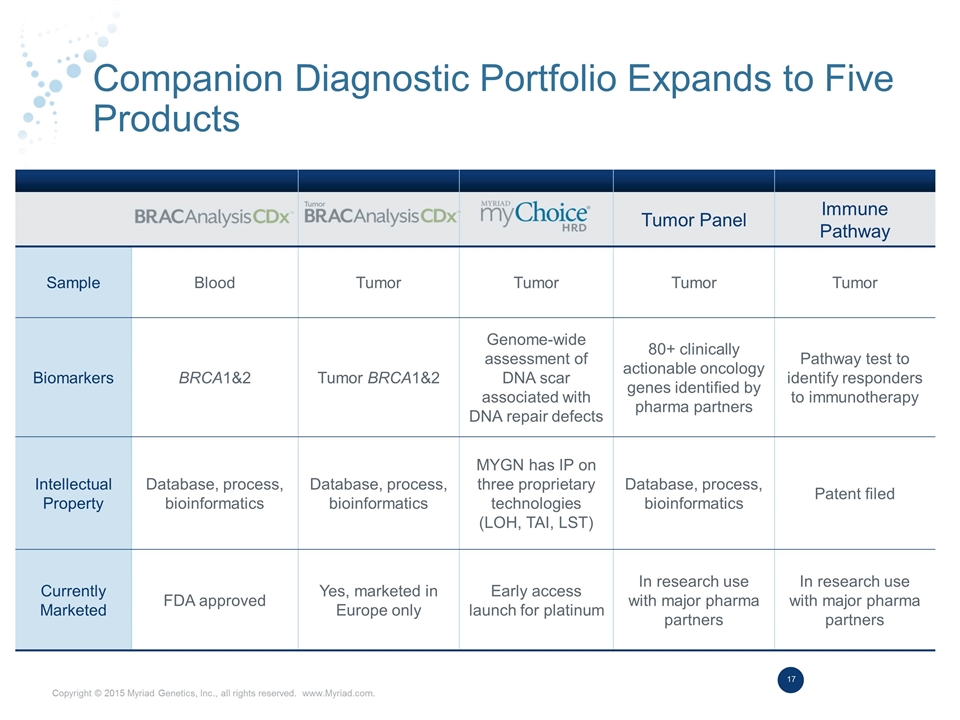
Companion Diagnostic Portfolio Expands to Five Products Tumor Panel Immune Pathway Sample Blood Tumor Tumor Tumor Tumor Biomarkers BRCA1&2 Tumor BRCA1&2 Genome-wide assessment of DNA scar associated with DNA repair defects 80+ clinically actionable oncology genes identified by pharma partners Pathway test to identify responders to immunotherapy Intellectual Property Database, process, bioinformatics Database, process, bioinformatics MYGN has IP on three proprietary technologies (LOH, TAI, LST) Database, process, bioinformatics Patent filed Currently Marketed FDA approved Yes, marketed in Europe only Early access launch for platinum In research use with major pharma partners In research use with major pharma partners
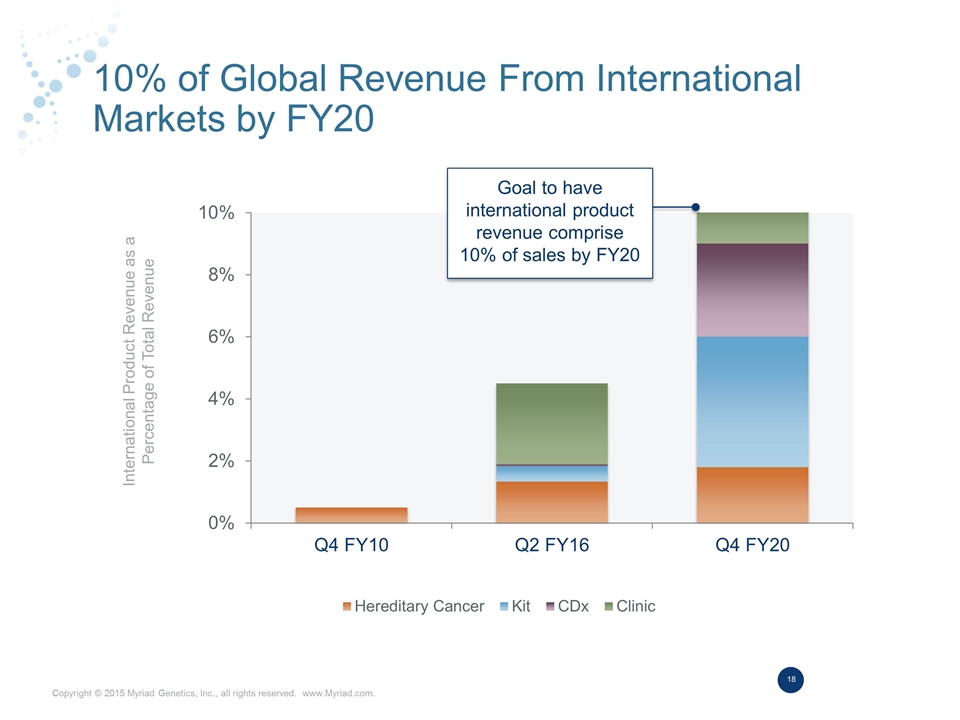
10% of Global Revenue From International Markets by FY20 International Product Revenue as a Percentage of Total Revenue Goal to have international product revenue comprise 10% of sales by FY20
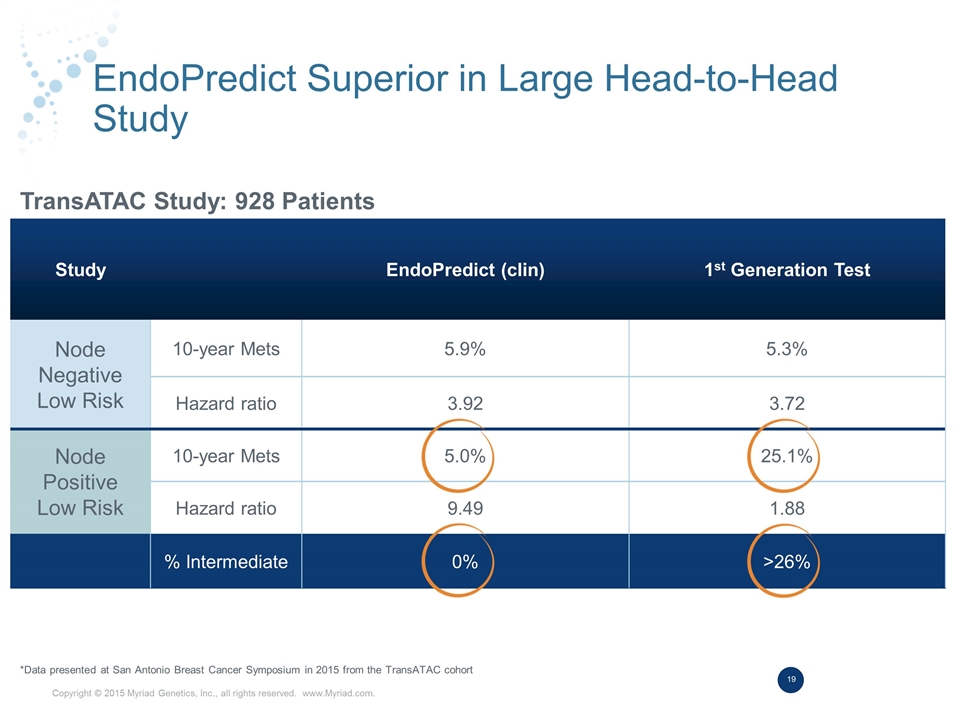
EndoPredict Superior in Large Head-to-Head Study *Data presented at San Antonio Breast Cancer Symposium in 2015 from the TransATAC cohort Study EndoPredict (clin) 1st Generation Test Node Negative Low Risk 10-year Mets 5.9% 5.3% Hazard ratio 3.92 3.72 Node Positive Low Risk 10-year Mets 5.0% 25.1% Hazard ratio 9.49 1.88 % Intermediate 0% >26% TransATAC Study: 928 Patients
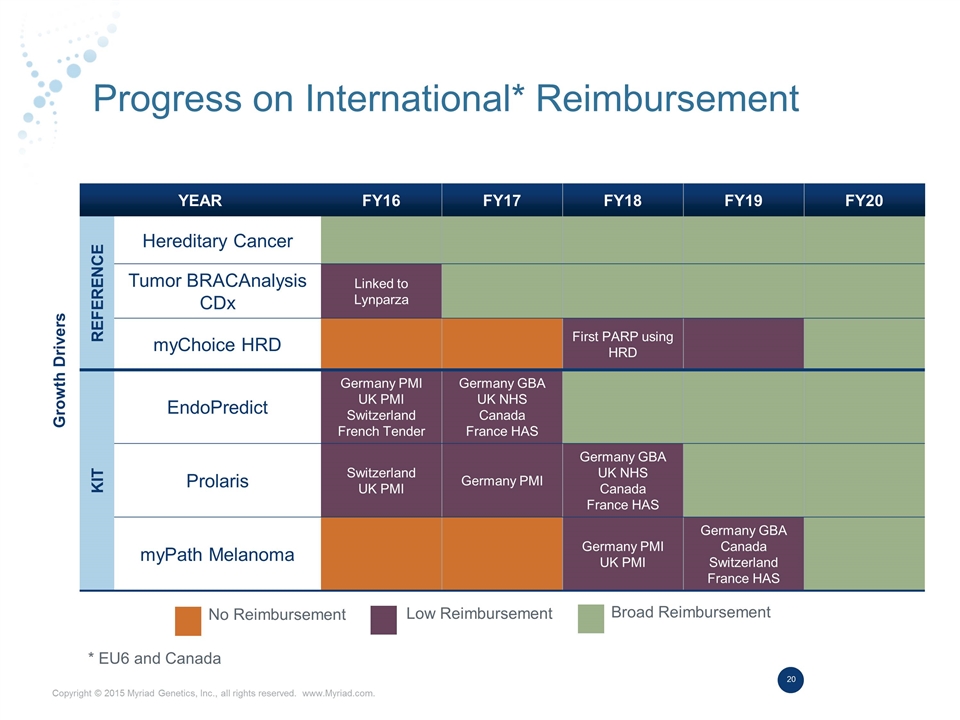
Progress on International* Reimbursement Growth Drivers YEAR FY16 FY17 FY18 FY19 FY20 Reference Hereditary Cancer Tumor BRACAnalysis CDx Linked to Lynparza myChoice HRD First PARP using HRD KIT EndoPredict Germany PMI UK PMI Switzerland French Tender Germany GBA UK NHS Canada France HAS Prolaris Switzerland UK PMI Germany PMI Germany GBA UK NHS Canada France HAS myPath Melanoma Germany PMI UK PMI Germany GBA Canada Switzerland France HAS No Reimbursement Low Reimbursement Broad Reimbursement * EU6 and Canada
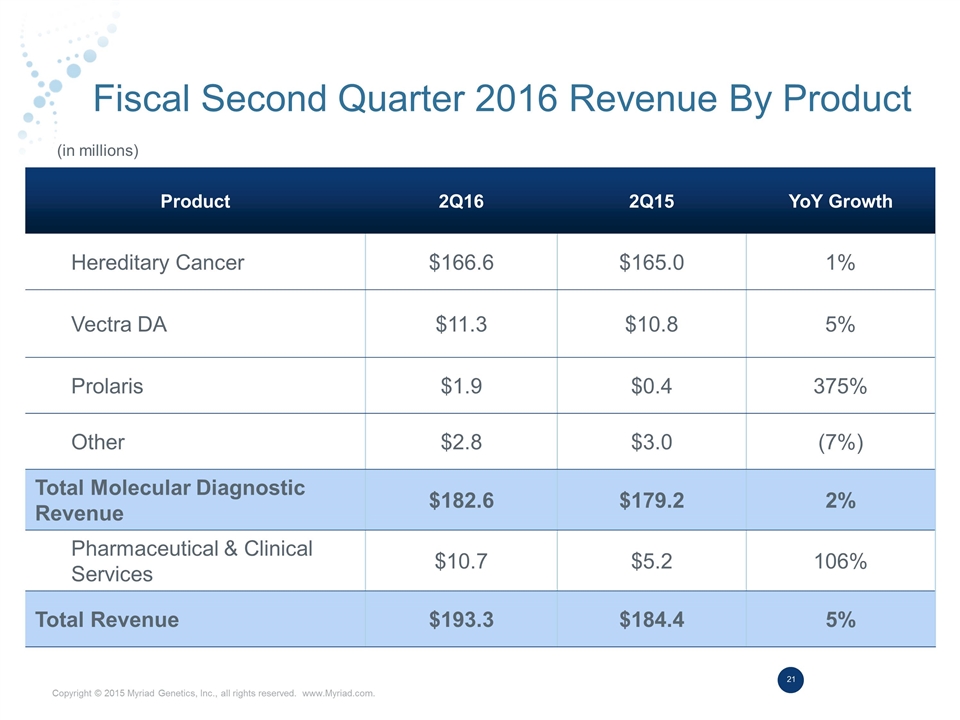
Fiscal Second Quarter 2016 Revenue By Product Product 2Q16 2Q15 YoY Growth Hereditary Cancer $166.6 $165.0 1% Vectra DA $11.3 $10.8 5% Prolaris $1.9 $0.4 375% Other $2.8 $3.0 (7%) Total Molecular Diagnostic Revenue $182.6 $179.2 2% Pharmaceutical & Clinical Services $10.7 $5.2 106% Total Revenue $193.3 $184.4 5% (in millions)
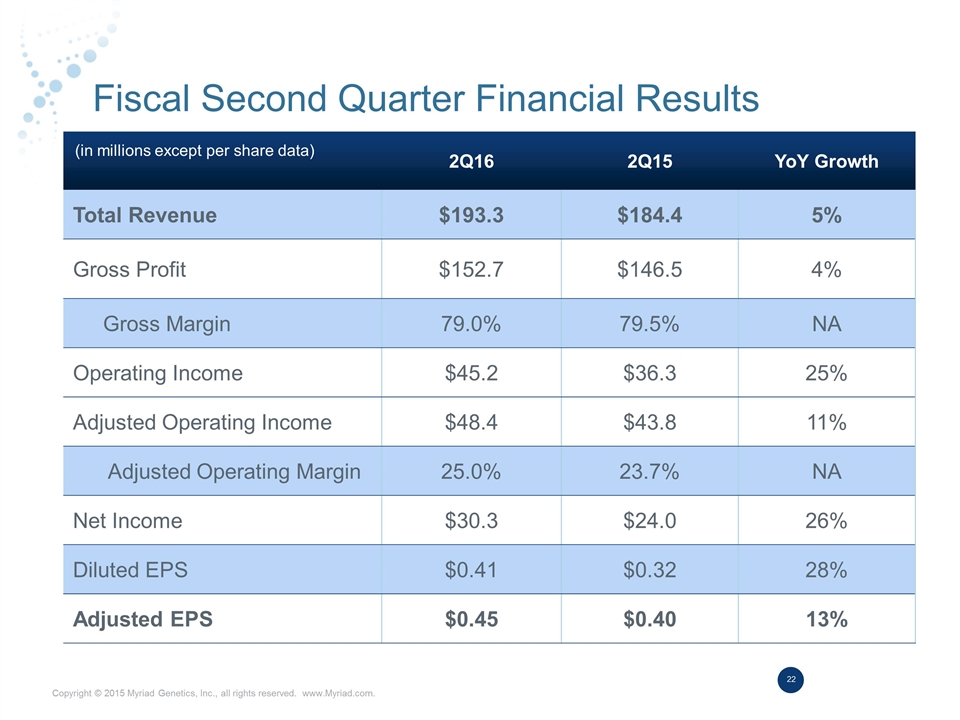
Fiscal Second Quarter Financial Results 2Q16 2Q15 YoY Growth Total Revenue $193.3 $184.4 5% Gross Profit $152.7 $146.5 4% Gross Margin 79.0% 79.5% NA Operating Income $45.2 $36.3 25% Adjusted Operating Income $48.4 $43.8 11% Adjusted Operating Margin 25.0% 23.7% NA Net Income $30.3 $24.0 26% Diluted EPS $0.41 $0.32 28% Adjusted EPS $0.45 $0.40 13% (in millions except per share data)
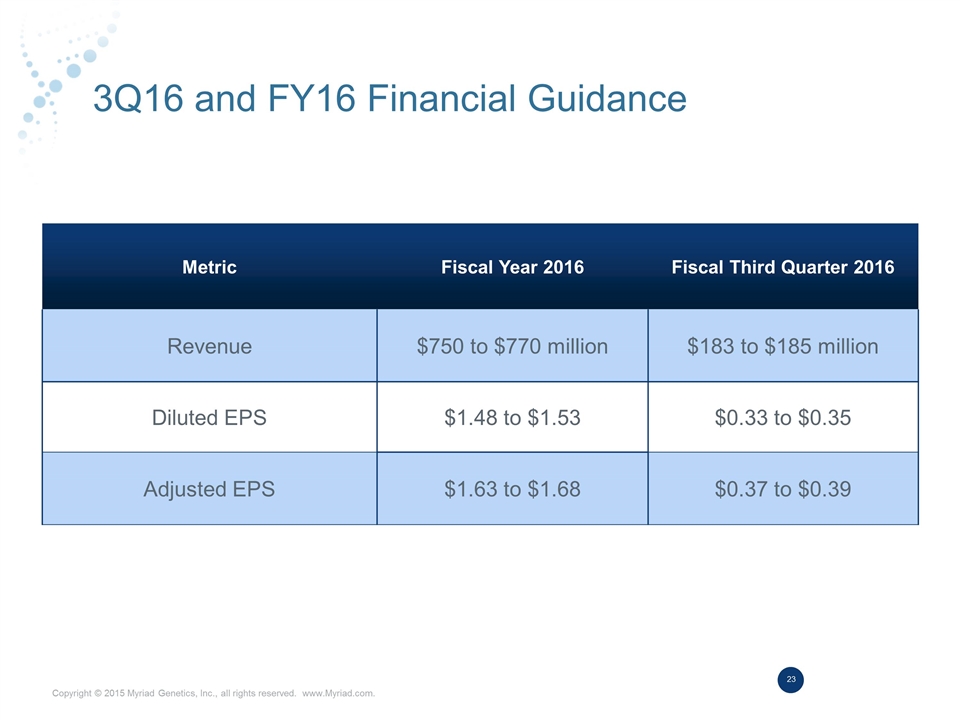
3Q16 and FY16 Financial Guidance Metric Fiscal Year 2016 Fiscal Third Quarter 2016 Revenue $750 to $770 million $183 to $185 million Diluted EPS $1.48 to $1.53 $0.33 to $0.35 Adjusted EPS $1.63 to $1.68 $0.37 to $0.39
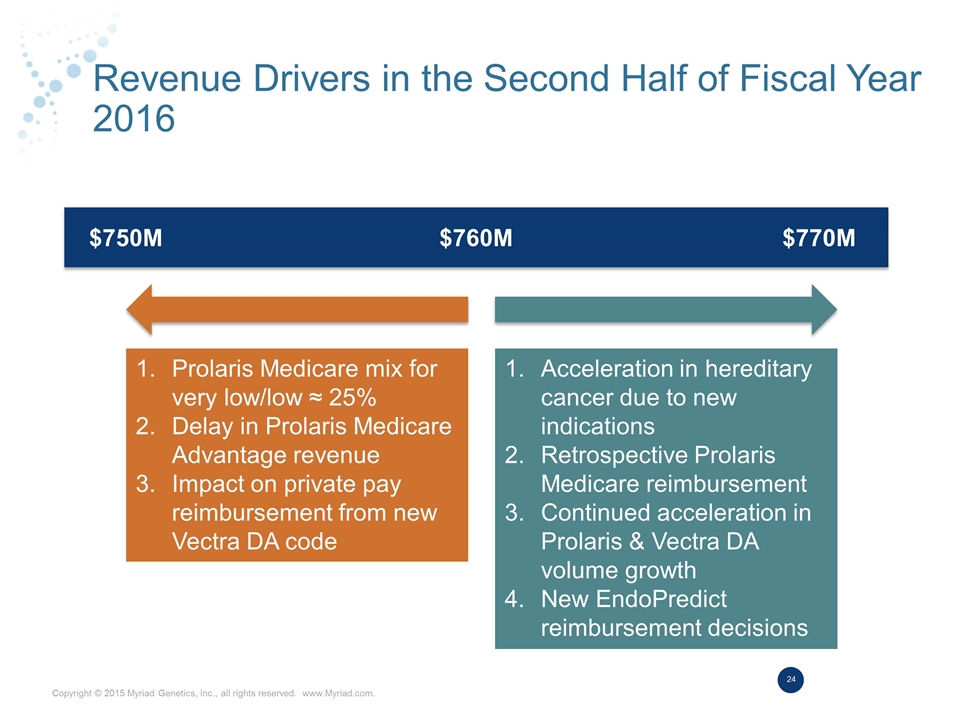
Revenue Drivers in the Second Half of Fiscal Year 2016 $750M $760M $770M Prolaris Medicare mix for very low/low ≈ 25% Delay in Prolaris Medicare Advantage revenue Impact on private pay reimbursement from new Vectra DA code Acceleration in hereditary cancer due to new indications Retrospective Prolaris Medicare reimbursement Continued acceleration in Prolaris & Vectra DA volume growth New EndoPredict reimbursement decisions
Serious News for Serious Traders! Try StreetInsider.com Premium Free!
You May Also Be Interested In
- Myriad Genetics (MYGN) Research Shows Reduction in Hospitalizations for Patients with Depression after GeneSight Testing
- DNA Plc: Change in the Executive Team
- Shuffield Land Clearing & Services Specializes in Land Clearing and Utility Clearing Projects in Central Texas
Create E-mail Alert Related Categories
SEC FilingsSign up for StreetInsider Free!
Receive full access to all new and archived articles, unlimited portfolio tracking, e-mail alerts, custom newswires and RSS feeds - and more!


 Tweet
Tweet Share
Share