

Form 8-K MRC GLOBAL INC. For: Sep 09
 Tweet
Tweet Share
Share
UNITED STATES
SECURITIES AND EXCHANGE COMMISSION
WASHINGTON, D.C. 20549
FORM 8-K
CURRENT REPORT
Pursuant to Section 13 or 15(d)
of the Securities Exchange Act of 1934
Date of Report (Date of earliest event reported): September 9, 2015
MRC GLOBAL INC.
(Exact name of registrant as specified in its charter)
| Delaware | 001-35479 | 20-5956993 | ||
| (State or other jurisdiction of incorporation) |
(Commission File Number) |
(I.R.S. Employer Identification Number) |
2 Houston Center, 909 Fannin, Suite 3100,
Houston, TX 77010
(Address of principal executive offices, including zip code)
Registrant’s telephone number, including area code: (877) 294-7574
Check the appropriate box below if the Form 8-K filing is intended to simultaneously satisfy the filing obligation of the registrant under any of the following provisions (see General Instruction A.2. below):
| ¨ | Written communications pursuant to Rule 425 under the Securities Act (17 CFR 230.425) |
| ¨ | Soliciting material pursuant to Rule 14a-12 under the Exchange Act (17 CFR 240.14a-12) |
| ¨ | Pre-commencement communications pursuant to Rule 14d-2(b) under the Exchange Act (17 CFR 240.14d-2(b)) |
| ¨ | Pre-commencement communications pursuant to Rule 13e-4(c) under the Exchange Act (17 CFR 240.13e-4(c)) |
| Item 7.01 | Regulation FD Disclosure. |
MRC Global Inc. (“MRC Global”) executive management will make a presentation on September 9, 2015 to attendees of the Barclays CEO Energy-Power Conference regarding, among other things, MRC Global’s operations and performance. A copy of the materials to be used at the presentation (the “Presentation Materials”) is included as Exhibit 99.1 to this Current Report on Form 8-K and is incorporated herein by reference. The Presentation Materials, possibly with modifications, will also be used from time to time after September 9, 2015 in presentations about MRC Global’s operations and performance to current and potential investors, lenders, creditors, insurers, vendors, customers, employees and others with an interest in MRC Global and its business.
The information contained in the Presentation Materials is summary information that should be considered in the context of MRC Global’s filings with the Securities and Exchange Commission and other public announcements that MRC Global may make by press release or otherwise from time to time. The Presentation Materials speak as of the date of this Current Report on Form 8-K. While MRC Global may elect to update the Presentation Materials in the future or reflect events and circumstances occurring or existing after the date of this Current Report on Form 8-K, MRC Global specifically disclaims any obligation to do so. The Presentation Materials will also be posted in the Investor Relations section of MRC Global’s website, http://www.mrcglobal.com, for 90 days.
The information referenced under Item 7.01 (including Exhibit 99.1 referenced under Item 9.01 below) of this Current Report on Form 8-K is being “furnished” under “Item 7.01. Regulation FD Disclosure” and, as such, shall not be deemed to be “filed” for the purposes of Section 18 of the Securities Exchange Act of 1934, as amended, or otherwise subject to the liabilities of that section. The information set forth in this Current Report on Form 8-K (including Exhibit 99.1 referenced under Item 9.01 below) shall not be incorporated by reference into any registration statement, report or other document filed by MRC Global pursuant to the Securities Act of 1933, as amended, except as shall be expressly set forth by specific reference in such filing.
| Item 9.01 | Financial Statements and Exhibits. |
| (d) | Exhibits. |
| 99.1 | Investor Presentation, dated September 9, 2015 |
2
SIGNATURES
Pursuant to the requirements of the Securities Exchange Act of 1934, the registrant has duly caused this report to be signed on its behalf by the undersigned hereunto duly authorized.
Date: September 9, 2015
| MRC GLOBAL INC. | ||||||
| By: | /s/ James E. Braun | |||||
| James E. Braun | ||||||
| Executive Vice President and Chief Financial Officer | ||||||
3
INDEX TO EXHIBITS
| Exhibit |
Description | |
| 99.1 | Investor Presentation, dated September 9, 2015 | |
4
 Barclays CEO Energy-Power Conference September 9, 2015 Andrew Lane Chairman, President & CEO Exhibit 99.1 |
 2 Barclays CEO Energy-Power Conference Forward Looking Statements and Non-GAAP Disclaimer This presentation contains forward-looking statements within the meaning of Section 27A of the Securities Act and Section 21E of the Exchange Act. Words such as “will,” “expect,” “expected”, “looking forward”, “guidance” and similar
expressions are intended to identify forward-looking statements.
Statements about the company’s business, including its strategy, the impact of
changes in oil prices and customer spending, its industry, the company’s future profitability, the company’s guidance on its sales, adjusted EBITDA, adjusted gross profit, tax rate, capital expenditures and cash
flow, the company’s expectations regarding the pay down of its debt,
growth in the company’s various markets and the company’s expectations, beliefs, plans, strategies, objectives, prospects and assumptions are not guarantees of future performance. These statements are based on management’s
expectations that involve a number of business risks and uncertainties,
any of which could cause actual results to differ materially from those expressed in or implied by the forward-looking statements. These statements involve known and unknown risks, uncertainties and other factors, most of which are difficult to predict and many of which are beyond our control, including the factors described in the company’s SEC filings that may cause our actual results and performance to be materially different from any future results or performance expressed or implied by these forward-looking
statements. For
a discussion of key risk factors, please see the risk factors disclosed in the company’s SEC filings, which are available on the SEC’s website at www.sec.gov and on the company’s website, www.mrcglobal.com. Our filings and other important information are also available on the Investor Relations page of our website at www.mrcglobal.com.
Undue reliance should not be placed on the company’s forward-looking
statements. Although forward-looking statements reflect the company’s good faith beliefs, reliance should not be placed on forward-looking statements because they involve known and unknown risks, uncertainties and other factors, which may cause the company’s actual results, performance or achievements or future events to differ materially from anticipated future results, performance or achievements or future events expressed or implied by such forward-looking statements. The company undertakes no obligation to
publicly update or revise any forward-looking statement, whether as a
result of new information, future events, changed circumstances or otherwise, except to the extent required by law. 2 |
 3 Barclays CEO Energy-Power Conference • Market Leader in North America and Worldwide • $5.6B TTM Sales • $384M TTM Adjusted EBITDA Key Role in Global Supply Chains of Leading Energy and Industrial Companies • Create value for customers and suppliers • Closely integrated into customer supply chains • 21,000+ customers Differentiated Global Capabilities • Unparalleled footprint, with 400+ locations in 22 countries • Enhanced capabilities to evaluate suppliers, source material and provide outstanding customer service • Serve as one-stop-shop worldwide Attractive and Diversified Business Mix • Focus on maintenance, repair and operations (MRO) contracts • Balanced portfolio across upstream, midstream and downstream sectors • Growing international and project business Global Leader in PVF Distribution Note: Sales and Adjusted EBITDA as of June 30, 2015 |
 4 Barclays CEO Energy-Power Conference Revenue by Product Line Note: Percentage of sales for the twelve months ended June 30, 2015 United States 77% Higher Margin Products 72% Lower Margin Products 28% Revenue by Geography Transmission 19% OCTG 8% Production Infrastructure, Materials & Supplies 35% Revenue by Industry Sector Downstream 26% Upstream 43% Midstream 31% Diversified by Region, Industry Sector and Product Line Gulf Coast 28% Western 25% Eastern 24% Asia / Europe / Middle East 14% Canada 9% Valves 32% Fittings & Flanges 21% General Oilfield Products 19% Line Pipe 20% OCTG 8% Other/ Industrial 13% Chemicals & Refining 13% Gas Utility 12% |
 5 Barclays CEO Energy-Power Conference Synergistic Business Model IOC DOW DuPont Marathon Petroleum AGL Resources Atmos DCP Midstream NiSource PG&E MarkWest Chesapeake Energy CNRL ConocoPhillips Apache Anadarko California Resources Corporation Hess Husky Energy Marathon Oil Statoil Tenaris TMK- IPSCO U.S. Steel CSI Tubular JMC Wheatland Balon Cameron Flowserve Kitz Neway Velan Boltex Bonney Forge Chevron Phillips Chemical Tube Forgings of America WL Plastics Emerson Phillips 66 Chevron Phillips Chemical Colombia Pipeline Group Williams Energy Carbon Steel Tubulars Valves Fittings, Flanges and Other Downstream Midstream Upstream Valero SABIC Supplier Value Proposition • Access to 21,000+ customers • 20+ year relationships • Source from 35+ countries • Purchased over $4.5 billion in 2014 • Manufacturing and scale efficiencies • Leverage MRC Global’s technical salesforce Customer Value Proposition • Reduce supply chain complexity • 20+ year relationships • Pre-qualifies new suppliers thru quality program • Outsource non-core supply chain and logistics functions • Product availability, with access to MRC Global’s $1 billion of inventory, which reduces need to invest in working capital • Savings from volume purchasing and global sourcing • 95% customer retention |
 6 Barclays CEO Energy-Power Conference 1. Investing and Financing cash flows from 2010 to Q2 2015, allocated by percentage. Net Financing equals the total issuance less repayment of debt
and equity. 2.
Reflects reported revenues for the year of acquisition or 2013 for Stream, MSD and
HypTeck. Use
of Cash Flow (2010 – Q2 2015¹) North American Consolidation • Merger of McJunkin and Red Man to created the largest PVF distributor in the world to energy companies • Completed North American platform through seven bolt- on acquisitions and organic growth • Scale and scope Global Acquisitions • Acquired Transmark in 2009 as a platform for our international expansion • Six further acquisitions to add markets and products • Acquired Stream, with differentiated offshore production facility capability Differentiated position • Global service capability enables ever closer integration with customers and organic growth opportunity • Still serve the smaller energy infrastructure customers that form the entrepreneurial backbone of US Acquisitions Date Region Revenue ($M)² Oct-08 U.S. $ 233 Oct-09 Europe and Asia 346 May-10 Eagle Ford 9 Aug-10 Oil Tools Supply Bakken 13 Jun-11 Australia / SE Asia 91 Jul-11 U.S. Gulf of Mexico 13 Mar-12 eSteel Piping Systems Australia 174 Jun-12 Mississippian Lime 71 Dec-12 Specialty Services Permian / Eagle Ford 127 Jul-13 Control Products Permian / Eagle Ford 28 Dec-13 Stainless United Kingdom 24 Jan-14 Norway 271 May-14 Engineering Singapore & SE Asia 26 Jun-14 Norway 38 Consolidation creates scale and broadens our capabilities Consolidated North America, Expanded Worldwide Via Acquisitions M&A 74% Capex 15% Net Financing 4% Other 7% |
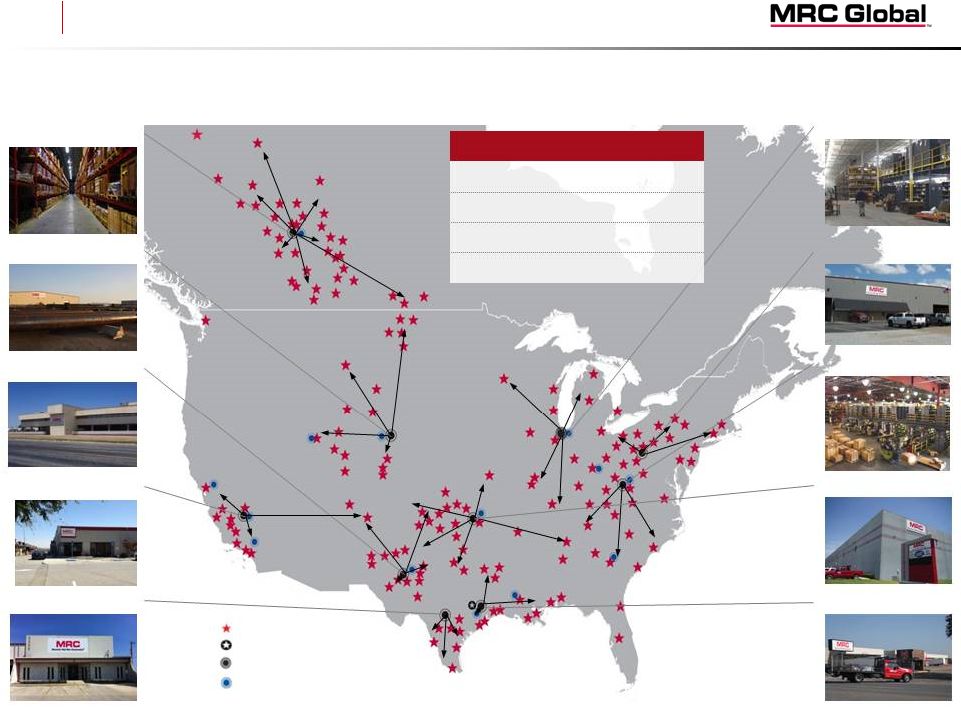 7 Barclays CEO Energy-Power Conference Munster, IN Nitro, WV Tulsa, OK Houston, TX Nisku, AB Cheyenne, WY Odessa, TX Bakersfield, CA San Antonio, TX Regional Distribution Centers Corporate Headquarters Valve Automation Centers Branch Locations Pittsburgh, PA Strong Leadership Position Across Key Basins North America By the Numbers As of 6/30/2015 Branches 160+ RDCs 10 VACs 14 Employees ~3,200 |
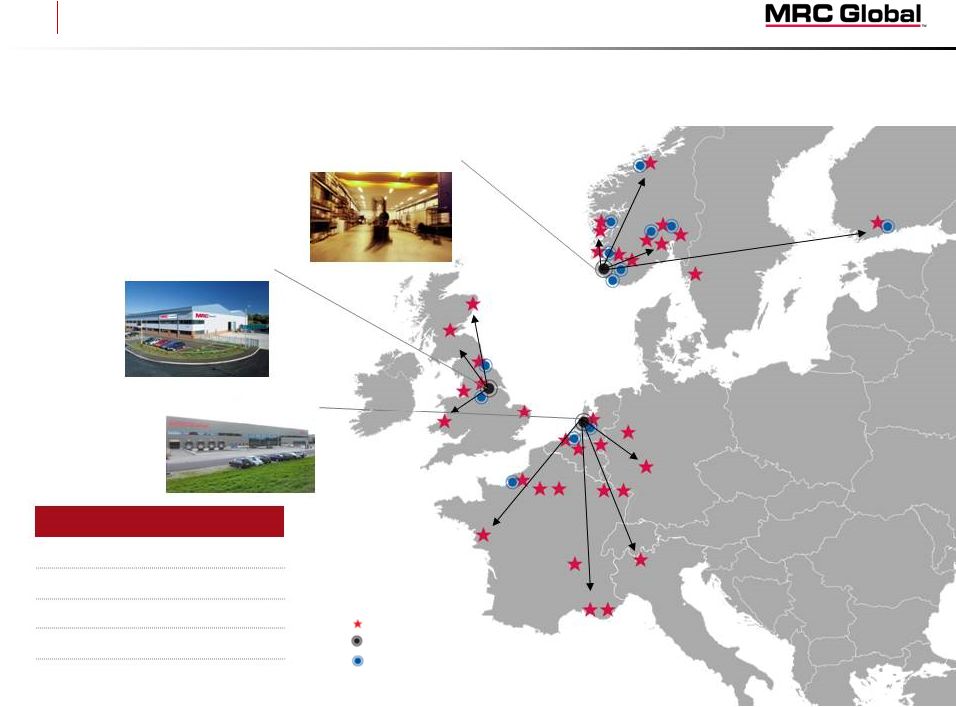 8 Barclays CEO Energy-Power Conference Regional Distribution Centers Valve Automation Centers Branch Locations Stavanger, NO Rotterdam, NL Bradford, UK Strong Leadership Position Throughout the North Sea and Western Europe Europe By the Numbers As of 6/30/2015 Branches 34 RDCs 3 VACs 13 Countries 9 Employees ~900 |
 9 Barclays CEO Energy-Power Conference Strategically Located in Key Growth Markets Asia Pacific & Middle East Singapore Perth, WA Brisbane, QLD Dubai, UAE By the Numbers As of 6/30/2015 Branches RDCs VACs Countries Employees ~400 11 7 4 28 Branch Locations Regional Distribution Centers Valve Automation Centers |
 10 Barclays CEO Energy-Power Conference Organic Growth Acquisitions Enhanced Profitability and Return on Capital Leverage Competitive Advantages to Drive Volume and Enhance Returns
Long Term Growth Strategy
Significant growth potential for the core business from continuing to
win in the field, which will generate strong incremental
margins •
Existing MRO Contract Customers
- Expand sales by adding scope, cross-selling product portfolio, project activity and greater integration • New MRO Contract Customers
– Capitalize on MRC Global’s superior offering to win additional MRO contracts from competitors • “Next 75” Customers
– Drive share with targeted growth accounts through focused sales efforts and exceptional customer service • Continue to add integrated supply service agreements Strategic acquisitions in attractive geographies and product lines
• Continue to make accretive acquisitions and consolidate the sector • Acquire businesses that add products, customers and/or geographic scope to the existing footprint
Shifting product mix to higher margin products while driving
efficiencies in overhead and working capital
• Emphasize higher margin products and continue shift toward valves, fittings & flanges
• Careful focus on SG&A spend to balance performance and cost efficiencies • Optimize working capital investment • Invest in technology systems and branch infrastructure to further strengthen customer service and
operational excellence |
 11 Barclays CEO Energy-Power Conference • Highest level of service offered • Full integration into customer’s supply chain and outsourcing of procurement, logistics and inventory management functions • All product classes sourced from and/or handled by the distributor Leading the Industry Shift Toward Integration • PVF purchasing handled locally on facility-by-facility basis • Separate sourcing for each product class • Limited between customers and distributors Then Now Next • PVF purchasing handled centrally for all facilities • Sourcing across product classes • MRO contracts covering segments, regions or comprehensive global PVF • Integration of distributor into the supply chain for logistics and planning Decentralized Procurement MRO Contracts & Centralized Procurement Integrated Supply High cost Limited corporate control Product availability risk Economies of scale Central control Capital efficiency Freedom to focus on core business Further cost savings Capital efficiency |
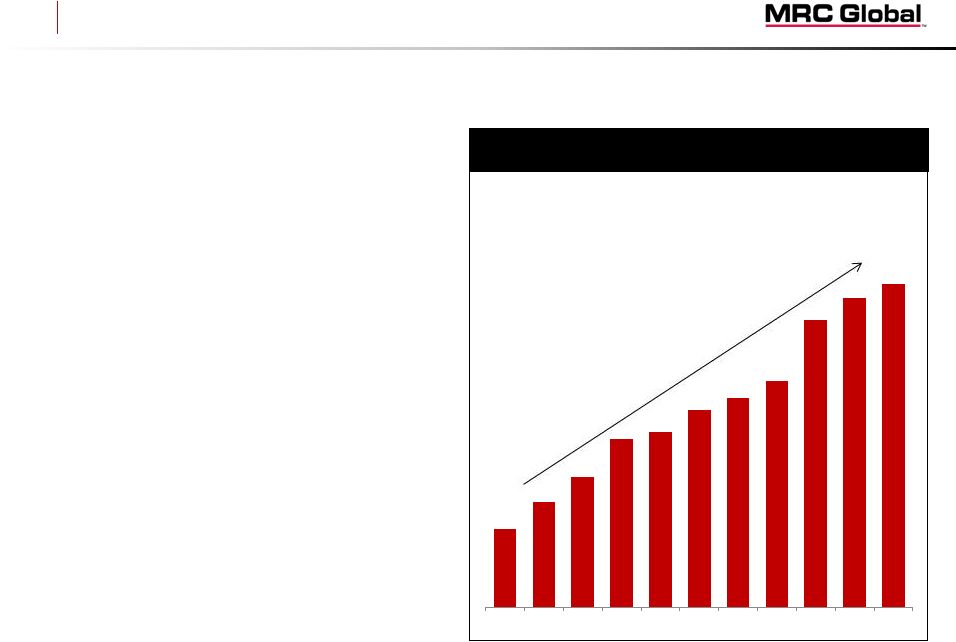 12 Barclays CEO Energy-Power Conference Customer Integration $144 $588 2004 2005 2006 2007 2008 2009 2010 2011 2012 2013 2014 CAGR = 15.1% Gas Distribution Revenue ($ millions) MRC Global is a leader in Integrated Supply • Over $830 million in revenue and growing rapidly • Currently manage 1.4 million part numbers of customer-owned and consignment inventory at over 800 locations • Over 190 MRC Global personnel are currently working at customer sites • Nearly 20 years experience • Procurement services and logistics management expertise Integrated Supply leverages MRC Global’s core competencies • Planning • Procurement • Inventory management • Logistics management • Managing complex supply chains Gas Distribution Companies Embrace Integrated Supply Solutions |
 13 Barclays CEO Energy-Power Conference $0 $52 $256 $330 $567 $554 $873 2008 2009 2010 2011 2012 2013 2014 North America ~$25B Market International ~$20B Market 1. Market sizes and percentage market share are management estimates based on 2014 results.
($ millions) Estimated Market Size and Share¹ International Market Opportunity International Segment Revenue 75% of our major IOC customers’ PVF Capex spend is outside of North America • Build on North American customer and supplier relationships Attractive opportunities for growth • Distribution channel is less penetrated than in North America • Greater project spend MRC Global has presence in all key regions • U.S., Canada, North Sea, Western Europe, Middle East, SE Asia and Australia Making headway on profitability • Building scale to drive profitability • Streamlining international management, SG&A after seven acquisitions International Expansion MRC Global 20% All Others 80% MRC Global 5% All Others 95% |
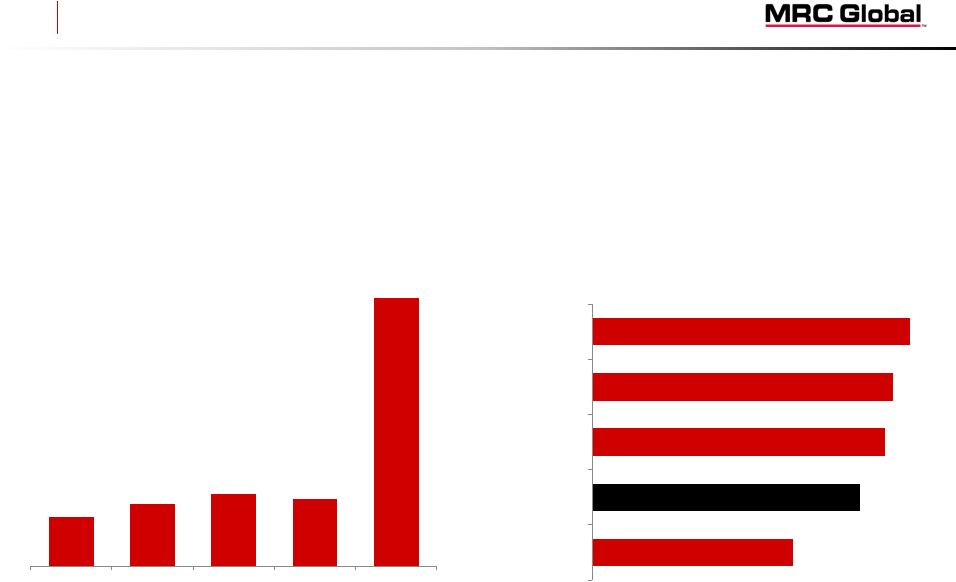 14 Barclays CEO Energy-Power Conference Strategic Expansion into Offshore Production Platforms $38 $36 $35 $32 $24 Norway United Kingdom USA Brazil Australia Top 10 Global Offshore E&P Markets² ($ billions) $77 $97 $111 $105 $415 2010 2011 2012 2013 2014 Offshore Revenue¹ 1. Offshore revenue estimated as 2% and 7% of total revenue for 2010-2013 and 2014, respectively. 2. Source: Rystad Energy, September 2014 • Top 4 largest offshore markets produce ~$140 billion in E&P spend annually • MRC Global is positioned in 4 of the 5 largest offshore markets
|
 15 Barclays CEO Energy-Power Conference Optimizing SG&A and Working Capital $185 $174 $159 $159 $149 - $152 Q3 14 Q4 14 Q1 15 Q2 15 Q3/Q4 15E Cost-consciousness is ingrained in our culture • Average management experience >30 years • Managed through many cycles • Reductions of 680 employees since mid-2014 • Successfully executing on cost cutting measures implemented in response to the market downturn Total SG&A ($ millions) Reduction = 18–19% Net Working Capital ($ millions) $1,343 $1,413 $1,326 $1,204 Q3 14 Q4 14 Q1 15 Q2 15 Reduction = 15% Continuous focus on inventory and receivables to maximize return on our assets • Daily inventory tracking of purchases and stock sales at every North American branch • Managing inventory lower while maintaining service levels by repositioning between sites and leveraging the hub and spoke model • Forecasted 2015 cash flow for operations $400-475 Million • Reducing accounts receivable days |
 16 Barclays CEO Energy-Power Conference 2015 Accomplishments In Spite of a Challenging Year Customer contract wins • Continued success in winning and retaining customers reinforces MRC Global’s market leadership and
positions MRC Global for a strong recovery
• Selected recent contract wins: Gained market share • Outperforming competition in a highly challenging market, with sales outpacing the decline in upstream
activity and customer spending
Deleveraged balance sheet
• Utilized strong cash flow generation from careful management of working capital and proceeds from an
opportunistic capital raise to fortify the balance sheet
• Reduced debt by $606 million, a 42% reduction in mid-2015 • Created financial flexibility to take advantage of current market Controlled operating costs • Cost cutting initiatives have resulted in meaningful reductions in SG&A spend
Customer Geography Term Customer Geography Term MarkWest U.S. 5 Years TECO Energy U.S. 5 Years Statoil Norway Project SABIC U.S., Europe & Saudi Arabia 5 Years Marathon Oil U.S. 5 Years Phillips 66 U.S. & Europe 5 Years California Resources U.S. 3 Years |
 17 Barclays CEO Energy-Power Conference Financial Model • Countercyclical Cash Flow Profile • Low Capital Expenditure Requirements • Economies of Scale • Operating Leverage • Flexible Capital Structure |
 18 Barclays CEO Energy-Power Conference $663 $850 $1,058 $1,009 $1,120 $538 $452 2010 2011 2012 2013 2014 2014 2015 Sales Adjusted Gross Profit and % Margin Adjusted EBITDA and % Margin 7.0% 8.5% ($ millions, except per share data) Y-o-Y Growth 28% 24% (5%) 11% Y-o-Y Growth 61% 29% (17%) 10% $3,846 $4,832 $5,571 $5,231 $5,933 $2,803 $2,490 2010 2011 2012 2013 2014 2014 2015 $224 $360 $463 $386 $424 $190 $150 2010 2011 2012 2013 2014 2014 2015 5.8% 7.5% 8.3% 7.4% 7.1% 6.8% 6.0% Y-o-Y Growth 26% 15% (6%) 13% Diluted EPS $(0.61) $0.34 $1.22 $1.48 $1.40 $0.61 $0.43 2010 2011 2012 2013 2014 2014 2015 Y-o-Y Growth NM 259% 21% (5%) 17.2% 17.6% 19.0% 19.3% 18.9% 19.2% 18.1% Six months ended June 30 Six months ended June 30 Six months ended June 30 Six months ended June 30 Financial Metrics |
 19 Barclays CEO Energy-Power Conference Total Debt Capital Structure Cash Flow from Operations Net Leverage ($ millions) June 30, 2015 Cash and Cash Equivalents $ 33 Total Debt (including current portion): Term Loan B due 2019, net of discount 527 Global ABL Facility due 2019 321 Total Debt $ 848 Preferred stock 355 Common stockholders’ equity 1,404 Total Capitalization $ 2,607 Liquidity $ 576 5.8x 4.1x 2.5x 2.6x 3.4x 2.8x – 3.1x 2.1x 2010 2011 2012 2013 2014 2015E 06/30/15 $113 $(103) $240 $324 $(106) $400 - $475 $(52) $277 2010 2011 2012 2013 2014 2015E 2014 2015 $1,360 $1,527 $1,257 $987 $1,454 $680 - $750 $848 2010 2011 2012 2013 2014 2015E 06/30/15 Six months ended June 30 Note: The Net Leverage ratio is calculated assuming the expected year-end debt balance above, the 6/30/2015 cash balance and a
denominator of $235 million, which is 2015 EBITDA consensus, as per
Bloomberg on August 25, 2015.
Balance Sheet Metrics |
 20 Barclays CEO Energy-Power Conference • Market Leader in PVF Distribution, Serving Critical Function to the Energy Industry • Diversified Across Sectors, Regions and Customers • Differentiated Global Platform Creates Customer Value • Attractive Cash Flow Characteristics and Strong Balance Sheet • Organic Growth Potential From Existing Business, Supported by Long- term Secular Growth Tailwind from Growth in Global Energy Use • Industry Consolidator, With Proven Success in Acquiring and Integrating Businesses • World-Class Management Team with Significant Distribution and Energy Experience Compelling Long-Term Investment |
 21 Barclays CEO Energy-Power Conference Appendix |
 22 Barclays CEO Energy-Power Conference Adjusted EBITDA Reconciliation Six months ended June 30 Year Ended December 31 ($ millions) 2015 2014 2014 2013 2012 2011 2010 Net income available to shareholders $ 45.4 $ 62.8 $ 144.1 $ 152.1 $ 118.0 $ 29.0 $ (51.8) Income tax expense 26.2 34.0 81.8 84.8 63.7 26.8 (23.4) Interest expense 28.3 30.5 61.8 60.7 112.5 136.8 139.6 Depreciation and amortization 10.2 10.5 22.5 22.3 18.6 17.0 16.6 Amortization of intangibles 30.9 33.9 67.8 52.1 49.5 50.7 53.9 Increase (decrease) in LIFO reserve (15.1) 2.1 11.9 (20.2) (24.1) 73.7 74.6 Change in fair value of derivative instruments 1.1 4.3 1.1 (4.7) (2.2) (7.0) 4.9 Equity-based compensation expense 5.4 4.0 8.9 15.5 8.5 8.4 3.7 Severance & related costs 8.7 5.0 7.5 0.8 - 1.1 3.2 Write-off of debt issuance costs 3.2 - - - - - - Foreign currency losses (gains) 5.5 (3.1) 2.5 12.9 (0.8) (0.6) 0.3 Loss on sale of Canadian progressive cavity pump business - 6.2 6.2 - - - - Loss on disposition of rolled and welded business - - 4.1 - - - - Insurance charge - - - 2.0 - - - Cancellation of executive employment agreement (cash portion) - - 3.2 - - - - Inventory write-down - - - - - - 0.4 M&A transaction & integration expenses - - - - - 0.5 1.4 Expenses associated with refinancing - - - 5.1 1.7 9.5 - Loss on early extinguishment of debt - - - - 114.0 - - Pension settlement - - - - 4.4 - - Legal and consulting expenses - - - - - 9.9 4.2 Provision for uncollectible accounts - - - - - 0.4 (2.0) Joint venture termination - - - - - 1.7 - Other expense (income) - - 0.6 3.0 (0.6) 2.6 (1.4) Adjusted EBITDA $ 149.8 $ 190.2 $ 424.0 $ 386.4 $ 463.2 $ 360.5 $ 224.2 |
 23 Barclays CEO Energy-Power Conference Adjusted Gross Profit Reconciliation Six months ended June 30 Year ended December 31 ($ millions) 2015 2014 2014 2013 2012 2011 2010 Gross profit $ 425.9 $ 491.6 $ 1,018.1 $ 954.8 $ 1,013.7 $ 708.2 $ 518.1 Depreciation and amortization 10.2 10.5 22.5 22.3 18.6 17.0 16.6 Amortization of intangibles 30.9 33.9 67.8 52.1 49.5 50.7 53.9 Increase (decrease) in LIFO reserve (15.1) 2.1 11.9 (20.2) (24.1) 73.7 74.6 Adjusted Gross Profit $ 451.9 $ 538.1 $ 1,120.3 $ 1,009.0 $ 1,057.7 $ 849.6 $ 663.2 |
Serious News for Serious Traders! Try StreetInsider.com Premium Free!
You May Also Be Interested In
- Blackwell 3D Acquires Operating Dubai LLC, Inches Closer to Project Readiness
- Agents Win Again! Epique Realty Amazes with Incredible Last Benefit Reveal at PowerCON: Delta Dental and Vision
- Aristocrat Leisure Completes Acquisition of Neo Group Ltd. (f/k/a NeoGames) for $29.50 per Share
Create E-mail Alert Related Categories
SEC FilingsSign up for StreetInsider Free!
Receive full access to all new and archived articles, unlimited portfolio tracking, e-mail alerts, custom newswires and RSS feeds - and more!
