Form 8-K MOSAIC CO For: Apr 09
UNITED STATES
SECURITIES AND EXCHANGE COMMISSION
Washington, D.C. 20549
FORM 8-K
CURRENT REPORT
Pursuant to Section 13 or 15(d)
of the Securities Exchange Act of 1934
Date of Report (Date of earliest event reported): April 9, 2015
THE MOSAIC COMPANY
(Exact name of registrant as specified in its charter)
Delaware | 001-32327 | 20-1026454 | ||
(State or other jurisdiction of incorporation) | (Commission File Number) | (IRS Employer Identification No.) | ||
3033 Campus Drive Suite E490 Plymouth, Minnesota | 55441 | |
(Address of principal executive offices) | (Zip Code) | |
Registrant’s telephone number, including area code: (800) 918-8270
Not applicable
(Former Name or Former Address, if Changed Since Last Report)
Check the appropriate box below if the Form 8-K filing is intended to simultaneously satisfy the filing obligation of the registrant under any of the following provisions (see General Instruction A.2. below):
¨ | Written communications pursuant to Rule 425 under the Securities Act (17 CFR 230.425) |
¨ | Soliciting material pursuant to Rule 14a-12 under the Exchange Act (17 CFR 240.14a-12) |
¨ | Pre-commencement communications pursuant to Rule 14d-2(b) under the Exchange Act (17 CFR 240.14d-2(b)) |
¨ | Pre-commencement communications pursuant to Rule 13e-4(c) under the Exchange Act (17 CFR 240.13e-4(c)) |
Item 7.01. Regulation FD Disclosure.
The following information is being “furnished” in accordance with General Instruction B.2. of Form 8-K and shall not be deemed “filed” for purposes of Section 18 of the Securities Exchange Act of 1934, as amended (the “Exchange Act”), or otherwise subject to the liabilities of that section, nor shall it be deemed to be incorporated by reference in any filing under the Securities Act of 1933, as amended (the “Securities Act”), or the Exchange Act, except as expressly set forth by specific reference in such filing:
Furnished herewith as Exhibit 99.1 and incorporated by reference herein is a copy of a presentation entitled “The Mosaic Company - April 9-10, 2015”. Representatives of The Mosaic Company ("Mosaic") intend to participate in investor meetings on April 9 and 10, 2015 to discuss the business and affairs of Mosaic and will make copies of this presentation available during these meetings. This presentation was prepared based on Mosaic’s assumptions relating to Canadian resource taxes and royalties as of February 11, 2015 and does not reflect the expected impact from recent changes in Saskatchewan’s potash production taxation, as described in the press release furnished as Exhibit 99.1 to Mosaic’s Current Report on Form 8-K filed with the Securities and Exchange Commission on March 30, 2015.
Item 9.01. Financial Statements and Exhibits.
(d) Exhibits.
Reference is made to the Exhibit Index hereto with respect to the exhibit furnished herewith. The exhibit listed in the Exhibit Index hereto is being “furnished” in accordance with General Instruction B.2. of Form 8-K and shall not be deemed “filed” for purposes of Section 18 of the Exchange Act, or otherwise subject to the liabilities of that section, nor shall it be deemed to be incorporated by reference in any filing under the Securities Act or the Exchange Act, except as expressly set forth by specific reference in such filing.
SIGNATURES
Pursuant to the requirements of the Securities Exchange Act of 1934, the registrant has duly caused this report to be signed on its behalf by the undersigned hereunto duly authorized.
THE MOSAIC COMPANY | ||||||
Date: April 8, 2015 | By: | /s/ Mark J. Isaacson | ||||
Name: | Mark J. Isaacson | |||||
Title: | Vice President, General Counsel | |||||
and Corporate Secretary | ||||||
EXHIBIT INDEX
Exhibit No. | Description | |
99.1 | Presentation entitled “The Mosaic Company - April 9-10, 2015” | |

April 9-10, 2015 The Mosaic Company 1
Click to edit Master title style 2 This document contains forward-looking statements within the meaning of the Private Securities Litigation Reform Act of 1995. Such statements include, but are not limited to, statements about the Wa’ad Al Shamal Phosphate Company (also known as the Ma’aden joint venture), the acquisition and assumption of certain related liabilities of the Florida phosphate assets of CF Industries, Inc. (“CF”) and Mosaic’s ammonia supply agreements with CF; repurchases of stock; other proposed or pending future transactions or strategic plans and other statements about future financial and operating results. Such statements are based upon the current beliefs and expectations of The Mosaic Company’s management and are subject to significant risks and uncertainties. These risks and uncertainties include but are not limited to risks and uncertainties arising from the ability of the Ma’aden joint venture to obtain additional planned funding in acceptable amounts and upon acceptable terms, the future success of current plans for the Ma’aden joint venture and any future changes in those plans; difficulties with realization of the benefits of the transactions with CF, including the risk that the cost or capital savings from the transactions may not be fully realized or may take longer to realize than expected, or the price of natural gas or ammonia changes to a level at which the natural gas based pricing under one of the long term ammonia supply agreements with CF becomes disadvantageous to Mosaic; customer defaults; the effects of Mosaic’s decisions to exit business operations or locations; the predictability and volatility of, and customer expectations about, agriculture, fertilizer, raw material, energy and transportation markets that are subject to competitive and other pressures and economic and credit market conditions; the level of inventories in the distribution channels for crop nutrients; changes in foreign currency and exchange rates; international trade risks and other risks associated with Mosaic’s international operations and those of joint ventures in which Mosaic participates, including the risk that protests against natural resource companies in Peru extend to or impact the Miski Mayo mine; changes in government policy; changes in environmental and other governmental regulation, including greenhouse gas regulation, implementation of numeric water quality standards for the discharge of nutrients into Florida waterways or efforts to reduce the flow of excess nutrients into the Mississippi River basin, the Gulf of Mexico or elsewhere; further developments in judicial or administrative proceedings, or complaints that Mosaic’s operations are adversely impacting nearby farms, business operations or properties; difficulties or delays in receiving, increased costs of or challenges to necessary governmental permits or approvals or increased financial assurance requirements; resolution of global tax audit activity; the effectiveness of Mosaic’s processes for managing its strategic priorities; adverse weather conditions affecting operations in Central Florida, the Mississippi River basin, the Gulf Coast of the United States or Canada, and including potential hurricanes, excess heat, cold, snow, rainfall or drought; actual costs of various items differing from management’s current estimates, including, among others, asset retirement, environmental remediation, reclamation or other environmental regulation, Canadian resources taxes and royalties, the liabilities Mosaic assumed in the Florida phosphate assets acquisition, or the costs of the Ma’aden joint venture, its existing or future funding and Mosaic’s commitments in support of such funding; reduction of Mosaic’s available cash and liquidity, and increased leverage, due to its use of cash and/or available debt capacity to fund share repurchases, financial assurance requirements and strategic investments; brine inflows at Mosaic’s Esterhazy, Saskatchewan, potash mine or other potash shaft mines; other accidents and disruptions involving Mosaic’s operations, including potential mine fires, floods, explosions, seismic events or releases of hazardous or volatile chemicals; and risks associated with cyber security, including reputational loss, as well as other risks and uncertainties reported from time to time in The Mosaic Company’s reports filed with the Securities and Exchange Commission. Actual results may differ from those set forth in the forward-looking statements. Safe Harbor Statement
Click to edit Master title style 3 • In this cyclical industry, the positive secular trends continue. • Long-term value creation is predicated on effective capital deployment. • Capital deployment near the trough of the cycle maximizes value creation: – Depressed investment values – Increasing leverage to the upcycle • For Mosaic, and for our investors, now is the right time to invest. Investment Thesis

Why Now? 4

Near-term Grain and Oilseed Stocks 5 Wide range of potential outcomes for 2015 607 580 495 408 470 463 426 438 514 570 551 540 524 585 623 15% 17% 19% 21% 23% 25% 27% 29% 350 400 450 500 550 600 650 700 00 01 02 03 04 05 06 07 08 09 10 11 12 13 14E 15F Stocks to Use Million Tonnes World Grain & Oilseed Stocks USDA Mosaic 2015/16 Range Mosaic Medium Scenarios Stocks to Use Source: USDA and Mosaic

Crop Nutrient Affordability Index M o r e A f f o r d a b l e 6 0.50 0.75 1.00 1.25 1.50 1.75 05 06 07 08 09 10 11 12 13 14 15 Plant Nutrient Affordability Plant Nutrient Price Index / Crop Price Index Affordability Metric AverageSource: Weekly Price Publications, CME, USDA, AAPFCO, Mosaic

55.0 57.5 1.9 1.5 1.0 1.9 50 51 52 53 54 55 56 57 58 59 60 2014 OCP Ma'aden Other China 2019 MMT P2O5 Source: CRU, January 2015. Global Phosphoric Acid Capacity F 60% 65% 70% 75% 80% 85% 90% 0 10 20 30 40 50 60 00 02 04 06 08 10 12 14 16F 18F 20F Op RateMMTP2O5 Source: CRU. January 2015. Global Phosphoric Acid Supply Capacity Production Operating Rate (Million Tonnes) (Million Tonnes) Improving Phosphate Outlook 7

Relatively Stable Potash Outlook Positive demand prospects Generally stable operating rate forecasts − Significant production increases required − No deep or prolonged down-cycle − Mosaic estimates of 80%-85% global operating rate 50% 55% 60% 65% 70% 75% 80% 85% 90% 95% 100% 0 10 20 30 40 50 60 70 80 90 100 00 02 04 06 08 10 12 14E 16F 18F 20F Op RateMMT KCl Source: Company Reports, Fertecon, CRU and Mosaic Global Potash Capacity, Production and Operating Rate Capacity Production Op Rate 8

Why Mosaic? 9

Click to edit Master title style 10 Distribution Strength

Phosphates: Scale and Strong Cost Position Largest and lowest quartile producer 11 Top 10 Phosphate Producers in 2013 Based on 2013 production M osaic's P2 O 5 production includes CF Industries' phosphate business P2 O 5 production based on PACID and SSP production OCP P2 O 5 Production split between finished phosphate product use vs. PACID sold as such Source: Com pany reports, IFA, CRU, Fertecon and M osaic 0.0 2.0 4.0 6.0 OCP Mosaic PotashCorp PhosAgro Yuntianhua Vale Guizhou Kailin Group GCT Guizhou Wengfu Group Eurochem Million Nutrient Tonnes Finished Phosphate Production Phophoric Acid Sales Source: CRU and Mosaic
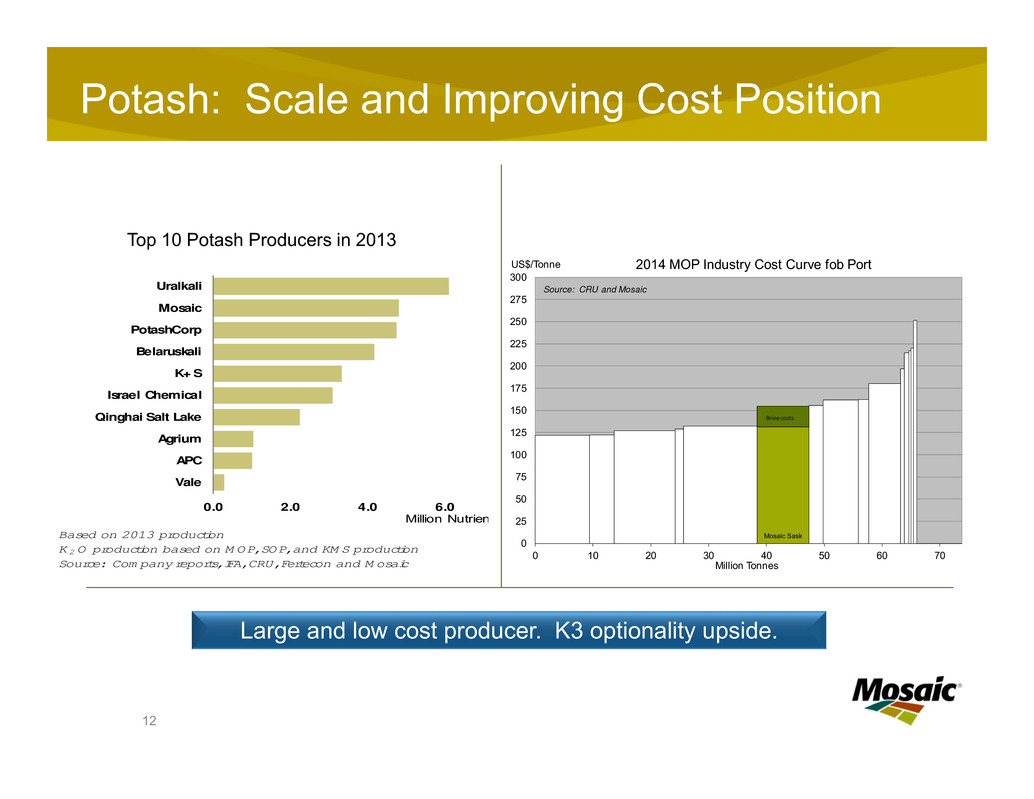
Based on 2013 production K2 O production based on M OP, SOP, and KM S production Source: Com pany reports, IFA, CRU, Fertecon and M osaic 0.0 2.0 4.0 6.0 8.0 Uralkali Mosaic PotashCorp Belaruskali K+ S Israel Chemical Qinghai Salt Lake Agrium APC Vale Million Nutrient Tonnes Potash: Scale and Improving Cost Position Large and low cost producer. K3 optionality upside. 12 Top 10 Potash Producers in 2013 Mosaic Sask 0 25 50 75 100 125 150 175 200 225 250 275 300 0 10 20 30 40 50 60 70 US$/Tonne Million Tonnes 2014 MOP Industry Cost Curve fob Port Source: CRU and Mosaic Brine costs

Innovation, Beyond Products

$47 per Share Transformed Balance Sheet: Returned $3.2B in 2014 Repurchased 18% of outstanding shares since the split-off Committed to maintaining rating Liquidity buffer of 2.5 billion Leverage of 1.5x to 2.0x Capital Management Priorities 14 Expect to continue to generate strong cash flow and excess cash Maintain Strong Financial Foundation Sustain Assets & Dividend Grow Business Return
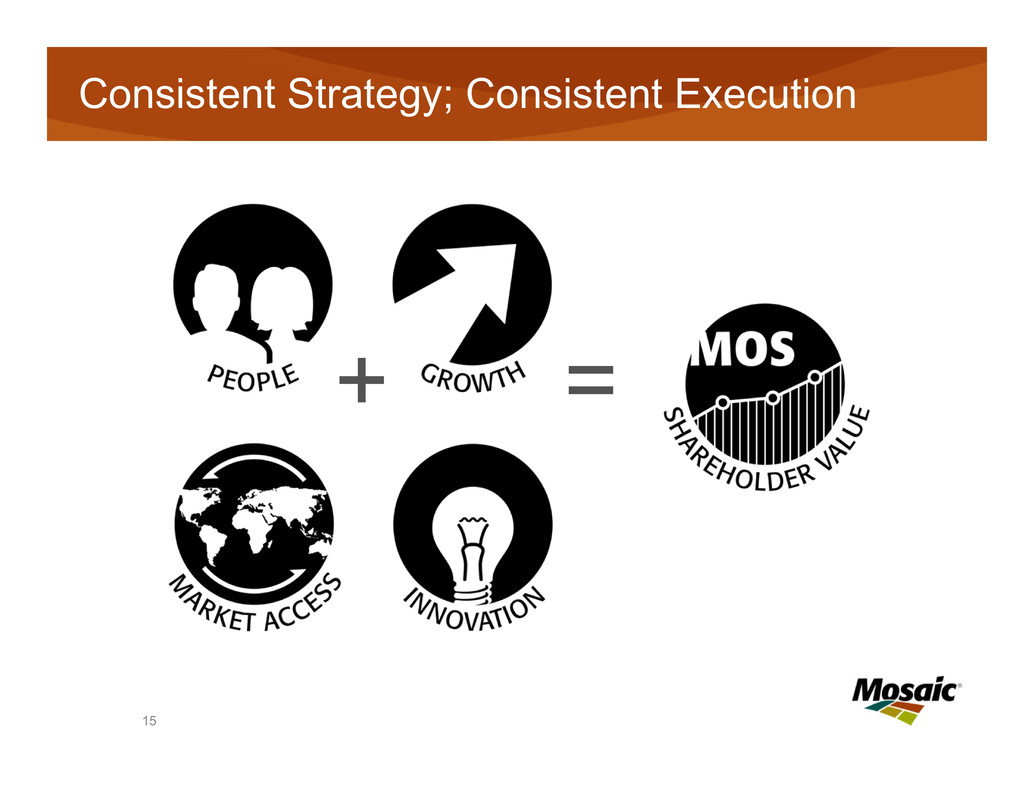
15 Consistent Strategy; Consistent Execution + =

16 Pulling The Right Levers Volume x Margin = Value Grow by optimizing: • Operations • Production Mix • Product Mix Grow through: • Brownfield Potash Expansions • MicroEssentials® Expansion • Strategic investments: • CF Phosphates • Ma’aden • ADM

$800 $900 $1,000 $1,100 $1,200 $1,300 $1,400 $1,500 $1,600 2014 2015F 2016F 2017F 2018F Phosphate Gross Margin Impact $1,466$937 ($ in millions) Phosphates: Investing for Growth * Assumptions in Appendix. Subject to risks and uncertainties including those stated in the Safe Harbor Statement. Ma’aden gross margin contribution excludes project debt service expense. CF Industries Phosphates MicroEssentials® Ma’aden Raw Materials+56% Source: Mosaic 17

Potash: Investing for Growth $923 $800 $850 $900 $950 $1,000 $1,050 $1,100 2014 2015F 2016F 2017F 2018F Potash Gross Margin Impact $1,076 ($ in millions) Volume Growth +17% * Assumptions in Appendix. Subject to risks and uncertainties including those stated in the Safe Harbor Statement. Source: Mosaic Opportunity to Reduce Brine Spending After 2018 18
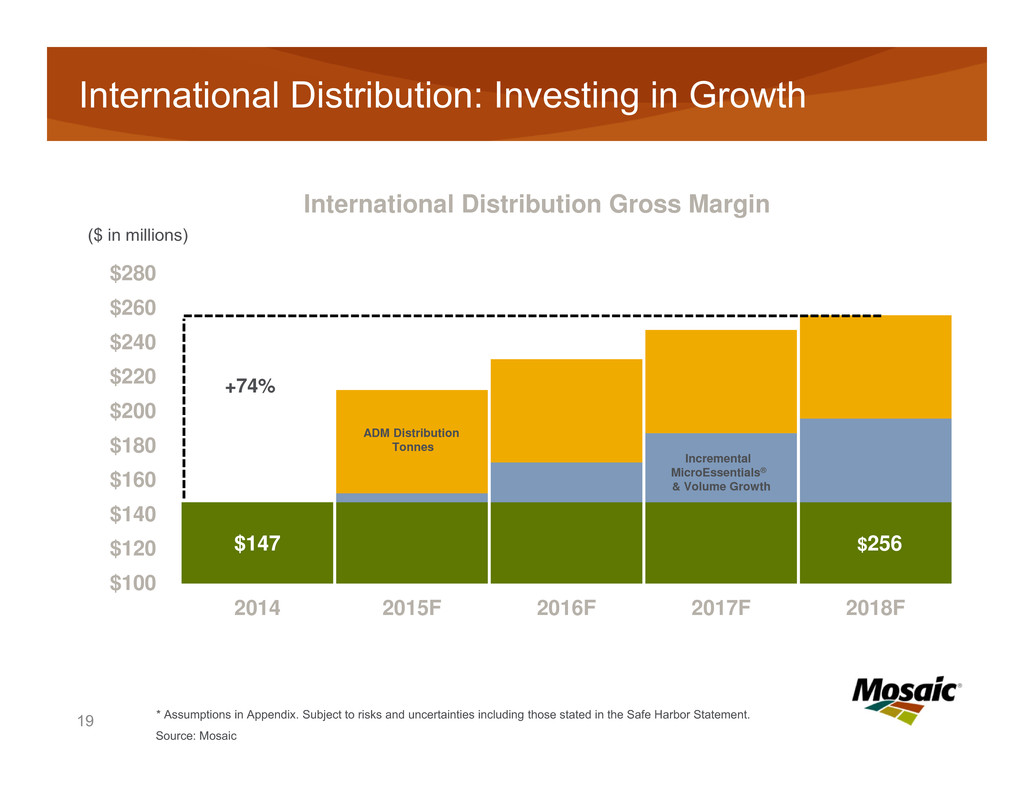
International Distribution: Investing in Growth $147 $256 $100 $120 $140 $160 $180 $200 $220 $240 $260 $280 2014 2015F 2016F 2017F 2018F International Distribution Gross Margin ($ in millions) Incremental MicroEssentials® & Volume Growth ADM Distribution Tonnes +74% * Assumptions in Appendix. Subject to risks and uncertainties including those stated in the Safe Harbor Statement. Source: Mosaic 19

$437 $680 $552 $1,025 $1,139 $0 $200 $400 $600 $800 $1,000 $1,200 2014 2015F 2016F 2017F 2018F Projected Cash Flow (After Dividends) Meaningful Cash Flow After Dividends 161% ($ in millions) * Assumptions in Appendix. Subject to risks and uncertainties including those stated in the Safe Harbor Statement. Source: Mosaic 20

Smart Capital Deployment Investment for Growth Shareholder Returns Capital Stewardship

Appendix 22

Phosphates: Ma’aden JV contribution embedded in gross margin, actual reporting is as an equity investment under U.S. GAAP. ADM business includes an incremental, 2 million tonnes of blended product plus synergies. Raw material savings result of increased NH3 manufacturing from de-bottlenecking vs. 2014 average purchased NH3 cost, lower costs from sulfur melting flexibility, and CF Industries ammonia off-take of 725k tonnes, which assumes difference between 2014 pricing and CF contract pricing. MicroEssentials® sales volume growth assumes 3.4 million tonnes in 2018 minus 2014 volumes multiplied by 2014 margin premium over DAP, not including incremental selling, general and administrative expenses. Selling prices and raw material costs (other than those noted above) are considered flat to 2014. Capacity increase based on 1.8 million tonnes from CF Industries phosphate acquisition. Potash: Growing volumes assumes 10.5 million tonnes of sales, based on 11.9 million tonnes of total capacity, in 2018. Assumptions for Canadian Resource Taxes and Royalties are based on expectations as of February 11, 2015. Corporate: Some cost savings occurred in calendar 2013 and 2014. Additionally, assumes some of the corporate savings are embedded in costs of goods sold. Other: Cost savings shown is net of 3% inflation. Dividends per share are assumed to increase by $0.10 per share in 2015 and then $0.05 per share thereafter. Dividends are calculated using projected 2015 shares outstanding of 364.2 million which assumes no additional share repurchases above current Board authorization. Cash flow per share assumes a hypothetical repurchase of 2.5m shares in each quarter from 2015 to 2018. Appendix: Assumptions All scenarios assuming pricing flat to 2014. 23

CY2014 Cash Flow from Operations Reconciliation Adjusted Cash flow from operations (Non-GAAP) $1,726 Changes in working capital 300 Loss on write-down of Carlsbad 125 Unrealized loss on derivatives 35 Change in value of share repurchase agreement 60 Amortization of acquired inventory 49 Special equity incentive 15 (Gain) on assets sold and to be sold (16) Cash flow from operations (GAAP) $2,294 Appendix: Non-GAAP Reconciliation 24

Tabular Representation of Data From Analyst Day Source: Mosaic 25 2014 2015F 2016F 2017F 2018F Cash Flow from Operations $1,726(a) $2,285 $2,387 $2,594 $2,633 Capex ($906) ($1,204) ($1,415) ($1,129) ($1,034) Dividends ($383) ($401) ($420) ($440) ($461) FCF Less Dividends $437 $680 $552 $1,025 $1,138 (a) adjusted, reconciled on prior page

Global Phosphate Shipment Forecasts by Region (February 2015) Million Tonnes DAP/MAP/TSP 2013R 2014E Oct Low 2015F Oct High 2015F Feb Low 2015F Feb High 2015F Comments China 21.5 21.6 21.8 22.1 21.8 22.1 Large but flat shipments in 2014. Forecast for 2015 unchanged. Moderate growth expected this year due in part to positive changes to agricultural commodity support policies. India 8.0 7.6 9.0 9.4 8.3 9.0 2014 estimate lowered due to weak import economics, a shift to NP/NPKs, and inventory depletion. 2015 range lowered due to some of the same factors, but projected increase driven by low channel stocks, a stable rupee and expected subsidy changes. Other Asia/Oceania 6.8 6.8 6.9 7.3 6.9 7.3 2014 demand came in at the low end of our forecast. Only minor rebalancing changes made to 2015 forecast, with demand projected flat to moderately higher in most countries. Europe and FSU 5.4 5.8 4.5 4.7 5.1 5.3 Upward revisions made to historical EU demand, which carried through to 2014 and 2015, while a weaker Euro and challenging economic environment may weigh on 2015. FSU countries expected to show continued moderate growth. Brazil 7.1 7.4 7.0 7.3 7.0 7.3 2014 estimate revised higher on strength of shipments through the end of the year. Forecast for 2015 unchanged. The sharp drop in the real boosts overall farm economics, but channel inventories expected to decline as well. Other Latin America 2.9 3.0 2.8 3.0 2.8 3.0 Minor rebalancing changes made, with shipments expected to be flat to slightly lower in 2015. North America 8.9 9.0 8.6 8.9 8.7 8.9 Expectations for 2015 are little changed with shipments ticking slightly lower on reductions in planted area (our 2015 corn and soybean area forecasts are 88-89 and 83-84 million acres). Other 3.6 3.5 3.8 3.9 3.6 3.8 Middle East shipments revised down in 2014 and expected to grow modestly in 2015. Africa holds broadly flat. Total 64.1 64.6 64.5 66.5 64.4 66.5 Our 2014 point estimate of 64.6 mmt sits squarely within our 64-65 mmt guidance. Downward revisions to India offset increases in Europe and Latin America. Our 2015 forecast is unchanged at 64.5-66.5 mmt, with a 65.4 mmt point estimate. Source: CRU and Mosaic. Numbers may not sum to total due to rounding. 26

Global Potash Shipment Forecasts by Region (February, 2015) Muriate of Potash Million Tonnes (KCl) 2013R 2014E Oct Low 2015F Oct High 2015F Feb Low 2015F Feb High 2015F Comments China 11.0 13.8 12.4 12.6 12.7 13.1 Shipments surged 2.8 mmt last year (+1.0 mmt production and +1.8 mmt net imports). We estimate ~1.0 mmt of the increase was inventory build. 2015 forecasts assume 4%-6% demand growth and a 0.5-0.6 mmt drawdown of channel inventories. India 3.2 3.9 4.0 4.4 4.1 4.4 India contracted for ~4.3 mmt in 2014/15 and imported 3.9 mmt in CY 2014. Farm economics remain profitable and import economics continue to work. Potential upside if meaningful policy changes made – especially urea subsidy reform. Indonesia/Malaysia 4.1 4.6 4.7 4.9 4.7 4.9 Demand growth to continue in 2015 due to still profitable palm oil economics (aided by biodiesel subsidy boost in Indonesia), low channel stocks, and continued moderate SMOP prices. Other Asia/Oceania 4.2 4.5 4.5 4.7 4.5 4.7 Demand elsewhere in Asia/Oceania beat expectations in 2014 and modest gains expected in most countries again this year. Europe and FSU 10.4 10.9 11.0 11.2 10.8 11.1 Upward revision in 2014 due to stronger-than-expected NPK output and direct application use. Forecast for 2015 pared back slightly due to net impact of lower crop prices and weaker Euro. Brazil 8.3 9.1 8.4 8.7 8.4 8.7 Record shipments and imports in 2014 and modest inventory build. 2015 demand projected to remain at elevated levels as weaker real more than offsets lower crop prices. Other Latin America 2.4 2.5 2.5 2.6 2.5 2.6 Flat to modest growth expected across most of the region. North America 8.7 10.0 8.7 8.9 8.7 8.9 Shipments last year surged to the highest level since 2004 due to strong on-farm demand, the need to replenish low channel inventories, and ongoing concerns about rail logistics. Shipments expected to revert to a more normal level in 2015. Other 1.3 1.7 1.5 1.6 1.5 1.6 Exceptional growth in other regions such as Africa and the Middle East in 2014 expected to moderate slightly in 2015. Total 53.7 61.1 57.9 59.9 57.9 60.0 Large 2014 upward revision mainly due to increases in China and North America to meet strong demand and refill near-empty channel stocks. Shipments in 2015 are forecast at 58-60 mmt, with a point estimate of 59.0 mmt. Source: CRU and Mosaic. Numbers may not sum to total due to rounding. 27
Serious News for Serious Traders! Try StreetInsider.com Premium Free!
You May Also Be Interested In
- St. Vincent Regional Hospital Verified as Level I Trauma Center by American College of Surgeons
- Super Star Builder Shane Duffy Shares Helpful Home Improvement Inspiration on TipsOnTV
- Trial Attorney James P. Lamey Joins Houston-Based PMR Law
Create E-mail Alert Related Categories
SEC FilingsSign up for StreetInsider Free!
Receive full access to all new and archived articles, unlimited portfolio tracking, e-mail alerts, custom newswires and RSS feeds - and more!


 Tweet
Tweet Share
Share