

Form 8-K MID PENN BANCORP INC For: Aug 09
 Tweet
Tweet Share
Share
UNITED STATES
SECURITIES AND EXCHANGE COMMISSION
WASHINGTON, DC 20549
FORM 8-K
CURRENT REPORT
Pursuant to Section 13 or 15(d)
of the Securities Exchange Act of 1934
Date of Report (Date of earliest event reported): August 9, 2016
MID PENN BANCORP, INC.
(Exact name of registrant as specified in its charter)
| Pennsylvania | 1-13677 | 25-1666413 |
|
(State or Other Jurisdiction of Incorporation or Organization) |
(Commission File Number) |
(I.R.S. Employer Identification Number) |
|
349 Union Street Millersburg, Pennsylvania |
1.866.642.7736 | 17061 |
| (Address of Principal Executive Offices) | (Registrant’s telephone number, including area code) | (Zip Code) |
Check the appropriate box below if the Form 8-K filing is intended to simultaneously satisfy the filing obligation of the registrant under any of the following provisions (see General Instruction A.2. below):
| ☐ | Written communications pursuant to Rule 425 under the Securities Act (17 CFR 230.425) |
| ☐ | Soliciting material pursuant to Rule 14a-12 under the Exchange Act (17 CFR 240.14a-12) |
| ☐ | Pre-commencement communications pursuant to Rule 14d-2(b) under the Exchange Act (17 CFR 240.14d-2(b)) |
| ☐ | Pre-commencement communications pursuant to Rule 13e-4(c) under the Exchange Act (17 CFR 240.13e-4(c)) |
MID PENN BANCORP, INC.
CURRENT REPORT ON FORM 8-K
Item 7.01 Regulation FD Disclosure
Executive Officers of Mid Penn Bancorp, Inc. will attend the Boenning & Scattergood “Hershey Community Bank Forum 2016” to be held August 9-10, 2016 in Hershey, PA. The PowerPoint slides to be used in discussions with Analysts and Investors are attached as Exhibit 99.1 to this Current Report and are incorporated herein by reference. No part of this Report shall be deemed “filed” for any purpose.
Item 9.01 Financial Statements and Exhibits
(d) Exhibits
SIGNATURES
Pursuant to the requirements of the Securities Exchange Act of 1934, the Registrant has duly caused this report to be signed on its behalf by the undersigned, thereunto duly authorized.
|
MID PENN BANCORP, INC. (Registrant)
| ||||
| Date: August 9, 2016 | By: | /s/ Michael D. Peduzzi | ||
| Michael D. Peduzzi | ||||
| Executive Vice President and Chief Financial Officer | ||||
| Exhibit Number | Description of Exhibit |
| 99.1 | Mid Penn Bancorp, Inc. Investor Presentation |
Exhibit 99.1

INVESTORPRESENTATION AUGUST9, 2016
2 Thispresentationmaycontainforward-lookingstatementsaboutMidPennBancorp,Inc. Forward- looking statements include statements with respect to our beliefs, plans, objectives, goals, expectations,anticipations,assumptions,estimates,intentions,andfutureperformance,andinvolve knownandunknownrisks,uncertaintiesandotherfactors,whichmaybebeyondthecontrolofMid PennBancorp,Inc.andcauseactualresults,performanceorachievementstodiffermateriallyfrom thefutureresults,performanceorachievementsexpressedorimpliedbyforward-lookingstatements. Anystatement,otherthanastatementofhistoricalfact,couldbeaforward-lookingstatement. When we usewordssuchas“believe”,expect”,“anticipate”,“may”,“will”, “assume”,“indicate”,“should”, “would”, “estimate”, “plan”, “project”, “target”, “continue”, “intend” or other similar words or expressions,wearemakingforward-lookingstatements. Risks,uncertainties,andotherfactorsaffectingMidPennBancorp,Inc.include,butarenotlimitedto, thefollowing: • theeffectsoffuturechangesineconomic,businessandmarketconditions; • theeffectsofchangesinbanking,securitiesandtaxlaws,andotherapplicableregulations; • theeffectsofcompetition,includinglocal,regional,andnationalprovidersoffinancialsservices; • theriskofchangesininterestratesondeposits,loans,securities,borrowings,andotherinterest- sensitiveassetsandliabilities; CAUTIONARYNOTICEREGARDINGFORWARD-LOOKINGSTATEMENTS INVESTORPRESENTATION AUGUST9, 2016
Risks,uncertainties,andotherfactorsaffectingMidPennBancorp,Inc.(continued): • thepossibilitythatmergerandacquisitionactivitieswillnotresultinanticipatedcostsavingsor projectedbusinessintegrationsynergies; • volatilityinsecuritiesmarkets,andtherelatedriskofdecreasesinboththevalueofMidPenn Bancorp,Inc.commonstockandinvestmentsecuritiesownedbythecompany; • the potentialineffectivenessofcertainelementsof businessstrategies,includingthe ability to growortomanagegrowth; • creditrisks,andthepossibilitythatactualloanlossesmaydifferfromtheestimatesunderlyingthe provisionandreserveforpossibleloanlosses; • changesinthevalueofcollateralsecuringloans,includingcommercialandresidentialrealestate • changesinaccountingpolicies,rulesandpractices; • implementinginformationtechnologyadvancements,andrelatedcostsandriskstomaintaining theeffectivenessofoperatingsystemsanddatasecurity; • changesinthecostofcapitalandaccesstocapitalmarkets;and • otherriskfactors,includingthosediscussedindocumentsfiledbyMidPennBancorp,Inc.with theSEC,includingtheAnnualReportonForm10-KfortheyearendedDecember31,2015. Investorsarecautionednottoplaceunduerelianceontheseforward-lookingstatements. MidPenn Bancorp,Inc. undertakesno obligationto publicly revise or updateforward-lookingstatementsto reflecteventsorcircumstancesthatariseafterthedateofthispresentation. CAUTIONARYNOTICEREGARDINGFORWARD-LOOKINGSTATEMENTS 3 INVESTORPRESENTATION AUGUST9, 2016

»Largest commercial bank headquartered in Dauphin County, Pennsylvania, with 20 retail banking locations across six counties. »Named one of the “Top 200 Community Banks” by American Banker Magazine (3rd consecutive year) 4 INVESTORPRESENTATION AUGUST9, 2016 (Dollars in 000s) June 30, 2016 June 30, 2015 Growth % Total Assets $1,012,884 $899,342 12.6% Total Loans $769,153 $705,152 9.1% Total Deposits $893,440 $753,925 18.5%

Executive Position Years at MPB Years in Industry Rory G. Ritrievi President & Chief Executive Officer 7 29 Scott W. Micklewright EVP & Chief Lending Officer 7 10 Kelly K. Neiderer EVP & Chief Retail Officer 3 26 Joseph L. Paese, CFP EVP & Director of Trust and Wealth Management 1 * 32 Michael D. Peduzzi, CPA EVP & Chief Financial Officer 1 * 17 Justin T. Webb EVP & Chief Risk Officer 3 10 Amy M. Barnett SVP & Senior Compliance Officer 6 17 Roberta A. Hoffman SVP & Director of Human Resources 40 40 John Paul Livingston SVP & Chief Technology Officer 6 13 Paul F. Spiegel SVP & Senior Operations Manager 5 30 Margaret E. Steinour SVP & Senior Loan Operations Manager 4 11 Cindy L. Wetzel VP & Corporate Secretary 36 36 Averages: 10 23 * Hired in 2016 5 INVESTORPRESENTATION AUGUST9, 2016

» Five-YearReturntoShareholders: $100investedinMPBstockasofDecember31,2010andheldforthefull fiveyearsthroughDecember31,2015returnedover143%. 100.00 102.95 156.74 205.02 228.85 243.52 98.67 114.76 134.66 144.73 154.25 Dec.31, 2010 Dec. 31, 2011 Dec.31, 2012 Dec. 31, 2013 Dec.31, 2014 Dec. 31, 2015 Mid Penn Bancorp, Inc. Mid-Atlantic Custom Peer Group * * Peer group of 131 Mid-Atlantic commercial banks with assets < $1 billion. 6 INVESTORPRESENTATION AUGUST9, 2016

$13.19 $13.35 $15.13 $15.49 $16.54 $11.19 $14.34 $15.55 $16.10 $15.91 Year Ended Dec. 31, 2012 Year Ended Dec. 31, 2013 Year Ended Dec. 31, 2014 Year Ended Dec. 31, 2015 6 Mos. Ended Jun. 30, 2016 Tangible Book Value and Market Price Per Common Share Tangible Book Value Per Common Share Closing Market Price Per Common Share 7 INVESTORPRESENTATION AUGUST9, 2016 * * Closing Market Price at August 5, 2016 was $17.30

$1.27 $1.32 $1.53 $1.47 $0.91 Year Ended Dec. 31, 2012 Year Ended Dec. 31, 2013 Year Ended Dec. 31, 2014 Year Ended Dec. 31, 2015 6 Mos. Ended Jun. 30, 2016 Earnings Per Common Share (Fully Diluted) 8 INVESTORPRESENTATION AUGUST9, 2016 * * * The 2015 and 2014 EPS reflect a ($0.12) and ($0.11) impact, respectively, of nonrecurring merger expenses.

9 INVESTORPRESENTATION AUGUST9, 2016 $0.25 $0.25 $0.45 $0.44 $0.34 Year Ended Dec. 31, 2012 Year Ended Dec. 31, 2013 Year Ended Dec. 31, 2014 Year Ended Dec. 31, 2015 6 Mos. Ended Jun. 30, 2016 Dividends Distributed Per Common Share

» 2015annualearningsofover$6million(afterone-timemerger-relatedexpenses of$762,000incurredduring2015),reflecta12.8%increaseover2014earnings, continuingthetrendofincreasingannualnetincome. 10 INVESTORPRESENTATION AUGUST9, 2016 $4,029 $4,437 $4,616 $5,351 $6,038 2011 2012 2013 2014 2015 Net Income Available to Common Shareholders (Year Ended December 31, Dollars in 000s)
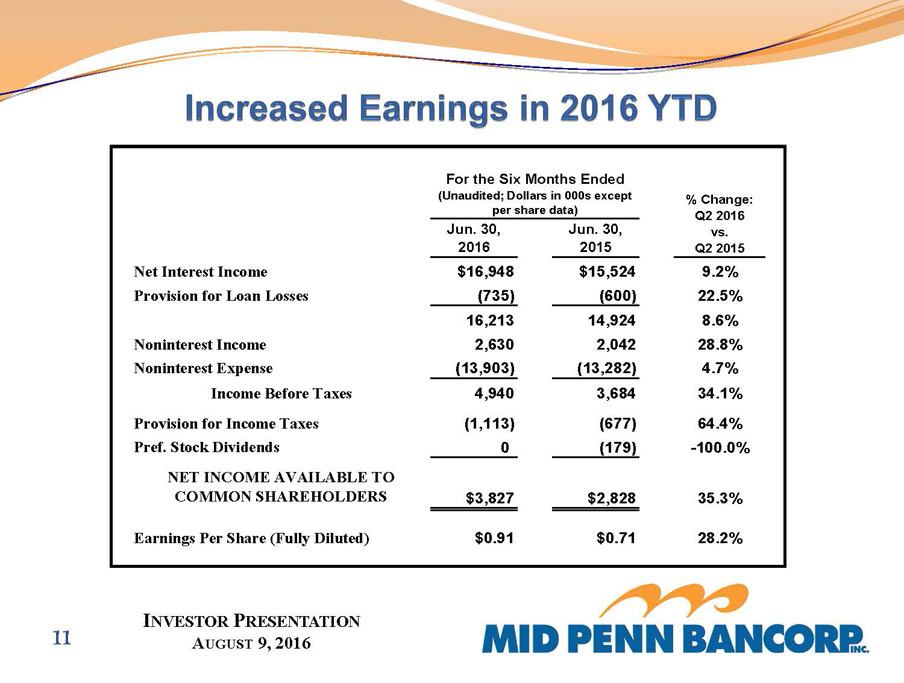
11 INVESTORPRESENTATION AUGUST9, 2016 Jun. 30, 2016 Jun. 30, 2015 Net Interest Income $16,948 $15,524 9.2% Provision for Loan Losses (735) (600) 22.5% 16,213 14,924 8.6% Noninterest Income 2,630 2,042 28.8% Noninterest Expense (13,903) (13,282) 4.7% Income Before Taxes 4,940 3,684 34.1% Provision for Income Taxes (1,113) (677) 64.4% Pref. Stock Dividends 0 (179) -100.0% NET INCOME AVAILABLE TO COMMON SHAREHOLDERS $3,827 $2,828 35.3% Earnings Per Share (Fully Diluted) $0.91 $0.71 28.2% For the Six Months Ended (Unaudited; Dollars in 000s except per share data) % Change: Q2 2016 vs. Q2 2015

Dec. 31, 2012 Dec. 31, 2013 Dec. 31, 2014 Dec. 31, 2015 June. 30, 2016 $705 $713 $756 $932 $1,013 Total Assets (Dollars in millions) » As of June 30, 2016, Mid Penn Bancorp’s total assets exceeded $1 billion. FromDec.31,2012,toJune30,2016,totalassetsincreased44%. 12 INVESTORPRESENTATION AUGUST9, 2016

» FromDec.31,2014,toJune30,2016,totalloansincreased$197millionor34%. Ofthisincrease,$112millionor20%wasfromcoreMidPennBankgrowth,while $85millionor14%wasprincipalremainingfromPhoenixBancorpacquiredloans. 13 INVESTORPRESENTATION AUGUST9, 2016 Dec. 31, 2012 Dec. 31, 2013 Dec. 31, 2014 Dec. 31, 2015 Jun. 30, 2016 $484 $546 $572 $739 $769 Total Loans (Dollars in millions)

Commercial Real Estate, 59% Commercial and Industrial,22% Residential Mortgage and Consumer, 19% Commercial Real Estate, 61% Commercial and Industrial,21% Residential Mortgage and Consumer, 18% » TheaverageyieldonloansheldintheBank’sportfoliowas4.85%fortheyearended December31,2015,and4.82%forthesixmonthsendedJune30,2016. 14 12/31/2015 6/30/2016 INVESTORPRESENTATION AUGUST9, 2016
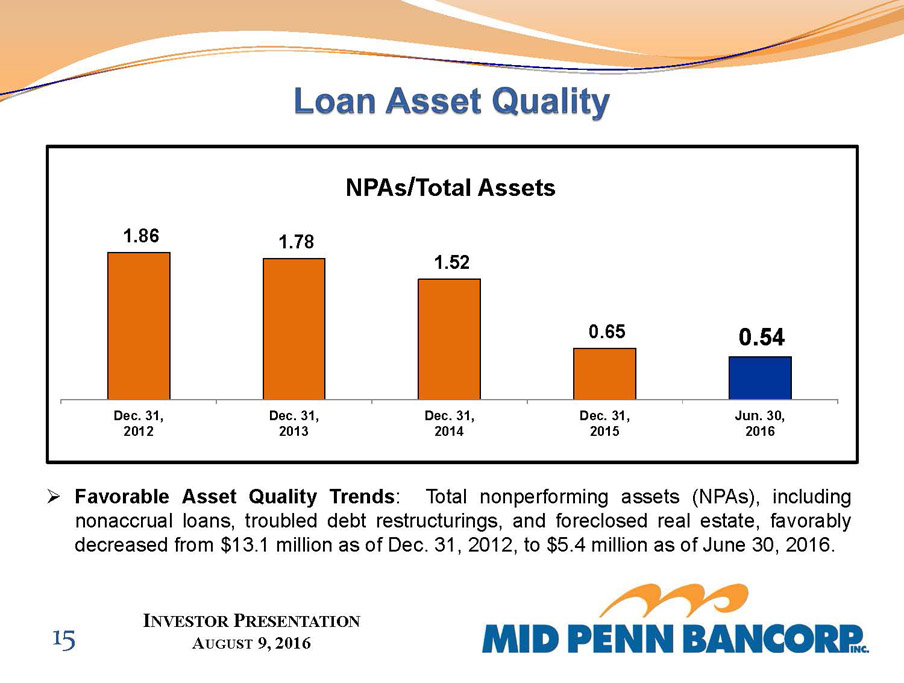
» Favorable Asset Quality Trends: Total nonperforming assets (NPAs), including nonaccrual loans, troubled debt restructurings, and foreclosed real estate, favorably decreasedfrom$13.1millionasofDec.31,2012,to$5.4millionasofJune30,2016. 15 INVESTORPRESENTATION AUGUST9, 2016 1.86 1.78 1.52 0.65 0.54 Dec. 31, 2012 Dec. 31, 2013 Dec. 31, 2014 Dec. 31, 2015 Jun. 30, 2016 NPAs/Total Assets

16 INVESTORPRESENTATION AUGUST9, 2016 44.95% 53.94% 61.37% 126.46% 140.28% Dec. 31, 2012 Dec. 31, 2013 Dec. 31, 2014 Dec. 31, 2015 Jun. 30, 2016 Allowance for Loan Losses/Nonperforming Loans

» FavorableAssetQualityTrends: TheTexasRatioistheamountoftheBank’s nonperformingassetsand90-daypastdueloans,dividedbytangibleequitycapital plustheloanlossreserve. Measuresof100ormoreareanadversewarningsign. 17 INVESTORPRESENTATION AUGUST9, 2016 25.3 23.8 19.3 8.5 7.2 Dec. 31, 2012 Dec. 31, 2013 Dec. 31, 2014 Dec. 31, 2015 Jun. 30, 2016 Texas Ratio
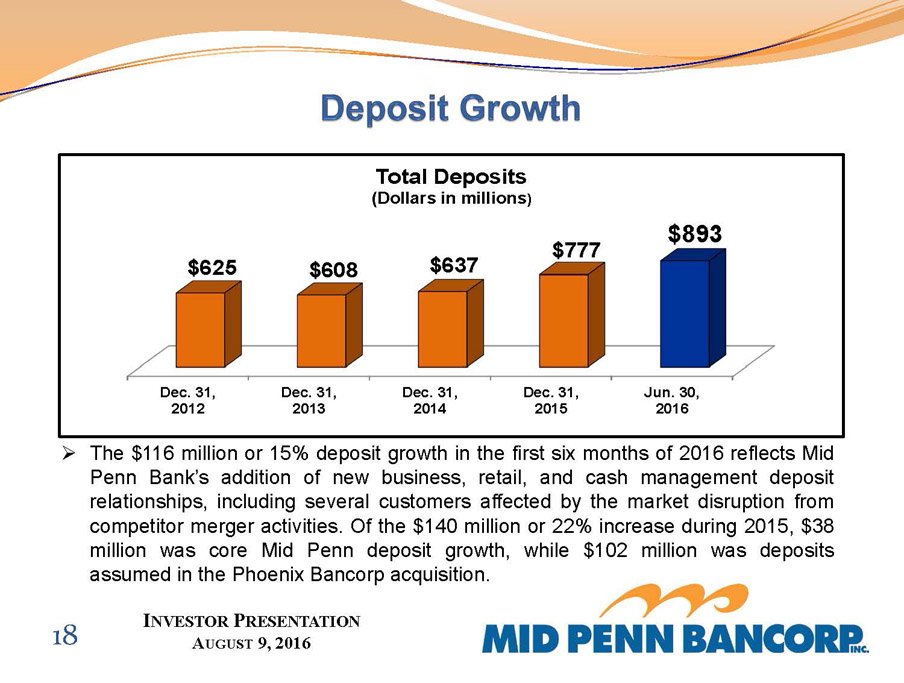
» The$116millionor15%depositgrowthinthefirstsixmonthsof2016reflectsMid Penn Bank’s addition of new business, retail, and cash management deposit relationships,includingseveralcustomersaffectedby the market disruptionfrom competitormergeractivities.Ofthe$140millionor22%increaseduring2015,$38 million was core Mid Penn deposit growth, while $102 million was deposits assumedinthePhoenixBancorpacquisition. 18 INVESTORPRESENTATION AUGUST9, 2016 Dec. 31, 2012 Dec. 31, 2013 Dec. 31, 2014 Dec. 31, 2015 Jun. 30, 2016 $625 $608 $637 $777 $893 Total Deposits (Dollars in millions)

Noninterest Bearing Demand, 13% Interest Bearing Demand, 32% Money Market, 27% Savings, 7% Time, 21% Noninterest Bearing Demand, 14% Interest Bearing Demand, 33% Money Market, 27% Savings, 7% Time, 19% 19 12/31/2015 6/30/2016 INVESTORPRESENTATION AUGUST9, 2016

» Given the low interest rates over the past several years, combined with our disciplineddepositpricing,wehavefavorablyreducedourcostoffunds. 20 INVESTORPRESENTATION AUGUST9, 2016 2.08% 1.68% 1.20% 0.86% 0.71% 0.64% 0.68% Year Ended Dec. 31, 2010 Year Ended Dec. 31, 2011 Year Ended Dec. 31, 2012 Year Ended Dec. 31, 2013 Year Ended Dec. 31, 2014 Year Ended Dec. 31, 2015 6 Mos. Ended Jun. 30, 2016 Cost of Funds

» For the six months ended June 30, 2016, the Net Interest Margin was 3.90%. Despitepersistentlowinterestratesinahighlycompetitivelendingenvironment, ourNetInterestMarginremainedstrongreflectingbothourcontinuedloanpricing discipline,andourabilitytogrowlowercostdeposits. 21 INVESTORPRESENTATION AUGUST9, 2016 3.52% 3.63% 3.80% 3.99% 4.03% 3.79% 3.70% 3.58% 3.60% 3.13% 2011 2012 2013 2014 2015 Mid Penn Bank Pennsylvania Banks
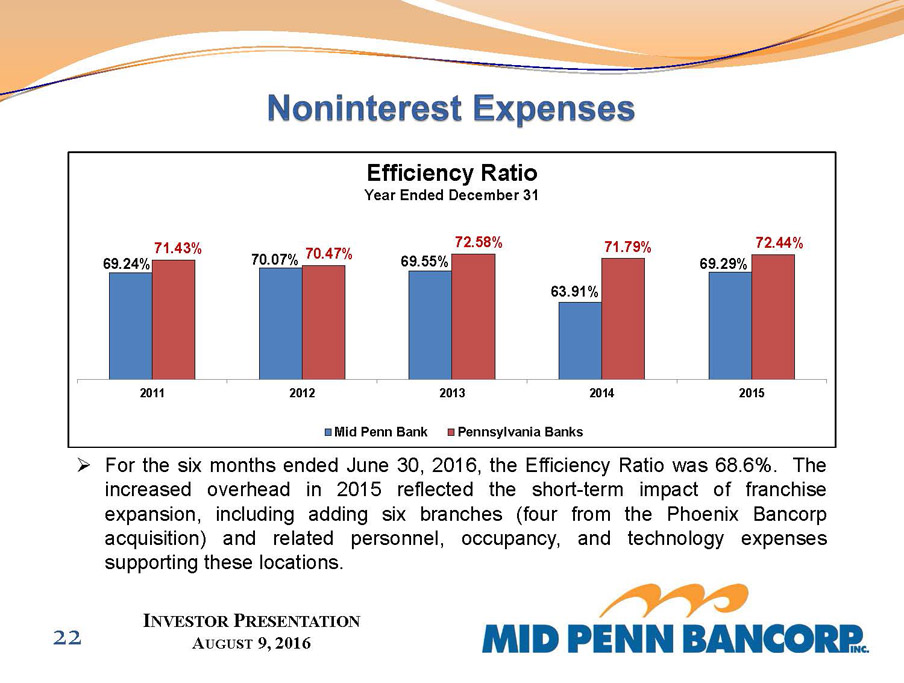
69.24% 70.07% 69.55% 63.91% 69.29% 71.43% 70.47% 72.58% 71.79% 72.44% 2011 2012 2013 2014 2015 Efficiency Ratio Year Ended December 31 Mid Penn Bank Pennsylvania Banks » ForthesixmonthsendedJune30,2016,theEfficiencyRatiowas68.6%. The increased overhead in 2015 reflected the short-term impact of franchise expansion, including adding six branches (four from the Phoenix Bancorp acquisition) and related personnel, occupancy, and technology expenses supportingtheselocations. 22 INVESTORPRESENTATION AUGUST9, 2016

23
Serious News for Serious Traders! Try StreetInsider.com Premium Free!
You May Also Be Interested In
- Mid Penn Bancorp (MPB) Declares $0.20 Quarterly Dividend; 3.9% Yield
- Prospera Energy Inc. 2024 Corporate Update
- Canadian Pink Floyd Tribute Band Floydium Performance At Summer Venues Announced
Create E-mail Alert Related Categories
SEC FilingsSign up for StreetInsider Free!
Receive full access to all new and archived articles, unlimited portfolio tracking, e-mail alerts, custom newswires and RSS feeds - and more!
