Form 8-K METRO BANCORP, INC. For: Jun 19
UNITED STATES
SECURITIES AND EXCHANGE COMMISSION
Washington, D.C. 20549
FORM 8-K
CURRENT REPORT
Pursuant to Section 13 OR 15(d) of the Securities Exchange Act of 1934
Date of Report (Date of earliest event reported) | June 19, 2015 | (June 19, 2015) |
Metro Bancorp, Inc. |
(Exact name of registrant as specified in its charter) |
Pennsylvania | 000-50961 | 25-1834776 | ||
(State or other jurisdiction of incorporation) | (Commission File Number) | (IRS Employer Identification No.) | ||
3801 Paxton Street, Harrisburg, Pennsylvania | 17111 | |
(Address of principal executive offices) | (Zip Code) | |
Registrant's telephone number, including area code | 888-937-0004 |
N/A |
(Former name or former address, if changed since last report) |
Check the appropriate box below if the Form 8-K filing is intended to simultaneously satisfy the filing obligation of the registrant under any of the following provisions:
[ ] Written communications pursuant to Rule 425 under the Securities Act (17 CFR 230.425)
[ ] Soliciting material pursuant to Rule 14a-12 under the Exchange Act (17 CFR 240.14a-12)
[ ] Pre-commencement communications pursuant to Rule 14d-2(b) under the Exchange Act (17 CFR 240.14d-2(b))
[ ] Pre-commencement communications pursuant to Rule 13e-4(c) under the Exchange Act (17 CFR 240.13e-4(c))
Item 5.07 Submission of Matters to a Vote of Security Holders
The Annual Meeting of Shareholders (the Annual Meeting) of Metro Bancorp, Inc. (Metro or the Company) was held on June 19, 2015. At that meeting, the shareholders considered and acted upon the following proposals:
1. The election of directors. By the vote reflected below, the shareholders elected the following individuals to serve as directors until the 2016 Annual Meeting:
Votes For | Votes Withheld | Broker Non-Votes | |
James R. Adair | 11,879,822 | 526,439 | 1,256,863 |
Douglas R. Berry | 11,956,745 | 449,516 | 1,256,863 |
John J. Cardello, CPA | 11,732,176 | 674,085 | 1,256,863 |
Douglas S. Gelder | 11,469,419 | 936,842 | 1,256,863 |
Alan R. Hassman | 11,926,534 | 479,727 | 1,256,863 |
Richard J. Lashley | 12,164,371 | 241,890 | 1,256,863 |
J. Rodney Messick | 11,986,587 | 419,674 | 1,256,863 |
Jessica E. Meyers | 11,927,597 | 478,664 | 1,256,863 |
Gary L. Nalbandian | 11,857,243 | 549,018 | 1,256,863 |
Michael A. Serluco | 11,955,772 | 450,489 | 1,256,863 |
Thomas F. Smida, Esq. | 8,651,710 | 3,754,551 | 1,256,863 |
Samir J. Srouji, M.D. | 11,823,561 | 582,700 | 1,256,863 |
2. The approval of the 2016 employee stock option and restricted stock plan. The voting results were as follows: 8,808,513 shares voted for the proposal; 3,583,962 shares voted against the proposal; and 13,786 shares abstained from voting on the proposal. There were 1,256,863 broker non-votes on the proposal.
3. The approval of an amendment to the 2011 directors stock option and restricted stock plan. The voting results were as follows: 11,764,845 shares voted for the proposal; 622,237 shares voted against the proposal; and 19,179 shares abstained from voting on the proposal. There were 1,256,863 broker non-votes on the proposal.
4. The Say-On-Pay Proposal advisory vote on compensation of named executive officers. The shareholders voted to approve, on an advisory non-binding basis, the compensation paid to the named executive officers. The voting totals for this item are as follows: 11,823,455 shares voted for the proposal; 487,527 shares voted against the proposal; and 95,279 shares abstained from voting on the proposal. There were 1,256,863 broker non-votes on the proposal.
5. The ratification of the appointment of BDO USA, LLP as Metro's independent registered public accounting firm for the fiscal year ending December 31, 2015. The voting results were as follows: 13,487,431 shares voted for the proposal; 160,348 shares voted against the proposal; and 15,345 shares abstained from voting on the proposal. There were no broker non-votes on the proposal.
Item 7.01. Regulation FD Disclosure
On June 19, 2015, the shareholders of Metro Bancorp, Inc. held their annual shareholders' meeting. At that meeting, the Chief Executive Officer and Chief Financial Officer of Metro made a presentation to shareholders. The slide presentation used during the meeting is attached as Exhibit 99.1.
The information in this Item 7.01 and Exhibit 99.1 attached hereto shall not be deemed "filed" for purposes of Section 18 of the Securities Exchange Act of 1934, as amended, nor shall it be deemed incorporated by reference in any filing under the Securities Exchange Act of 1933, as amended, except as shall be expressly set forth by specific reference in such filing.
Item 8.01. Other Events
On June 19, 2015, the Company presented to its shareholders the presentation included as Exhibit 99.1 of this Form 8-K.
Item 9.01. Financial Statements and Exhibits
(d) Exhibits
Exhibit No. | Description |
99.1 | Shareholder Presentation Materials of Metro Bancorp, Inc., dated June 19, 2015 |
SIGNATURE
Pursuant to the requirements of the Securities Exchange Act of 1934, the registrant has duly caused this report to be signed on its behalf by the undersigned hereunto duly authorized.
Metro Bancorp, Inc.
-----------------------------------------------
(Registrant)
Date: June 19, 2015
/s/ Mark A. Zody
-----------------------------------------------
Mark A. Zody
Chief Financial Officer
EXHIBIT INDEX
Exhibit No. Description
99.1 | Shareholder Presentation Materials of Metro Bancorp, Inc., dated June 19, 2015 |

Annual Shareholders’ Meeting June 19, 2015

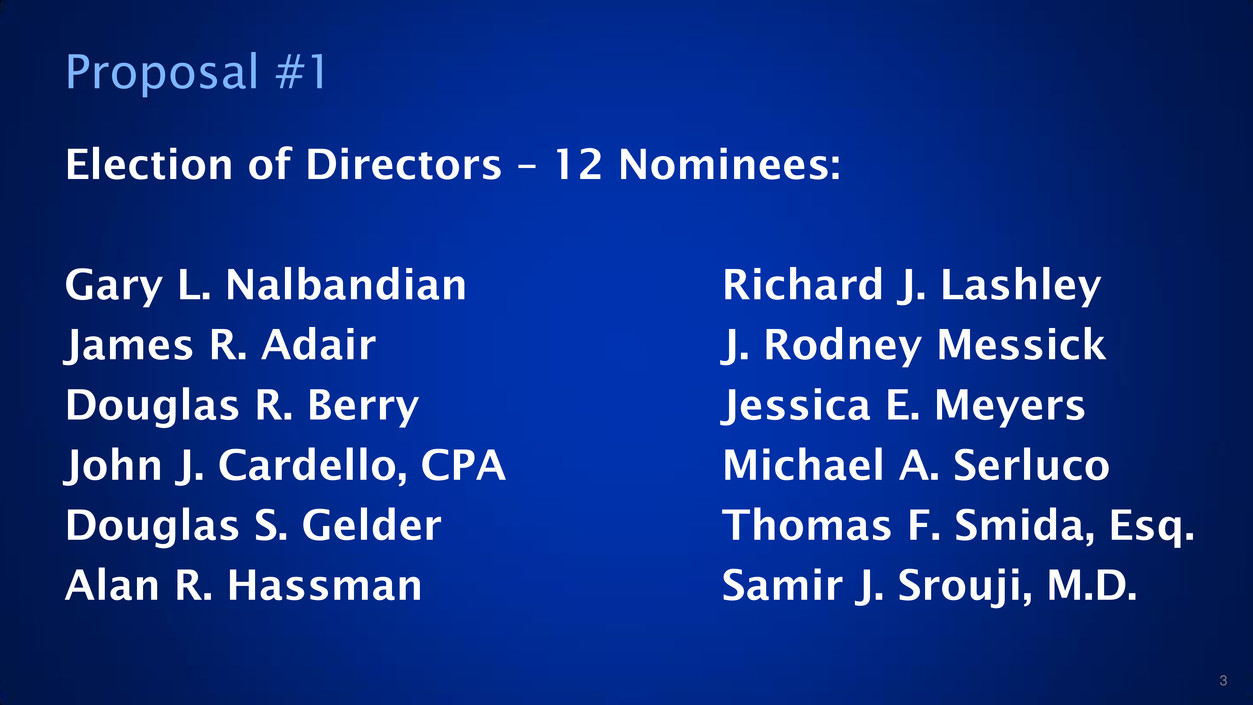
Proposal #1 Election of Directors – 12 Nominees: Gary L. Nalbandian Richard J. Lashley James R. Adair J. Rodney Messick Douglas R. Berry Jessica E. Meyers John J. Cardello, CPA Michael A. Serluco Douglas S. Gelder Thomas F. Smida, Esq. Alan R. Hassman Samir J. Srouji, M.D. 3

Proposal #2 Approval of the 2016 Employee Stock Option and Restricted Stock Plan 4

Proposal #3 Approval of an Amendment to the 2011 Director Stock Option and Restricted Stock Plan 5

Proposal #4 Say-On-Pay Proposal 6

Proposal #5 Ratification of Independent Registered Public Accounting firm 7

Forward-Looking Statements This presentation contains projections and other forward-looking statements regarding future events, strategic corporate objectives or the future financial performance of Metro. We wish to caution you that these forward-looking statements may differ materially from actual results due to a number of risks and uncertainties. For a more detailed description of the factors that may affect Metro’s operating results, we refer you to our filings with the Securities and Exchange Commission, including our annual report on Form 10-K for the year ended December 31, 2014 and our quarterly report on Form 10-Q for the quarter ended March 31, 2015 as well as other periodic and current reports on Form 8-K filed with the SEC. Metro assumes no obligation to update the forward-looking statements made during this presentation. For more information please visit our Website at: www.mymetrobank.com. 8

2014 HIGHLIGHTS

2014 Performance Highlights • Continued strong momentum • Solid growth in total loans, deposits, revenue, net income and EPS – Net loan growth of $246 million, or 14% – Deposit growth of $141 million, or 6% – Revenue growth of $6.2 million, or 5% – Net income growth of $3.8 million, or 22% – Increase in EPS of $0.26, or 22% • Increase in common stock price by 20% 10
Shareholder Value The Board of Directors and Management remain committed to enhancing shareholder value. Our earnings improvement and our capital strength supported our decision in October 2014 to announce a series of initiatives to bring even greater return to our shareholders. 11

• The initiation of an annual cash dividend of $0.28 per common share, beginning in the first quarter of 2015 • A 5% share repurchase program, beginning in the fourth quarter of 2014 • An estimated $3 million reduction of annual operating expenses, when completed • A delay in the development of two branch locations, saving approximately $650,000 in expenses in 2015 and $1.4 million in 2016 • The redemption of $15 million of outstanding Trust Preferred Securities (“TruPS”), completed in September 2014, saving approximately $1.1 million in annual interest expense • The appointment of three new qualified and independent board members Announced New Strategic Initiatives 12

2015 Key Priorities Enhance long-term shareholder value by: • Utilizing the strength of our balance sheet • Increasing revenue through quality organic loan growth, deposit growth and fee income growth • Growing market share – customers, households and share of wallet • Diligently managing asset quality as well as other enterprise risks • Improving EPS and ROE by increasing revenue, controlling expenses and managing capital 13

2.4 2.6 2.8 3.1 3.4 3.7 3.0 3.3 3.6 3.9 4.3 4.7 0.0 1.0 2.0 3.0 4.0 5.0 6.0 2014 2015 2016 2017 2018 2019 Deposits Assets Loans $ 2015 – 2019 Projected $ in Billions Five Year Projected Growth 14

FINANCIAL REVIEW
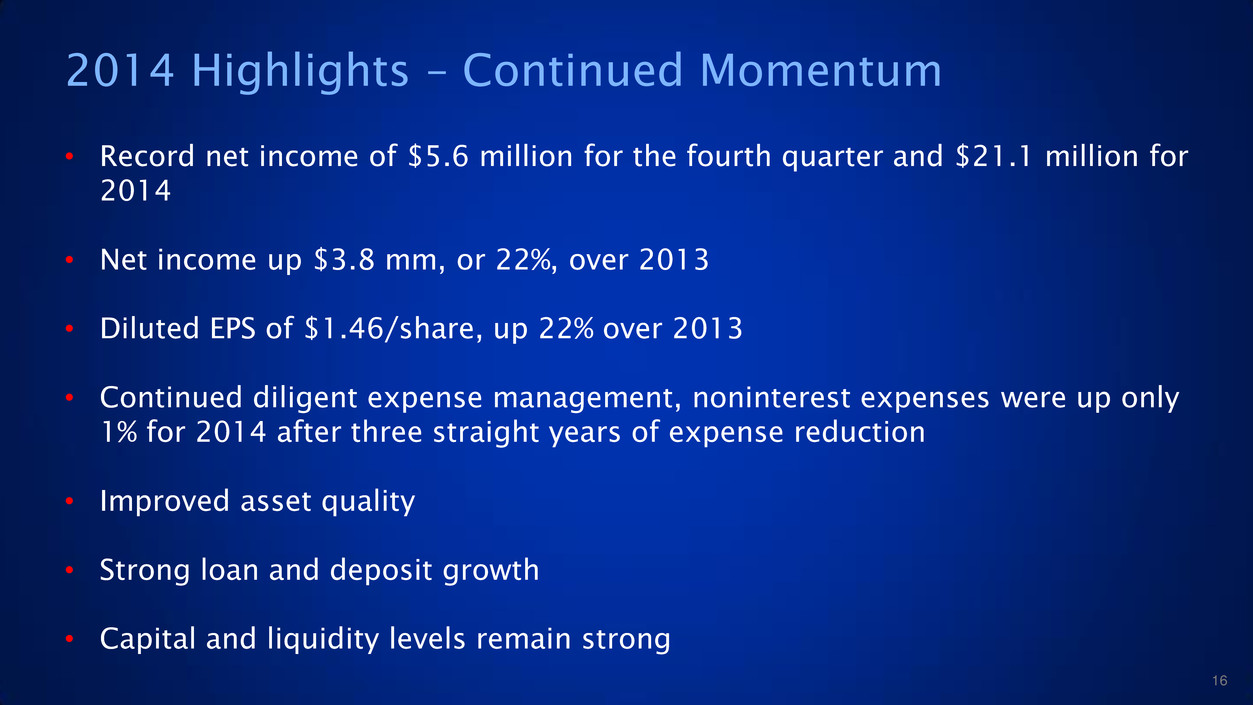
2014 Highlights – Continued Momentum • Record net income of $5.6 million for the fourth quarter and $21.1 million for 2014 • Net income up $3.8 mm, or 22%, over 2013 • Diluted EPS of $1.46/share, up 22% over 2013 • Continued diligent expense management, noninterest expenses were up only 1% for 2014 after three straight years of expense reduction • Improved asset quality • Strong loan and deposit growth • Capital and liquidity levels remain strong 16

Continuously Improving Profitability $0 $5,000 $10,000 $15,000 $20,000 $25,000 $30,000 2011 2012 2013 2014 $289 $10,894 $17,260 $21,085 Net Income 0.13% 7.41% 8.46% $ in 000’s Return on Average Stockholders’ Equity 4.76% 17

ROE and EPS 0.13% 4.76% 7.41% 8.46% $0.02 $0.77 $1.20 $1.46 $0.00 $0.50 $1.00 $1.50 $2.00 0.00% 2.00% 4.00% 6.00% 8.00% 10.00% 2011 2012 2013 2014 E P S R O A ROE EPS 18

Revenue Growth $0 $20 $40 $60 $80 $100 $120 $140 $160 2011 2012 2013 2014 Net Interest Income NonInterest Income $ in Millions $113.5 $117.1 $121.3 $127.5 CAGR = Compounded Average Growth Rate 19

Prudent Expense Management $ in 000’s 2011 2012 2013 2014 Salaries & Employee Benefits $ 40,318 $ 41,241 $ 42,806 $ 44,381 Occupancy & Equipment 14,620 13,281 13,250 12,370 Advertising / Marketing 1,827 1,533 1,685 1,737 Data Processing 14,211 13,590 12,838 13,538 Regulatory assessments & related costs 3,638 4,063 2,227 2,205 Other expenses 19,400 17,436 17,063 16,317 Total $ 94,014 $ 91,144 $ 89,869 $ 90,548 • Expenses decreased three consecutive years from 2011 through 2013 • Efficiency Ratio continues to improve 82.9% Efficiency Ratio 77.9% 74.1% 71.0% 20

Growth With Cost Control $2,000,000 $2,250,000 $2,500,000 $2,750,000 $3,000,000 $3,250,000 $88,000 $90,000 $92,000 $94,000 $96,000 $98,000 $100,000 2010 2011 2012 2013 2014 Non Interest Expense Total Assets $ in 000’s Expenses Asset Size 21
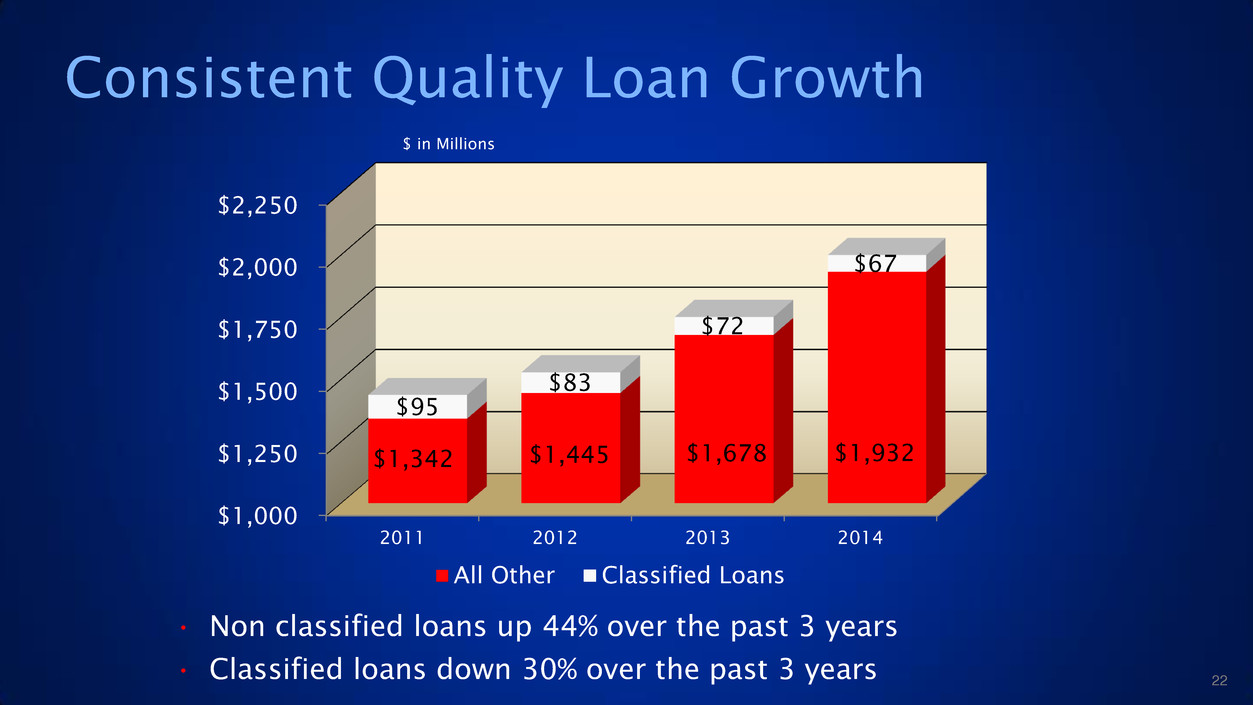
Consistent Quality Loan Growth $1,000 $1,250 $1,500 $1,750 $2,000 $2,250 2011 2012 2013 2014 $1,342 $1,445 $1,678 $1,932 $95 $83 $72 $67 All Other Classified Loans $ in Millions • Non classified loans up 44% over the past 3 years • Classified loans down 30% over the past 3 years 22

Commercial Real Estate 30% Commercial & Industrial 27% Consumer/ Residential 17% Owner Occupied 16% Commercial Tax Exempt 3% Commercial Construction & Land Development 7% Total Loans = $2,004 million Source: Loan data per company reports as of 3/31/15 Loan Portfolio Mix Well Diversified – No Significant Loan Concentrations 23

Source: Loan data per company reports as of 3/31/15 Loan Performance 30-59 Days Past Due 1% 60-89 Days Past Due 0% Nonaccrual and 90 Days Past Due 1% Current 98% • Current loans =$1.96 billion • Noncurrent loans =$43.7 million 24
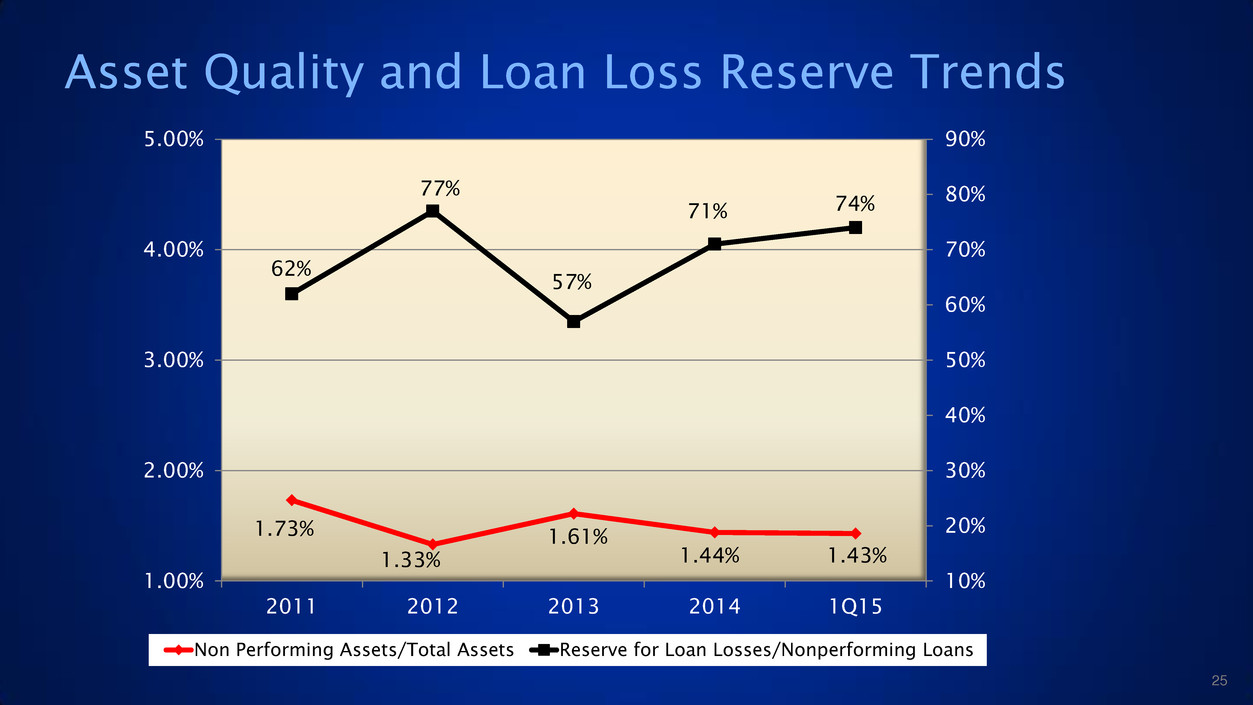
Asset Quality and Loan Loss Reserve Trends 1.73% 1.33% 1.61% 1.44% 1.43% 62% 77% 57% 71% 74% 10% 20% 30% 40% 50% 60% 70% 80% 90% 1.00% 2.00% 3.00% 4.00% 5.00% 2011 2012 2013 2014 1Q15 Non Performing Assets/Total Assets Reserve for Loan Losses/Nonperforming Loans 25

Average Deposits per store = $70.8 million Source: Deposit data per company reports as of 3/31/15; Dollar figures in thousands Deposit Mix 26 DDA Non- Interest Checking $561,232 23% DDA & Interest Bearing $791,239 33% MMDA & Savings $754,044 31% Retail Time $128,777 6% Public Time & Brokered $176,227 7%

Strong Core Deposit Foundation 95% 95% 95% 94% 80% 85% 90% 95% 100% 2011 2012 2013 2014 Source: UBPR as of 12/31/2014 PA peers include all Commercial Banks headquartered in PA; U.S. Peers include public banks with assets between $1 - $3 billion (1) Core Deposits = Total deposits less public time deposits and brokered deposits. • Metro continues to maintain over 90% core deposits, well above both the State and National peer groups. • Average life of Metro core transaction account is 9.6 years! Core Deposits (1) / Total Deposits (%) METR PA Peers U.S. Peers 27

Total Assets $1,000 $1,500 $2,000 $2,500 $3,000 $3,500 $4,000 $4,500 2013 2014 2015 2016 2017 $2,781 $2,998 $3,276 $3,598 $3,934 $ in Millions Projected 28

Total Loans (net) $1,000 $1,500 $2,000 $2,500 $3,000 2013 2014 2015 2016 2017 $1,728 $1,974 $2,217 $2,456 $2,703 $ in Millions Projected 29
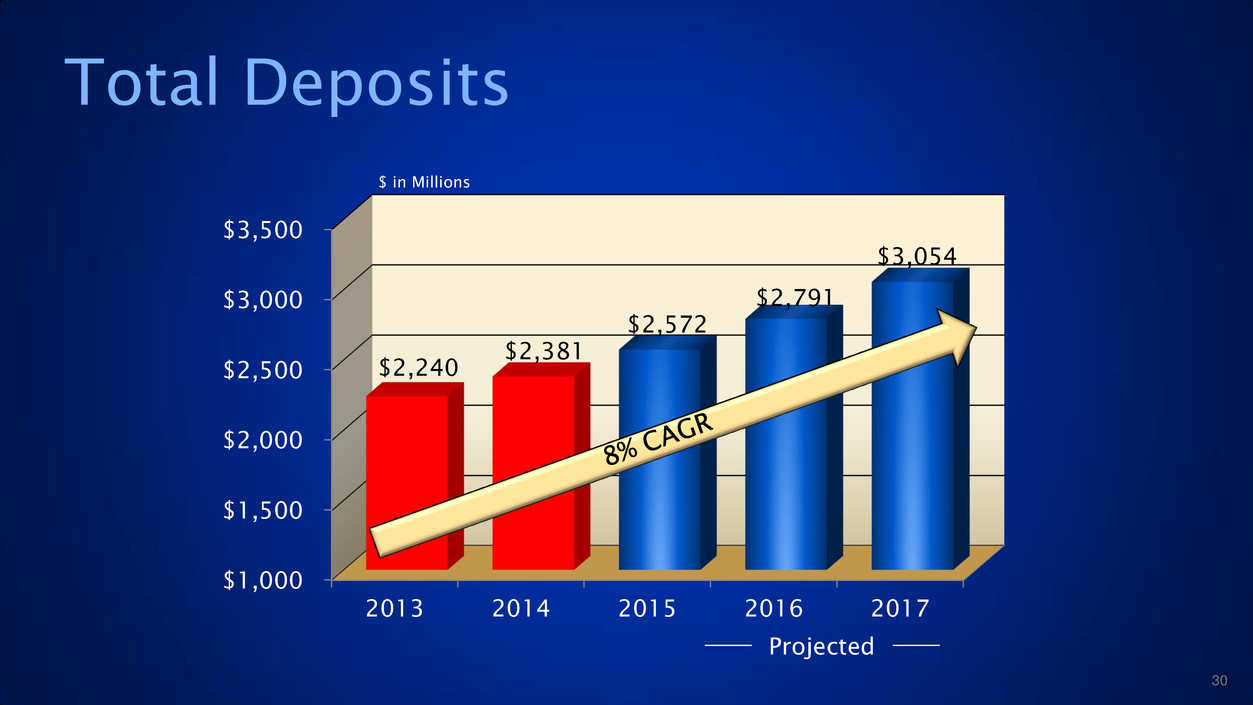
Total Deposits $1,000 $1,500 $2,000 $2,500 $3,000 $3,500 2013 2014 2015 2016 2017 $2,240 $2,381 $2,572 $2,791 $3,054 $ in Millions Projected 30

Strong Capital Position • Metro’s capital levels are far above the requirements for a well- capitalized bank • We have plenty of capital to leverage our growth As of 12/31/14: Regulatory Minimums for Well Capitalized Metro Bancorp Consolidated Metro Bank Peer Group (1) Leverage Ratio 5.00% 9.00% 8.40% 9.80% Risk Based Tier 1 6.00% 12.28% 11.45% 13.63% Risk Based Total 10.00% 13.42% 12.59% 14.76% (1) Source: UBPR as of 12/31/14; Peer Group includes banks having between $1 billion and $3 billion in assets 31

Common Stock 0% 50% 100% 150% 200% 250% 12/31/11 12/31/12 12/31/13 12/31/14 METR NASDAQ Bank Index Russell 2000 Financial Services Index 209% 76% 72% 32
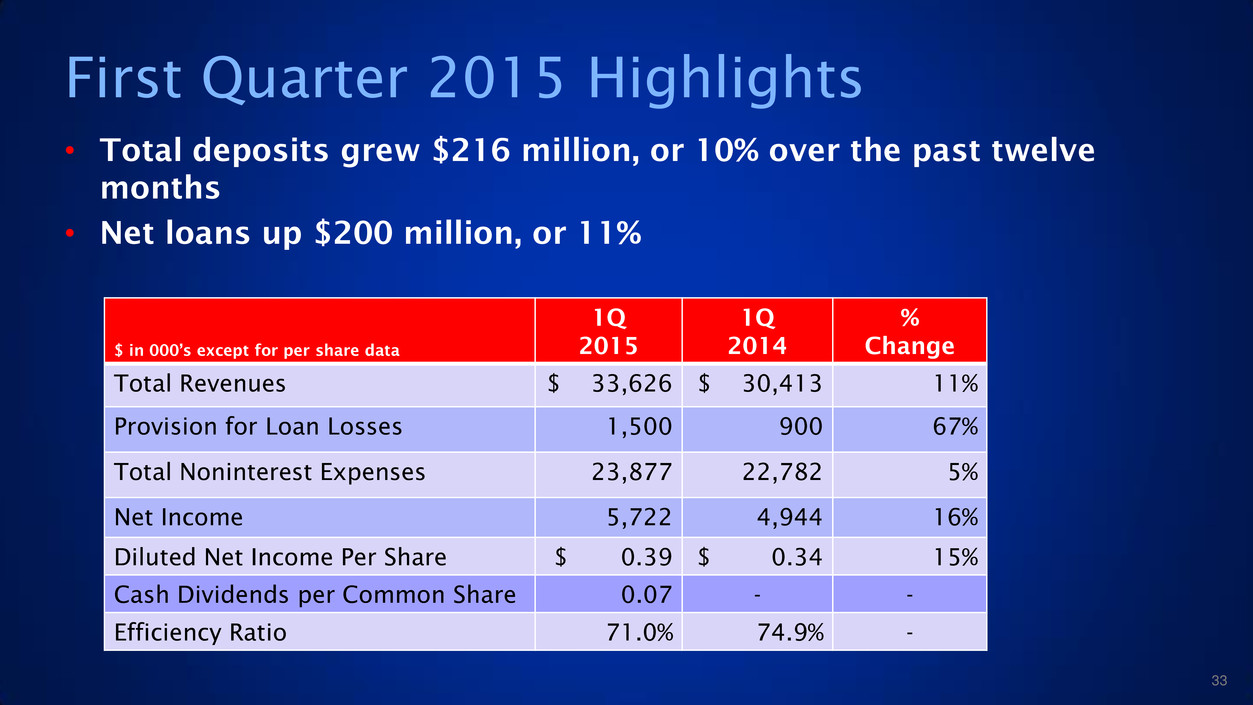
First Quarter 2015 Highlights • Total deposits grew $216 million, or 10% over the past twelve months • Net loans up $200 million, or 11% $ in 000’s except for per share data 1Q 2015 1Q 2014 % Change Total Revenues $ 33,626 $ 30,413 11% Provision for Loan Losses 1,500 900 67% Total Noninterest Expenses 23,877 22,782 5% Net Income 5,722 4,944 16% Diluted Net Income Per Share $ 0.39 $ 0.34 15% Cash Dividends per Common Share 0.07 - - Efficiency Ratio 71.0% 74.9% - 33

Quarterly Net Income and Earnings Per Share $ in Millions, except for per share data • Continuous core earnings progress 34 $3.6 $4.0 $4.7 $4.9 $4.9 $5.1 $5.5 $5.6 $5.7 0.26 0.28 0.32 0.34 0.34 0.35 0.38 0.38 0.39 $0.20 $0.25 $0.30 $0.35 $0.40 $0.45 $2.0 $3.0 $4.0 $5.0 $6.0 1Q13 2Q13 3Q13 4Q13 1Q14 2Q14 3Q14 4Q14 1Q15 Net Income Earnings per share

Annual Shareholders’ Meeting June 19, 2015
Serious News for Serious Traders! Try StreetInsider.com Premium Free!
You May Also Be Interested In
- Inverite AI Open Banking Platform Achieves Record Transactions in Q1-2024
- Parks Associates: 29% of Former Demand Response (DR) Participants Say They Left The Program Because It Was No Longer Available
- Schneider Electric Sustainability Impact Program Continues Progressing in Q1 2024
Create E-mail Alert Related Categories
SEC FilingsSign up for StreetInsider Free!
Receive full access to all new and archived articles, unlimited portfolio tracking, e-mail alerts, custom newswires and RSS feeds - and more!


 Tweet
Tweet Share
Share