

Form 8-K MEDICAL PROPERTIES TRUST For: Aug 04
 Tweet
Tweet Share
Share
UNITED STATES
SECURITIES AND EXCHANGE COMMISSION
WASHINGTON, D.C. 20549
FORM 8-K
CURRENT REPORT
PURSUANT TO SECTION 13 OR 15(d) OF THE
SECURITIES EXCHANGE ACT OF 1934
Date of report (Date of earliest event reported): August 4, 2016
MEDICAL PROPERTIES TRUST, INC.
(Exact Name of Registrant as Specified in Charter)
Commission File Number 001-32559
| Maryland | 20-0191742 | |
| (State or other jurisdiction of incorporation or organization) |
(I.R.S. Employer Identification No.) |
| 1000 Urban Center Drive, Suite 501 Birmingham, AL |
35242 | |
| (Address of principal executive offices) | (Zip Code) |
Registrant’s telephone number, including area code
(205) 969-3755
Check the appropriate box below if the Form 8-K filing is intended to simultaneously satisfy the filing obligation of the Registrant under any of the following provisions:
| ¨ | Written communications pursuant to Rule 425 under the Securities Act (17 CFR 230.425) |
| ¨ | Soliciting material pursuant to Rule 14a-12 under the Exchange Act (17 CFR 240.14a-12) |
| ¨ | Pre-commencement communications pursuant to Rule 14d-2(b) under the Exchange Act (17 CFR 240.14d-2(b)) |
| ¨ | Pre-commencement communications pursuant to Rule 13e-4(c) under the Exchange Act (17 CFR 240.13e-4(c)) |
Item 2.02. Results of Operations and Financial Condition.
On August 4, 2016, Medical Properties Trust, Inc. issued a press release announcing its financial results for the three and six months ended June 30, 2016. A copy of the press release is attached as Exhibit 99.1 to this Current Report on Form 8-K and is incorporated herein by reference. The information in this Current Report on Form 8-K, including the information set forth in Exhibit 99.1 and Exhibit 99.2 attached hereto, shall not be deemed “filed” for purposes of Section 18 of the Securities Exchange Act of 1934, as amended, or otherwise subject to the liability of that section or Sections 11 and 12(a)(2) of the Securities Act of 1933, as amended. In addition, this information shall not be deemed incorporated by reference in any filing of Medical Properties Trust, Inc. with the Securities and Exchange Commission, except as expressly set forth by specific reference in any such filing.
The Company disclosed three non-GAAP financial measures in the attached press release for the three and six months ended June 30, 2016: Funds from operations, Normalized funds from operations and Adjusted funds from operations. The most directly comparable GAAP financial measure to each of these non-GAAP financial measures is net income, which was $53.7 million, or $0.22 per diluted share for the three months ended June 30, 2016 compared to $22.4 million, or $0.11 per diluted share for the three months ended June 30, 2015. For the six months ended June 30, 2016 net income was $111.7 million, or $0.47 per diluted share compared to $58.3 million, or $0.28 per diluted share for the six months ended June 30, 2015. In the attached press release, the Company disclosed Funds from operations of $54.3 million and $133.5 million for the three and six months ended June 30, 2016, respectively, and Normalized funds from operations of $75.5 million and $159.0 million for three and six months ended June 30, 2016, respectively. Adjusted funds from operations were disclosed in the press release as $67.9 million and $143.8 million for the three and six months ended June 30, 2016, respectively.
A reconciliation of the non-GAAP financial measures to net income as well as a statement disclosing the reasons why the Company’s management believes that presentation of these non-GAAP financial measures provides useful information to investors regarding the Company’s financial condition and results of operations are included in Exhibits 99.1 and 99.2.
Item 9.01. Financial Statements and Exhibits.
(d) Exhibits.
| Exhibit Number |
Description | |
| 99.1 | Press release dated August 4, 2016 reporting financial results for the three and six months ended June 30, 2016 | |
| 99.2 | Medical Properties Trust, Inc. 2nd Quarter 2016 Supplemental Information | |
2
SIGNATURES
Pursuant to the requirements of the Securities Exchange Act of 1934, as amended, the registrant has duly caused this report to be signed on its behalf by the undersigned hereunder duly authorized.
| MEDICAL PROPERTIES TRUST, INC. | ||
| By: | /s/ R. Steven Hamner | |
| Name: | R. Steven Hamner | |
| Title: | Executive Vice President and Chief Financial Officer | |
Date: August 4, 2016
3
INDEX TO EXHIBITS
| Exhibit Number |
Description | |
| 99.1 | Press release dated August 4, 2016 reporting financial results for the three and six months ended June 30, 2016 | |
| 99.2 | Medical Properties Trust, Inc. 2nd Quarter 2016 Supplemental Information | |
4
Exhibit 99.1

Contact: Tim Berryman
Director – Investor Relations
Medical Properties Trust, Inc.
(205) 969-3755
MEDICAL PROPERTIES TRUST, INC. REPORTS SECOND QUARTER RESULTS
Net Income Up 100% to $0.22 Per Share on Gains on Sales; Normalized FFO Per Share Increased 7% to $0.32
Strong Balance Sheet, Low Leverage and $1.5 Billion in Liquidity Position Company for
Accelerating Asset, Cash Flow and Dividend Growth
Birmingham, AL – August 4, 2016 – Medical Properties Trust, Inc. (the “Company” or “MPT”) (NYSE: MPW) today announced financial and operating results for the second quarter ended June 30, 2016.
“We are very pleased to have successfully executed our repositioning and deleveraging strategy, strengthening our balance sheet and reducing leverage to our targeted range of 5.0 to 5.5 times debt to EBITDA,” said Edward K. Aldag, Jr., MPT’s Chairman, President and Chief Executive Officer. “Our recent asset sales have demonstrated the significant value in our portfolio with exit cap rates on select properties in the 6.5 to 7.0 percent range as compared to initial cash rates of 9.5 to 10.0 percent. The cash proceeds from our asset sales and the recent sales of common stock under our at-the-market program have provided us $1.5 billion in liquidity for our expanding pipeline as we continue to invest with best-in-class hospital operators offering significant long-term growth potential for MPT and our shareholders. We are well-positioned to pursue value-creating, accretive acquisitions in a largely untapped hospital real estate market that is estimated to be a half-trillion dollars in size,” said Aldag.
SECOND QUARTER AND RECENT HIGHLIGHTS
| • | Completed sales of five long-term acute care hospitals (“LTACH”) and one inpatient rehabilitation hospital (“IRF”) for a total of $89.7 million, realizing gains of approximately 36% and contributing to net income in the quarter totaling $0.22 per share, a 100% gain over 2015’s second quarter; |
| • | Sold three IRFs in July at valuations equivalent to a 6.7% capitalization rate, generating proceeds exceeding $111.5 million and gains of approximately $45 million, all of which were deferred for capital gains tax purposes; |
1
| • | Reduced debt to among the best in healthcare REIT sector at 5.4 times EBITDA with the help of asset sales which further demonstrated the substantial unrealized value in MPT’s portfolio; LTACH exposure reduced to 7% of total assets; |
| • | Generated Normalized Funds from Operations (“FFO”) per diluted share of $0.32 in the second quarter, up 7% compared to $0.30 per share reported in the second quarter of 2015; |
| • | Acquired for €41.6 ($47.0) million a 73-bed general acute hospital in Heidelberg, Germany operated by MEDIAN Kliniken, finalizing the 2014 sale and leaseback agreements with MEDIAN; |
| • | Completed construction of two Adeptus First Choice ER (“Adeptus”) facilities in the second quarter at an aggregate cost of approximately $11.7 million and commenced rent; at end of second quarter, MPT was collecting rent from 42 Adeptus facilities with 14 more under construction and six undergoing pre-construction diligence reviews; |
| • | Sold 5.8 million shares of common stock under the Company’s at-the-market program generating proceeds of approximately $85.7 million during the months of June and July; |
| • | Issued $500 million in unsecured 5.250% Senior Notes due 2026 to fund the redemption of all of the $450 million aggregate principal amount of the Company’s existing 6.875% Senior Notes due 2021, including premium and accrued and unpaid interest; |
| • | Previously announced second quarter transactions include the $63 million acquisition of the St. Michael’s hospital in Newark and completion of a $20 million Toledo, Ohio IRF. In addition, the Company sold at par value its $50 million of notes acquired as part of the recent sale of Capella Health affiliates to RCCH Healthcare. |
Included in the financial tables accompanying this press release is information about the Company’s assets and liabilities, net income and reconciliations of net income to FFO and Adjusted Funds from Operations (“AFFO”), all on a basis comparable to 2015 results.
PORTFOLIO UPDATE
During and after the second quarter, and as described above, MPT sold real estate totaling approximately $201 million and unsecured notes receivable for $50 million. In aggregate, these transactions demonstrated the high quality and desirability of MPT assets, even those in a currently out-of-favor market such as LTACHs, which now represent less than 7% of MPT’s total assets. In addition, the $111.5 million sale of three IRFs to an institutional investor financed with bank debt proved the quality of MPT’s underwriting with a 31% compression of cap rates from an initial cash rate of 9.7% in 2010 to a 6.7% rate. With the proceeds of these transactions and proceeds from common shares sold during and after the quarter, MPT has reduced its debt and now has a sector-leading net debt to EBITDA multiple of 5.4 times.
MPT made investments in hospital real estate and commenced rent on development projects totaling approximately $140 million and leased to operators under long term absolute net leases with GAAP lease rates of between approximately 9.0% and 10.5%.
In addition, in July, MPT entered into an expanded agreement with affiliates of MEDIAN and third parties to acquire and lease to MEDIAN the real estate of various non-acute hospitals in
2
Germany. The acquisitions, which are subject to certain conditions, including Federal Cartel Office (antitrust) clearance, are expected to close commencing in the fourth quarter of 2016 through year end 2017. MPT also expects to acquire from and lease back to MEDIAN certain additional facilities that, while not under binding agreement, are expected to close during the fourth quarter of 2016. MPT will also make additional investments in the equity of MEDIAN to maintain its 5.1% interest. The properties are expected to be joined to the existing or a new master lease agreement with MEDIAN.
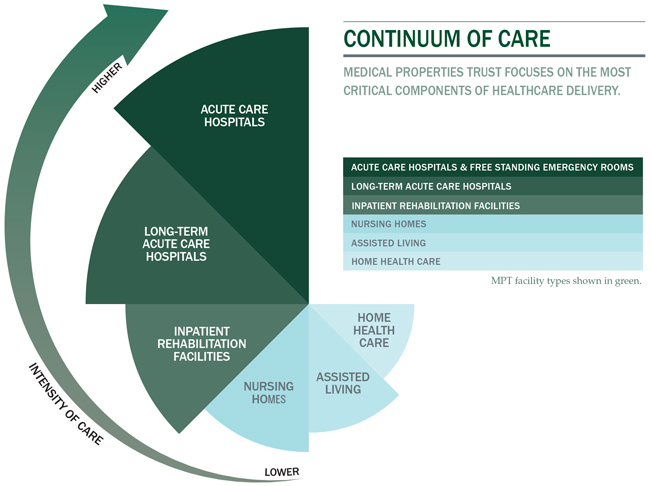
The Company has total gross assets of approximately $5.4 billion including $3.4 billion in general acute care hospitals, $1.4 billion in inpatient rehabilitation hospitals, and $0.4 billion in long-term acute care hospitals. The portfolio includes 207 properties representing more than 21,000 licensed beds in 29 states and in Germany, the United Kingdom, Italy and Spain. The properties are leased to or mortgaged by 27 hospital operating companies.
OPERATING RESULTS AND OUTLOOK
Net income for the second quarter of 2016 was $53.7 million (or $0.22 per diluted share), compared to $22.4 million (or $0.11 per diluted share) in the second quarter of 2015. Net income for the second quarter of 2016 includes a net gain of $16.6 million on the sale of real estate and other asset dispositions. Net income for the second quarter of 2015 included $25.8 million in acquisition expenses, of which approximately $21 million was from real estate transfer taxes related to MEDIAN properties acquired in 2015.
Normalized FFO for 2016’s second quarter increased 20% to $75.5 million compared with $62.9 million in the second quarter of 2015. Per share Normalized FFO increased 7% to $0.32 per diluted share in the second quarter compared with $0.30 per share in the second quarter of 2015.
Based on management’s present investment, capital and operating strategies, and the expected timing of each, management estimates that 2016 net income will range from $0.98 to $1.01 per share and reaffirms estimates that 2016 Normalized FFO will range from $1.29 to $1.33 per share. A reconciliation of our Normalized FFO guidance to our net income (on a GAAP basis) is included with the financial tables accompanying this press release.
This estimate does not include the effects, if any, of unexpected real estate operating costs, litigation costs, debt refinancing costs, acquisition costs, currency exchange rate movements, interest rate hedging activities, write-offs of straight-line rent or other non-recurring or unplanned transactions. These estimates may change if the Company acquires or sells assets, market interest rates change, debt is refinanced, new shares are issued, additional debt is incurred, other operating expenses vary, income from investments in tenant operations vary from expectations, or existing leases do not perform in accordance with their terms.
CONFERENCE CALL AND WEBCAST
The Company has scheduled a conference call and webcast for Thursday, August 4, 2016 at 11:00 a.m. Eastern Time to present the Company’s financial and operating results for the quarter ended June 30, 2016. The dial-in numbers for the conference call are 855-365-5214 (U.S.) and
3
440-996-5721 (international); both numbers require passcode 48570788. The conference call will also be available via webcast in the Investor Relations’ section of the Company’s website, www.medicalpropertiestrust.com.
A telephone and webcast replay of the call will be available beginning shortly after the call’s completion through August 18, 2016. Dial-in numbers for the replay are 855-859-2056 and 404-537-3406 for U.S. and international callers, respectively. The replay passcode for both U.S. and international callers is 48570788.
The Company’s supplemental information package for the current period will also be available on the Company’s website under the “Investor Relations” section.
About Medical Properties Trust, Inc.
Medical Properties Trust, Inc. is a self-advised real estate investment trust formed to capitalize on the changing trends in healthcare delivery by acquiring and developing net-leased healthcare facilities. MPT’s financing model allows hospitals and other healthcare facilities to unlock the value of their underlying real estate in order to fund facility improvements, technology upgrades, staff additions and new construction. Facilities include acute care hospitals, inpatient rehabilitation hospitals, long-term acute care hospitals, and other medical and surgical facilities. For more information, please visit the Company’s website at www.medicalpropertiestrust.com.
The statements in this press release that are forward looking are based on current expectations and actual results or future events may differ materially. Words such as “expects,” “believes,” “anticipates,” “intends,” “will,” “should” and variations of such words and similar expressions are intended to identify such forward-looking statements. Forward-looking statements involve known and unknown risks, uncertainties and other factors that may cause the actual results of the Company or future events to differ materially from those expressed in or underlying such forward-looking statements, including without limitation: the satisfaction of all conditions to, and the timely closing (if at all) of pending transactions; net income per share; Normalized FFO per share; the amount of acquisitions of healthcare real estate, if any; results from the potential sales, if any, of assets; capital markets conditions; estimated leverage metrics; the repayment of debt arrangements; statements concerning the additional income to the Company as a result of ownership interests in certain hospital operations and the timing of such income; the payment of future dividends, if any; completion of additional debt arrangements, and additional investments; national and international economic, business, real estate and other market conditions; the competitive environment in which the Company operates; the execution of the Company’s business plan; financing risks; the Company’s ability to maintain its status as a REIT for federal income tax purposes; acquisition and development risks; potential environmental and other liabilities; and other factors affecting the real estate industry generally or healthcare real estate in particular. For further discussion of the factors that could affect outcomes, please refer to the “Risk factors” section of the Company’s Annual Report on Form 10-K for the year ended December 31, 2015 and as updated by the Company’s subsequently filed Quarterly Reports on Form 10-Q and other SEC filings. Except as otherwise required by the federal securities laws, the Company undertakes no obligation to update the information in this press release.
# # #
4
MEDICAL PROPERTIES TRUST, INC. AND SUBSIDIARIES
Consolidated Balance Sheets
| (Amounts in thousands, except for per share data) | June 30, 2016 | December 31, 2015 | ||||||
| Assets |
(Unaudited) | (A) | ||||||
| Real estate assets |
||||||||
| Land, buildings and improvements, intangible lease assets, and other |
$ | 3,482,199 | $ | 3,297,705 | ||||
| Real estate held for sale |
63,074 | — | ||||||
| Net investment in direct financing leases |
528,747 | 626,996 | ||||||
| Mortgage loans |
549,337 | 757,581 | ||||||
|
|
|
|
|
|||||
| Gross investment in real estate assets |
4,623,357 | 4,682,282 | ||||||
| Accumulated depreciation and amortization |
(278,590 | ) | (257,928 | ) | ||||
|
|
|
|
|
|||||
| Net investment in real estate assets |
4,344,767 | 4,424,354 | ||||||
| Cash and cash equivalents |
181,561 | 195,541 | ||||||
| Interest and rent receivables |
47,699 | 46,939 | ||||||
| Straight-line rent receivables |
95,988 | 82,155 | ||||||
| Other assets |
447,918 | 860,362 | ||||||
|
|
|
|
|
|||||
| Total Assets |
$ | 5,117,933 | $ | 5,609,351 | ||||
|
|
|
|
|
|||||
| Liabilities and Equity |
||||||||
| Liabilities |
||||||||
| Debt, net |
$ | 2,758,635 | $ | 3,322,541 | ||||
| Accounts payable and accrued expenses |
148,218 | 137,356 | ||||||
| Deferred revenue |
20,997 | 29,358 | ||||||
| Lease deposits and other obligations to tenants |
22,845 | 12,831 | ||||||
|
|
|
|
|
|||||
| Total Liabilities |
2,950,695 | 3,502,086 | ||||||
| Equity |
||||||||
| Preferred stock, $0.001 par value. Authorized 10,000 shares; no shares outstanding |
— | — | ||||||
| Common stock, $0.001 par value. Authorized 500,000 shares; issued and outstanding — 240,341 shares at June 30, 2016 and 236,744 shares at December 31, 2015 |
240 | 237 | ||||||
| Additional paid in capital |
2,642,281 | 2,593,827 | ||||||
| Distributions in excess of net income |
(414,657 | ) | (418,650 | ) | ||||
| Accumulated other comprehensive loss |
(65,340 | ) | (72,884 | ) | ||||
| Treasury shares, at cost |
(262 | ) | (262 | ) | ||||
|
|
|
|
|
|||||
| Total Medical Properties Trust, Inc. Stockholders’ Equity |
2,162,262 | 2,102,268 | ||||||
|
|
|
|
|
|||||
| Non-controlling interests |
4,976 | 4,997 | ||||||
|
|
|
|
|
|||||
| Total Equity |
2,167,238 | 2,107,265 | ||||||
|
|
|
|
|
|||||
| Total Liabilities and Equity |
$ | 5,117,933 | $ | 5,609,351 | ||||
|
|
|
|
|
|||||
| (A) | Financials have been derived from the prior year audited financial statements. |
MEDICAL PROPERTIES TRUST, INC. AND SUBSIDIARIES
Consolidated Statements of Income
(Unaudited)
| (Amounts in thousands, except for per share data) | For the Three Months Ended | For the Six Months Ended | ||||||||||||||
| June 30, 2016 | June 30, 2015 | June 30, 2016 | June 30, 2015 | |||||||||||||
| Revenues |
||||||||||||||||
| Rent billed |
$ | 77,960 | $ | 53,893 | $ | 152,021 | $ | 106,994 | ||||||||
| Straight-line rent |
8,551 | 5,252 | 16,768 | 9,980 | ||||||||||||
| Income from direct financing leases |
13,552 | 12,808 | 32,503 | 25,363 | ||||||||||||
| Interest and fee income |
26,237 | 27,848 | 60,007 | 53,425 | ||||||||||||
|
|
|
|
|
|
|
|
|
|||||||||
| Total revenues |
126,300 | 99,801 | 261,299 | 195,762 | ||||||||||||
| Expenses |
||||||||||||||||
| Real estate depreciation and amortization |
22,832 | 14,956 | 43,974 | 29,712 | ||||||||||||
| Impairment charges |
7,375 | — | 7,375 | — | ||||||||||||
| Property-related |
784 | 530 | 1,685 | 881 | ||||||||||||
| Acquisition expenses |
4,767 | 25,809 | 3,702 | 32,048 | ||||||||||||
| General and administrative |
12,045 | 10,642 | 23,516 | 21,547 | ||||||||||||
|
|
|
|
|
|
|
|
|
|||||||||
| Total operating expenses |
47,803 | 51,937 | 80,252 | 84,188 | ||||||||||||
|
|
|
|
|
|
|
|
|
|||||||||
| Operating income |
78,497 | 47,864 | 181,047 | 111,574 | ||||||||||||
| Interest expense |
(41,501 | ) | (26,890 | ) | (80,874 | ) | (53,556 | ) | ||||||||
| Gain on sale of real estate and other asset dispositions, net |
16,638 | — | 16,678 | — | ||||||||||||
| Other income (expense) |
654 | 2,078 | (4,018 | ) | 1,385 | |||||||||||
| Income tax expense |
(364 | ) | (563 | ) | (683 | ) | (938 | ) | ||||||||
|
|
|
|
|
|
|
|
|
|||||||||
| Income from continuing operations |
53,924 | 22,489 | 112,150 | 58,465 | ||||||||||||
| Loss from discontinued operations |
— | — | (1 | ) | — | |||||||||||
|
|
|
|
|
|
|
|
|
|||||||||
| Net income |
53,924 | 22,489 | 112,149 | 58,465 | ||||||||||||
| Net income attributable to non-controlling interests |
(200 | ) | (82 | ) | (498 | ) | (161 | ) | ||||||||
|
|
|
|
|
|
|
|
|
|||||||||
| Net income attributable to MPT common stockholders |
$ | 53,724 | $ | 22,407 | $ | 111,651 | $ | 58,304 | ||||||||
|
|
|
|
|
|
|
|
|
|||||||||
| Earnings per common share – basic: |
||||||||||||||||
| Income from continuing operations |
$ | 0.23 | $ | 0.11 | $ | 0.47 | $ | 0.28 | ||||||||
| Loss from discontinued operations |
— | — | — | — | ||||||||||||
|
|
|
|
|
|
|
|
|
|||||||||
| Net income attributable to MPT common stockholders |
$ | 0.23 | $ | 0.11 | $ | 0.47 | $ | 0.28 | ||||||||
|
|
|
|
|
|
|
|
|
|||||||||
| Earnings per common share – diluted: |
||||||||||||||||
| Income from continuing operations |
$ | 0.22 | $ | 0.11 | $ | 0.47 | $ | 0.28 | ||||||||
| Loss from discontinued operations |
— | — | — | — | ||||||||||||
|
|
|
|
|
|
|
|
|
|||||||||
| Net income attributable to MPT common stockholders |
$ | 0.22 | $ | 0.11 | $ | 0.47 | $ | 0.28 | ||||||||
|
|
|
|
|
|
|
|
|
|||||||||
| Dividends declared per common share |
$ | 0.23 | $ | 0.22 | $ | 0.45 | $ | 0.44 | ||||||||
| Weighted average shares outstanding – basic |
238,082 | 208,071 | 237,796 | 205,515 | ||||||||||||
| Weighted average shares outstanding – diluted |
239,008 | 208,640 | 238,413 | 206,127 | ||||||||||||
MEDICAL PROPERTIES TRUST, INC. AND SUBSIDIARIES
Reconciliation of Net Income to Funds From Operations
(Unaudited)
| (Amounts in thousands, except for per share data) | For the Three Months Ended | For the Six Months Ended | ||||||||||||||
| June 30, 2016 | June 30, 2015 | June 30, 2016 | June 30, 2015 | |||||||||||||
| FFO information: |
||||||||||||||||
| Net income attributable to MPT common stockholders |
$ | 53,724 | $ | 22,407 | $ | 111,651 | $ | 58,304 | ||||||||
| Participating securities’ share in earnings |
(132 | ) | (250 | ) | (276 | ) | (516 | ) | ||||||||
|
|
|
|
|
|
|
|
|
|||||||||
| Net income, less participating securities’ share in earnings |
$ | 53,592 | $ | 22,157 | $ | 111,375 | $ | 57,788 | ||||||||
| Depreciation and amortization (A) |
23,335 | 14,956 | 44,807 | 29,712 | ||||||||||||
| Gain on sale of real estate |
(22,613 | ) | — | (22,653 | ) | — | ||||||||||
|
|
|
|
|
|
|
|
|
|||||||||
| Funds from operations |
$ | 54,314 | $ | 37,113 | $ | 133,529 | $ | 87,500 | ||||||||
| Write-off of straight line rent and other |
3,063 | — | 3,063 | — | ||||||||||||
| Transaction costs from non-real estate dispositions |
5,975 | — | 5,975 | — | ||||||||||||
| Acquisition expenses (A) |
4,801 | 25,809 | 9,034 | 32,048 | ||||||||||||
| Impairment charges |
7,375 | — | 7,375 | — | ||||||||||||
| Unutilized financing fees / debt refinancing costs |
— | — | 4 | 238 | ||||||||||||
|
|
|
|
|
|
|
|
|
|||||||||
| Normalized funds from operations |
$ | 75,528 | $ | 62,922 | $ | 158,980 | $ | 119,786 | ||||||||
| Share-based compensation |
1,814 | 2,598 | 3,509 | 5,200 | ||||||||||||
| Debt costs amortization |
2,062 | 1,394 | 3,897 | 2,771 | ||||||||||||
| Additional rent received in advance (B) |
(300 | ) | (300 | ) | (600 | ) | (600 | ) | ||||||||
| Straight-line rent revenue and other |
(11,204 | ) | (6,928 | ) | (22,033 | ) | (13,260 | ) | ||||||||
|
|
|
|
|
|
|
|
|
|||||||||
| Adjusted funds from operations |
$ | 67,900 | $ | 59,686 | $ | 143,753 | $ | 113,897 | ||||||||
|
|
|
|
|
|
|
|
|
|||||||||
| Per diluted share data: |
||||||||||||||||
| Net income, less participating securities’ share in earnings |
$ | 0.22 | $ | 0.11 | $ | 0.47 | $ | 0.28 | ||||||||
| Depreciation and amortization (A) |
0.10 | 0.07 | 0.18 | 0.14 | ||||||||||||
| Gain on sale of real estate |
(0.09 | ) | — | (0.09 | ) | — | ||||||||||
|
|
|
|
|
|
|
|
|
|||||||||
| Funds from operations |
$ | 0.23 | $ | 0.18 | $ | 0.56 | $ | 0.42 | ||||||||
| Write-off of straight line rent and other |
0.01 | — | 0.01 | — | ||||||||||||
| Transaction costs from non-real estate dispositions |
0.03 | — | 0.03 | — | ||||||||||||
| Acquisition expenses (A) |
0.02 | 0.12 | 0.04 | 0.16 | ||||||||||||
| Impairment charges |
0.03 | — | 0.03 | — | ||||||||||||
| Unutilized financing fees / debt refinancing costs |
— | — | — | — | ||||||||||||
|
|
|
|
|
|
|
|
|
|||||||||
| Normalized funds from operations |
$ | 0.32 | $ | 0.30 | $ | 0.67 | $ | 0.58 | ||||||||
| Share-based compensation |
0.01 | 0.01 | 0.01 | 0.03 | ||||||||||||
| Debt costs amortization |
0.01 | 0.01 | 0.01 | 0.01 | ||||||||||||
| Additional rent received in advance (B) |
— | — | — | — | ||||||||||||
| Straight-line rent revenue and other |
(0.06 | ) | (0.03 | ) | (0.09 | ) | (0.07 | ) | ||||||||
|
|
|
|
|
|
|
|
|
|||||||||
| Adjusted funds from operations |
$ | 0.28 | $ | 0.29 | $ | 0.60 | $ | 0.55 | ||||||||
|
|
|
|
|
|
|
|
|
|||||||||
| (A) | Includes our share of real estate depreciation and acquisition expenses from unconsolidated joint ventures (if any). Any such amounts are included with the activity of all of our equity interests in the “Other income (expenses)” line on the consolidated statements of income. |
| (B) | Represents additional rent received from one tenant in advance of when we can recognize as revenue for accounting purposes. This additional rent is being recorded to revenue on a straight-line basis over the lease life. |
Investors and analysts following the real estate industry utilize funds from operations, or FFO, as a supplemental performance measure. FFO, reflecting the assumption that real estate asset values rise or fall with market conditions, principally adjusts for the effects of GAAP depreciation and amortization of real estate assets, which assumes that the value of real estate diminishes predictably over time. We compute FFO in accordance with the definition provided by the National Association of Real Estate Investment Trusts, or NAREIT, which represents net income (loss) (computed in accordance with GAAP), excluding gains (losses) on sales of real estate and impairment charges on real estate assets, plus real estate depreciation and amortization and after adjustments for unconsolidated partnerships and joint ventures.
In addition to presenting FFO in accordance with the NAREIT definition, we also disclose normalized FFO, which adjusts FFO for items that relate to unanticipated or non-core events or activities or accounting changes that, if not noted, would make comparison to prior period results and market expectations less meaningful to investors and analysts. We believe that the use of FFO, combined with the required GAAP presentations, improves the understanding of our operating results among investors and the use of normalized FFO makes comparisons of our operating results with prior periods and other companies more meaningful. While FFO and normalized FFO are relevant and widely used supplemental measures of operating and financial performance of REITs, they should not be viewed as a substitute measure of our operating performance since the measures do not reflect either depreciation and amortization costs or the level of capital expenditures and leasing costs necessary to maintain the operating performance of our properties, which can be significant economic costs that could materially impact our results of operations. FFO and normalized FFO should not be considered an alternative to net income (loss) (computed in accordance with GAAP) as indicators of our financial performance or to cash flow from operating activities (computed in accordance with GAAP) as an indicator of our liquidity.
We calculate adjusted funds from operations, or AFFO, by subtracting from or adding to normalized FFO (i) unbilled rent revenue, (ii) non-cash share-based compensation expense, and (iii) amortization of deferred financing costs. AFFO is an operating measurement that we use to analyze our results of operations based on the receipt, rather than the accrual, of our rental revenue and on certain other adjustments. We believe that this is an important measurement because our leases generally have significant contractual escalations of base rents and therefore result in recognition of rental income that is not collected until future periods, and costs that are deferred or are non-cash charges. Our calculation of AFFO may not be comparable to AFFO or similarly titled measures reported by other REITs. AFFO should not be considered as an alternative to net income (calculated pursuant to GAAP) as an indicator of our results of operations or to cash flow from operating activities (calculated pursuant to GAAP) as an indicator of our liquidity.
MEDICAL PROPERTIES TRUST, INC. AND SUBSIDIARIES
Fiscal Year 2016 Guidance Reconciliation
(Unaudited)
| Fiscal Year 2016 Guidance - Per Share(1) | ||||||||
| Low | High | |||||||
| Net income attributable to MPT common stockholders |
$ | 0.98 | $ | 1.01 | ||||
| Participating securities’ share in earnings |
— | — | ||||||
|
|
|
|
|
|||||
| Net income, less participating securities’ share in earnings |
$ | 0.98 | $ | 1.01 | ||||
| Depreciation and amortization |
0.37 | 0.38 | ||||||
| Gain on sale of real estate |
(0.28 | ) | (0.28 | ) | ||||
|
|
|
|
|
|||||
| Funds from operations |
$ | 1.07 | $ | 1.11 | ||||
| Other adjustments(2) |
0.22 | 0.22 | ||||||
|
|
|
|
|
|||||
| Normalized funds from operations |
$ | 1.29 | $ | 1.33 | ||||
|
|
|
|
|
|||||
| (1) | The 2016 guidance is based on current expectations and actual results or future events may differ materially from those expressed in this table, which is a forward-looking statement within the meaning of the federal securities laws. Please refer to the forward-looking statement included in this press release and the Company’s filings with the Securities and Exchange Commission for a discussion of risk factors that affect the Company’s performance. |
| (2) | Includes acquisition expenses, write-off of straight line rent, transaction costs from non-real estate dispositions, impairment charges, unutilized fees/debt refinancing costs, and other. |
Table of Contents
Exhibit 99.2

SECOND QUARTER 2016
Supplemental Information
Table of Contents
MEDICALPROPERTIESTRUST.COM

FORWARD-LOOKING STATEMENT Forward-looking statements involve known and unknown risks, uncertainties and other factors that may cause the actual results of the Company or future events to differ materially from those expressed in or underlying such forward-looking statements, including without limitation: Normalized FFO per share; expected payout ratio, the amount of acquisitions of healthcare real estate, if any; estimated debt metrics, portfolio diversification, capital markets conditions, the repayment of debt arrangements; statements concerning the additional income to the Company as a result of ownership interests in certain hospital operations and the timing of such income; the payment of future dividends, if any; completion of additional debt arrangement, and additional investments; national and international economic, business, real estate and other market conditions; the competitive environment in which the Company operates; the execution of the Company’s business plan; financing risks; the Company’s ability to maintain its status as a REIT for federal income tax purposes; acquisition and development risks; potential environmental and other liabilities; and other factors affecting the real estate industry generally or healthcare real estate in particular. For further discussion of the factors that could affect outcomes, please refer to the “Risk Factors” section of the Company’s Annual Report on Form 10-K for the year ended December 31, 2015, and as updated by the Company’s subsequently filed Quarterly Reports on Form 10-Q and other SEC filings. Except as otherwise required by the federal securities laws, the Company undertakes no obligation to update the information in this report.
On the Cover and Above: ATOS Klinik Heidelberg (MEDIAN) - Heidelberg, Germany. Acquired in 2016.
| Q2 2016 | SUPPLEMENTAL INFORMATION 2 |
Table of Contents
MEDICALPROPERTIESTRUST.COM

OFFICERS
| Edward K. Aldag, Jr. | Chairman, President and Chief Executive Officer | |
| R. Steven Hamner | Executive Vice President and Chief Financial Officer | |
| Emmett E. McLean | Executive Vice President, Chief Operating Officer, Treasurer and Secretary | |
| J. Kevin Hanna | Vice President, Controller and Chief Accounting Officer | |
BOARD OF DIRECTORS
| Edward K. Aldag, Jr. |
MPT Officers, from left: J. Kevin Hanna, Emmett E. McLean, Edward K. Aldag, Jr., and R. Steven Hamner. | |||
|
G. Steven Dawson
|
||||
| R. Steven Hamner | ||||
|
Robert. E. Holmes, Ph.D. |
||||
|
Sherry A. Kellett |
||||
|
William G. McKenzie |
||||
|
D. Paul Sparks, Jr.
|
||||
|
CORPORATE HEADQUARTERS |
||||
|
Medical Properties Trust, Inc. |
||||
|
1000 Urban Center Drive, Suite 501 |
||||
|
Birmingham, AL 35242 |
||||
|
(205) 969-3755 |
||||
|
(205) 969-3756 (fax) |
||||
|
www.medicalpropertiestrust.com |
||||

| Q2 2016 | SUPPLEMENTAL INFORMATION 3 |
Table of Contents
MEDICALPROPERTIESTRUST.COM
COMPANY OVERVIEW (continued)
| INVESTOR RELATIONS
Tim Berryman | Director - Investor Relations (205) 397-8589 |

|
CAPITAL MARKETS
Charles Lambert | Managing Director - Capital Markets (205) 397-8897 | ||||
|
|
| |||||
| TRANSFER AGENT | STOCK EXCHANGE | SENIOR UNSECURED | ||||
| American Stock Transfer | LISTING AND | DEBT RATINGS | ||||
| and Trust Company | TRADING SYMBOL | Moody’s – Ba1 | ||||
| 6201 15th Avenue | New York Stock Exchange | Standard & Poor’s – BBB- | ||||
| Brooklyn, NY 11219 | (NYSE): MPW | |||||
Q2 2016 | SUPPLEMENTAL INFORMATION 4
Table of Contents
MEDICALPROPERTIESTRUST.COM
RECONCILIATION OF NET INCOME TO FUNDS FROM OPERATIONS
(Unaudited)
(Amounts in thousands except per share data)
| For the Three Months Ended | For the Six Months Ended | |||||||||||||||
| June 30, 2016 |
June 30, 2015 |
June 30, 2016 |
June 30, 2015 |
|||||||||||||
| FFO INFORMATION: |
||||||||||||||||
| Net income attributable to MPT common stockholders |
$ | 53,724 | $ | 22,407 | $ | 111,651 | $ | 58,304 | ||||||||
| Participating securities’ share in earnings |
(132 | ) | (250 | ) | (276 | ) | (516 | ) | ||||||||
|
|
|
|
|
|
|
|
|
|||||||||
| Net income, less participating securities’ share in earnings |
$ | 53,592 | $ | 22,157 | $ | 111,375 | $ | 57,788 | ||||||||
| Depreciation and amortization(A) |
23,335 | 14,956 | 44,807 | 29,712 | ||||||||||||
| Gain on sale of real estate |
(22,613 | ) | — | (22,653 | ) | — | ||||||||||
|
|
|
|
|
|
|
|
|
|||||||||
| Funds from operations |
$ | 54,314 | $ | 37,113 | $ | 133,529 | $ | 87,500 | ||||||||
| Write-off straight line rent and other |
3,063 | — | 3,063 | — | ||||||||||||
| Transaction costs from non-real estate dispositions |
5,975 | — | 5,975 | — | ||||||||||||
| Acquisition expenses(A) |
4,801 | 25,809 | 9,034 | 32,048 | ||||||||||||
| Impairment charges |
7,375 | — | 7,375 | — | ||||||||||||
| Unutilized financing fees / debt refinancing costs |
— | — | 4 | 238 | ||||||||||||
|
|
|
|
|
|
|
|
|
|||||||||
| Normalized funds from operations |
$ | 75,528 | $ | 62,922 | $ | 158,980 | $ | 119,786 | ||||||||
|
|
|
|
|
|
|
|
|
|||||||||
| Share-based compensation |
1,814 | 2,598 | 3,509 | 5,200 | ||||||||||||
| Debt costs amortization |
2,062 | 1,394 | 3,897 | 2,771 | ||||||||||||
| Additional rent received in advance(B) |
(300 | ) | (300 | ) | (600 | ) | (600 | ) | ||||||||
| Straight-line rent revenue and other |
(11,204 | ) | (6,928 | ) | (22,033 | ) | (13,260 | ) | ||||||||
|
|
|
|
|
|
|
|
|
|||||||||
| Adjusted funds from operations |
$ | 67,900 | $ | 59,686 | $ | 143,753 | $ | 113,897 | ||||||||
|
|
|
|
|
|
|
|
|
|||||||||
| PER DILUTED SHARE DATA: |
||||||||||||||||
| Net income, less participating securities’ share in earnings |
$ | 0.22 | $ | 0.11 | $ | 0.47 | $ | 0.28 | ||||||||
| Depreciation and amortization(A) |
0.10 | 0.07 | 0.18 | 0.14 | ||||||||||||
| Gain on sale of real estate |
(0.09 | ) | — | (0.09 | ) | — | ||||||||||
|
|
|
|
|
|
|
|
|
|||||||||
| Funds from operations |
$ | 0.23 | $ | 0.18 | $ | 0.56 | $ | 0.42 | ||||||||
| Write-off straight line rent and other |
0.01 | — | 0.01 | — | ||||||||||||
| Transaction costs from non-real estate dispositions |
0.03 | — | 0.03 | — | ||||||||||||
| Acquisition expenses(A) |
0.02 | 0.12 | 0.04 | 0.16 | ||||||||||||
| Impairment charges |
0.03 | — | 0.03 | — | ||||||||||||
| Unutilized financing fees / debt refinancing costs |
— | — | — | — | ||||||||||||
|
|
|
|
|
|
|
|
|
|||||||||
| Normalized funds from operations |
$ | 0.32 | $ | 0.30 | $ | 0.67 | $ | 0.58 | ||||||||
|
|
|
|
|
|
|
|
|
|||||||||
| Share-based compensation |
0.01 | 0.01 | 0.01 | 0.03 | ||||||||||||
| Debt costs amortization |
0.01 | 0.01 | 0.01 | 0.01 | ||||||||||||
| Additional rent received in advance(B) |
— | — | — | — | ||||||||||||
| Straight-line rent revenue and other |
(0.06 | ) | (0.03 | ) | (0.09 | ) | (0.07 | ) | ||||||||
|
|
|
|
|
|
|
|
|
|||||||||
| Adjusted funds from operations |
$ | 0.28 | $ | 0.29 | $ | 0.60 | $ | 0.55 | ||||||||
|
|
|
|
|
|
|
|
|
|||||||||
| (A) | Includes our share of real estate depreciation and acquisition expenses from unconsolidated joint ventures (if any). Any such amounts are included with the activity of all of our equity interests in the “Other income (expense)” line on the consolidated statements of income. |
| (B) | Represents additional rent received from one tenant in advance of when we can recognize as revenue for accounting purposes. This additional rent is being recorded to revenue on a straight-line basis over the lease life. |
Investors and analysts following the real estate industry utilize funds from operations, or FFO, as a supplemental performance measure. FFO, reflecting the assumption that real estate asset values rise or fall with market conditions, principally adjusts for the effects of GAAP depreciation and amortization of real estate assets, which assumes that the value of real estate diminishes predictably over time. We compute FFO in accordance with the definition provided by the National Association of Real Estate Investment Trusts, or NAREIT, which represents net income (loss) (computed in accordance with GAAP), excluding gains (losses) on sales of real estate and impairment charges on real estate assets, plus real estate depreciation and amortization and after adjustments for unconsolidated partnerships and joint ventures.
In addition to presenting FFO in accordance with the NAREIT definition, we also disclose normalized FFO, which adjusts FFO for items that relate to unanticipated or non-core events or activities or accounting changes that, if not noted, would make comparison to prior period results and market expectations less meaningful to investors and analysts. We believe that the use of FFO, combined with the required GAAP presentations, improves the understanding of our operating results among investors and the use of normalized FFO makes comparisons of our operating results with prior periods and other companies more meaningful. While FFO and normalized FFO are relevant and widely used supplemental measures of operating and financial performance of REITs, they should not be viewed as a substitute measure of our operating performance since the measures do not reflect either depreciation and amortization costs or the level of capital expenditures and leasing costs necessary to maintain the operating performance of our properties, which can be significant economic costs that could materially impact our results of operations. FFO and normalized FFO should not be considered an alternative to net income (loss) (computed in accordance with GAAP) as indicators of our financial performance or to cash flow from operating activities (computed in accordance with GAAP) as an indicator of our liquidity.
We calculate adjusted funds from operations, or AFFO, by subtracting from or adding to normalized FFO (i) unbilled rent revenue, (ii) non-cash share-based compensation expense, and (iii) amortization of deferred financing costs. AFFO is an operating measurement that we use to analyze our results of operations based on the receipt, rather than the accrual, of our rental revenue and on certain other adjustments. We believe that this is an important measurement because our leases generally have significant contractual escalations of base rents and therefore result in recognition of rental income that is not collected until future periods, and costs that are deferred or are non-cash charges. Our calculation of AFFO may not be comparable to AFFO or similarly titled measures reported by other REITs. AFFO should not be considered as an alternative to net income (calculated pursuant to GAAP) as an indicator of our results of operations or to cash flow from operating activities (calculated pursuant to GAAP) as an indicator of our liquidity.
| Q2 2016 | SUPPLEMENTAL INFORMATION 5 |
Table of Contents
MEDICALPROPERTIESTRUST.COM
FINANCIAL INFORMATION
(as of June 30, 2016)
($ amounts in thousands)
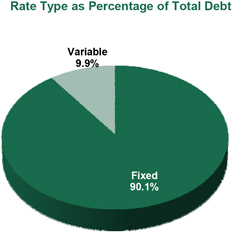
| Debt Instrument |
Rate Type |
Rate | Balance | |||||||
| 2016 Unsecured Notes |
Fixed | 5.59 | % (A) | $ | 125,000 | |||||
| Northland – Mortgage Capital Term Loan |
Fixed | 6.20 | % | 13,253 | ||||||
| 2018 Credit Facility Revolver |
Variable | 1.87 | % (B) | 25,000 | ||||||
| 2019 Term Loan |
Variable | 2.11 | % | 250,000 | ||||||
| 5.750% Notes Due 2020 (Euro) (C) |
Fixed | 5.75 | % | 222,120 | ||||||
| 6.875% Notes Due 2021 (D) |
Fixed | 6.88 | % | 450,000 | ||||||
| 4.000% Notes Due 2022 (Euro) (C) |
Fixed | 4.00 | % | 555,300 | ||||||
| 6.375% Notes Due 2022 |
Fixed | 6.38 | % | 350,000 | ||||||
| 6.375% Notes Due 2024 |
Fixed | 6.38 | % | 500,000 | ||||||
| 5.500% Notes Due 2024 |
Fixed | 5.50 | % | 300,000 | ||||||
|
|
|
|||||||||
| $ | 2,790,673 | |||||||||
| Debt premium |
1,991 | |||||||||
| Debt issuance costs |
(34,029 | ) | ||||||||
|
|
|
|
|
|||||||
| Weighted average rate |
5.38 | % | $ | 2,758,635 | ||||||
|
|
|
|
|
|||||||
| (A) | Represents the weighted-average rate for four tranches of the Notes at June 30, 2016, factoring in interest rate swaps in effect at that time. $65 million of the 2016 Unsecured Notes were repaid on July 29, 2016. |
| (B) | At June 30, 2016, this represents a $1.3 billion unsecured revolving credit facility with spreads over LIBOR ranging from 0.95% to 1.75%. |
| (C) | Represents 700 million of bonds issued in Euros and converted to U.S. dollars at June 30, 2016. |
| (D) | The 6.875% Notes Due 2021 were redeemed post June 30, 2016, with proceeds from our $500 million Notes Due 2026 that were issued at 5.250%. |
Q2 2016 | SUPPLEMENTAL INFORMATION 6
Table of Contents
MEDICALPROPERTIESTRUST.COM
FINANCIAL INFORMATION
(as of June 30, 2016)
($ amounts in thousands)
| Debt Instrument |
2016 | 2017 | 2018 | 2019 | 2020 | Thereafter | ||||||||||||||||||
| 2016 Unsecured Notes (A) |
$ | 125,000 | $ | — | $ | — | $ | — | $ | — | $ | — | ||||||||||||
| Northland – Mortgage Capital Term Loan |
152 | 320 | 12,781 | — | — | — | ||||||||||||||||||
| 2018 Credit Facility Revolver |
— | — | 25,000 | — | — | — | ||||||||||||||||||
| 2019 Term Loan |
— | — | — | 250,000 | — | — | ||||||||||||||||||
| 5.750% Notes Due 2020 (Euro) |
— | — | — | — | 222,120 | — | ||||||||||||||||||
| 6.875% Notes Due 2021 (A) |
— | — | — | — | — | 450,000 | ||||||||||||||||||
| 4.000% Notes Due 2022 (Euro) |
— | — | — | — | — | 555,300 | ||||||||||||||||||
| 6.375% Notes Due 2022 |
— | — | — | — | — | 350,000 | ||||||||||||||||||
| 6.375% Notes Due 2024 |
— | — | — | — | — | 500,000 | ||||||||||||||||||
| 5.500% Notes Due 2024 |
— | — | — | — | — | 300,000 | ||||||||||||||||||
|
|
|
|
|
|
|
|
|
|
|
|
|
|||||||||||||
| $ | 125,152 | $ | 320 | $ | 37,781 | $ | 250,000 | $ | 222,120 | $ | 2,155,300 | |||||||||||||
|
|
|
|
|
|
|
|
|
|
|
|
|
|||||||||||||
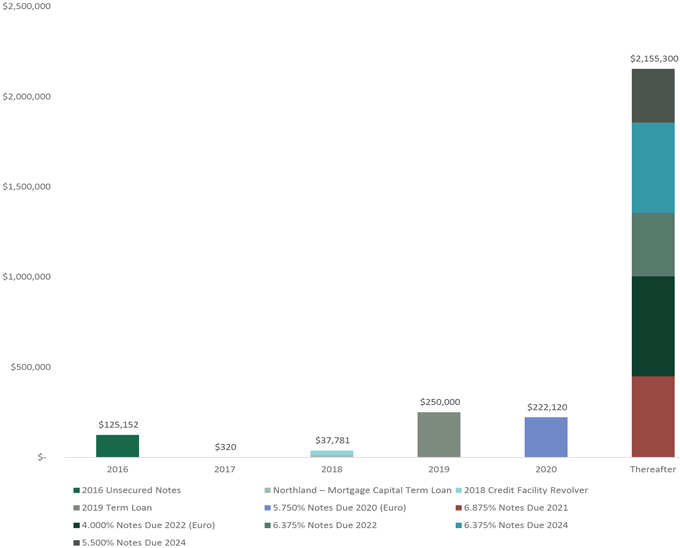
| (A) | $65 million of the 2016 Unsecured Notes were repaid on July 29, 2016. The 6.875% Notes Due 2021 were redeemed post June 30, 2016, with proceeds from our $500 million Notes Due 2026 that were issued at 5.250%. |
Q2 2016 | SUPPLEMENTAL INFORMATION 7
Table of Contents
MEDICALPROPERTIESTRUST.COM
FINANCIAL INFORMATION
PRO FORMA NET DEBT / ANNUALIZED EBITDA
(Unaudited)
(Amounts in thousands)
| For the Three Months Ended | ||||
| June 30, 2016 | ||||
| Net income attributable to MPT common stockholders |
$ | 53,724 | ||
| Pro forma adjustments for capital transactions, acquisitions / dispositions that occurred after the period (A) |
(855 | ) | ||
|
|
|
|||
| Pro forma net income |
$ | 52,869 | ||
| Add back: |
||||
| Interest expense |
41,501 | |||
| Debt refinancing costs |
— | |||
| Depreciation and amortization |
23,978 | |||
| Stock-based compensation |
1,814 | |||
| Mid-quarter acquisitions / divestitures |
(5,293 | ) | ||
| Mid-quarter development openings and investments |
152 | |||
| Estimated earnings from CIP funding |
1,579 | |||
| Gain on sale of real estate and other asset dispositions, net |
(16,638 | ) | ||
| Impairment and other charges |
10,438 | |||
| Acquisition expenses |
4,801 | |||
| Income tax expense |
364 | |||
|
|
|
|||
| 2Q 2016 Pro forma EBITDA |
$ | 115,565 | ||
|
|
|
|||
| Annualization |
$ | 462,260 | ||
|
|
|
|||
| Total debt |
$ | 2,758,635 | ||
| Pro forma changes to debt balance after June 30, 2016 (A) |
(40,000 | ) | ||
| Cash |
(234,561 | ) | ||
|
|
|
|||
| Net debt |
$ | 2,484,074 | ||
|
|
|
|||
| Net debt / pro forma annualized EBITDA |
5.4x | |||
| (A) | Reflects impact from previously disclosed divestitures and investments that occurred after June 30, 2016. |
Q2 2016 | SUPPLEMENTAL INFORMATION 8
Table of Contents
MEDICALPROPERTIESTRUST.COM
LEASE AND MORTGAGE LOAN MATURITY SCHEDULE
(as of June 30, 2016)
($ amounts in thousands)
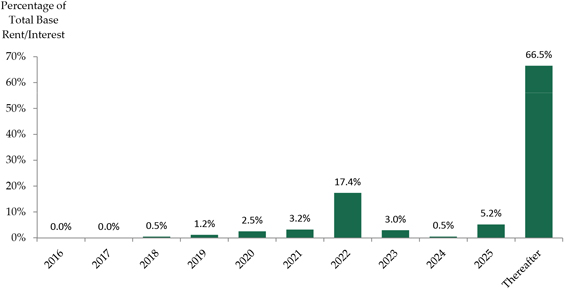
| Years of Maturities (A) (B) |
Total Leases/Loans | Base Rent/Interest (C) | Percent of Total Base Rent/Interest |
|||||||||
| 2016 |
— | $ | — | — | ||||||||
| 2017 |
— | — | — | |||||||||
| 2018 |
1 | 2,007 | 0.5 | % | ||||||||
| 2019 |
2 | 5,017 | 1.2 | % | ||||||||
| 2020 |
5 | 10,640 | 2.5 | % | ||||||||
| 2021 |
3 | 13,591 | 3.2 | % | ||||||||
| 2022 |
15 | 73,550 | 17.4 | % | ||||||||
| 2023 |
4 | 12,599 | 3.0 | % | ||||||||
| 2024 |
1 | 2,237 | 0.5 | % | ||||||||
| 2025 |
7 | 22,064 | 5.2 | % | ||||||||
| Thereafter |
145 | 281,109 | 66.5 | % | ||||||||
|
|
|
|
|
|
|
|||||||
| 183 | $ | 422,814 | 100.0 | % | ||||||||
|
|
|
|
|
|
|
|||||||
| (A) | Excludes 14 of our facilities that are under development, our Twelve Oaks facility that is not fully occupied, and the 9 properties that we own through joint venture arrangements. In addition, the schedule reflects post June 30, 2016 transactions, including the sale of three HealthSouth facilities on July 22, 2016 and one RCCH facility acquired on July 20, 2016. |
| (B) | Lease/Loan expiration is based on the fixed term of the lease/loan and does not factor in potential renewal options provided for in our agreements. |
| (C) | Represents base rent/interest income on an annualized basis but does not include tenant recoveries, additional rents and other lease-related adjustments to revenue (i.e., straight-line rents and deferred revenues). |
| Q2 2016 | SUPPLEMENTAL INFORMATION 9 |
Table of Contents
MEDICALPROPERTIESTRUST.COM
PORTFOLIO INFORMATION
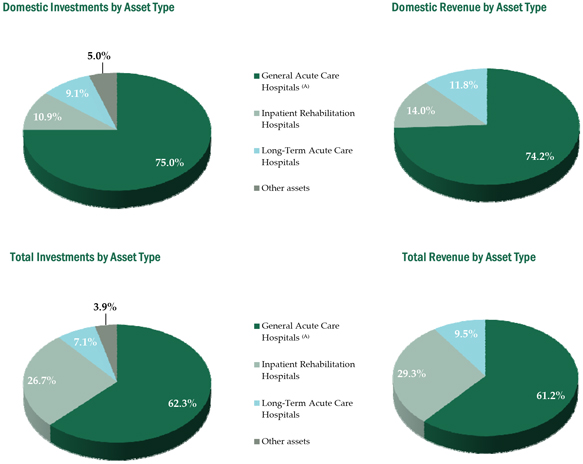
INVESTMENTS AND REVENUE BY ASSET TYPE
(June 30, 2016)
($ amounts in thousands)
| Asset Types |
Total Gross Assets (B) |
Percentage of Gross Assets |
YTD Revenue |
Percentage of Total Revenue |
||||||||||||
| General Acute Care Hospitals (A) |
$ | 3,377,992 | 62.3 | % | $ | 159,978 | 61.2 | % | ||||||||
| Inpatient Rehabilitation Hospitals |
1,447,467 | 26.7 | % | 76,388 | 29.3 | % | ||||||||||
| Long-Term Acute Care Hospitals |
383,595 | 7.1 | % | 24,933 | 9.5 | % | ||||||||||
| Other assets |
213,341 | 3.9 | % | — | — | |||||||||||
|
|
|
|
|
|
|
|
|
|||||||||
| Total |
$ | 5,422,395 | 100.0 | % | $ | 261,299 | 100.0 | % | ||||||||
|
|
|
|
|
|
|
|
|
|||||||||
| (A) | Includes three medical office buildings. |
| (B) | Represents investment concentration as a percentage of gross real estate assets, other loans, and equity investments assuming all real estate commitments are fully funded. Also, reflects the sale of three HealthSouth facilities on July 22, 2016. |
Q2 2016 | SUPPLEMENTAL INFORMATION 10
Table of Contents
MEDICALPROPERTIESTRUST.COM
PORTFOLIO INFORMATION
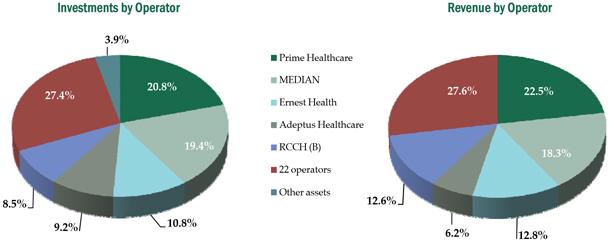
INVESTMENTS AND REVENUE BY OPERATOR
(June 30, 2016)
($ amounts in thousands)
| Operators |
Total Gross Assets (A) |
Percentage of Gross Assets |
YTD Revenue |
Percentage of Total Revenue |
||||||||||||
| Prime Healthcare |
$ | 1,126,654 | 20.8 | % | $ | 58,859 | 22.5 | % | ||||||||
| MEDIAN |
1,054,368 | 19.4 | % | 47,745 | 18.3 | % | ||||||||||
| Ernest Health |
584,411 | 10.8 | % | 33,322 | 12.8 | % | ||||||||||
| Adeptus Healthcare |
500,000 | 9.2 | % | 16,205 | 6.2 | % | ||||||||||
| RCCH (B) |
458,659 | 8.5 | % | 32,909 | 12.6 | % | ||||||||||
| 22 operators |
1,484,962 | 27.4 | % | 72,259 | 27.6 | % | ||||||||||
| Other assets |
213,341 | 3.9 | % | — | — | |||||||||||
|
|
|
|
|
|
|
|
|
|||||||||
| Total |
$ | 5,422,395 | 100.0 | % | $ | 261,299 | 100.0 | % | ||||||||
|
|
|
|
|
|
|
|
|
|||||||||
| (A) | Represents investment concentration as a percentage of gross real estate assets, other loans, and equity investments assuming all real estate commitments are fully funded. Also, reflects the sale of three HealthSouth facilities on July 22, 2016. |
| (B) | RCCH represents RCCH Healthcare Partners, which is the Capella and RegionalCare merged entity. |
Q2 2016 | SUPPLEMENTAL INFORMATION 11
Table of Contents
MEDICALPROPERTIESTRUST.COM
PORTFOLIO INFORMATION
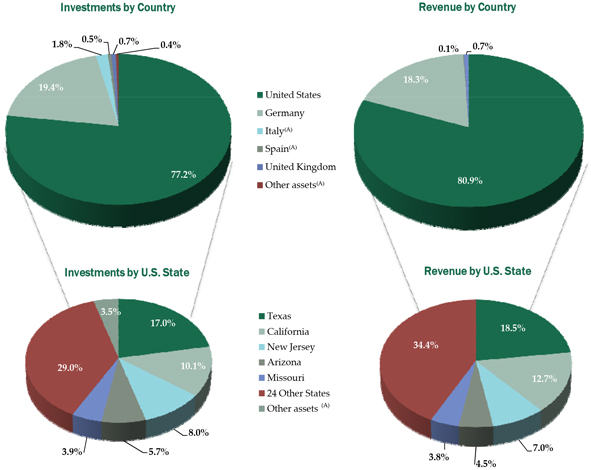
INVESTMENTS AND REVENUE BY U.S. STATE AND COUNTRY
(June 30, 2016)
($ amounts in thousands)
| U.S. States and Other Countries |
Total Gross Assets |
Percentage of Gross Assets |
YTD Revenue |
Percentage of Total Revenue |
||||||||||||
| Texas |
$ | 920,959 | 17.0 | % | $ | 48,256 | 18.5 | % | ||||||||
| California |
547,079 | 10.1 | % | 33,187 | 12.7 | % | ||||||||||
| New Jersey |
432,740 | 8.0 | % | 18,243 | 7.0 | % | ||||||||||
| Arizona |
306,449 | 5.7 | % | 11,722 | 4.5 | % | ||||||||||
| Missouri |
210,921 | 3.9 | % | 9,811 | 3.8 | % | ||||||||||
| 24 Other States |
1,579,908 | 29.0 | % | 90,120 | 34.4 | % | ||||||||||
| Other assets (A) |
189,358 | 3.5 | % | — | — | |||||||||||
|
|
|
|
|
|
|
|
|
|||||||||
| United States |
$ | 4,187,414 | 77.2 | % | $ | 211,339 | 80.9 | % | ||||||||
| Germany |
$ | 1,054,368 | 19.4 | % | $ | 47,745 | 18.3 | % | ||||||||
| Italy(A) |
95,222 | 1.8 | % | — | — | |||||||||||
| Spain(A) |
23,805 | 0.5 | % | 168 | 0.1 | % | ||||||||||
| United Kingdom |
37,603 | 0.7 | % | 2,047 | 0.7 | % | ||||||||||
| Other assets(A) |
23,983 | 0.4 | % | — | — | |||||||||||
|
|
|
|
|
|
|
|
|
|||||||||
| International |
$ | 1,234,981 | 22.8 | % | $ | 49,960 | 19.1 | % | ||||||||
|
|
|
|
|
|
|
|
|
|||||||||
| Total |
$ | 5,422,395 | (B) | 100.0 | % | $ | 261,299 | 100.0 | % | |||||||
|
|
|
|
|
|
|
|
|
|||||||||
| (A) | Includes our equity investments, of which related income is reflected in other income in our income statement. |
| (B) | Represents investment concentration as a percentage of gross real estate assets, other loans, and equity investments assuming all real estate commitments are fully funded. Also, reflects the sale of three HealthSouth facilities on July 22, 2016. |
Q2 2016 | SUPPLEMENTAL INFORMATION 12
Table of Contents
MEDICALPROPERTIESTRUST.COM
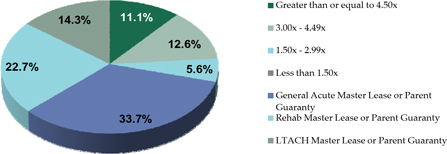
PORTFOLIO INFORMATION
Same Store EBITDAR(1) Rent Coverage
YOY and Sequential Quarter Comparisons by Property Type
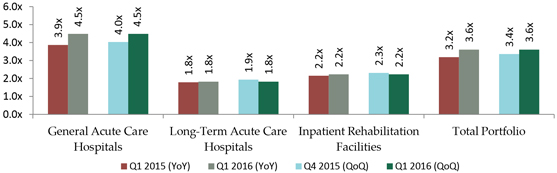
Stratification of Portfolio EBITDAR Rent Coverage
| EBITDAR Rent Coverage TTM |
Investment (in thousands) |
No. of Facilities | Percentage of Investment |
|||||||||
| Greater than or equal to 4.50x |
$ | 280,279 | 5 | 11.1 | % | |||||||
| 3.00x - 4.49x |
$ | 318,449 | 5 | 12.6 | % | |||||||
| 1.50x - 2.99x |
$ | 141,514 | 2 | 5.6 | % | |||||||
| Less than 1.50x |
$ | — | 0 | 0.0 | % | |||||||
| Total Master Leased and/or with Parent Guaranty: 3.0x |
$ | 1,787,672 | 64 | 70.7 | % | |||||||
| General Acute Master Leased and/or with |
$ | 850,992 | 20 | 33.7 | % | |||||||
| Inpatient Rehabilitation Facilities Master |
$ | 574,415 | 27 | 22.7 | % | |||||||
| Long-Term Acute Care Hospitals Master |
$ | 362,265 | 17 | 14.3 | % | |||||||
| Notes: |
Same Store represents properties with at least 24 months of financial reporting data. Properties that do not provide financial reporting and disposed assets are not included.
Freestanding ERs will be reported as a distinct property type when 24 months of financial reporting data is available for a property or all properties associated with an initial funding commitment as applicable.
All data presented is on a trailing twelve month basis.
| (1) | EBITDAR adjusted for non-recurring items. |
Q2 2016 | SUPPLEMENTAL INFORMATION 13
Table of Contents
MEDICALPROPERTIESTRUST.COM
PORTFOLIO INFORMATION
SUMMARY OF COMPLETED ACQUISITIONS / DEVELOPMENT PROJECTS IN 2016
($ amounts in thousands)
| Operator |
Location |
Costs Incurred as of 6/30/2016 |
Rent Commencement Date |
Acquisition / | ||||||||
| MEDIAN (A) |
Heidelberg, Germany | $ | 46,991 | 6/23/2016 | Acquisition | |||||||
| Adeptus Health |
Dallas, TX | 5,319 | 5/23/2016 | Development | ||||||||
| Prime Healthcare |
Newark, NJ | 63,000 | 5/2/2016 | Acquisition | ||||||||
| Adeptus Health |
Phoenix, AZ | 6,392 | 4/4/2016 | Development | ||||||||
| Ernest Health |
Toledo, OH | 19,212 | 4/1/2016 | Development | ||||||||
| Adeptus Health |
Houston, TX | 4,116 | 3/28/2016 | Development | ||||||||
| Adeptus Health |
Helotes, TX | 7,197 | 3/10/2016 | Development | ||||||||
| Adeptus Health |
Frisco, TX | 4,721 | 3/4/2016 | Development | ||||||||
| Adeptus Health |
Longmont, CO | 4,770 | 2/10/2016 | Development | ||||||||
| Adeptus Health |
Rosenberg, TX | 4,731 | 1/15/2016 | Development | ||||||||
|
|
|
|||||||||||
| $ | 166,449 | |||||||||||
|
|
|
|||||||||||
| (A) | We acquired Heidelberg in June 2016 for €41.6 million, which was the final MEDIAN property to be acquired from our initial MEDIAN transaction. Exchange rate used is as of date of acquisition. |
SUMMARY OF CURRENT DEVELOPMENT PROJECTS AS OF JUNE 30, 2016
($ amounts in thousands)
| Operator |
Commitment | Costs Incurred as of 6/30/2016 |
Estimated Completion Date |
|||||||||
| Adeptus Health |
$ | 62,154 | $ | 43,763 | 3Q 2016 | |||||||
| Adeptus Health |
53,836 | 15,343 | 4Q 2016 | |||||||||
| Adeptus Health |
5,730 | 206 | 1Q 2017 | |||||||||
| Adeptus Health |
61,997 | 16,311 | 2Q 2017 | |||||||||
| Adeptus Health |
71,331 | — | Various | |||||||||
|
|
|
|
|
|||||||||
| $ | 255,048 | $ | 75,623 | |||||||||
|
|
|
|
|
|||||||||
| Q2 2016 | SUPPLEMENTAL INFORMATION 14 |
Table of Contents
MEDICALPROPERTIESTRUST.COM
MEDICAL PROPERTIES TRUST, INC. AND SUBSIDIARIES
Consolidated Statements of Income
(Amounts in thousands except per share data)
| For the Three Months Ended | For the Six Months Ended | |||||||||||||||
| June 30, 2016 |
June 30, 2015 |
June 30, 2016 |
June 30, 2015 |
|||||||||||||
| (Unaudited) | (Unaudited) | (Unaudited) | (Unaudited) | |||||||||||||
| Revenues |
||||||||||||||||
| Rent billed |
$ | 77,960 | $ | 53,893 | $ | 152,021 | $ | 106,994 | ||||||||
| Straight-line rent |
8,551 | 5,252 | 16,768 | 9,980 | ||||||||||||
| Income from direct financing leases |
13,552 | 12,808 | 32,503 | 25,363 | ||||||||||||
| Interest and fee income |
26,237 | 27,848 | 60,007 | 53,425 | ||||||||||||
|
|
|
|
|
|
|
|
|
|||||||||
| Total revenues |
126,300 | 99,801 | 261,299 | 195,762 | ||||||||||||
| Expenses |
||||||||||||||||
| Real estate depreciation and amortization |
22,832 | 14,956 | 43,974 | 29,712 | ||||||||||||
| Impairment charges |
7,375 | — | 7,375 | — | ||||||||||||
| Property-related |
784 | 530 | 1,685 | 881 | ||||||||||||
| Acquisition expenses |
4,767 | 25,809 | 3,702 | 32,048 | ||||||||||||
| General and administrative |
12,045 | 10,642 | 23,516 | 21,547 | ||||||||||||
|
|
|
|
|
|
|
|
|
|||||||||
| Total operating expenses |
47,803 | 51,937 | 80,252 | 84,188 | ||||||||||||
|
|
|
|
|
|
|
|
|
|||||||||
| Operating income |
78,497 | 47,864 | 181,047 | 111,574 | ||||||||||||
| Interest expense |
(41,501 | ) | (26,890 | ) | (80,874 | ) | (53,556 | ) | ||||||||
| Gain on sale of real estate and other asset dispositions, net |
16,638 | — | 16,678 | — | ||||||||||||
| Other income (expense) |
654 | 2,078 | (4,018 | ) | 1,385 | |||||||||||
| Income tax expense |
(364 | ) | (563 | ) | (683 | ) | (938 | ) | ||||||||
|
|
|
|
|
|
|
|
|
|||||||||
| Income from continuing operations |
53,924 | 22,489 | 112,150 | 58,465 | ||||||||||||
| Loss from discontinued operations |
— | — | (1 | ) | — | |||||||||||
|
|
|
|
|
|
|
|
|
|||||||||
| Net income |
53,924 | 22,489 | 112,149 | 58,465 | ||||||||||||
| Net income attributable to non-controlling interests |
(200 | ) | (82 | ) | (498 | ) | (161 | ) | ||||||||
|
|
|
|
|
|
|
|
|
|||||||||
| Net income attributable to MPT common stockholders |
$ | 53,724 | $ | 22,407 | $ | 111,651 | $ | 58,304 | ||||||||
|
|
|
|
|
|
|
|
|
|||||||||
| Earnings per common share – basic: |
||||||||||||||||
| Income from continuing operations |
$ | 0.23 | $ | 0.11 | $ | 0.47 | $ | 0.28 | ||||||||
| Loss from discontinued operations |
— | — | — | — | ||||||||||||
|
|
|
|
|
|
|
|
|
|||||||||
| Net income attributable to MPT common stockholders |
$ | 0.23 | $ | 0.11 | $ | 0.47 | $ | 0.28 | ||||||||
|
|
|
|
|
|
|
|
|
|||||||||
| Earnings per common share – diluted: |
||||||||||||||||
| Income from continuing operations |
$ | 0.22 | $ | 0.11 | $ | 0.47 | $ | 0.28 | ||||||||
| Loss from discontinued operations |
— | — | — | — | ||||||||||||
|
|
|
|
|
|
|
|
|
|||||||||
| Net income attributable to MPT common stockholders |
$ | 0.22 | $ | 0.11 | $ | 0.47 | $ | 0.28 | ||||||||
|
|
|
|
|
|
|
|
|
|||||||||
| Dividends declared per common share |
$ | 0.23 | $ | 0.22 | $ | 0.45 | $ | 0.44 | ||||||||
| Weighted average shares outstanding – basic |
238,082 | 208,071 | 237,796 | 205,515 | ||||||||||||
| Weighted average shares outstanding – diluted |
239,008 | 208,640 | 238,413 | 206,127 | ||||||||||||
| Q2 2016 | SUPPLEMENTAL INFORMATION 15 |
Table of Contents
MEDICALPROPERTIESTRUST.COM
FINANCIAL STATEMENTS
MEDICAL PROPERTIES TRUST, INC. AND SUBSIDIARIES
Consolidated Balance Sheets
(Amounts in thousands except per share data)
| June 30, 2016 |
December 31, 2015 |
|||||||
| (Unaudited) | (A) | |||||||
| ASSETS |
||||||||
| Real estate assets |
||||||||
| Land, buildings and improvements, intangible lease assets, and other |
$ | 3,482,199 | $ | 3,297,705 | ||||
| Real estate held for sale |
63,074 | — | ||||||
| Net investment in direct financing leases |
528,747 | 626,996 | ||||||
| Mortgage loans |
549,337 | 757,581 | ||||||
|
|
|
|
|
|||||
| Gross investment in real estate assets |
4,623,357 | 4,682,282 | ||||||
| Accumulated depreciation and amortization |
(278,590 | ) | (257,928 | ) | ||||
|
|
|
|
|
|||||
| Net investment in real estate assets |
4,344,767 | 4,424,354 | ||||||
| Cash and cash equivalents |
181,561 | 195,541 | ||||||
| Interest and rent receivables |
47,699 | 46,939 | ||||||
| Straight-line rent receivables |
95,988 | 82,155 | ||||||
| Other assets |
447,918 | 860,362 | ||||||
|
|
|
|
|
|||||
| Total Assets |
$ | 5,117,933 | $ | 5,609,351 | ||||
|
|
|
|
|
|||||
| LIABILITIES AND EQUITY |
||||||||
| Liabilities |
||||||||
| Debt, net |
$ | 2,758,635 | $ | 3,322,541 | ||||
| Accounts payable and accrued expenses |
148,218 | 137,356 | ||||||
| Deferred revenue |
20,997 | 29,358 | ||||||
| Lease deposits and other obligations to tenants |
22,845 | 12,831 | ||||||
|
|
|
|
|
|||||
| Total liabilities |
2,950,695 | 3,502,086 | ||||||
| Equity |
||||||||
| Preferred stock, $0.001 par value. Authorized 10,000 shares; no shares outstanding |
— | — | ||||||
| Common stock, $0.001 par value. Authorized 500,000 shares; issued and outstanding - 240,341 shares at June 30, 2016 and 236,744 shares at December 31, 2015 |
240 | 237 | ||||||
| Additional paid in capital |
2,642,281 | 2,593,827 | ||||||
| Distributions in excess of net income |
(414,657 | ) | (418,650 | ) | ||||
| Accumulated other comprehensive loss |
(65,340 | ) | (72,884 | ) | ||||
| Treasury shares, at cost |
(262 | ) | (262 | ) | ||||
|
|
|
|
|
|||||
| Total Medical Properties Trust, Inc. Stockholders’ Equity |
2,162,262 | 2,102,268 | ||||||
|
|
|
|
|
|||||
| Non-controlling interests |
4,976 | 4,997 | ||||||
|
|
|
|
|
|||||
| Total equity |
2,167,238 | 2,107,265 | ||||||
|
|
|
|
|
|||||
| Total Liabilities and Equity |
$ | 5,117,933 | $ | 5,609,351 | ||||
|
|
|
|
|
|||||
| (A) | Financials have been derived from the prior year audited financial statements. |
Q2 2016 | SUPPLEMENTAL INFORMATION 16
Table of Contents
MEDICALPROPERTIESTRUST.COM
FINANCIAL STATEMENTS
DETAIL OF OTHER ASSETS AS OF JUNE 30, 2016
($ amounts in thousands)
| Operator |
Investment | Annual Interest Rate |
YTD RIDEA Income (C) |
Security / Credit Enhancements | ||||||||||
| Non-Operating Loans |
||||||||||||||
| Vibra Healthcare acquisition loan(A) |
$ | 7,472 | 10.25 | % | Secured and cross-defaulted with real estate, other agreements and guaranteed by Parent | |||||||||
| Alecto working capital |
16,680 | 11.20 | % | Secured and cross-defaulted with real estate and guaranteed by Parent | ||||||||||
| IKJG/HUMC working capital |
10,353 | 10.73 | % | Secured and cross-defaulted with real estate and guaranteed by Parent | ||||||||||
| Ernest Health |
23,667 | 9.10 | % | Secured and cross-defaulted with real estate and guaranteed by Parent | ||||||||||
| Other |
11,343 | |||||||||||||
|
|
|
|||||||||||||
| 69,515 | ||||||||||||||
| Operating Loans |
||||||||||||||
| Ernest Health (B) |
93,200 | 15.00 | % | $ | 7,634 | Secured and cross-defaulted with real estate and guaranteed by Parent | ||||||||
| RCCH (F) |
93,262 | 8.00 | % | 1,264 | ||||||||||
| IKJG/HUMC convertible loan |
3,352 | 107 | Secured and cross-defaulted with real estate and guaranteed by Parent | |||||||||||
|
|
|
|
|
|||||||||||
| 189,814 | 9,005 | |||||||||||||
| Equity investments(G) |
||||||||||||||
| Domestic |
8,856 | 215 | ||||||||||||
| International(E) |
110,078 | 2,065 | (H) | |||||||||||
| Lease and cash collateral |
3,751 | Not applicable | ||||||||||||
| Other assets(D) |
65,904 | Not applicable | ||||||||||||
|
|
|
|
|
|||||||||||
| Total |
$ | 447,918 | $ | 11,285 | ||||||||||
|
|
|
|
|
|||||||||||
| (A) | Original amortizing acquisition loan was $41 million; loan matures in 2019. |
| (B) | Due to compounding, effective interest rate is 16.3%. |
| (C) | Income earned on operating loans is reflected in the interest income line of the income statement. |
| (D) | Includes prepaid expenses, office property and equipment and other. |
| (E) | Includes equity investments in Spain, Italy, and Germany. |
| (F) | This acquisition loan originated from the April transaction with RCCH and was converted to a sale and leaseback arrangement for a hospital property in Olympia, Washington on July 22, 2016. |
| (G) | All earnings in income from equity investments are reported on a one quarter lag basis. |
| (H) | Excludes our share of real estate depreciation and acquisition expenses of certain unconsolidated joint ventures. |
Q2 2016 | SUPPLEMENTAL INFORMATION 17
Table of Contents

Serious News for Serious Traders! Try StreetInsider.com Premium Free!
You May Also Be Interested In
- Deutsche Bank Upgrades Medical Properties Trust (MPW) to Hold, 'Debt Maturity Likely Resolved Until At Least 2025'
- Inside information: Meriaura Group's board has conditionally decided to sell Meriaura's minority ownership to Meriaura Invest to rearrange the group's financing
- Canadian Pink Floyd Tribute Band Floydium Performance At Summer Venues Announced
Create E-mail Alert Related Categories
SEC FilingsSign up for StreetInsider Free!
Receive full access to all new and archived articles, unlimited portfolio tracking, e-mail alerts, custom newswires and RSS feeds - and more!
