

Form 8-K MATTRESS FIRM HOLDING For: Jun 09
 Tweet
Tweet Share
Share
UNITED STATES
SECURITIES AND EXCHANGE COMMISSION
WASHINGTON, D.C. 20549
FORM 8-K
CURRENT REPORT
Pursuant to Section 13 or 15(d) of the
Securities Exchange Act of 1934
Date of Report (Date of earliest event reported): June 9, 2015
MATTRESS FIRM HOLDING CORP.
(Exact Name of Registrant as Specified in Charter)
|
Delaware |
|
001-35354 |
|
20-8185960 |
|
(State or Other Jurisdiction |
|
(Commission |
|
(IRS Employer |
|
5815 Gulf Freeway, Houston, Texas |
|
77023 |
|
(Address of Principal Executive Offices) |
|
(Zip Code) |
Registrant’s telephone number, including area code: (713) 923-1090
Not applicable
(Former Name or Former Address, if Changed Since Last Report)
Check the appropriate box below if the Form 8-K filing is intended to simultaneously satisfy the filing obligation of the registrant under any of the following provisions (see General Instruction A.2. below):
o Written communications pursuant to Rule 425 under the Securities Act (17 CFR 230.425)
o Soliciting material pursuant to Rule 14a-12 under the Exchange Act (17 CFR 240.14a-12)
o Pre-commencement communications pursuant to Rule 14d-2(b) under the Exchange Act (17 CFR 240.14d-2(b))
o Pre-commencement communications pursuant to Rule 13e-4(c) under the Exchange Act (17 CFR 240.13e-4(c))
Item 2.02 Results of Operations and Financial Condition.
On June 9, 2015, the Company announced financial results for the fiscal 2015 first quarter (13 weeks) ended May 5, 2015. The press release is attached hereto as Exhibit 99.1 and is incorporated herein by reference.
The information contained in this Item 2.02 to the Company’s Current Report on Form 8-K, including Exhibit 99.1 attached hereto, is being furnished and shall not be deemed “filed” for any purpose, and shall not be deemed incorporated by reference in any filing under the Securities Act of 1933, as amended, or the Securities Exchange Act of 1934, as amended, regardless of any general incorporation language in any such filing.
Item 9.01 Financial Statements and Exhibits.
(d) Exhibits
99.1 Press Release dated June 9, 2015.
SIGNATURE
Pursuant to the requirements of the Securities Exchange Act of 1934, the registrant has duly caused this report to be signed on its behalf by the undersigned hereunto duly authorized.
|
|
MATTRESS FIRM HOLDING CORP. | |
|
|
|
|
|
Date: June 9, 2015 |
By: |
/s/ Alex Weiss |
|
|
|
Alex Weiss |
|
|
|
Chief Financial Officer |
Exhibit 99.1

FOR IMMEDIATE RELEASE
MATTRESS FIRM ANNOUNCES FIRST FISCAL QUARTER FINANCIAL RESULTS
— Net Sales Increased 68.7% Over Prior Year —
— Seventh Consecutive Quarter of Positive Comparable-Store Sales Growth —
— Sleep Train Operations Continue to Outperform Expectations —
— Strong Memorial Day Results; Chicago Market Gaining Strength —
— Increases Sales Guidance and Reaffirms Adjusted EPS Guidance for Fiscal Year 2015 —
HOUSTON, June 9, 2015 /BUSINESSWIRE/ — Mattress Firm Holding Corp. (the “Company”) (NASDAQ: MFRM) today announced its financial results for the first fiscal quarter (13 weeks) ended May 5, 2015. Net sales for the first fiscal quarter increased 68.7% over the prior year to $562.6 million, reflecting comparable-store sales growth of 1.3% and incremental sales from new and acquired stores. The Company reported first fiscal quarter earnings per diluted share (“EPS”) on a generally accepted accounting principles (“GAAP”) basis of $0.15, and EPS on a non-GAAP adjusted basis, excluding acquisition-related costs, ERP system implementation costs and secondary offering costs (“Adjusted”), of $0.33.
Expected diluted EPS on a GAAP basis and Adjusted basis are reconciled in the table below:
First Fiscal Quarter Reconciliation of GAAP to Adjusted EPS and Adjusted Cash EPS**
See “Reconciliation of Reported (GAAP) to Adjusted Statements of Operations Data” for Notes
|
|
|
Thirteen Weeks Ended |
| ||||
|
|
|
April 29, 2014 |
|
May 5, 2015 |
| ||
|
GAAP EPS |
|
$ |
0.22 |
|
$ |
0.15 |
|
|
Adjustments |
|
|
|
|
| ||
|
Acquisition-related costs (1) |
|
0.05 |
|
0.16 |
| ||
|
ERP system implementation costs (2) |
|
0.02 |
|
0.01 |
| ||
|
Other expenses (3) |
|
0.00 |
|
0.01 |
| ||
|
Adjusted EPS* |
|
$ |
0.31 |
|
$ |
0.33 |
|
|
Non-Cash Adjustments |
|
|
|
|
| ||
|
Depreciation and amortization expense |
|
0.17 |
|
0.27 |
| ||
|
Stock-based compensation expense |
|
0.02 |
|
0.03 |
| ||
|
Adjusted Cash EPS* |
|
$ |
0.50 |
|
$ |
0.64 |
|
|
* Due to rounding to the nearest cent, totals may not equal the sum of the lines in the table above. ** Reported sales results and expected GAAP and Adjusted EPS are preliminary and remain subject to adjustment until the filing of the Company’s Quarterly Report on Form 10-Q with the U.S. Securities and Exchange Commission. |
“We are pleased our dedicated organization delivered 68.7% net sales growth and our seventh consecutive quarter of positive comparable-store sales, as we continue to navigate a period of extraordinary integration of multiple acquisitions,” stated Steve Stagner, Mattress Firm’s chief executive officer. “As we had anticipated and previously communicated, our operation of the Chicago market in the first quarter impacted our results as we worked to convert the stores, leading to an approximate loss of $0.07 per diluted share, excluding acquisition-related costs. Once we converted the majority of the signs in our Chicago market prior to Memorial Day, we saw an immediate and now sustained lift in sales as expected. On the West Coast, our Sleep Train business has continued to outperform our expectations and we remain highly confident that we can achieve the synergy targets of $20 million over three years that we identified previously. Furthermore, results from the Memorial Day holiday demonstrate that we have built solid sales momentum that we expect to continue, which further validates our relative market share strategy that over time creates long-term shareholder value.”
5815 Gulf Freeway · Houston, TX · 77023 · Phone: 713-923-1090 · Fax: 713-923-1096
Preliminary First Quarter Financial Summary
· Net sales for the first fiscal quarter increased 68.7% as compared with the comparable prior year period to $562.6 million, reflecting incremental sales from acquired and new stores, and comparable-store sales growth of 1.3%. Comparable-store sales growth in the prior year period was 4.3%.
· Opened 78 new stores and closed nine bringing the total number of Company-operated stores to 2,163 as of the end of the first fiscal quarter.
· Income from operations was $18.8 million. Excluding $10.2 million of acquisition-related costs, ERP system implementation costs and secondary offering costs, Adjusted income from operations was $29.0 million, as compared with $20.0 million for the comparable prior year period. Adjusted operating income margin was 5.2% of net sales as compared with 6.0% in fiscal 2014, and included a 50 basis-point increase from general and administrative expense leverage, offset by a 40 basis-point decline in gross margin, 80 basis-points of expense deleverage from sales and marketing expense, and 10 basis-points of combined operating margin declines in other areas. Please refer to “Reconciliation of Reported (GAAP) to Adjusted Statements of Operations Data” for a reconciliation of income from operations to Adjusted income from operations and other information.
· Net income was $5.5 million and GAAP EPS was $0.15. Excluding $6.3 million, net of income taxes, of acquisition-related costs, ERP system implementation costs and secondary offering costs, Adjusted net income was $11.8 million and Adjusted EPS was $0.33. Please refer to “Reconciliation of Reported (GAAP) to Adjusted Statements of Operations Data” for a reconciliation of net income and GAAP EPS to Adjusted net income and Adjusted EPS, respectively, and other information.
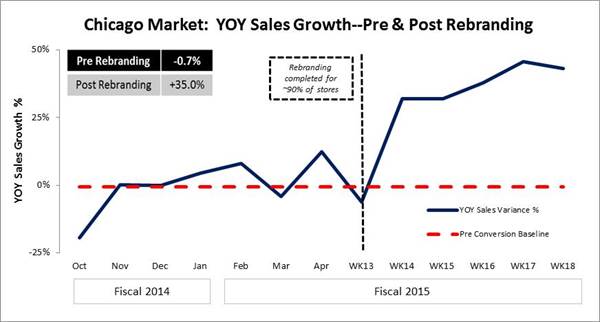
Acquisitions
In September 2014, the Company completed the acquisition of the mattress specialty retail assets and operations of Back to Bed Inc., M World Mattress LLC, MCStores LLC and TBE Orlando LLC, which collectively operate Back to Bed and Bedding Experts retail stores in Illinois, Indiana and Wisconsin and Bedding Experts and Mattress Barn retail stores in Florida. The acquisition included approximately 131 mattress specialty retail stores primarily in the Chicago and Orlando metropolitan areas, for an aggregate purchase price of approximately $64.5 million. The rebranding of the acquired retail stores in the Chicago market was substantially complete by the end of May 2015. The Chicago market sales growth year-over-year (“YOY”) from those stores both prior to and subsequent to their rebranding is demonstrated by the chart below:
Balance Sheet
The Company had cash and cash equivalents of approximately $11.0 million at the end of the first fiscal quarter. Net cash provided by operating activities was $29.8 million for the first fiscal quarter. As of May 5, 2015, there were $53.0 million of borrowings outstanding under the revolving portion of the 2014 Senior Credit Facility (as defined in the Company’s filings with the Securities and Exchange Commission) and approximately $4.2 million in outstanding letters of credit, with additional borrowing capacity of $43.6 million.
Financial Guidance
The Company is also increasing its sales guidance range by $20 million primarily as a result of the anticipation of 20 incremental net new stores and is reaffirming its Adjusted EPS financial guidance for the full fiscal year (52 weeks) ending February 2, 2016 (“fiscal 2015”). These projections are forecasts and are intended solely to give investors an understanding of management’s expectations for the full fiscal year in light of the recent consumer environment and sales trends. The projections do not take into account, or give effect for, acquisitions that may be completed by the Company during the fiscal year or any other events that are beyond the Company’s reasonable control. As used in the guidance table below, “Adjusted Cash EPS” is defined as adjusted net income as presented in the “Reconciliation of Reported (GAAP) to Adjusted Statements of Operations Data”, plus tax effected stock compensation expense and depreciation and amortization, divided by the number of diluted shares. Please refer to “Reconciliation of Reported (GAAP) to Adjusted Statements of Operations Data” for a reconciliation of GAAP EPS to Adjusted Cash EPS and other information which is not calculated on a GAAP basis. Comparable-store sales growth for fiscal year 2014 excludes incremental sales related to the 53rd week of operations. Adjusted data for future periods reflects management’s reasonable estimates of appropriate adjustments based on historical experience. Percentage growth calculations in the table below represent the midpoints of the guidance range provided. Net capital expenditures in the table below represent gross purchases of property and equipment, offset by cash construction allowances received from landlords.
|
|
|
Fifty-Three |
|
Fifty-Two |
|
|
| |
|
|
|
Weeks Ended |
|
Weeks Ended |
|
|
| |
|
|
|
February 3, 2015 |
|
February 2, 2016 |
|
% Growth |
| |
|
New Store Growth (net of closures) |
|
201 |
|
220 - 240 |
|
— |
| |
|
Acquired Store Growth |
|
668 |
|
— |
|
— |
| |
|
Net Sales (in millions) |
|
$ |
1,806 |
|
$2,485 - $2,535 |
|
39 |
% |
|
Comparable-Store Sales Growth |
|
6.1 |
% |
Low Single Digit |
|
— |
| |
|
Adjusted EBITDA (in millions) |
|
$ |
190 |
|
$268 - $280 |
|
44 |
% |
|
GAAP EPS |
|
$ |
1.27 |
|
$2.25 - $2.50 |
|
87 |
% |
|
Adjustments (per share) |
|
$ |
0.76 |
|
$0.20 - $0.25 |
|
— |
|
|
Adjusted EPS |
|
$ |
2.03 |
|
$2.50 - $2.70 |
|
28 |
% |
|
Adjusted Cash EPS |
|
$ |
2.99 |
|
$3.80 - $4.00 |
|
30 |
% |
|
|
|
|
|
|
|
|
| |
|
Diluted Share Count (in millions) |
|
34.8 |
|
35.7 |
|
— |
| |
|
Adjusted Tax Rate |
|
39.5 |
% |
38.5% |
|
— |
| |
|
Depreciation and Amortization (in millions) |
|
$ |
47 |
|
$68 |
|
45 |
% |
|
Interest Expense (in millions) |
|
$ |
22 |
|
$42 |
|
92 |
% |
|
Stock-based Compensation Expense (in millions) |
|
$ |
8 |
|
$10 |
|
23 |
% |
|
Net Capital Expenditures (in millions) |
|
$ |
72 |
|
$100 |
|
38 |
% |
|
Ending Net Debt (in millions) |
|
$ |
757 |
|
$700 |
|
-7 |
% |
Call Information
A conference call to discuss first fiscal quarter results is scheduled for today, June 9, 2015, at 5:00 p.m. Eastern Time. The call will be hosted by Steve Stagner, chief executive officer, Alex Weiss, chief financial officer and Scott McKinney, vice president of investor relations.
The conference call will be accessible by telephone and the internet. To access the call, participants from within the U.S. may dial (877) 705-6003, and participants from outside the U.S. may dial (201) 493-6725. Participants may also access the call via live webcast by visiting the Company’s investor relations web site at ir.mattressfirm.com.
The replay of the call will be available from approximately 8:00 p.m. Eastern Time on June 9, 2015 through midnight Eastern Time on June 23, 2015. To access the replay, the domestic dial-in number is (877) 870-5176, the international dial-in number is (858) 384-5517, and the passcode is 13611132. The archive of the webcast will be available on the Company’s web site for a limited time.
Net Sales and Store Unit Information
The components of the net sales increase for the thirteen weeks ended May 5, 2015 as compared to the corresponding prior year period were as follows (in millions):
|
|
|
Progression in |
| |
|
|
|
Thirteen Weeks |
| |
|
|
|
Ended |
| |
|
|
|
May 5, 2015 |
| |
|
Net sales for prior year period |
|
$ |
333.5 |
|
|
Increase (Decrease) in Net Sales |
|
|
| |
|
Comparable-store sales |
|
4.0 |
| |
|
New stores |
|
58.0 |
| |
|
Acquired stores |
|
169.5 |
| |
|
Closed stores |
|
(2.4 |
) | |
|
Increase in net sales, net |
|
229.1 |
| |
|
Net sales for current year period |
|
$ |
562.6 |
|
|
% increase |
|
68.7 |
% | |
The composition of net sales by major category of product and services were as follows (in millions):
|
|
|
Thirteen Weeks Ended |
| ||||||||
|
|
|
April 29, |
|
% of |
|
May 5, |
|
% of |
| ||
|
|
|
2014 |
|
Total |
|
2015 |
|
Total |
| ||
|
Conventional mattresses |
|
$ |
163.7 |
|
49.1 |
% |
$ |
273.9 |
|
48.7 |
% |
|
Specialty mattresses |
|
136.3 |
|
40.9 |
% |
234.5 |
|
41.7 |
% | ||
|
Furniture and accessories |
|
27.0 |
|
8.1 |
% |
47.0 |
|
8.3 |
% | ||
|
Total product sales |
|
327.0 |
|
98.1 |
% |
555.4 |
|
98.7 |
% | ||
|
Delivery service revenues |
|
6.5 |
|
1.9 |
% |
7.2 |
|
1.3 |
% | ||
|
Total net sales |
|
$ |
333.5 |
|
100.0 |
% |
$ |
562.6 |
|
100.0 |
% |
The activity with respect to the number of Company-operated store units was as follows:
|
|
|
Thirteen Weeks |
|
|
|
|
Ended |
|
|
|
|
May 5, 2015 |
|
|
Store units, beginning of period |
|
2,094 |
|
|
New stores |
|
78 |
|
|
Closed stores |
|
(9 |
) |
|
Store units, end of period |
|
2,163 |
|
Forward-Looking Statements
Certain statements contained in this press release are not based on historical fact and are “forward-looking statements” within the meaning of applicable federal securities laws and regulations. In many cases, you can identify forward-looking statements by terminology such as “may,” “would,” “should,” “could,” “forecast,” “feel,” “project,” “expect,” “plan,” “anticipate,” “believe,” “estimate,” “predict,” “intend,” “potential,” “continue” or the negative of these terms or other comparable terminology; however, not all forward-looking statements contain these identifying words. The forward-looking statements contained in this press release, such as those relating to our net sales, GAAP and Adjusted EPS and net store unit change for fiscal year 2015 and any anticipated effects of any recent acquisitions, are subject to various risks and uncertainties, including but not limited to downturns in the economy; reduction in discretionary spending by consumers; our ability to execute our key business strategies and advance our market-level profitability; our ability to profitably open and operate new stores and capture additional market share; our relationship with our primary mattress suppliers; our dependence on a few key employees; the possible impairment of our goodwill or other acquired intangible assets; the effect of our planned growth and the integration of our acquisitions on our business infrastructure; the impact of seasonality on our financial results and comparable-store sales; our ability to raise adequate capital to support our expansion strategy; our success in pursuing and completing strategic acquisitions; the effectiveness and efficiency of our advertising expenditures; our success in keeping warranty claims and comfort exchange return rates within acceptable levels; our ability to deliver our products in a timely manner; our status as a holding company with no business operations; our ability to anticipate consumer trends; risks related to our primary stockholder, J.W. Childs Associates, L.P.; heightened competition; changes in applicable regulations; risks related to our franchises, including our lack of control over their operation and our liabilities if they default on note or lease obligations; risks related to our stock and other factors set forth under “Risk Factors” in our Annual Report on Form 10-K for the fiscal year ended February 3, 2015 filed with the Securities and Exchange Commission (“SEC”) on April 3, 2015 and our other SEC filings. Forward-looking statements relate to future events or our future financial performance and reflect management’s expectations or beliefs concerning future events as of the date of this press release. Actual results of operations may differ materially from those set forth in any forward-looking statements, and the inclusion of a projection or forward-looking statement in this press release should not be regarded as a representation by us that our plans or objectives will be achieved. We do not undertake to publicly update or revise any of these forward-looking statements, whether as a result of new information, future events or otherwise.
Non-GAAP Financial Measures
Adjusted EBITDA is defined as net income before income tax expense, interest income, interest expense, depreciation and amortization (“EBITDA”), without giving effect to non-cash goodwill and intangible asset impairment charges, gains or losses on store closings and impairment of store assets, gains or losses related to the early extinguishment of debt, financial sponsor fees and expenses, non-cash charges related to stock-based awards and other items that are excluded by management in reviewing the results of operations. We have presented Adjusted EBITDA because we believe that the exclusion of these items is appropriate to provide additional information to investors about our ongoing operating performance excluding certain non-cash and other items and to provide additional information with respect to our ability to comply with various covenants in documents governing our indebtedness and as a means to evaluate our period-to-period results. In evaluating Adjusted EBITDA, you should be aware that in the future we may incur expenses that are the same as or similar to some of the adjustments in this presentation. Our presentation of Adjusted EBITDA should not be construed to imply that our future results will be unaffected by any such adjustments. We have provided this information to analysts, investors and other third parties to enable them to perform more meaningful comparisons of past, present and future operating results and as a means to evaluate the results of our ongoing operations. Management also uses Adjusted
EBITDA to determine executive incentive compensation payment levels. In addition, our compliance with certain covenants under the 2014 Senior Credit Facility, are calculated based on similar measures and differ from Adjusted EBITDA primarily by the inclusion of pro forma results for acquired businesses and new stores in those similar measures. Other companies in our industry may calculate Adjusted EBITDA differently than we do. Adjusted EBITDA is not a measure of performance under U.S. GAAP and should not be considered as a substitute for net income prepared in accordance with U.S. GAAP. Adjusted EBITDA has significant limitations as an analytical tool, and you should not consider it in isolation or as a substitute for analysis of our results as reported under U.S. GAAP.
The following table contains a reconciliation of our net income determined in accordance with U.S. GAAP to EBITDA and Adjusted EBITDA for the periods indicated (in thousands):
|
|
|
Thirteen Weeks Ended |
| ||||
|
|
|
April 29, |
|
May 5, |
| ||
|
|
|
2014 |
|
2015 |
| ||
|
Net income |
|
$ |
7,720 |
|
$ |
5,478 |
|
|
Income tax expense |
|
4,891 |
|
3,100 |
| ||
|
Interest expense, net |
|
2,816 |
|
10,253 |
| ||
|
Depreciation and amortization |
|
8,692 |
|
13,994 |
| ||
|
Intangible assets and other amortization |
|
763 |
|
1,337 |
| ||
|
EBITDA |
|
24,882 |
|
34,162 |
| ||
|
Loss on store closings and impairment of store assets |
|
258 |
|
295 |
| ||
|
Stock-based compensation |
|
1,358 |
|
1,830 |
| ||
|
Secondary offering costs |
|
— |
|
311 |
| ||
|
Vendor new store funds (a) |
|
(97 |
) |
388 |
| ||
|
Acquisition-related costs (b) |
|
2,564 |
|
9,174 |
| ||
|
Other (c) |
|
1,786 |
|
619 |
| ||
|
Adjusted EBITDA |
|
$ |
30,751 |
|
$ |
46,779 |
|
(a) We receive cash payments from certain vendors for each new incremental store that we open (“new store funds”). New store funds are initially recorded in other noncurrent liabilities when received and are then amortized as a reduction of cost of sales over 36 months in our financial statements. Historically, we have considered new store funds as a component of Adjusted EBITDA when received since new store funds are included in cash provided from operations. The adjustment includes the amount of new store funds received during the period presented and eliminates the non-cash reduction in cost of sales included in our results of operations.
(b) Reflects both non-cash effects included in net income related to acquisition accounting adjustments made to inventories and other acquisition-related cash costs included in net income, such as direct acquisition costs and costs related to integration of acquired businesses.
(c) Consists of various items that management excludes in reviewing the results of operations, including $0.7 million and $1.3 million of ERP system implementation costs incurred during the thirteen weeks ended May 5, 2015 and April 29, 2014, respectively.
Adjusted EPS and the other “Adjusted” data provided in this press release, including Adjusted Cash EPS, are also considered non-GAAP financial measures. We report our financial results in accordance with GAAP; however, management believes evaluating our ongoing operating results may be enhanced if investors have additional non-GAAP basis financial measures to facilitate year-over-year comparisons. Management reviews non-GAAP financial measures to assess ongoing operations and considers them to be effective indicators, for both management and investors, of our financial performance over time. Our management does not advocate that investors consider such non-GAAP financial measures in isolation from, or as a substitute for, financial information prepared in accordance with GAAP. For more information, please refer to “Reconciliation of Reported (GAAP) to Adjusted Statements of Operations Data” below.
MATTRESS FIRM HOLDING CORP.
Consolidated Balance Sheets
(In thousands, except share amounts)
(unaudited)
|
|
|
February 3, |
|
May 5, |
| ||
|
|
|
2015 |
|
2015 |
| ||
|
Assets |
|
|
|
|
| ||
|
Current assets: |
|
|
|
|
| ||
|
Cash and cash equivalents |
|
$ |
13,475 |
|
$ |
10,960 |
|
|
Accounts receivable, net |
|
51,193 |
|
67,345 |
| ||
|
Inventories |
|
163,518 |
|
167,528 |
| ||
|
Deferred income tax asset |
|
8,882 |
|
8,890 |
| ||
|
Prepaid expenses and other current assets |
|
43,019 |
|
46,985 |
| ||
|
Total current assets |
|
280,087 |
|
301,708 |
| ||
|
Property and equipment, net |
|
267,602 |
|
279,556 |
| ||
|
Intangible assets, net |
|
215,953 |
|
215,508 |
| ||
|
Goodwill |
|
821,349 |
|
820,703 |
| ||
|
Debt issue costs and other, net |
|
24,033 |
|
23,670 |
| ||
|
Total assets |
|
$ |
1,609,024 |
|
$ |
1,641,145 |
|
|
|
|
|
|
|
| ||
|
Liabilities and Stockholders’ Equity |
|
|
|
|
| ||
|
Current liabilities: |
|
|
|
|
| ||
|
Notes payable and current maturities of long-term debt |
|
$ |
9,947 |
|
$ |
10,616 |
|
|
Accounts payable |
|
149,612 |
|
162,113 |
| ||
|
Accrued liabilities |
|
98,250 |
|
95,267 |
| ||
|
Customer deposits |
|
19,398 |
|
20,841 |
| ||
|
Total current liabilities |
|
277,207 |
|
288,837 |
| ||
|
Long-term debt, net of current maturities |
|
760,091 |
|
759,890 |
| ||
|
Deferred income tax liability |
|
41,455 |
|
42,087 |
| ||
|
Other noncurrent liabilities |
|
94,788 |
|
104,811 |
| ||
|
Total liabilities |
|
1,173,541 |
|
1,195,625 |
| ||
|
|
|
|
|
|
| ||
|
Commitments and contingencies |
|
|
|
|
| ||
|
|
|
|
|
|
| ||
|
Stockholders’ equity: |
|
|
|
|
| ||
|
Common stock, $0.01 par value; 120,000,000 shares authorized; 35,134,187 and 35,101,632 shares issued and outstanding at February 3, 2015; and 35,219,398 and 35,186,241 shares issued and outstanding at May 5, 2015, respectively |
|
351 |
|
352 |
| ||
|
Additional paid-in capital |
|
435,882 |
|
440,440 |
| ||
|
Accumulated (deficit) retained earnings |
|
(750 |
) |
4,728 |
| ||
|
Total stockholders’ equity |
|
435,483 |
|
445,520 |
| ||
|
Total liabilities and stockholders’ equity |
|
$ |
1,609,024 |
|
$ |
1,641,145 |
|
MATTRESS FIRM HOLDING CORP.
Consolidated Statements of Operations
(In thousands, except share and per share amounts)
(unaudited)
|
|
|
Thirteen Weeks Ended |
| ||||||||
|
|
|
April 29, |
|
% of |
|
May 5, |
|
% of |
| ||
|
|
|
2014 |
|
Sales |
|
2015 |
|
Sales |
| ||
|
Net sales |
|
$ |
333,502 |
|
100.0 |
% |
$ |
562,554 |
|
100.0 |
% |
|
Cost of sales |
|
212,652 |
|
63.8 |
% |
361,283 |
|
64.2 |
% | ||
|
Gross profit from retail operations |
|
120,850 |
|
36.2 |
% |
201,271 |
|
35.8 |
% | ||
|
Franchise fees and royalty income |
|
1,186 |
|
0.4 |
% |
1,115 |
|
0.2 |
% | ||
|
Total gross profit |
|
122,036 |
|
36.6 |
% |
202,386 |
|
36.0 |
% | ||
|
Operating expenses: |
|
|
|
|
|
|
|
|
| ||
|
Sales and marketing expenses |
|
75,665 |
|
22.7 |
% |
131,896 |
|
23.5 |
% | ||
|
General and administrative expenses |
|
30,686 |
|
9.2 |
% |
51,364 |
|
9.1 |
% | ||
|
Loss on store closings and impairment of store assets |
|
258 |
|
0.1 |
% |
295 |
|
0.1 |
% | ||
|
Total operating expenses |
|
106,609 |
|
32.0 |
% |
183,555 |
|
32.7 |
% | ||
|
Income from operations |
|
15,427 |
|
4.6 |
% |
18,831 |
|
3.3 |
% | ||
|
Other expense: |
|
|
|
|
|
|
|
|
| ||
|
Interest expense, net |
|
2,816 |
|
0.8 |
% |
10,253 |
|
1.8 |
% | ||
|
Income before income taxes |
|
12,611 |
|
3.8 |
% |
8,578 |
|
1.5 |
% | ||
|
Income tax expense |
|
4,891 |
|
1.5 |
% |
3,100 |
|
0.5 |
% | ||
|
Net income |
|
$ |
7,720 |
|
2.3 |
% |
$ |
5,478 |
|
1.0 |
% |
|
|
|
|
|
|
|
|
|
|
| ||
|
Basic net income per common share |
|
$ |
0.23 |
|
|
|
$ |
0.16 |
|
|
|
|
Diluted net income per common share |
|
$ |
0.22 |
|
|
|
$ |
0.15 |
|
|
|
|
|
|
|
|
|
|
|
|
|
| ||
|
Reconciliation of weighted-average shares outstanding: |
|
|
|
|
|
|
|
|
| ||
|
Basic weighted average shares outstanding |
|
34,027,941 |
|
|
|
35,146,762 |
|
|
| ||
|
Effect of dilutive securities: |
|
|
|
|
|
|
|
|
| ||
|
Stock options |
|
321,012 |
|
|
|
344,746 |
|
|
| ||
|
Restricted shares |
|
44,480 |
|
|
|
92,351 |
|
|
| ||
|
Diluted weighted average shares outstanding |
|
34,393,433 |
|
|
|
35,583,859 |
|
|
| ||
MATTRESS FIRM HOLDING CORP.
Consolidated Statements of Cash Flows
(In thousands)
(unaudited)
|
|
|
Thirteen Weeks Ended |
| ||||
|
|
|
April 29, |
|
May 5, |
| ||
|
|
|
2014 |
|
2015 |
| ||
|
Cash flows from operating activities: |
|
|
|
|
| ||
|
Net income |
|
$ |
7,720 |
|
$ |
5,478 |
|
|
Adjustments to reconcile net income to cash flows provided by operating activities: |
|
|
|
|
| ||
|
Depreciation and amortization |
|
8,692 |
|
13,994 |
| ||
|
Loan fee and other amortization |
|
594 |
|
1,785 |
| ||
|
Deferred income tax expense |
|
246 |
|
1,936 |
| ||
|
Stock-based compensation |
|
1,358 |
|
2,066 |
| ||
|
Loss on store closings and impairment of store assets |
|
258 |
|
295 |
| ||
|
Construction allowances from landlords |
|
1,747 |
|
2,506 |
| ||
|
Excess tax benefits associated with stock-based awards |
|
(192 |
) |
(824 |
) | ||
|
Effects of changes in operating assets and liabilities, excluding business acquisitions: |
|
|
|
|
| ||
|
Accounts receivable |
|
(4,588 |
) |
(15,408 |
) | ||
|
Inventories |
|
(8,603 |
) |
(4,056 |
) | ||
|
Prepaid expenses and other current assets |
|
(9,257 |
) |
(3,964 |
) | ||
|
Other assets |
|
(1,124 |
) |
(816 |
) | ||
|
Accounts payable |
|
9,402 |
|
18,690 |
| ||
|
Accrued liabilities |
|
442 |
|
522 |
| ||
|
Customer deposits |
|
1,114 |
|
1,443 |
| ||
|
Other noncurrent liabilities |
|
(681 |
) |
6,151 |
| ||
|
Net cash provided by operating activities |
|
7,128 |
|
29,798 |
| ||
|
Cash flows from investing activities: |
|
|
|
|
| ||
|
Purchases of property and equipment |
|
(19,334 |
) |
(34,360 |
) | ||
|
Business acquisitions, net of cash acquired |
|
(77,350 |
) |
118 |
| ||
|
Net cash used in investing activities |
|
(96,684 |
) |
(34,242 |
) | ||
|
Cash flows from financing activities: |
|
|
|
|
| ||
|
Proceeds from issuance of debt |
|
132,000 |
|
23,000 |
| ||
|
Principal payments of debt |
|
(54,427 |
) |
(23,564 |
) | ||
|
Proceeds from exercise of common stock options |
|
563 |
|
1,669 |
| ||
|
Excess tax benefits associated with stock-based awards |
|
192 |
|
824 |
| ||
|
Net cash provided by financing activities |
|
78,328 |
|
1,929 |
| ||
|
Net decrease in cash and cash equivalents |
|
(11,228 |
) |
(2,515 |
) | ||
|
Cash and cash equivalents, beginning of period |
|
22,878 |
|
13,475 |
| ||
|
Cash and cash equivalents, end of period |
|
$ |
11,650 |
|
$ |
10,960 |
|
|
Cash paid for: |
|
|
|
|
| ||
|
Interest |
|
$ |
2,652 |
|
$ |
9,806 |
|
|
Income taxes |
|
$ |
150 |
|
$ |
4,736 |
|
|
Supplemental disclosure of noncash investing activity: |
|
|
|
|
| ||
|
Capital expenditures included in accounts payable and accruals at end of period |
|
$ |
4,739 |
|
$ |
7,659 |
|
MATTRESS FIRM HOLDING CORP.
Reconciliation of Reported (GAAP) to Adjusted Statements of Operations Data
(In thousands, except share and per share amounts)
|
|
|
Thirteen Weeks Ended |
| ||||||||||||||||||||||||||
|
|
|
April 29, 2014 |
|
May 5, 2015 |
| ||||||||||||||||||||||||
|
|
|
Income |
|
Income |
|
|
|
Diluted |
|
|
|
Income |
|
Income |
|
|
|
Diluted |
|
|
| ||||||||
|
|
|
From |
|
Before Income |
|
Net |
|
Weighted |
|
Diluted |
|
From |
|
Before Income |
|
Net |
|
Weighted |
|
Diluted |
| ||||||||
|
|
|
Operations |
|
Taxes |
|
Income |
|
Shares |
|
EPS* |
|
Operations |
|
Taxes |
|
Income |
|
Shares |
|
EPS* |
| ||||||||
|
As Reported |
|
$ |
15,427 |
|
$ |
12,611 |
|
$ |
7,720 |
|
34,393,433 |
|
$ |
0.22 |
|
$ |
18,831 |
|
$ |
8,578 |
|
$ |
5,478 |
|
35,583,859 |
|
$ |
0.15 |
|
|
% of sales |
|
4.6 |
% |
3.8 |
% |
2.3 |
% |
|
|
|
|
3.3 |
% |
1.5 |
% |
1.0 |
% |
|
|
|
| ||||||||
|
Adjustments |
|
|
|
|
|
|
|
|
|
|
|
|
|
|
|
|
|
|
|
|
| ||||||||
|
Acquisition-related costs (1) |
|
3,010 |
|
3,010 |
|
1,845 |
|
— |
|
0.05 |
|
9,174 |
|
9,174 |
|
5,639 |
|
— |
|
0.16 |
| ||||||||
|
ERP system implementation costs (2) |
|
1,351 |
|
1,351 |
|
828 |
|
— |
|
0.02 |
|
666 |
|
666 |
|
409 |
|
— |
|
0.01 |
| ||||||||
|
Other expenses (3) |
|
197 |
|
197 |
|
121 |
|
— |
|
0.00 |
|
311 |
|
311 |
|
311 |
|
— |
|
0.01 |
| ||||||||
|
Total adjustments |
|
4,558 |
|
4,558 |
|
2,794 |
|
— |
|
0.08 |
|
10,151 |
|
10,151 |
|
6,359 |
|
— |
|
0.18 |
| ||||||||
|
As Adjusted |
|
$ |
19,985 |
|
$ |
17,169 |
|
$ |
10,514 |
|
34,393,433 |
|
$ |
0.31 |
|
$ |
28,982 |
|
$ |
18,729 |
|
$ |
11,837 |
|
35,583,859 |
|
$ |
0.33 |
|
|
% of sales |
|
6.0 |
% |
5.1 |
% |
3.2 |
% |
|
|
|
|
5.2 |
% |
3.3 |
% |
2.1 |
% |
|
|
|
| ||||||||
|
Non-Cash Adjustments |
|
|
|
|
|
|
|
|
|
|
|
|
|
|
|
|
|
|
|
|
| ||||||||
|
Depreciation and amortization |
|
9,286 |
|
9,286 |
|
5,692 |
|
— |
|
0.17 |
|
15,779 |
|
15,779 |
|
9,699 |
|
— |
|
0.27 |
| ||||||||
|
Stock-based compensation expense |
|
1,358 |
|
1,358 |
|
832 |
|
— |
|
0.02 |
|
1,830 |
|
1,830 |
|
1,125 |
|
— |
|
0.03 |
| ||||||||
|
Total adjustments |
|
10,644 |
|
10,644 |
|
6,524 |
|
— |
|
0.19 |
|
17,609 |
|
17,609 |
|
10,824 |
|
— |
|
0.30 |
| ||||||||
|
Adjusted Cash EPS |
|
$ |
30,629 |
|
$ |
27,813 |
|
$ |
17,038 |
|
34,393,433 |
|
$ |
0.50 |
|
$ |
46,591 |
|
$ |
36,338 |
|
$ |
22,661 |
|
35,583,859 |
|
$ |
0.64 |
|
(1) Acquisition-related costs, which are included in the “As Reported” results of operations, consist of acquisition-related costs as defined under U.S. GAAP, including advisory, legal, accounting, valuation, and other professional or consulting fees and, in addition, costs of integrating store and warehouse operations and corporate functions that are not expected to recur as acquisitions are absorbed. On March 3, 2014, we acquired the assets and operations of Yotes, Inc., including 34 mattress specialty retail stores. On March 3, 2014, we acquired the Virginia assets and operations of Southern Max LLC, including 3 mattress specialty retail stores. On April 3, 2014, we acquired the outstanding partnership interests in Sleep Experts Partners, L.P., including 55 mattress specialty retail stores. On June 4, 2014, we acquired substantially all of the mattress specialty retail assets and operations of Mattress Liquidators, Inc., including 67 mattress specialty retail stores, which operated Mattress King retail stores in Colorado and BedMart retail stores in Arizona. On September 8, 2014, we acquired substantially all of the mattress specialty retail assets and operations of Best Mattress Co., Inc., related to the operation of 15 mattress specialty retail stores under the brand Mattress Discounters in Pennsylvania. On September 30, 2014, we acquired substantially all of the mattress specialty retail assets and operations of Back to Bed Inc., M World Mattress LLC, MCStores LLC and TBE Orlando LLC, related to the operation of 131 mattress specialty retail stores under the brands Back to Bed and Bedding Experts in the Chicago metropolitan area and Mattress Barn in the Orlando metropolitan area. On October 20, 2014, we acquired 100% of the outstanding equity interests in The Sleep Train, Inc., related to the operation of 314 mattress specialty retail stores in California, Oregon, Washington, Nevada, Idaho and Hawaii. On January 6, 2015, we acquired substantially all of the mattress specialty retail assets and operations of Sleep America LLC, which operated approximately 45 Sleep America retail stores in Arizona. On January 13, 2015 we acquired substantially all of the mattress specialty retail assets and operations of Mattress World, Inc., related to the operation of 4 mattress specialty retail stores under the brand Mattress World in Pennsylvania. Acquisition-related costs, consisting of direct transaction costs and integration costs are included in the results of operations as incurred. We incurred approximately $9.2 million and $3.0 million of acquisition-related costs during the thirteen weeks ended May 5, 2015 and April 29, 2014, respectively.
(2) Reflects implementation costs included in the results of operations as incurred, consisting primarily of training-related costs, related to the roll-out of the Microsoft Dynamics AX for Retail ERP system. During the thirteen weeks ended May 5, 2015 and April 29, 2014, we incurred approximately $0.7 million and $1.4 million, respectively, of ERP system implementation costs which includes none and $0.1 million, respectively, of accelerated depreciation expense on our legacy ERP system.
(3) Reflects $0.2 million of expensed legal fees relating to our February 2014 debt amendment and extension recorded in the thirteen weeks ended April 29, 2014 and $0.3 million of costs borne by us in connection with a secondary offering of common stock by certain of our selling shareholders which was completed in April 2015. No offering proceeds were received by the Company.
Our “As Adjusted” data is considered a non-U.S. GAAP financial measure and is not in accordance with, or preferable to, “As Reported,” or GAAP financial data. However, we are providing this information as we believe it facilitates year-over-year comparisons for investors and financial analysts.
About Mattress Firm Holding Corp.
With more than 2,200 company-operated and franchised stores across 40 states, Mattress Firm Holding Corp. (MFRM) has the largest geographic footprint in the United States among multi-brand mattress retailers. Founded in 1986, Houston-based MFRM is the nation’s leading bedding retailer with over $2.0 billion in sales over the past 12 months. MFRM, through its family of brands, including Mattress Firm, Sleep Train and Mattress Pro, offers a broad selection of both traditional and specialty mattresses, bedding accessories and other related products from leading manufacturers, including Sealy, Tempur-Pedic, Serta, Simmons, Stearns & Foster, and Hampton & Rhodes. More information is available at www.mattressfirm.com. MFRM’s website is not part of this press release.
Investor Relations Contact: Brad Cohen, [email protected], 713-343-3652
Media Contact: Joanna Singleton, [email protected], 214-269-4401
###
Serious News for Serious Traders! Try StreetInsider.com Premium Free!
You May Also Be Interested In
- Businessabc.net, part of Ztudium group partners with IEBF to offer GenerativeAI tools for SMEs, Adds Dilip Pungliya to Leadership
- CSE Bulletin: Delist - Tryp Therapeutics Inc. (TRYP)
- Smith-Midland Announces Receipt of Nasdaq Letter
Create E-mail Alert Related Categories
SEC FilingsSign up for StreetInsider Free!
Receive full access to all new and archived articles, unlimited portfolio tracking, e-mail alerts, custom newswires and RSS feeds - and more!
