

Form 8-K Lumos Networks Corp. For: Aug 05
 Tweet
Tweet Share
Share
UNITED STATES
SECURITIES AND EXCHANGE COMMISSION
Washington, D.C. 20549
FORM 8-K
CURRENT REPORT
Pursuant to Section 13 or 15(d)
of the Securities Exchange Act of 1934
Date of Report (Date of earliest event reported): August 5, 2015
Lumos Networks Corp.
(Exact Name of Registrant as Specified in Charter)
| Delaware | 001-35180 | 80-0697274 | ||
| (State or Other Jurisdiction of Incorporation) |
(Commission File Number) |
(IRS Employer Identification No.) |
One Lumos Plaza, P.O. Box 1068, Waynesboro, Virginia 22980
(Address of Principal Executive Offices) (Zip Code)
(540) 946-2000
(Registrant’s telephone number, including area code)
N/A
(Former name or former address, if changed since last report)
Check the appropriate box below if the Form 8-K filing is intended to simultaneously satisfy the filing obligation of the registrant under any of the following provisions (see General Instruction A.2. below):
| ¨ | Written communications pursuant to Rule 425 under the Securities Act (17 CFR 230.425) |
| ¨ | Soliciting material pursuant to Rule 14a-12 under the Exchange Act (17 CFR 240.14a-12) |
| ¨ | Pre-commencement communications pursuant to Rule 14d-2(b) under the Exchange Act (17 CFR 240.14d-2(b)) |
| ¨ | Pre-commencement communications pursuant to Rule 13e-4(c) under the Exchange Act (17 CFR 240.13e-4(c)) |
| Item 2.02 | Results of Operations and Financial Condition. |
On August 5, 2015, Lumos Networks Corp. (the “Company”) issued a press release (the “Earnings Release”) announcing its results of operations and financial condition for the three and six months ended June 30, 2015. A copy of the Earnings Release is being furnished as Exhibit 99.1 to this Current Report on Form 8-K and incorporated herein by reference.
In accordance with General Instruction B.2 of Form 8-K, the information in this Current Report on Form 8-K, including Exhibit 99.1, shall not be deemed “filed” for the purposes of Section 18 of the Securities Exchange Act of 1934, as amended, or otherwise subject to the liability of that section, nor shall it be deemed incorporated by reference in any filing under the Securities Act of 1933, as amended, except as shall be expressly set forth by specific reference in such a filing.
| Item 7.01 | Regulation FD Disclosure. |
On August 5, 2015, the Company disclosed in the Earnings Release that it has entered into a definitive agreement providing for an investment by affiliates of Pamplona Capital Management LLC (“Pamplona”) in the Company. In connection with the investment, affiliates of Pamplona will invest $150 million in cash in debt securities to be issued by the Company and will be granted warrants to acquire up to 5.5 million shares of the Company’s common stock.
A copy of the Earnings Release is being furnished as Exhibit 99.1 to this Current Report on Form 8-K and incorporated herein by reference. In addition, a copy of the materials that the Company will present in connection with upcoming presentations to investors is furnished as Exhibit 99.2 to this Current Report on Form 8-K.
In accordance with General Instruction B.2 of Form 8-K, the information in this Current Report on Form 8-K, including Exhibit 99.2, shall not be deemed “filed” for the purposes of Section 18 of the Securities Exchange Act of 1934, as amended, or otherwise subject to the liabilities of that section, nor shall it be deemed incorporated by reference in any filing under the Securities Act of 1933, as amended, except as shall be expressly set forth by specific reference in such a filing. The information in this Report will not be deemed as an admission as to the materiality of any information required to be disclosed solely to satisfy the requirements of Regulation FD.
| Item 9.01 | Financial Statements and Exhibits. |
| (d) | Exhibits |
| Exhibit No. |
Description | |
| 99.1 | Press release issued by Lumos Networks Corp. dated August 5, 2015 (furnished herein pursuant to Items 2.02 and 7.01) | |
| 99.2 | Company Presentation – Second Quarter 2015 Update (furnished herein pursuant to Item 7.01) | |
2
SIGNATURE
Pursuant to the requirements of the Securities Exchange Act of 1934, the Registrant has duly caused this report to be signed on its behalf by the undersigned hereunto duly authorized.
Date: August 5, 2015
| LUMOS NETWORKS CORP. | ||
| By: | /s/ Johan G. Broekhuysen | |
| Johan G. Broekhuysen Executive Vice President, Chief Financial Officer and Chief Accounting Officer | ||
3
EXHIBIT INDEX
| Exhibit No. |
Description | |
| 99.1 | Press release issued by Lumos Networks Corp. dated August 5, 2015 (furnished herein pursuant to Items 2.02 and 7.01) | |
| 99.2 | Company Presentation – Second Quarter 2015 Update (furnished herein pursuant to Item 7.01) | |
4
Exhibit 99.1
| Contact: | Will Davis Vice President of Investor Relations and Chief of Staff Phone: 917-519-6994 Email: [email protected] |
Lumos Networks Corp. Reports Second Quarter 2015 Results
Announces $150 million Investment from Pamplona Capital Management
Creates Strategic Partnership to Accelerate the Transformation of Lumos Networks to a Pure-Play Fiber Bandwidth Infrastructure Company
Delivers 2Q15 Revenue of $51 million and Adjusted EBITDA of $22.7 Million
Reiterates 2015 Revenue and Adjusted EBITDA Guidance of Approximately $202 Million and Approximately $92 Million, respectively
2Q15 Fiber to the Cell (“FTTC”) Revenue Reaches $6.8 million, up 34% Year-over-Year
Raises 2015 Enterprise Growth Target to 8-9% from 6% after posting 8.2% 2Q15 Enterprise growth
WAYNESBORO, VA – August 5, 2015 – Lumos Networks Corp. (“Lumos Networks”, “Lumos” or the “Company”) (Nasdaq: LMOS), a leading fiber-based service provider of data, voice and IP-based telecommunication services in the Mid-Atlantic region, today announced entry into definitive agreements providing for an investment by affiliates of Pamplona Capital Management (“Pamplona”) in the Company, forming a strategic financial partnership between the parties. Pamplona is a leading global private equity firm with offices in New York and London. Since its inception in 2005, Pamplona has raised private equity funds with over $8 billion of capital commitments and invests across a wide range of industry sectors and geographies.
The closing of the investment is scheduled to occur before the market opens on August 6, 2015, upon which affiliates of Pamplona will invest $150 million in debt securities of the Company and warrants to acquire up to 5.5 million shares of the Company’s common stock. The Company intends to allocate up to $50 million of the investment proceeds to pay down its existing senior bank debt and costs related to the transaction with the remainder of approximately $100 million expected to be allocated towards pursuing potential growth opportunities, both organic and inorganic, in order to accelerate the Company’s strategic transformation to a pure-play fiber bandwidth infrastructure company. At the closing, the Company will appoint William Pruellage, a Partner of Pamplona based in New York, and Peter Aquino, former Executive Chairman of Primus Telecommunications Group and former President and CEO of RCN Corporation, as members of the Lumos Board of Directors in accordance with the terms of Pamplona’s investment which entitle Pamplona to nominate two Board designees. No other changes to the Lumos Board of Directors are contemplated at this time.
Interest payable on the notes to be issued to Pamplona will accrue at an annual rate of 8%, paid quarterly either in cash or in kind. The warrants to be issued will entitle Pamplona to purchase up to 5.5 million shares of the Company’s common stock by net share settlement at an exercise price equal to $13.99, the closing bid price per share of the Company’s common stock prior to the announcement of the transaction on August 5, 2015. Further detail regarding the terms of the strategic investment will be disclosed in a Current Report on Form 8-K to be filed by the Company with the SEC.
“We are excited to announce our strategic financial relationship with Pamplona as it serves as validation of our operating strategy and provides significant capital runway needed to accelerate our transformation into a pure-play fiber bandwidth infrastructure provider,” said Timothy G. Biltz, President and CEO of Lumos Networks. “We are in the midst of a generational demand curve for bandwidth and our industry is aggressively consolidating. This partnership provides the capital required to capitalize on these significant opportunities. Additionally, the investment will result in adding two strong members to our Board who we believe will significantly add to our already robust Board dynamic, including by the addition of Peter Aquino who brings relevant operational and capital markets industry expertise to our Board that we believe will be invaluable in helping to accelerate our transformation and the enhancement of value for our shareholders.”
“Pamplona is thrilled to announce this strategic investment in Lumos Networks,” said William Pruellage. “We see a great opportunity for Lumos to become a significant platform company within the fiber and co-location sectors and have strong confidence that the current management team will successfully execute this transformation. We believe that our interests are very clearly aligned with those of the current shareholder base and the Lumos leadership team.”
Wells Fargo Securities, LLC acted as exclusive financial advisor to Lumos Networks and Troutman Sanders LLP provided legal representation on the transaction. RBC Capital Markets has also provided investment banking services to Lumos Networks. Jefferies LLC acted as the exclusive financial advisor to Pamplona and Skadden, Arps, Slate Meagher & Flom LLP provided legal representation.
Second Quarter 2015 Results
Total revenue in the second quarter of 2015 grew nearly 1% on a sequential basis and 1.6% from the prior year period. Total Adjusted EBITDA reached nearly $22.7 million, up nearly 1% from the first quarter of 2015 and essentially flat from the prior year period. Total Data segment revenue grew over 5% year-over-year and constituted 55% of total revenue, up from 53% in the prior year period. In aggregate, FTTC and Enterprise revenue grew nearly 17% year-over-year and constituted 64% of total data revenue, up from 58% in the prior year period.
The Company generated operating income of $9.3 million and $17.7 million for the three and six months ended June 30, 2015, respectively. Net income attributable to Lumos Networks Corp. was $3.3 million, or 14 cents per diluted share, for the second quarter of 2015 and $6.1 million, or 26 cents per diluted share, for the six months ended June 20, 2015.
“Our results in the second quarter validate that our transformation into a fiber bandwidth infrastructure provider is progressing well,” said Timothy G. Biltz, President and CEO of Lumos Networks. “We are investing in valuable fiber infrastructure, supported by long-term contracts from large Enterprise and carrier customers. FTTC revenue is on pace to achieve our target of $29 million in 2015, up 45% year-over-year. We now expect 2015 Enterprise revenue of $46 million, up 8-9% from 2014 and ahead of our prior guidance of 6% growth. Due to higher than expected TDM churn from carrier grooming, we reduce our 2015 target for total data revenue slightly from $116 million to $115 million. This implies 2015 overall data growth of 8%, which is among the industry’s fastest organic data growth rates.”
“We remain focused on completing the vast majority of our transformational network expansion project of approximately 665 miles into the Richmond and Norfolk markets by the end of 2015. This network, underpinned by a 257 FTTC site build with a major US wireless carrier, increases our Enterprise addressable market by approximately 60%, or $135 million, and significantly de-risks our business model in 2016.”
Second Quarter 2015 Highlights
| • | The Company ended 2Q15 with 976 unique FTTC sites, up 69 sequentially and an increase of 45% from the prior year. Additionally, Lumos ended the second quarter with 1,307 total FTTC connections, which is in-line with our target, up 49% from the prior year. In the last year, Lumos installed 431 FTTC connections. |
| • | In the second quarter of 2015, the Company renewed Enterprise accounts totaling $255,000 in monthly recurring charges (“MRC”), up 60% from the prior year period. In the last six quarters, Lumos has renewed approximately 27% of the total Enterprise monthly revenue stream on long-term contracts of 3-4 years. In the first half of 2015, the Company renewed Enterprise accounts totaling nearly $18.5 million in total contract value, up 60% from the first half of 2014. |
| • | Lumos Networks added 145 route miles of fiber in the quarter, all of which are Company-owned, ending the quarter with 8,100 total route miles. Lumos added 44 Enterprise lit buildings in the quarter and 97 in the first half of 2015, up over 70% from the second half of 2014. |
Business Outlook
For the full year 2015, the Company reiterates its financial guidance for revenue of approximately $202 million, Adjusted EBITDA of approximately $92 million and capital expenditures of approximately $112 million.
Please see the schedules accompanying this release for additional financial guidance, including reconciliations of non-GAAP measures to GAAP results.
Statements made are based on management’s current expectations. These statements are forward-looking and actual results may differ materially. Please see “Special Note from the Company Regarding Forward-Looking Statements.”
Conference Call
A conference call and simultaneous webcast, hosted by Timothy G. Biltz, CEO, Johan Broekhuysen, CFO, and Will Davis, Vice President of Investor Relations and Chief of Staff, to discuss today’s announcement and to review these financial and operational results and financial guidance will be held at 8:30 A.M. (ET) on August 6, 2015.
The webcast may be accessed via the Internet at http://ir.lumosnetworks.com/ and the live call (“Lumos Networks First Quarter Earnings Conference Call”) may be accessed with the following numbers:
Domestic: 1-877-510-3772
International: 1-412-902-4135
Canada: 1-855-669-9657
The conference call will be archived and available for replay through August 21, 2015 and may be accessed with the following numbers:
Domestic: 1-877-344-7529
International: 1-412-317-0088
Canada: 1-855-669-9658
Replay pass codes: Conference ID: 10069524
The webcast will also be archived and the replay may be accessed at http://ir.lumosnetworks.com/.
About Lumos Networks
Lumos Networks is a leading fiber-based service provider in the Mid-Atlantic region serving Carrier, Enterprise and Data Center customers, offering end-to-end connectivity in 24 markets in Virginia, Pennsylvania, West Virginia, Maryland, Ohio and Kentucky. With a fiber network of 8,100 fiber route miles and over 369,000 total fiber strand miles, Lumos Networks connects 976 unique Fiber to the Cell sites, 1,307 total FTTC connections, 32 data centers, including 7 company owned co-location facilities, 1,574 on-net buildings and approximately 2,560 total on-net locations. In 2014, Lumos Networks generated over $106 million in data revenue and nearly $52 million in Adjusted EBITDA over our fiber network. Detailed information about Lumos Networks is available at www.lumosnetworks.com.
About Pamplona Capital Management
Pamplona Capital Management is a New York and London based specialist investment manager established in 2005 that provides an alternative investment platform across private equity, fund of hedge funds and single manager hedge fund investments. Pamplona Capital Management manages over USD 8 billion in assets across a number of funds for a variety of clients including public pension funds, international wealth managers, multinational corporations, family offices and funds of hedge funds. Pamplona is currently managing its fourth private equity fund, Pamplona Capital Partners IV, L.P., which was raised in 2014. Pamplona invests long-term capital across the capital structure of its portfolio companies in both public and private market situations. Please see http://pamplonafunds.com for further information.
Pamplona Media Enquiries:
Temple Bar Advisory
Ed Orlebar
Phone: +44 20 7002 1510 / +44 773 872 4630
E-Mail: [email protected]
Non-GAAP Measures
Adjusted EBITDA is defined as net income attributable to Lumos Networks before interest, income taxes, depreciation and amortization, accretion of asset retirement obligations, net income or loss attributable to non-controlling interests, other income or expenses, equity-based compensation charges, acquisition-related charges, amortization of actuarial losses on retirement plans, employee separation charges, restructuring-related charges, gain or loss on settlements and gain or loss on interest rate swap derivatives. Adjusted EBITDA margin is calculated as the ratio of Adjusted EBITDA, as defined, to operating revenues.
Adjusted EBITDA is a non-GAAP financial performance measure. It should not be considered in isolation or as an alternative to measures determined in accordance with GAAP. Please refer to the schedules herein and our SEC filings for a reconciliation of these non-GAAP financial performance measures to the most comparable measures reported in accordance with GAAP and for a discussion of the presentation, comparability and use of such financial performance measures.
SPECIAL NOTE FROM THE COMPANY REGARDING FORWARD-LOOKING STATEMENTS
Any statements contained in this presentation that are not statements of historical fact, including statements about our beliefs and expectations, are forward-looking statements and should be evaluated as such. The words “anticipates,” “believes,” “expects,” “intends,” “plans,” “estimates,” “targets,” “projects,” “should,” “may,” “will,” “scheduled” and similar words and expressions are intended to identify forward-looking statements. Such forward-looking statements reflect, among other things, our current expectations, plans and strategies, and anticipated financial results, all of which are subject to known and unknown risks, uncertainties and factors that may cause our actual results to differ materially from those expressed or implied by these forward-looking statements. Many of these risks are beyond our ability to control or predict. Because of these risks, uncertainties and assumptions, you should not place undue reliance on these forward-looking statements. Furthermore, forward-looking statements speak only as of the date they are made. We do not undertake any obligation to update or review any forward-looking information, whether as a result of new information, future events or otherwise. Important factors with respect to any such forward-looking statements, including certain risks and uncertainties that could cause actual results to differ from those contained in the forward-looking statements, include, but are not limited to: rapid development and intense competition in the telecommunications and high speed data transport industry; our ability to offset expected revenue declines in legacy voice and access products related to the recent regulatory actions, wireless substitution, technology changes and other factors; our ability to effectively allocate capital and implement our “edge-out” expansion plans in a timely manner; our ability to complete customer installations in a timely manner; adverse economic conditions; operating and financial restrictions imposed by our senior credit facility; our cash and capital requirements; declining prices for our services; our ability to maintain and enhance our network; the potential to experience a high rate of customer turnover; federal and state regulatory fees, requirements and developments; our reliance on certain suppliers and vendors; and other unforeseen difficulties that may occur. These risks and uncertainties are not intended to represent a complete list of all risks and uncertainties inherent in our business, and should be read in conjunction with the more detailed cautionary statements and risk factors included in our SEC filings, including our Annual Report filed on Form 10-K.
Exhibits:
| • | Condensed Consolidated Balance Sheets |
| • | Condensed Consolidated Statements of Income |
| • | Condensed Consolidated Statements of Cash Flows |
| • | Summary of Operating Results, Customer and Network Statistics |
| • | Reconciliation of Net Income Attributable to Lumos Networks Corp. to Adjusted EBITDA |
| • | Business Outlook |
Lumos Networks Corp.
Condensed Consolidated Balance Sheets
| June 30, 2015 | December 31, 2014 | |||||||
| (In thousands) |
||||||||
| ASSETS |
||||||||
| Current Assets |
||||||||
| Cash and cash equivalents |
$ | 7,200 | $ | 14,140 | ||||
| Marketable securities |
22,046 | 16,870 | ||||||
| Restricted cash 1 |
2,634 | 4,208 | ||||||
| Accounts receivable, net |
21,442 | 22,925 | ||||||
| Other receivables |
2,409 | 2,113 | ||||||
| Income tax receivable |
175 | 172 | ||||||
| Prepaid expenses and other |
5,487 | 4,321 | ||||||
| Deferred income taxes |
5,418 | 5,601 | ||||||
|
|
|
|
|
|||||
| Total Current Assets |
66,811 | 70,350 | ||||||
|
|
|
|
|
|||||
| Securities and investments |
1,092 | 914 | ||||||
| Property, plant and equipment, net |
462,198 | 429,451 | ||||||
| Other Assets |
||||||||
| Goodwill |
100,297 | 100,297 | ||||||
| Other intangibles, net |
12,536 | 15,884 | ||||||
| Deferred charges and other assets |
7,059 | 5,718 | ||||||
|
|
|
|
|
|||||
| Total Other Assets |
119,892 | 121,899 | ||||||
|
|
|
|
|
|||||
| Total Assets |
$ | 649,993 | $ | 622,614 | ||||
|
|
|
|
|
|||||
| LIABILITIES AND EQUITY |
||||||||
| Current Liabilities |
||||||||
| Current portion of long-term debt |
$ | 10,462 | $ | 10,227 | ||||
| Accounts payable |
16,020 | 20,257 | ||||||
| Dividends payable |
— | 3,152 | ||||||
| Advance billings and customer deposits |
13,772 | 14,029 | ||||||
| Accrued compensation |
1,409 | 1,516 | ||||||
| Accrued operating taxes |
4,734 | 4,618 | ||||||
| Other accrued liabilities |
4,630 | 4,223 | ||||||
|
|
|
|
|
|||||
| Total Current Liabilities |
51,027 | 58,022 | ||||||
|
|
|
|
|
|||||
| Long-Term Liabilities |
||||||||
| Long-term debt, excluding current portion |
384,732 | 363,156 | ||||||
| Retirement benefits |
17,441 | 18,257 | ||||||
| Deferred income taxes |
92,117 | 87,864 | ||||||
| Other long-term liabilities |
1,865 | 1,746 | ||||||
| Income tax payable |
89 | 110 | ||||||
|
|
|
|
|
|||||
| Total Long-term Liabilities |
496,244 | 471,133 | ||||||
|
|
|
|
|
|||||
| Stockholders’ Equity |
101,862 | 92,677 | ||||||
|
|
|
|
|
|||||
| Noncontrolling Interests |
860 | 782 | ||||||
|
|
|
|
|
|||||
| Total Equity |
102,722 | 93,459 | ||||||
|
|
|
|
|
|||||
| Total Liabilities and Equity |
$ | 649,993 | $ | 622,614 | ||||
|
|
|
|
|
|||||
| 1 | During 2010, the Company received a Federal stimulus award providing 50% funding to bring broadband services and infrastructure to Alleghany County, Virginia. The Company was required to deposit 100% of its grant ($8.1 million) into pledged accounts in advance of any reimbursements, to be drawn down ratably following reimbursement approvals. |
Lumos Networks Corp.
Condensed Consolidated Statements of Income
| Three months ended June 30, | Six months ended June 30, | |||||||||||||||
| (In thousands, except per share amounts) |
2015 | 2014 | 2015 | 2014 | ||||||||||||
| Operating Revenues |
$ | 50,953 | $ | 50,165 | $ | 101,448 | $ | 100,255 | ||||||||
| Operating Expenses |
||||||||||||||||
| Network access costs |
9,912 | 10,190 | 19,624 | 20,904 | ||||||||||||
| Selling, general and administrative 1 |
20,269 | 18,487 | 40,103 | 36,419 | ||||||||||||
| Depreciation and amortization |
11,441 | 11,210 | 23,309 | 21,869 | ||||||||||||
| Accretion of asset retirement obligations |
38 | 30 | 72 | 57 | ||||||||||||
| Restructuring charges |
4 | — | 637 | — | ||||||||||||
|
|
|
|
|
|
|
|
|
|||||||||
| Total Operating Expenses |
41,664 | 39,917 | 83,745 | 79,249 | ||||||||||||
|
|
|
|
|
|
|
|
|
|||||||||
| Operating Income |
9,289 | 10,248 | 17,703 | 21,006 | ||||||||||||
| Other Income (Expenses) |
||||||||||||||||
| Interest expense |
(3,719 | ) | (3,812 | ) | (7,205 | ) | (7,786 | ) | ||||||||
| Gain (loss) on interest rate swap derivatives |
165 | (16 | ) | 247 | 93 | |||||||||||
| Other income (expenses), net |
96 | 170 | (147 | ) | 350 | |||||||||||
|
|
|
|
|
|
|
|
|
|||||||||
| Income Before Income Tax Expense |
5,831 | 6,590 | 10,598 | 13,663 | ||||||||||||
| Income Tax Expense |
2,438 | 2,711 | 4,447 | 5,689 | ||||||||||||
|
|
|
|
|
|
|
|
|
|||||||||
| Net Income |
3,393 | 3,879 | 6,151 | 7,974 | ||||||||||||
| Net Income Attributable to Noncontrolling Interests |
(44 | ) | (33 | ) | (78 | ) | (66 | ) | ||||||||
|
|
|
|
|
|
|
|
|
|||||||||
| Net Income Attributable to Lumos Networks Corp. |
$ | 3,349 | $ | 3,846 | $ | 6,073 | $ | 7,908 | ||||||||
|
|
|
|
|
|
|
|
|
|||||||||
| Basic and Diluted Earnings per Common Share Attributable to Lumos Networks Corp. Stockholders: |
||||||||||||||||
| Earnings per share—basic |
$ | 0.15 | $ | 0.17 | $ | 0.27 | $ | 0.36 | ||||||||
| Earnings per share—diluted |
$ | 0.14 | $ | 0.17 | $ | 0.26 | $ | 0.35 | ||||||||
| Cash Dividends Declared per Share—Common Stock |
$ | — | $ | 0.14 | $ | — | $ | 0.28 | ||||||||
| 1 | Includes equity-based compensation expense related to all of the Company’s share-based awards and the Company’s 401(k) matching contributions of $1.6 million and $1.2 million for the three months ended June 30, 2015 and 2014, respectively, and $2.8 million and $2.0 million for the six months ended June 30, 2015 and 2014, respectively. |
Lumos Networks Corp.
Condensed Consolidated Statements of Cash Flows
| Six Months Ended June 30, | ||||||||
| (In thousands) |
2015 | 2014 | ||||||
| Cash Flows from Operating Activities: |
||||||||
| Net income |
$ | 6,151 | $ | 7,974 | ||||
| Adjustments to reconcile net income to net cash provided by operating activities: |
||||||||
| Depreciation |
19,961 | 17,275 | ||||||
| Amortization |
3,348 | 4,594 | ||||||
| Accretion of asset retirement obligations |
72 | 57 | ||||||
| Deferred income taxes |
4,166 | 5,383 | ||||||
| Gain on interest rate swap derivatives |
(247 | ) | (93 | ) | ||||
| Equity-based compensation expense |
2,782 | 1,986 | ||||||
| Amortization of debt issuance costs |
822 | 738 | ||||||
| Retirement benefits, net of cash contributions and distributions |
(142 | ) | (813 | ) | ||||
| Excess tax benefits from share-based compensation |
— | (149 | ) | |||||
| Other |
332 | 128 | ||||||
| Changes in operating assets and liabilities, net |
(2,251 | ) | 938 | |||||
|
|
|
|
|
|||||
| Net Cash Provided by Operating Activities |
34,994 | 38,018 | ||||||
|
|
|
|
|
|||||
| Cash Flows from Investing Activities: |
||||||||
| Purchases of property, plant and equipment |
(55,349 | ) | (37,288 | ) | ||||
| Broadband network expansion funded by stimulus grant |
(2,082 | ) | 196 | |||||
| Purchases of available-for-sale marketable securities |
(23,356 | ) | (12,461 | ) | ||||
| Proceeds from sale or maturity of available-for-sale marketable securities |
18,045 | 14,174 | ||||||
| Change in restricted cash |
1,574 | — | ||||||
| Cash reimbursement received from broadband stimulus grant |
1,574 | — | ||||||
|
|
|
|
|
|||||
| Net Cash Used in Investing Activities |
(59,594 | ) | (35,379 | ) | ||||
|
|
|
|
|
|||||
| Cash Flows from Financing Activities: |
||||||||
| Proceeds from issuance of long-term debt |
28,000 | — | ||||||
| Payment of debt issuance costs |
(861 | ) | — | |||||
| Principal payments on senior secured term loans |
(3,945 | ) | (1,375 | ) | ||||
| Cash dividends paid on common stock |
(3,152 | ) | (6,195 | ) | ||||
| Principal payments under capital lease obligations |
(2,317 | ) | (1,145 | ) | ||||
| Proceeds from stock option exercises and employee stock purchase plan |
182 | 1,630 | ||||||
| Excess tax benefits from share-based compensation |
— | 149 | ||||||
| Other |
(247 | ) | (13 | ) | ||||
|
|
|
|
|
|||||
| Net Cash Provided by (Used in) Financing Activities |
17,660 | (6,949 | ) | |||||
|
|
|
|
|
|||||
| Decrease in cash and cash equivalents |
(6,940 | ) | (4,310 | ) | ||||
| Cash and cash equivalents: |
||||||||
| Beginning of Period |
14,140 | 14,114 | ||||||
|
|
|
|
|
|||||
| End of Period |
$ | 7,200 | $ | 9,804 | ||||
|
|
|
|
|
|||||
Lumos Networks Corp.
Operating Results, Customer and Network Statistics
| Three months ended: | Six months ended: | |||||||||||||||||||||||||||
| (Dollars in thousands) |
June 30, 2015 | March 31, 2015 | December 31, 2014 | September 30, 2014 | June 30, 2014 | June 30, 2015 | June 30, 2014 | |||||||||||||||||||||
| Revenue, Gross Margin and Adjusted EBITDA |
||||||||||||||||||||||||||||
| Revenue |
||||||||||||||||||||||||||||
| Enterprise Data |
11,298 | 11,027 | 10,833 | 10,470 | 10,445 | 22,325 | 21,031 | |||||||||||||||||||||
| Transport |
10,036 | 10,473 | 10,962 | 11,279 | 11,225 | 20,509 | 22,132 | |||||||||||||||||||||
| FTTC |
6,755 | 6,267 | 5,515 | 4,739 | 5,037 | 13,022 | 9,681 | |||||||||||||||||||||
|
|
|
|
|
|
|
|
|
|
|
|
|
|
|
|||||||||||||||
| Total Data |
28,089 | 27,767 | 27,310 | 26,488 | 26,707 | 55,856 | 52,844 | |||||||||||||||||||||
| Residential and Small Business |
17,010 | 17,265 | 17,423 | 17,668 | 18,290 | 34,275 | 36,937 | |||||||||||||||||||||
| RLEC Access |
5,854 | 5,463 | 5,952 | 6,360 | 5,168 | 11,317 | 10,474 | |||||||||||||||||||||
|
|
|
|
|
|
|
|
|
|
|
|
|
|
|
|||||||||||||||
| Total Revenue |
50,953 | 50,495 | 50,685 | 50,516 | 50,165 | 101,448 | 100,255 | |||||||||||||||||||||
| Gross Margin |
||||||||||||||||||||||||||||
| Data |
85.5 | % | 86.9 | % | 85.5 | % | 85.1 | % | 85.3 | % | 86.2 | % | 84.7 | % | ||||||||||||||
| Residential and Small Business |
65.6 | % | 64.9 | % | 67.0 | % | 64.3 | % | 65.7 | % | 65.2 | % | 65.3 | % | ||||||||||||||
| Adjusted EBITDA1 |
||||||||||||||||||||||||||||
| Data |
12,492 | 12,367 | 12,629 | 12,984 | 13,395 | 24,859 | 26,112 | |||||||||||||||||||||
| Residential and Small Business |
5,327 | 5,627 | 4,623 | 4,503 | 5,230 | 10,954 | 10,774 | |||||||||||||||||||||
| RLEC Access |
4,848 | 4,517 | 4,621 | 5,214 | 4,098 | 9,365 | 8,404 | |||||||||||||||||||||
|
|
|
|
|
|
|
|
|
|
|
|
|
|
|
|||||||||||||||
| Adjusted EBITDA before Curtailment Gain |
22,667 | 22,511 | 21,873 | 22,701 | 22,723 | 45,178 | 45,290 | |||||||||||||||||||||
| Curtailment Gain2 |
— | — | 567 | 10,207 | — | — | — | |||||||||||||||||||||
|
|
|
|
|
|
|
|
|
|
|
|
|
|
|
|||||||||||||||
| Total Adjusted EBITDA |
22,667 | 22,511 | 22,440 | 32,908 | 22,723 | 45,178 | 45,290 | |||||||||||||||||||||
| Adjusted EBITDA Margin1 |
||||||||||||||||||||||||||||
| Data |
44.5 | % | 44.5 | % | 46.2 | % | 49.0 | % | 50.2 | % | 44.5 | % | 49.4 | % | ||||||||||||||
| Residential and Small Business |
31.3 | % | 32.6 | % | 26.5 | % | 25.5 | % | 28.6 | % | 32.0 | % | 29.2 | % | ||||||||||||||
| RLEC Access |
82.8 | % | 82.7 | % | 77.6 | % | 82.0 | % | 79.3 | % | 82.8 | % | 80.2 | % | ||||||||||||||
| Total Adjusted EBITDA Margin |
44.5 | % | 44.6 | % | 44.3 | % | 65.1 | % | 45.3 | % | 44.5 | % | 45.2 | % | ||||||||||||||
| Capital Expenditures |
26,125 | 29,224 | 19,949 | 26,863 | 19,171 | 55,349 | 37,288 | |||||||||||||||||||||
| Adjusted EBITDA less Capital Expenditures |
(3,458 | ) | (6,713 | ) | 2,491 | 6,045 | 3,552 | (10,171 | ) | 8,002 | ||||||||||||||||||
| Fiber Network Statistics |
||||||||||||||||||||||||||||
| Fiber Route-Miles |
8,100 | 7,955 | 7,822 | 7,645 | 7,548 | 8,100 | 7,548 | |||||||||||||||||||||
| Fiber Miles3 |
369,238 | 363,189 | 354,118 | 352,347 | — | 369,238 | — | |||||||||||||||||||||
| Fiber Markets |
24 | 23 | 23 | 23 | 23 | 24 | 23 | |||||||||||||||||||||
| FTTC Unique Towers |
976 | 907 | 858 | 708 | 673 | 976 | 673 | |||||||||||||||||||||
| FTTC Total Connections |
1,307 | 1,236 | 1,153 | 961 | 876 | 1,307 | 876 | |||||||||||||||||||||
| On-Network Buildings |
1,574 | 1,530 | 1,477 | 1,456 | 1,420 | 1,574 | 1,420 | |||||||||||||||||||||
| Data Centers4 |
32 | 31 | 31 | 28 | 26 | 32 | 26 | |||||||||||||||||||||
| R&SB Statistics |
||||||||||||||||||||||||||||
| Competitive Voice Connections |
79,022 | 81,456 | 83,406 | 85,683 | 88,941 | 79,022 | 88,941 | |||||||||||||||||||||
| Video Subscribers |
5,516 | 5,472 | 5,352 | 5,309 | 5,155 | 5,516 | 5,155 | |||||||||||||||||||||
| Fiber-to-the-Premise Broadband Connections |
6,807 | 6,602 | 6,358 | 6,119 | 5,906 | 6,807 | 5,906 | |||||||||||||||||||||
| Premises Passed by Fiber5 |
18,983 | 18,142 | 17,461 | 17,102 | 16,631 | 18,983 | 16,631 | |||||||||||||||||||||
| RLEC Access Lines |
26,276 | 26,746 | 27,257 | 27,716 | 28,081 | 26,276 | 28,081 | |||||||||||||||||||||
| 1 | Adjusted EBITDA is a non-GAAP measure. See definition on page 2 of this earnings release. Adjusted EBITDA margin is calculated as the ratio of Adjusted EBITDA, as defined, to Total Revenue. |
| 2 | The Company recorded a gain totaling $10.8 million in the second half of 2014 related to the curtailment of medical benefits under the Company’s postretirement plan, which was not allocated to the operating segments. |
| 3 | Fiber miles are calculated as the fiber route miles multiplied by the number of fiber strands within each cable (represents an average of 46 fibers per route as of June 30, 2015) and are based on the results of the Company’s conversion of its fiber records to a centralized fiber management system in the third quarter of 2014. |
| 4 | Data centers reported include both commercial and private data centers and Company-owned facilities offering commercial data center services. |
| 5 | Includes residential and small business locations passed by fiber and available for service. Approximately 93% of the premises passed by fiber and available for service as of June 30, 2015 were residential. |
Lumos Networks Corp.
Reconciliation of Net Income Attributable to Lumos Networks Corp. to Adjusted EBITDA
| (Dollars in thousands) |
2015 | 2014 | ||||||
| For The Three Months Ended June 30, |
||||||||
| Net Income Attributable to Lumos Networks Corp. |
$ | 3,349 | $ | 3,846 | ||||
| Net Income Attributable to Noncontrolling Interests |
44 | 33 | ||||||
|
|
|
|
|
|||||
| Net Income |
3,393 | 3,879 | ||||||
| Income tax expense |
2,438 | 2,711 | ||||||
| Interest expense |
3,719 | 3,812 | ||||||
| (Gain) loss on interest rate swap derivatives |
(165 | ) | 16 | |||||
| Other income, net |
(96 | ) | (170 | ) | ||||
|
|
|
|
|
|||||
| Operating Income |
9,289 | 10,248 | ||||||
| Depreciation and amortization and accretion of asset retirement obligations |
11,479 | 11,240 | ||||||
| Amortization of actuarial losses |
338 | 64 | ||||||
| Equity-based compensation |
1,557 | 1,152 | ||||||
| Restructuring charges |
4 | — | ||||||
| Employee separation charges |
— | 19 | ||||||
|
|
|
|
|
|||||
| Adjusted EBITDA |
$ | 22,667 | $ | 22,723 | ||||
|
|
|
|
|
|||||
| Adjusted EBITDA Margin |
44.5 | % | 45.3 | % | ||||
| For The Six Months Ended June 30, |
||||||||
| Net Income Attributable to Lumos Networks Corp. |
$ | 6,073 | $ | 7,908 | ||||
| Net Income Attributable to Noncontrolling Interests |
78 | 66 | ||||||
|
|
|
|
|
|||||
| Net Income |
6,151 | 7,974 | ||||||
| Income tax expense |
4,447 | 5,689 | ||||||
| Interest expense |
7,205 | 7,786 | ||||||
| Gain on interest rate swap derivatives |
(247 | ) | (93 | ) | ||||
| Other expense (income), net |
147 | (350 | ) | |||||
|
|
|
|
|
|||||
| Operating Income |
17,703 | 21,006 | ||||||
| Depreciation and amortization and accretion of asset retirement obligations |
23,381 | 21,926 | ||||||
| Amortization of actuarial losses |
675 | 128 | ||||||
| Equity-based compensation |
2,782 | 1,986 | ||||||
| Restructuring charges |
637 | — | ||||||
| Employee separation charges |
— | 244 | ||||||
|
|
|
|
|
|||||
| Adjusted EBITDA |
$ | 45,178 | $ | 45,290 | ||||
|
|
|
|
|
|||||
| Adjusted EBITDA Margin |
44.5 | % | 45.2 | % | ||||
Lumos Networks Corp.
Business Outlook 1 (as of August 5, 2015)
| (In millions) | 2015 Annual Guidance 1 | |
| Operating Revenues |
approximately $202 | |
| Adjusted EBITDA |
approximately $92 | |
| Capital Expenditures |
approximately $112 | |
| Cash, Cash Equivalents and Marketable Securities (at end of period)2 |
approximately $5 | |
| Reconciliation of Net Income to Adjusted EBITDA: |
||
| Net Income |
approximately $12 | |
| Income tax expense |
approximately $8 | |
| Interest expense |
approximately $15 | |
|
| ||
| Operating Income |
approximately $35 | |
| Depreciation and amortization |
approximately $50 | |
| Equity-based compensation charges |
approximately$6 | |
| Amortization of actuarial losses |
approximately $1 | |
|
| ||
| Adjusted EBITDA |
approximately $92 | |
|
|
| 1 | These estimates are based on management’s current expectations. These estimates are forward-looking and actual results may differ materially. Please see “Special Note from the Company Regarding Forward-Looking Statements” in the Lumos Networks Corp. second quarter 2015 earnings release dated August 5, 2015. |
| 2 | Exclusive of proceeds from Pamplona investment transaction described on Page 1 of this release. |
 Company
Presentation August 2015
Company Presentation August 2015 Exhibit 99.2 |
| Use of Non-GAAP Financial Measures Included in this presentation are certain non-GAAP financial measures that are not determined in accordance with US generally accepted accounting principles. These financial performance measures are not indicative of cash provided or used by operating activities and exclude the effects of certain operating, capital and financing costs and may differ from comparable information provided by other companies, and they should not be considered in isolation, as an alternative to, or more meaningful than measures of financial performance determined in accordance with US generally accepted accounting principles. These financial performance measures are commonly used in the industry and are presented because Lumos Networks Corp. believes they provide relevant and useful information to investors. The Company utilizes these financial performance measures to assess its ability to meet future capital expenditure and working capital requirements, to incur indebtedness if necessary, and to fund continued growth. Lumos Networks Corp. also uses these financial performance measures to evaluate the performance of its business, for budget planning purposes and as factors in its employee compensation programs. Special Note Regarding Forward-Looking Statements Any statements contained in this presentation that are not statements of historical fact, including statements about our beliefs and expectations, are forward-looking statements and should be evaluated as such. The words “anticipates,” “believes,” “expects,” “intends,” “plans,” “estimates,” “targets,” “projects,” “should,” “may,” “will” and similar words and expressions are intended to identify forward-looking statements. Such forward- looking statements reflect, among other things, our current expectations, plans and strategies, and anticipated financial results, all of which are subject to known and unknown risks, uncertainties and factors that may cause our actual results to differ materially from those expressed or implied by these forward-looking statements. Many of these risks are beyond our ability to control or predict. Because of these risks, uncertainties and assumptions, you should not place undue reliance on these forward-looking statements. Furthermore, forward-looking statements speak only as of the date they are made. We do not undertake any obligation to update or review any forward-looking information, whether as a result of new information, future events or otherwise. Important factors with respect to any such forward-looking statements, including certain risks and uncertainties that could cause actual results to differ from those contained in the forward-looking statements, include, but are not limited to: rapid development and intense competition in the telecommunications and high speed data transport industry; our ability to offset expected revenue declines in legacy voice and access products related to the recent regulatory actions, wireless substitution, technology changes and other factors; our ability to effectively allocate capital and implement our “edge-out” expansion plans in a timely manner; our ability to complete customer installations in a timely manner; adverse economic conditions; operating and financial restrictions imposed by our senior credit facility; our cash and capital requirements; declining prices for our services; our ability to maintain and enhance our network; the potential to experience a high rate of customer turnover; federal and state regulatory fees, requirements and developments; our reliance on certain suppliers and vendors; and other unforeseen difficulties that may occur. These risks and uncertainties are not intended to represent a complete list of all risks and uncertainties inherent in our business, and should be read in conjunction with the more detailed cautionary statements and risk factors included in our SEC filings, including our Annual Report filed on Form 10-K. 1 |
 Advanced Fiber Network Driving Value for Our Customers
2 |
 Lumos at a Glance Attractive Fundamentals Attractive Fundamentals 2015 Data Revenue target of ~$115m, up 8% YoY Total data contract value: ~$362m with avg. length: 4+ years. Target of $500mm by YE15 Targeted 15-20%+ ROI on fiber deals FTTC/Enterprise revenue is 90%+ non-TDM 4G LTE wireless deployments (FTTC) On-net focus: 60% Data EBITDA margin target Network Expansion to increase Addressable market by $135m or 60% Enterprise growth of 8-9% expected in 2015 Favorable interest rate and tax environment 1 As of 6/30/2015 2 Based on Lumos Networks’ internal research and analysis of data from research, surveys and studies conducted by third parties, such as Tower Source (for FTTC sites), Equifax Telecom and Stratsoft (for On-Net buildings) and public records databases (for data centers). Market Opportunity denotes wireless cell sites within 3 miles and buildings within ½ mile of the Lumos Networks fiber footprint and includes recently announced planned market expansion in Richmond and Norfolk Current 1 Market Opportunity 2 FTTC Unique Sites 976 ~7,400 On-Net Buildings 1,574 104,000 Total Connected Data Centers 32 100+ 8,100 Fiber Route Miles; 369,238 Total Fiber Strand Miles 45+ Avg Strand Count; 64% of Strand Miles are Lumos-owned 3 Revenue Opportunities Revenue Opportunities |
 Pamplona Capital Announced as Strategic Financial Partner
On August 5, 2015, Lumos announced a $150 Million cash investment from Pamplona Capital, a Private Equity Fund with over $8 billion in total capital commitments Creates Strategic Partnership to Accelerate the Transformation of Lumos Networks to a Pure-Play Fiber Bandwidth Infrastructure Company Use of Proceeds Up to $50m to pay down existing senior bank debt and related deal costs Approximately $100m for general corporate purposes. Provides the company with additional capital to pursue organic and inorganic growth opportunities in the fiber and data center space. Interest payable on the notes to be issued in connection with Pamplona’s investment will accrue at an annual rate of 8%, paid quarterly either in cash or in kind. The warrants to be issued entitle Pamplona to purchase up to 5.5 million shares of common stock at an exercise price equal to the closing price immediately prior to the announcement of the transaction on August 5, 2015. Pamplona will receive two seats on the Lumos Board of Directors William Pruellage, Partner at Pamplona Capital (based in New York) Peter Aquino, former Executive Chairman of Primus Telecommunications Group and former President and CEO of RCN Corporation 4 |
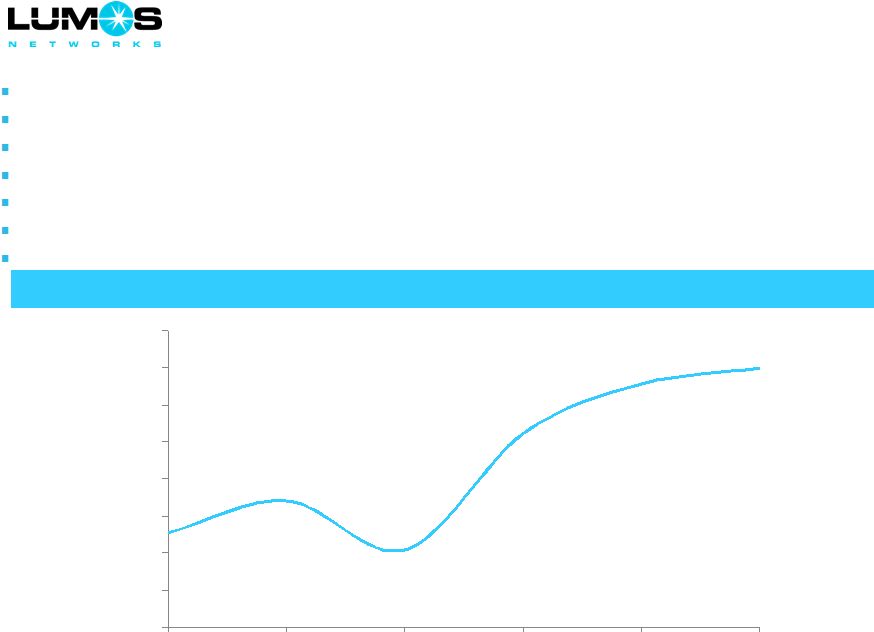
 0.0 EB 1.0 EB 2.0 EB 3.0 EB 4.0 EB 5.0 EB 2014 2015 2016 2017 2018 0.0 EB 0.5 EB 1.0 EB 1.5 EB 2.0 EB 2014 2015 2016 2017 2018 Exponential Growth in Bandwidth Demand Bandwidth Demand Drivers Bandwidth Demand Drivers U.S. Mobile IP Traffic U.S. Mobile IP Traffic Web & Data Video Source: Cisco Visual Networking Index 2015 U.S. Business IP Traffic U.S. Business IP Traffic Web & Data Video 5 Cisco VNI estimates US mobile data traffic growth of 47% from 2014-2019 LTE traffic grew 2x YoY in 2Q15 for large US operator Proliferation of network-connected devices and locations 2014 to 2019 tablets, smartphones, and M2M traffic growth rates of 83%, 60%, and 103%, respectively Rapid growth in rich media applications Of the 24.3 exabytes per month crossing the mobile network by 2019, 17.4 exabytes will be due to video Spectrum constraints require increased efficiency to manage mobile data traffic Cloud adoption, increased outsourcing of IT infrastructure |
 Data Products 1 Goals highlighted herein are long-term in nature and are subject to various risks and uncertainties, one or more of which could cause
goals to be unattainable. You should not regard the inclusion of a goal in this presentation as a representation by any person that the results will be achieved 6 Enterprise 2Q15 Rev: $11.3m 8% YoY Growth 40% of Data Revs Non-TDM products account for ~90%+ of total revenue Enterprise 2015 growth target raised from 6% to 8-9% Renewed Enterprise contracts totaling $18.5 million in 1H15, up 60% vs 1H14 Network expansion into Richmond/Norfolk increases Enterprise Addressable Market by $135 million Transport 2Q15 Rev: $10m (-11%) YoY Growth 36% of Data Revs IP-based Ethernet Transport and wavelength potential Significant reduction in DS1/DS3 exposure in last 2-3 years TDM Carrier grooming trends universal across industry FTTC 2Q15 Rev: $6.8m 34% YoY Growth 24% of Data Revs Carrier Ethernet: 97%+ revenue and ~98% total bookings FTTC backhaul supports 4G LTE growth Long-term target of ~$85 million in FTTC revenue 1 Achieved target of 1,300 FTTC installations by 2Q15 Targeted FTTC incremental gross margin of 85%+ 1 FY2014A FY2015E $20m/19% ~$29m/25% $42.3m/40% ~$46m/40% $44.3m/41% ~$40m/35% Revenue/(% of Data Rev) |
 Accelerating the Transformation
7 FTTC + Enterprise as % of Data Revenue FTTC + Enterprise as % of Data Revenue 55.4% 55.7% 58.3% 58.0% 57.5% 59.9% 62.3% 64.3% 65.2% 3Q13 4Q13 1Q14 2Q14 3Q14 4Q14 1Q15 2Q15 2015E In 2Q15, 90%+ of Total FTTC (~97%)/Enterprise(~90%) Revenue was non-TDM based |
 8 Planned 665 Mile Fiber Network Expansion in Richmond and Norfolk Underpinned by 257 unique FTTC site contract (269 total FTTC connections) with major wireless carrier
Vast majority of network expected to be completed by YE15 vs original target of
3Q16 Three signed Enterprise contracts: total MRC of ~$13,000 (two
new logos, one new site with existing core market customer)
Significant expansion of Richmond, VA network with the addition of Norfolk,
Petersburg and Hampton Roads markets Increases total Enterprise
addressable market by ~$135 million, up ~60% vs. existing markets
Increases tower addressable market to 7,400 within 3 miles of footprint
|
 Richmond/Petersburg Metro Fiber Network
Green: Existing market launched 2H13 (144 miles);
Yellow: Expansion Footprint (Additional 314 miles)
9 |
 Norfolk/Hampton Roads/Tidewater Metro Market Expansion
All New Footprint: ~270 Fiber Route Miles. Portions of Network “Lit” in August ‘15 as 24 th Metro Market 10 |
 Dark Fiber Product Officially Launched May 2015
Targeting a Growing Number of RFPs in our Footprint:
Macro Fiber to the Cell Backhaul
Small Cell Fronthaul
Large Enterprises: Healthcare, Education/Gov’t, Financial
Data Centers Relatively limited dark fiber deployments in our footprint (by any fiber
provider), but industry dark fiber network activity should increase in
2015 and beyond
Lumos Dark Fiber Product has standardized Monthly Recurring Charge
(MRC)
and Non-Recurring Charge (NRC) pricing
Lumos provides dark fiber cable and customer supplies equipment and
resources to manage their bandwidth service
Lumos has $1m+ in annual Dark Fiber revenue, mostly derived from
Allegheny Energy assets purchased in 2009
11 |
 Dark Fiber Solutions for FTTC Small Cell Deployments
C-RAN Architecture
12
Architecture is designed for FTTC Customers who are:
1) Using Small Cell Strategy to supplement macro sites for cell coverage and capacity
2) Leveraging a centralized Base Band Unit (“BBU”) design Note: One large wireless operator leading the way |
 Key FTTC Statistics
2Q15 Revenue: $6.8m up 34% YoY
2015 Revenue Target: $29m, up 45% YoY
Unique FTTC Towers: 976 up 45% YoY
1,307 FTTC Connections: up 49% YoY
FTTC Tenants (connections) per tower: 1.3-1.4x
Avg Monthly Revenue/Connection: $1,735 Average contracted bandwidth/connection: ~100Mbs ~97-98% of total booked revenue (3-4% current revenue) is Carrier Ethernet
0% microwave sites
Total FTTC Revenue under contract: $215-$220m
Average Contract length: 6-7 years
Gross Margin: ~85%
# of Active Mobile Operator Customers: 5
13 |
 FTTC Opportunities Accelerate
Dramatic Growth in Mobile Data Traffic Driving Increased Backhaul Bandwidth
Requirements Dramatic Growth in Mobile Data Traffic Driving
Increased Backhaul Bandwidth Requirements Compelling
Tower-Like Economics Compelling Tower-Like
Economics Scalable bandwidth capability drives margin
expansion Increased tenants per unique site combined with higher
bandwidth per site magnifies leverage. FTTC bandwidth upgrade activity accelerating in 2015. Long-term contracts (ranging from 5 to 13 years). Avg of 6-7 years. Attractive return on investments Devices Use Case Backhaul Technology Voice / Text / Email / Rich Media / Streaming Video Moving to Carrier Ethernet 2015+ Voice / Text / Email T1 / SONET 2004 - 2007 Voice / Text T1 1999 - 2003 14 |
 15 Project Ark: 100G Core - Premier FTTC Network in Footprint New MEF-certified Carrier Ethernet MPLS/IP fiber network Fully Redundant/Fast Re-route A key selling point for a series of contract wins (total of 500+ FTTC sites) with a major US wireless carrier 100G: Entire Ark Core and and 1/3 of distribution rings Core network completed in Sept ’14 using Cisco routers FTTC traffic already routed onto Ark Expect 100% of FTTC traffic routed onto Ark by YE15, to coincide with completion of Richmond/Norfolk market expansion Cisco provides new testing tools, thousands of hours of training, and 2 R&D centers Ark planned to provide total bandwidth throughput up to ~1 Terabit (equivalent to 2,500 circuits at 400 Mbps each) Allows for cost effective scalability for upgraded FTTC connection target of 3,100 |
 16 1 Goals highlighted herein are long-term in nature and are subject to various risks and uncertainties, one or more of which could cause goals to be unattainable. You should not regard the inclusion of a goal in this presentation as a representation by any person that the results will be achieved 2 Represents management’s long-term estimates prepared using data from industry publications and its market knowledge and experience. Management’s estimates have not been verified by any independent source and are subject to various risks and uncertainties, which could cause actual results to materially deviate from estimates. You should not regard the inclusion of an estimate in this presentation as a representation by any person of future results Long-Term Fiber to the Cell Targets FTTC Targets (as updated in Nov 2014) FTTC Targets (as updated in Nov 2014) Key Drivers of FTTC Upgrade Key Drivers of FTTC Upgrade Expansion of 4G/LTE coverage and capacity in Lumos’ footprint by multiple wireless carriers Continued migration of copper, microwave and SONET FTTC sites to Carrier Ethernet Planned 665 route-mile market expansion, underpinned by 257 FTTC unique tower contract Pro forma tower addressable market increase to 7,400 (within 3 miles) from 5,400 Added 686 fiber route miles since YE13, including key routes from Richmond-Charlottesville and Richmond-Ashburn, VA Increased RFP activity for small cell and dark fiber FTTC contracts in our footprint Expectation for increased tenants per site and higher bandwidth per site over time Revised Prior Annual Revenue 1 ~$85 million ~$70 million Gross Margin 1 ~$72 million ~$60 million Total Unique Towers
1 1,875 1,500 Total FTTC Connections
2 3,100 2,250 Tenants (Connections/Tower)
2 1.65 1.50 Monthly Revenue/Connection
2 ~$2,300 ~$2,600 Addressable Market 2 7,400 5,400 |
 2Q15 Long-Term Estimate 1 FTTC Unique Towers 976 1,875 Tenants/Unique Tower ~1.3-1.4 1.65x Monthly Revenue/Connection ~$1,750 ~$2,300 Monthly Revenue/Unique Tower Contracted Bandwidth Per Site ~$2,300 ~100MBs ~$3,800 400MBs+ ~7,400 towers within 3 miles of Lumos Network fiber footprint Early stages of 4G LTE rollout Conversion from T-1, microwave and SONET to Carrier Ethernet Significant new LTE site builds/network densification Continued FTTC share gains expected Carrier Ethernet more scalable than SONET of other providers FTTC operating leverage drives margin expansion opportunity Strong FTTC Growth Opportunity in Our Footprint Anticipated FTTC Trends Anticipated FTTC Trends +287 +208 +303 1 Represents management’s long-term estimates prepared using data from industry publications and its market knowledge and experience. Management’s estimates have not been verified by any independent source and are subject to various risks and uncertainties, which could cause actual results to materially deviate from estimates. You should not regard the inclusion of an estimate in this presentation as a representation by any person of future results 2 Goals highlighted herein are long-term in nature and are subject to various risks and uncertainties, one or more of which could cause goals to be unattainable. You should not regard the inclusion of a goal in this presentation as a representation by any person that the results will be achieved 2 17 FTTC Opportunity FTTC Opportunity 178 465 673 976 1,875 2Q12 2Q13 2Q14 2Q15 Long-Term Goal |
 FTTC as a percentage of total Lumos Data revenue
2012: ~8% 2013: ~14% 2014: ~19% 2015: ~25% Annual FTTC Revenue Annual FTTC Revenue 18 1 Goals highlighted herein are long-term in nature and are subject to various risks and uncertainties, one or more of which could cause
goals to be unattainable. You should not regard the inclusion of a goal in this presentation as a representation by any person that the results will be achieved FTTC Revenue Growth ($ in Millions) Long-term goal of $85 million 1 $6.8 $14.3 $19.9 $29.0 $0.0 $5.0 $10.0 $15.0 $20.0 $25.0 $30.0 $35.0 2012 2013 2014 2015E |
 Total FTTC Connections Exceed 1,300
0% 10% 20% 30% 40% 50% 60% 600 700 800 900 1000 1100 1200 1300 1400 3Q13 4Q13 1Q14 2Q14 3Q14 4Q14 1Q15 2Q15 Installs YoY Growth 19 Total FTTC Connections Total FTTC Connections |
 Key Enterprise Accounts
20 |
 Key Enterprise Statistics
2Q15 Revenue: $11.3m, up 8% YoY
2015 Revenue Target: $46m, up 8-9% YoY
Enterprise Churn Trends improved in 2015
Estimated Enterprise market share in core markets: 17%
Renewal Program Gaining Momentum: Estimated MRC of renewed accounts to be up 17% YoY in 2015 Network Expansion into Richmond/Norfolk/Hampton Roads Metro Markets Increases Addressable Market for
Enterprise data spend by an estimated $135m or ~60%... Target share in these expansion markets: 17% Target: 80% of revenue on-net Focus: “Large Locals” with multiple sites in footprint: Healthcare, Gov’t/Education, Banks, Professional
Services Target: 80% Enterprise MRC under contract by
YE15 Target: Carrier End User Partnership Program to reach 50% of
long-term total Enterprise sales Key Metro Markets (‘14
stats) Market Status
Population MSA Rank(out of 381) Norfolk/Hampton Roads, VA Expansion Market 1 1.7m 37 Richmond, VA Expansion Market 2 1.26m 44 Huntington, WVA Core Market 363k 144 Roanoke, VA Core Market 315k 159 Hagerstown, MD Core Market 260k 181 Lynchburg, VA Core Market 257k 184 Charlottesville, VA Core Market 296k 196 Charleston, WVA Core Market 223k 198 Total Core Market ~3m Total Expansion Markets ~3m 21 1 Launched August 2015 2 Launched 2H13, 2015 expansion 3x miles, see slide 9 |
 100% fiber fed portfolio of lit buildings (ALL success-based)
Added 44 buildings in 2Q15. Average of 16 buildings/month in 1H15 vs 12
historically Increases on-net revenue and opens up opportunity
for additional FTTC builds Connected to 32 total data centers
(including 7 company owned co-lo facilities) 2Q15 On-Net
Building Growth Accelerated On-Net Buildings
On-Net Buildings
22 1,091 1,273 1,420 1,574 2Q12 2Q13 2Q14 2Q15 |
 Enterprise Revenue Hits Inflection Point
23 -1.1% -1.7% 1.7% 4.2% 8.2% 8-9% 2Q14 3Q14 4Q14 1Q15 2Q15 2015E Enterprise Revenue YoY Growth Enterprise Revenue YoY Growth |
 Enterprise Renewal Program Results Accelerating
New Enterprise Contract Amounts (MRC)
New Enterprise Contract Amounts (MRC)
Total Enterprise Contract Value Renewed
Total Enterprise Contract Value Renewed
24 ($ in Thousands) Renewal program locks-in revenue on increasingly longer term deals, reducing churn
Target 1H15 total contract value renewed of $18.5 million up over 60% from 1H14
27% of current Enterprise revenue has been renewed in last 6
quarters at average contract length of ~39 months
Expecting total MRC of $725,000 to be renewed in 2015, up 17% YoY
$619 $725 2014A 2015E ($ in Thousands) $11,500 $18,450 1H 2014 1H 2015 |
 25 Carrier End User Pipeline Building with Growing MSA Partner Strong Growth in 2014 and a Solid Pipeline in Place for 2015 Leverage Lumos Networks’ 8,100 mile fiber footprint to target incremental Enterprise
customers with thousands of sales people from leading national service
providers 33 MSAs signed and 39 pending/in pipeline with major U.S.
operators, MSOs and fiber companies operating in our
footprint Pro forma “near-net” list buildings within
½ mile of our footprint of 104,000 (67,000 pre-
expansion), including planned 665 fiber route-mile expansion in the
Norfolk, Richmond, Petersburg and Hampton Roads, VA metro
markets Carrier End User Sales Grew Over 100% in 2014
Carrier End User Sales Grew Over 100% in 2014
2013: $77,000 2014: $294,000 2015 (target): ~$400,000 New Distribution Channel for Enterprise Data New Distribution Channel for Enterprise Data |
 26 Data Center Fiber Connection Strategy 32 Total Data Center Connections 32 Total Data Center Connections 32 total data center connections as of 2Q15 Includes 19 commercial, 6 private and 7 Lumos operated data centers Lumos Co-los: Washington PA, Waynesboro VA, Charlottesville VA, Covington VA,
Harrisonburg VA, Lynchburg VA, Charleston WV
Key data center relationships: Peak 10, Iron Mountain, QTS, DC Corp,
Alpha Technologies Increasingly, Enterprise traffic moving to data
centers with customers requesting secure, fiber bandwidth access
to those locations ~100+ data center market opportunity within
existing footprint Lumos
is under-penetrated in data center connections relative to fiber
peers. Data center connections
represent promising fiber bandwidth revenue upside |
 Key Residential/Small Business (“RSB”) Highlights
RSB EBITDA Margins improved to 32% in 1H15 from 29% in 1H14
Total 2Q15 RSB Revenue ex-CLEC Voice/Access essentially flat
YoY High Speed Internet Connections up 15% YoY
Total Premises Passed by Fiber of nearly 19k, up 14% YoY
Completed RUS build in 2Q15 (~5,300 sites passed with fiber)
CLEC Rate Increases instituted in 2Q15
1G Broadband Service launched 2Q15 for residential and SMB
customers -14%
-13% -12% -11% -10% -9% -8% -7% -6% 1Q14 2Q14 3Q14 4Q14 1Q15 2Q15 27 Improving YoY Revenue Growth Trends in RSB Improving YoY Revenue Growth Trends in RSB |
 Selected Financial Highlights
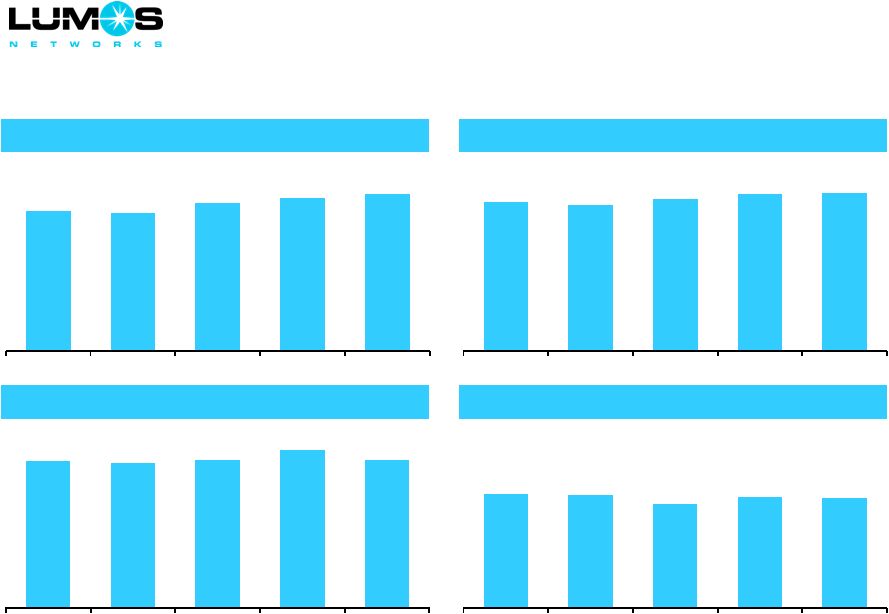
Data Revenue Data Revenue Data as a % of Total Revenue Data as a % of Total Revenue Data Gross Margin 1 Data Gross Margin 1 Overall Adjusted EBITDA Margin 2 Overall Adjusted EBITDA Margin 2 ($ in Millions) 1 Defined as operating revenues less network access costs divided by operating revenues for Data segment
2 Defined as Adjusted EBITDA divided by operating revenues on a consolidated basis, excluding the impact of one-time curtailment gain on
benefit plans in Q314 and Q414 28
$26.7 $26.5 $27.3 $27.8 $28.1 2Q14 3Q14 4Q14 1Q15 2Q15 53.2% 52.4% 53.9% 55.0% 55.1% 2Q14 3Q14 4Q14 1Q15 2Q15 85.3% 85.1% 85.5% 86.9% 85.5% 2Q14 3Q14 4Q14 1Q15 2Q15 45.3% 44.9% 43.2% 44.6% 44.5% 2Q14 3Q14 4Q14 1Q15 2Q15 |
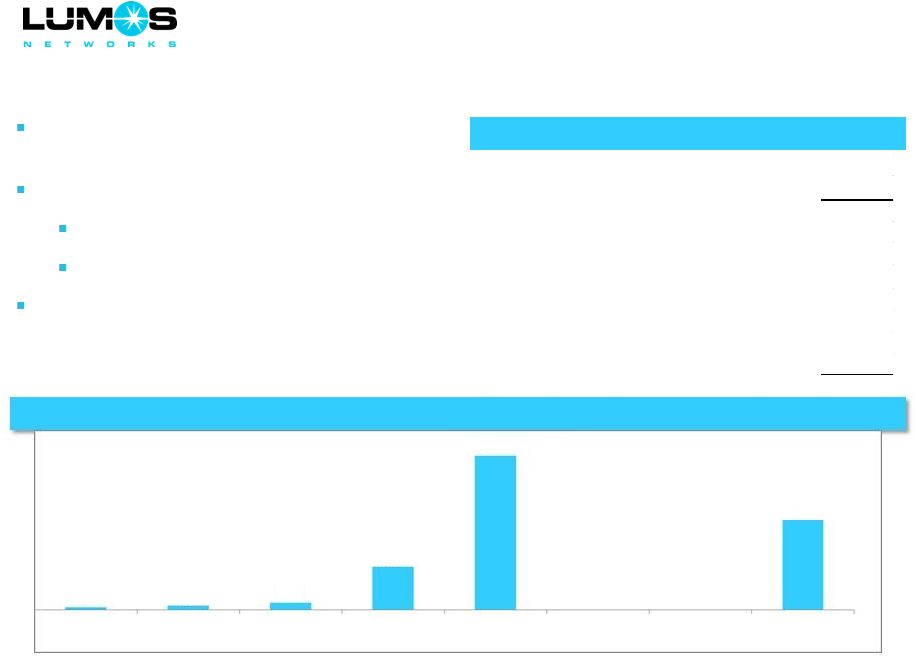 Liquidity and Debt Maturities
Debt refinancing completed in April 2013; closed
new Term Loan C in January 2015 for $28 million
Liquidity to support growth capital requirements
~$29 million in cash
$50 million undrawn revolver capacity
Cash investment from Pamplona Capital on
August 5, 2015 for gross proceeds of $150 million
Debt Maturity Profile
Debt Maturity Profile
Capitalization
Capitalization Note: Excludes capital leases 1 Pro forma to include Pamplona Capital investment transaction 2 Does not account for any value assigned to detachable warrants issued in conjunction with the debt offering.
29 ( in Millions) ($ in Millions) As of 6/30/2015 1 Cash and Marketable Securities 29.2 $ Revolving Credit Facility ($50MM) - Pamplona Note 2 150.0 Term Loan A 85.3 Term Loan B 242.0 Term Loan C 25.1 Capital Leases 2.8 Total Debt 505.2 $ 2015 2016 2017 2018 2019 2020 2021 2022 $4 $7 $12 $72 $258 $0 $0 $162 |
 2Q15 Snapshot 2Q15 Balance Sheet & Valuation 2Q15 Balance Sheet & Valuation 2Q15 Metrics 2Q15 Metrics Data revenue up 5%+ YoY and comprises 55% of total revenue FTTC and Enterprise revenue grew 34% and 8% YoY, respectively Completed installation of 69 FTTC sites and 71 total FTTC Connections Exceeded 75% target ratio for success- based/growth capital projects. Target of ~90% for 2015 Connected 44 on-net buildings Added 145 miles of fiber route miles Key 2Q15 Accomplishments Key 2Q15 Accomplishments 1 Based on closing share price of $13.96 as of 7/31/2015 and 22,881,853 shares outstanding as of 6/30/2015
2 Pro forma to include Pamplona Capital investment transaction 30 ($ in Millions) Cash and Marketable Securities $29.2 Total Long-Term Debt
2 $505.2 Net Long-Term Debt $476.0 Market Capitalization¹ $319.4 Enterprise Value $795.4 ($ in Millions) 4Q14 1Q15 2Q15 Revenue $50.7 $50.5 $51.0 Adjusted EBITDA $22.4 $22.5 $22.7 % Margin 44.3% 44.6% 44.5% Capital Expenditures $19.9 $29.2 $26.1 % of Revenue 39.4% 57.9% 51.3% |
 Historical Financial Metrics by Segment
1 Defined as operating revenues less network access costs 2 Defined as net income attributable to Lumos Networks before interest, income taxes, depreciation and amortization, accretion of asset
retirement obligations, net income or loss attributable to noncontrolling interests, other income or expenses, equity-based compensation charges, acquisition-related charges, amortization of actuarial losses on retirement
plans, employee separation charges, restructuring-related charges, gain or loss on settlements and gain or loss on interest rate swap derivatives. See note from the Company on “Use of Non-GAAP Measures” on Slide
1 3
The Company recorded a $10.8 million curtailment gain in the second half of 2014
related to the elimination of certain medical benefits under the postretirement plan, which was not allocated to the operating segments 31 ($ in Thousands) FYE 2013 FYE 2014 FYE 2015 % of 2Q15 1Q13 2Q13 3Q13 4Q13 1Q14 2Q14 3Q14 4Q14 1Q15 2Q15 Total Revenue Data $25,369 $25,706 $26,094 $26,943 $26,137 $26,707 $26,488 $27,310 $27,767 $28,089 55.1% Residential and Small Business 21,057 20,453 20,055 19,094 18,647 18,290 17,668 17,423 17,265 17,010 33.4% RLEC Access 6,108 6,152 5,478 4,966 5,306 5,168 6,360 5,952 5,463 5,854 11.5% Total Revenue $52,534 $52,311 $51,627 $51,003 $50,090 $50,165 $50,516 $50,685 $50,495 $50,953 100.0% % Sequential Growth (0.3%) (0.4%) (1.3%) (1.2%) (1.8%) 0.1% 0.7% 1.0% (0.4%) 0.9% % YoY Growth by Segment Data 19.0% 17.5% 15.1% 10.3% 3.0% 3.9% 1.5% 1.4% 6.2% 5.2% Residential and Small Business (12.3%) (12.5%) (13.5%) (12.8%) (11.4%) (10.6%) (11.9%) (8.8%) (7.4%) (7.0%) RLEC Access 0.4% 11.0% (10.8%) (21.8%) (13.1%) (16.0%) 16.1% 19.9% 3.0% 13.3% Gross Profit 1 Data $21,338 $21,827 $22,206 $22,940 $21,963 $22,788 $22,551 $23,350 $24,122 $24,025 58.5% Residential and Small Business 13,934 13,831 13,601 12,677 12,107 12,019 11,355 11,670 11,198 11,162 27.2% RLEC Access 6,108 6,152 5,478 4,966 5,306 5,168 6,360 5,952 5,463 5,854 14.3% Total Gross Profit 1 $41,380 $41,810 $41,285 $40,583 $39,376 $39,975 $40,266 $40,972 $40,783 $41,041 100.0% Adjusted EBITDA 2 Data $13,124 $13,355 $13,012 $14,011 $12,717 $13,395 $12,984 $12,629 $12,367 $12,492 55.1% Residential and Small Business 6,697 6,356 5,691 5,917 5,544 5,230 4,503 4,623 5,627 5,327 23.5% RLEC Access 4,874 4,840 4,343 4,104 4,306 4,098 5,214 4,621 4,517 4,848 21.4% Adjusted EBITDA, Before Curtailment Gain $24,695 $24,551 $23,046 $24,032 $22,567 $22,723 $22,701 $21,873 $22,511 $22,667 100.0% Curtailment Gain 3 0 0 0 0 0 0 10,207 567 0 0 Total Adjusted EBITDA $24,695 $24,551 $23,046 $24,032 $22,567 $22,723 $32,908 $22,440 $22,511 $22,667 % Sequential Growth, Normalized 6.4% (0.6%) (6.1%) 4.3% (6.1%) 0.7% (0.1%) (3.6%) 2.9% 0.7% % Margin, Normalized 47.0% 46.9% 44.6% 47.1% 45.1% 45.3% 44.9% 43.2% 44.6% 44.5% |
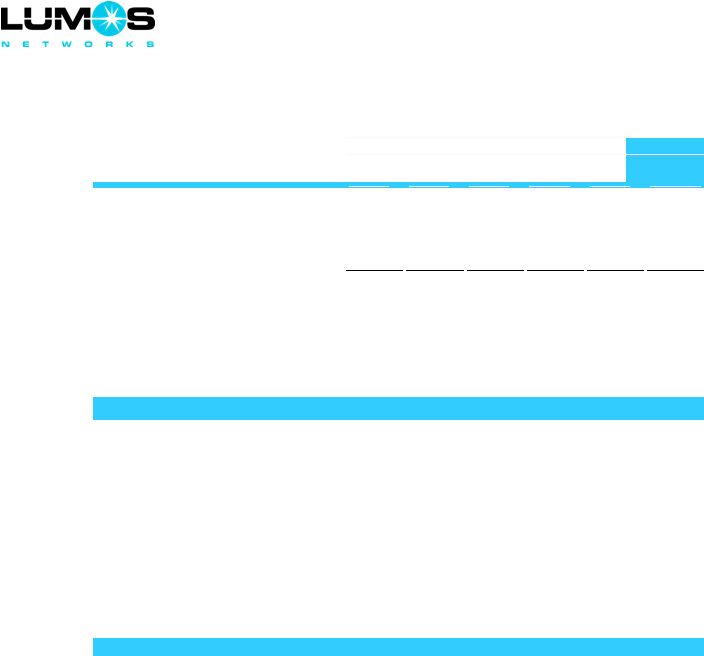
 Financial Guidance
1 Guidance as of date of 2Q15 earnings release dated August 5, 2015 2 Normalized Adjusted EBITDA excludes the impact of a $10.8 million curtailment gain for the elimination of other postretirement plan
medical benefits recognized in the second half of 2014
2014 2Q15 FY 2015 ($ in Millions) Actual Actual Guidance¹ Revenue Data $106.6 $28.1 ~$115 % of Total 52.9% 55.1% ~57% Residential & Small Business $72.0 $17.0 ~67 % of Total 35.8% 33.4% ~33% Access $22.8 $5.9 ~$20 % of Total 11.3% 11.5% ~10% Total $201.5 $51.0 ~$202 Adjusted EBITDA, Normalized 2 $89.9 $22.7 ~$92 % Margin 44.6% 44.5% ~46% Total Capex $84.1 $26.1 ~$112 % Success-Based/Growth Capex 75% 95% >75% 32 |
  Annual Reconciliation of Net Income Attributable to Lumos
Networks Corp. to Adjusted EBITDA
33 ($ in millions) Year Ended FY 2010 FY 2011 FY 2012 FY 2013 FY 2014 FY 2015E¹ Net Income (Loss) Attributable to Lumos Networks Corp 20.8 $ (43.9) $ 16.3 $ 17.8 $ 21.5 $ 12.0 $ Net Income Attributable to Noncontrolling Interests 0.1 0.1 0.1 0.1 0.1 - Net Income (Loss) 20.9 (43.8) 16.4 17.9 21.6 12.0 Interest Expense 5.7 11.9 11.9 14.2 15.6 15.0 Loss (Gain) on Interest Rate Swap Derivatives - - 1.9 0.1 (0.5) 0.0 Income Tax Expense (Benefit) 14.5 (4.4) 11.0 12.0 14.4 8.0 Other (Income) Expense, net - (0.1) (0.1) 1.6 (0.7) 0.0 Operating Income (Loss) 41.1 $ (36.4) $ 41.1 $ 45.8 $ 50.5 $ 35.0 $ Depreciation, amortization and accretion of asset retirement obligations 31.4 43.2 39.0 42.4 45.3 50.0 Equity-based compensation 1.5 2.4 3.9 6.8 4.3 6.0 Asset impairment charge 0.0 86.3 - - - - Business separation charges - 1.4 - - - - Amortization of actuarial losses - - 1.8 1.2 0.2 1.0 Acquisition related charges 3.0 0.1 - - - - Employee separation charges - - 2.3 - 0.2 0.0 Restructuring charges - - 3.0 0.1 - - Gain on settlements, net - - (2.3) - - - Adjusted EBITDA 77.1 $ 96.9 $ 88.9 $ 96.3 $ 100.6 $ 92.0 $ 1 Guidance as of date of 2Q earnings release dated August 5, 2015 |
 Quarterly Reconciliation of Net Income Attributable to Lumos
Networks Corp. to Adjusted EBITDA
34 ($ in millions) Quarter Ended 6/30/2013 9/30/2013 12/31/2013 3/31/2014 6/30/2014 9/30/2014 12/31/2014 3/31/2015 6/30/2015 Net Income Attributable to Lumos Networks Corp 4.8 $ 2.5 $ 4.1 $ 4.1 $ 3.8 $ 10.2 $ 3.4 $ 2.7 $ 3.3 $ Net Income Attributable to Noncontrolling Interests - - - - - - 0.1 - - Net Income 4.8 2.5 4.1 4.1 3.8 10.2 3.5 2.7 3.3 Interest expense 3.4 3.8 3.8 4.0 3.8 4.0 3.8 3.5 3.7 (Gain) loss on interest rate swap derivatives (0.3) 0.6 0.0 (0.1) 0.0 (0.3) (0.1) (0.1) (0.2) Income Tax Expense 3.2 1.5 3.0 3.0 2.7 6.7 2.0 2.0 2.4 Other expenses (income), net 0.9 (0.1) 0.8 (0.2) (0.2) (0.2) (0.1) 0.2 (0.1) Operating Income 12.1 $ 8.3 $ 11.7 $ 10.8 $ 10.2 $ 20.4 $ 9.1 $ 8.4 $ 9.3 $ Depreciation, amortization and accretion of asset retirement obligations 10.8 11.2 10.8 10.7 11.2 11.3 12.1 11.9 11.5 Equity-based compensation 1.3 3.2 1.2 0.8 1.2 1.1 1.2 1.2 1.6 Amortization of actuarial losses 0.3 0.3 0.3 0.1 0.1 0.1 - 0.3 0.3 Employee separation charges - - - 0.2 - - - - - Restructuring charges - - - - - - - 0.6 - Adjusted EBITDA 24.6 $ 23.0 $ 24.0 $ 22.6 $ 22.7 $ 32.9 $ 22.4 $ 22.5 $ 22.7 $ |
Serious News for Serious Traders! Try StreetInsider.com Premium Free!
You May Also Be Interested In
- Congruent Solutions Appoints Mahesh Natarajan as Chief Revenue Officer
- Precision Drilling Announces 2024 First Quarter Unaudited Financial Results
- Parsons Increasing Production of U.S. Air Force’s RADBO System
Create E-mail Alert Related Categories
SEC FilingsSign up for StreetInsider Free!
Receive full access to all new and archived articles, unlimited portfolio tracking, e-mail alerts, custom newswires and RSS feeds - and more!
