

Form 8-K LANDAUER INC For: Feb 12
 Tweet
Tweet Share
ShareSECURITIES AND EXCHANGE COMMISSION
Washington, D.C. 20549
FORM 8-K
CURRENT REPORT
Pursuant to Section 13 or 15(d) of the Securities Exchange Act of 1934
Date of Report (Date of Earliest Event Reported): February 12, 2016
|
|
LANDAUER, INC. |
|
|
|
(Exact Name of Registrant as Specified in its Charter) |
|
|
Delaware |
1-9788 |
06-1218089 |
|
(State or Other Jurisdiction of Incorporation) |
(Commission File Number) |
(I.R.S. Employer Identification No.) |
|
2 Science Road, Glenwood, Illinois |
60425 |
|
(Address of Principal Executive Offices) |
(Zip Code) |
|
(708) 755-7000 |
|
(Registrant's Telephone Number, Including Area Code) |
|
|
|
Not Applicable |
|
(Former Name or Former Address, if Changed Since Last Report) |
Check the appropriate box below if the Form 8-K filing is intended to simultaneously satisfy the filing obligation of the registrant under any of the following provisions (see General Instruction A.2. below):
[ ]Written communications pursuant to Rule 425 under the Securities Act (17 CFR 230.425)
[ ]Soliciting material pursuant to Rule 14a-12 under the Exchange Act (17 CFR 240.14a-12)
[ ]Pre-commencement communications pursuant to Rule 14d-2(b) under the Exchange Act (17 CFR 240.14d-2(b))
[ ]Pre-commencement communications pursuant to Rule 13e-4(c) under the Exchange Act (17 CFR 240.13e-4(c))
|
Item 2.02 |
Results of Operations and Financial Condition |
On February 9, 2016, Landauer, Inc. (the “Company”) issued a Press Release announcing its earnings for its fiscal 2016 first quarter ended December 31, 2015. A copy of the Press Release is furnished as Exhibit 99.1 to this Current Report on Form 8-K.
|
Item 7.01 |
Regulation FD Disclosure |
On February 9, 2016, the Company made available and distributed to analysts and prospective investors a slide presentation. The presentation materials included information regarding the Company’s operating and growth strategies and financial performance. Pursuant to Regulation FD, the presentation materials are attached as Exhibit 99.2 to this Current Report on Form 8-K.
|
Item 9.01 |
Financial Statements and Exhibits |
(d) Exhibits.
|
EXHIBIT NUMBER |
|
DESCRIPTION |
|
|
|
|
|
99.1 |
|
Press Release dated February 9, 2016 |
|
99.2 |
|
Investor Slide Presentation |
SIGNATURE
Pursuant to the requirements of the Securities Exchange Act of 1934, the registrant has duly caused this report to be signed on its behalf by the undersigned hereunto duly authorized.
|
|
LANDAUER, INC. |
|
|
|
|
|
|
|
|
|
|
February 12, 2016 |
By: |
/s/ Daniel J. Fujii |
|
|
|
Daniel J. Fujii |
|
|
|
Chief Financial Officer |
EXHIBIT 99.1
LANDAUER
LANDAUER, INC. Reports
Fiscal 2016 FIRST QUARTER RESULTS
For Further Information Contact:
Michael DeGraff
Sard Verbinnen & Co
Phone: 312.895.4734
Email: [email protected]
GLENWOOD, Ill. — February 9, 2016 — Landauer, Inc. (NYSE: LDR), a recognized leader in personal and environmental radiation measurement and monitoring, outsourced medical physics services and high quality medical consumable accessories, today reported financial results for its fiscal 2016 first quarter ended December 31, 2015.
Fiscal 2016 First Quarter Highlights
|
· |
Revenue of $36.5 million compared to $37.5 million in the first quarter of 2015 |
|
o |
Domestic Radiation Measurement services revenues increased 2.8% year-over-year |
|
o |
Medical Physics revenues grew 10.6% year-over-year |
|
o |
$1.6 million reduction in revenue related to divestiture of Radon business |
|
o |
$1.2 million unfavorable impact from foreign currency |
|
o |
Revenues grew 5.2%, excluding the unfavorable impact of foreign currency and the divested Radon business |
|
· |
Operating income of $6.2 million, a 1.6% increase compared to the first quarter of 2015 |
|
o |
Consolidated operating income margin improved to 17.1% from 16.4% in the first quarter of 2015 driven by a decrease in selling, general and administrative expenses |
|
· |
Net income of $3.6 million compared to $4.4 million in the first quarter of 2015 |
|
· |
Adjusted net income of $4.1 million on track with full-year guidance |
|
· |
On a GAAP basis, earnings per diluted share of $0.38 |
Mike Kaminski, President and Chief Executive Officer of Landauer stated, “Our fiscal 2016 first quarter financial results were in line with our expectations and reflect the consistent demand for our products and solutions, especially within our Medical Physics business. Our core services that contribute to our recurring revenue base demonstrated strong growth, and I am pleased with the progress we have made driving improvement in our operating margins across all our segments. Looking ahead, we are well positioned to continue making significant progress on our strategic initiatives, including growth of our informatics solutions and continued development of our next generation dosimetry platform.”
First Fiscal Quarter Financial Overview and Business Segment Results
Revenues for the first fiscal quarter of 2016 were $36.5 million, a 2.7% decrease compared to revenues of $37.5 million for the first fiscal quarter of 2015. Radiation Measurement revenues for the quarter were $24.7 million compared to $26.5 million for the first fiscal quarter of 2015. The decrease in revenues was primarily due to the elimination of the Company’s Radon business through its divestiture in September 2015, resulting in a $1.6 million reduction in revenues. In addition, unfavorable foreign currency translation rates reduced revenues by $1.2 million. Domestic Radiation Measurement services revenues increased 2.8%, partially offsetting the impact of the Radon business divestiture and the foreign currency rates. Medical Physics revenues increased $0.9 million, or 10.6%, to $9.4 million, due to increased imaging services.
Operating income for the first fiscal quarter of 2016 was $6.2 million, compared to operating income of $6.1 million for the first fiscal quarter of 2015. Operating income results reflect a decrease in selling, general and administrative expenses, driven by restructuring within the executive management team as well as lower professional fees. Consolidated operating income margin improved to 17.1% from 16.4% in the first fiscal quarter of 2015, driven by the decrease in selling, general and administrative expenses, with improvement across all business segments.
Use of Non-GAAP Financial Measures
Adjusted EBITDA is presented here not as an alternative to net income, but rather as a measure of the Company’s operating performance and is not intended to be a presentation in accordance with GAAP. Since EBITDA (generally, net income plus interest expenses, taxes, depreciation and amortization) is not calculated identically by all companies, this presentation may not be comparable to EBITDA or Adjusted EBITDA presentations disclosed by other companies. Adjusted EBITDA represents net income with adjustments for net financing costs, depreciation and amortization, provision for income taxes, stock compensation expense, goodwill and other intangible assets impairments, and acquisition, reorganization and nonrecurring costs. Management believes that Adjusted EBITDA is useful in evaluating the Company’s operating performance compared to that of other companies in its industry because the calculation of Adjusted EBITDA generally eliminates the effects of certain non-cash and other items that may vary for different companies for reasons unrelated to overall operating performance.
In addition, the Company’s management used Adjusted Net Income as a measure of earnings to eliminate the effects of certain non-cash and nonrecurring items of the Company. Adjusted Net Income represents net income with tax-effected adjustments for stock compensation expense, goodwill and other intangible assets impairments and acquisition, reorganization and nonrecurring costs. However, Adjusted EBITDA and Adjusted Net Income are not recognized measurements under GAAP and should not be considered as an alternative to the most directly comparable measures presented in accordance with GAAP. A reconciliation of these non-GAAP measures to the most directly comparable GAAP measures is included within this news release.
2
Conference Call Details
Landauer has scheduled its first quarter conference call for investors over the Internet on Tuesday, February 9, 2016, at 4:00 p.m. Central Time (5:00 p.m. Eastern Time). To participate, callers should dial 866-866-1542 (within the United States and Canada), or 707-294-1539 (international callers), passcode 35752166, about 10 minutes before the presentation. To listen to a webcast on the Internet, please go to the Company’s website at http://www.landauer.com at least 15 minutes early to register, download and install any necessary audio software. Investors may access a replay of the call by dialing 855-859-2056 (within the United States and Canada), or 800-585-8367 (international callers), passcode 35752166, which will be available through Thursday, March 10, 2016. The replay will also be available on Landauer’s website for 30 days following the call.
About Landauer
Landauer is a leading global provider of technical and analytical services to determine occupational and environmental radiation exposure, the leading domestic provider of outsourced medical physics services, as well as a provider of high quality medical accessories used in radiology, radiation therapy, and image guided surgery procedures. For more than 50 years, the Company has provided complete radiation dosimetry services to hospitals, medical and dental offices, universities, national laboratories, nuclear facilities and other industries in which radiation poses a potential threat to employees. Landauer’s services include the manufacture of various types of radiation detection monitors, the distribution and collection of the monitors to and from customers, and the analysis and reporting of exposure findings. The Company provides its dosimetry services to approximately 1.8 million individuals globally. In addition, through its Medical Physics segment, the Company provides therapeutic and imaging physics services to the medical physics community. Through its Medical Products segment, the Company provides medical consumable accessories used in radiology, radiation therapy, and image guided surgery procedures. For information about Landauer, please visit their website at http://www.landauer.com.
3
Safe Harbor Statement
Some of the information shared here constitutes forward-looking statements that are based on assumptions and involve certain risks and uncertainties. These include the following, without limitation: assumptions, risks and uncertainties associated with the Company’s future performance; the Company’s development and introduction of new technologies in general; the ability to protect and utilize the Company’s intellectual property; continued customer acceptance of the InLight technology; the adaptability of optically stimulated luminescence (OSL) technology to new platforms and formats; military and other government funding for the purchase of certain of the Company’s equipment and services; the impact on sales and pricing of certain customer group purchasing arrangements; changes in spending or reimbursement for medical products or services; the costs associated with the Company’s research and business development efforts; the usefulness of older technologies and related licenses and intellectual property; the effectiveness of and costs associated with the Company’s IT platform enhancements; the anticipated results of operations of the Company and its subsidiaries or joint ventures; valuation of the Company’s long-lived assets or reporting units relative to future cash flows; changes in pricing of services and products; changes in postal and delivery practices; the Company’s business plans; anticipated revenue and cost growth; the ability to integrate the operations of acquired businesses and to realize the expected benefits of acquisitions; the risks associated with conducting business internationally; costs incurred for potential acquisitions or similar transactions; other anticipated financial events; the effects of changing economic and competitive conditions, including instability in capital markets which could impact availability of short and long-term financing; the timing and extent of changes in interest rates; the level of borrowings; foreign exchange rates; government regulations; accreditation requirements; changes in the trading market that affect the costs of obligations under the Company’s benefit plans; and pending accounting pronouncements. These assumptions may not materialize to the extent assumed, and risks and uncertainties may cause actual results to be different from what is anticipated today. These risks and uncertainties also may result in changes to the Company’s business plans and prospects, and could create the need from time to time to write down the value of assets or otherwise cause the Company to incur unanticipated expenses. Additional information may be obtained by reviewing the information set forth in Item 1A. “Risk Factors” and Item 7A. “Quantitative and Qualitative Disclosures about Market Risk” and information contained in the Company’s Annual Report on Form 10-K for the fiscal year ended September 30, 2015 and other reports filed by the Company, from time to time, with the Securities and Exchange Commission. The Company does not undertake, and expressly disclaims, any duty to update any forward-looking statement whether as a result of new information, future events or changes in the Company’s expectations, except as required by law.
Financial Tables Follow
4
Landauer, Inc. and Subsidiaries
Consolidated Balance Sheets (Unaudited)
|
|
|
|
|
|
|
|
|
|
|
|
|
|
|
|
|
(Dollars in Thousands) |
|
December 31, |
|
September 30, |
||
|
Assets |
|
|
|
|
|
|
|
Cash and cash equivalents |
|
$ |
9,540 |
|
$ |
15,314 |
|
Receivables, net of allowances of $1,608 at December 31, 2015 and $1,556 at September 30, 2015 |
|
|
32,058 |
|
|
32,412 |
|
Inventories |
|
|
7,195 |
|
|
7,035 |
|
Prepaid expenses and other current assets |
|
|
7,590 |
|
|
6,992 |
|
Total current assets |
|
|
56,383 |
|
|
61,753 |
|
|
|
|
|
|
|
|
|
Net property, plant and equipment |
|
|
46,067 |
|
|
46,367 |
|
Equity in joint ventures |
|
|
23,026 |
|
|
24,010 |
|
Goodwill |
|
|
34,868 |
|
|
35,072 |
|
Intangible assets, net of accumulated amortization of $38,964 at December 31, 2015 and $38,662 at September 30, 2015 |
|
|
12,839 |
|
|
13,052 |
|
Other assets |
|
|
28,502 |
|
|
28,490 |
|
Total assets |
|
$ |
201,685 |
|
$ |
208,744 |
|
|
|
|
|
|
|
|
|
Liabilities |
|
|
|
|
|
|
|
Total current liabilities |
|
$ |
36,434 |
|
$ |
38,493 |
|
Long-term debt |
|
|
127,685 |
|
|
133,385 |
|
Other non-current liabilities |
|
|
24,251 |
|
|
24,539 |
|
Total liabilities |
|
|
188,370 |
|
|
196,417 |
|
|
|
|
|
|
|
|
|
Stockholders' equity |
|
|
|
|
|
|
|
Landauer, Inc. stockholders' equity |
|
|
12,210 |
|
|
11,195 |
|
Noncontrolling interest |
|
|
1,105 |
|
|
1,132 |
|
Total stockholders' equity |
|
|
13,315 |
|
|
12,327 |
|
Total Liabilities and Stockholders' Equity |
|
$ |
201,685 |
|
$ |
208,744 |
5
Landauer, Inc. and Subsidiaries
Consolidated Statements of Operations (Unaudited)
|
|
|
Three Months Ended December 31, |
||||
|
(Dollars in Thousands, Except per Share) |
2015 |
2014 |
||||
|
Total revenues |
$ |
36,530 |
$ |
37,547 | ||
|
Cost and expenses: |
||||||
|
Cost of sales |
18,015 | 17,751 | ||||
|
Selling, general and administrative |
12,263 | 13,655 | ||||
|
Total costs and expenses |
30,278 | 31,406 | ||||
|
Operating income |
6,252 | 6,141 | ||||
|
Equity in income of joint ventures |
301 | 696 | ||||
|
Other expense, net |
(1,093) | (702) | ||||
|
Income before taxes |
5,460 | 6,135 | ||||
|
Income tax expense |
1,687 | 1,610 | ||||
|
Net income |
3,773 | 4,525 | ||||
|
Less: Net income attributed to noncontrolling interest |
130 | 148 | ||||
|
Net income attributed to Landauer, Inc. |
$ |
3,643 |
$ |
4,377 | ||
|
Net income per share attributable to Landauer, Inc. shareholders: |
||||||
|
Basic |
$ |
0.38 |
$ |
0.46 | ||
|
Weighted average basic shares outstanding |
9,460 | 9,446 | ||||
|
Diluted |
$ |
0.38 |
$ |
0.46 | ||
|
Weighted average diluted shares outstanding |
9,492 | 9,474 | ||||
6
Landauer, Inc. and Subsidiaries
Consolidated Statements of Cash Flows (Unaudited)
|
|
|
|
|
|
|
|
|
|
|
|
|
|
|
|
|
|
|
Three Months Ended December 31, |
||||
|
(Dollars in Thousands) |
|
2015 |
|
2014 |
||
|
Cash flows from operating activities: |
|
|
|
|
|
|
|
Net income |
|
$ |
3,773 |
|
$ |
4,525 |
|
Adjustments to reconcile net income to net cash provided by operating activities: |
|
|
|
|
|
|
|
Depreciation and amortization |
|
|
2,797 |
|
|
3,078 |
|
Equity in income of joint ventures |
|
|
(301) |
|
|
(696) |
|
Dividends from joint ventures |
|
|
1,195 |
|
|
1,139 |
|
Stock-based compensation and related net tax benefits |
|
|
457 |
|
|
437 |
|
Current and long-term deferred taxes, net |
|
|
632 |
|
|
(1,195) |
|
Gain on sale, disposal and abandonment of fixed assets |
|
|
(9) |
|
|
(3) |
|
Gain on investments |
|
|
(190) |
|
|
(111) |
|
Changes in operating assets and liabilities |
|
|
(2,413) |
|
|
2,310 |
|
Net cash provided by operating activities |
|
|
5,941 |
|
|
9,484 |
|
|
|
|
|
|
|
|
|
Net cash used in investing activities |
|
|
(2,929) |
|
|
(1,699) |
|
|
|
|
|
|
|
|
|
Cash flows from financing activities: |
|
|
|
|
|
|
|
Long-term borrowings, net |
|
|
(5,700) |
|
|
- |
|
Dividends paid to stockholders |
|
|
(2,651) |
|
|
(5,347) |
|
Other financing activities, net |
|
|
(156) |
|
|
(331) |
|
Net cash used in financing activities |
|
|
(8,507) |
|
|
(5,678) |
|
|
|
|
|
|
|
|
|
Effects of foreign currency translation |
|
|
(279) |
|
|
(471) |
|
Net (decrease) increase in cash and cash equivalents |
|
|
(5,774) |
|
|
1,636 |
|
Opening balance - cash and cash equivalents |
|
|
15,314 |
|
|
6,761 |
|
Ending balance - cash and cash equivalents |
|
$ |
9,540 |
|
$ |
8,397 |
7
Non-GAAP Financial Measures
A reconciliation of Adjusted EBITDA and Adjusted Net Income (i.e., non-GAAP financial measures) to the most directly comparable GAAP measures is provided below:
|
|
Three Months Ended December 31, |
||||
|
(Unaudited, Dollars in Thousands) |
2015 |
2014 |
|||
|
Adjusted EBITDA |
|||||
|
Net income attributed to Landauer, Inc. |
$ |
3,643 |
$ |
4,377 | |
|
Add back: |
|||||
|
Net financing costs |
818 | 838 | |||
|
Depreciation and amortization |
2,797 | 3,078 | |||
|
Provision for income taxes |
1,687 | 1,610 | |||
|
Earnings before interest, taxes, depreciation and amortization (EBITDA) |
$ |
8,945 |
$ |
9,903 | |
|
Adjustments: |
|||||
|
Non-cash stock based compensation |
457 | 437 | |||
|
Transaction expenses |
190 |
- |
|||
|
Sub-total adjustments |
647 | 437 | |||
|
Adjusted EBITDA |
$ |
9,592 |
$ |
10,340 | |
|
|
Three Months Ended December 31, |
||||
|
(Unaudited, Dollars in Thousands) |
2015 |
2014 |
|||
|
Adjusted Net Income |
|||||
|
Net income attributed to Landauer, Inc. |
$ |
3,643 |
$ |
4,377 | |
|
Sub-total adjustments |
647 | 437 | |||
|
Income taxes on adjustments |
(200) | (114) | |||
|
Adjustments, net |
447 | 323 | |||
|
Adjusted Net Income |
$ |
4,090 |
$ |
4,700 | |
8
Segment Information
The following tables summarize financial information for each reportable segment for the three months ended December 31:
|
|
|
Three Months Ended December 31, |
||||
|
(Unaudited, Dollars in Thousands) |
2015 |
2014 |
||||
|
Revenues by segment: |
||||||
|
Radiation Measurement |
$ |
24,704 |
$ |
26,491 | ||
|
Medical Physics |
9,353 | 8,484 | ||||
|
Medical Products |
2,473 | 2,572 | ||||
|
Consolidated revenues |
$ |
36,530 |
$ |
37,547 | ||
|
|
|
Three Months Ended December 31, |
||||
|
(Unaudited, Dollars in Thousands) |
2015 |
2014 |
||||
|
Operating income (loss) by segment: |
||||||
|
Radiation Measurement |
$ |
8,898 |
$ |
9,384 | ||
|
Medical Physics |
778 | 618 | ||||
|
Medical Products |
490 | 334 | ||||
|
Corporate |
(3,914) | (4,195) | ||||
|
Consolidated operating income |
$ |
6,252 |
$ |
6,141 | ||
9
 Investor Presentation February 2016
 2 Safe Harbor StatemenSome of the information shared here (including, in particular, the section titled “Fiscal 2016 Outlook”) constitutes forward-looking statements that are based on assumptions and involve certain risks and uncertainties. These include the following, without limitation: assumptions, risks and uncertainties associated with the Company’s future performance, the Company’s development and introduction of new technologies in general; the ability to protect and utilize the Company’s intellectual property; continued customer acceptance of the InLight technology; the adaptability of optically stimulated luminescence (OSL) technology to new platforms and formats; military and other government funding for the purchase of certain of the Company’s equipment and services; the impact on sales and pricing of certain customer group purchasing arrangements; changes in spending or reimbursement for medical products or services; the costs associated with the Company’s research and business development efforts; the usefulness of older technologies and related licenses and intellectual property; the effectiveness of and costs associated with the Company’s IT platform enhancements and investments in cyber security enhancements; the anticipated results of operations of the Company and its subsidiaries or ventures; valuation of the Company’s long-lived assets or business units relative to future cash flows; changes in pricing of services and products; changes in postal and delivery practices; the Company’s business plans; anticipated revenue and cost growth; the ability to integrate the operations of acquired businesses and to realize the expected benefits of acquisitions; the risks associated with conducting business internationally; costs incurred for potential acquisitions or similar transactions; other anticipated financial events; the effects of changing economic and competitive conditions, including instability in capital markets which could impact availability of short and long-term financing; the timing and extent of changes in interest rates; the level of borrowings; foreign exchange rates; government regulations; accreditation requirements; changes in the trading market that affect the costs of obligations under the Company’s benefit plans; and pending accounting pronouncements. These assumptions may not materialize to the extent assumed, and risks and uncertainties may cause actual results to be different from what is anticipated today. These risks and uncertainties also may result in changes to the Company’s business plans and prospects, and could create the need from time to time to write down the value of assets or otherwise cause the Company to incur unanticipated expenses. Additional information may be obtained by reviewing the information set forth in Item 1A “Risk Factors” and Item 7A “Quantitative and Qualitative Disclosures about Market Risk” and information contained in the Company's Annual Report on Form 10-K for the year ended September 30, 2015 and other reports filed by the Company, from time to time, with the Securities and Exchange Commission. The Company does not undertake, and expressly disclaims, any duty to update any forward-looking statement whether as a result of new information, future events or changes in the Company’s expectations, except as required by law.
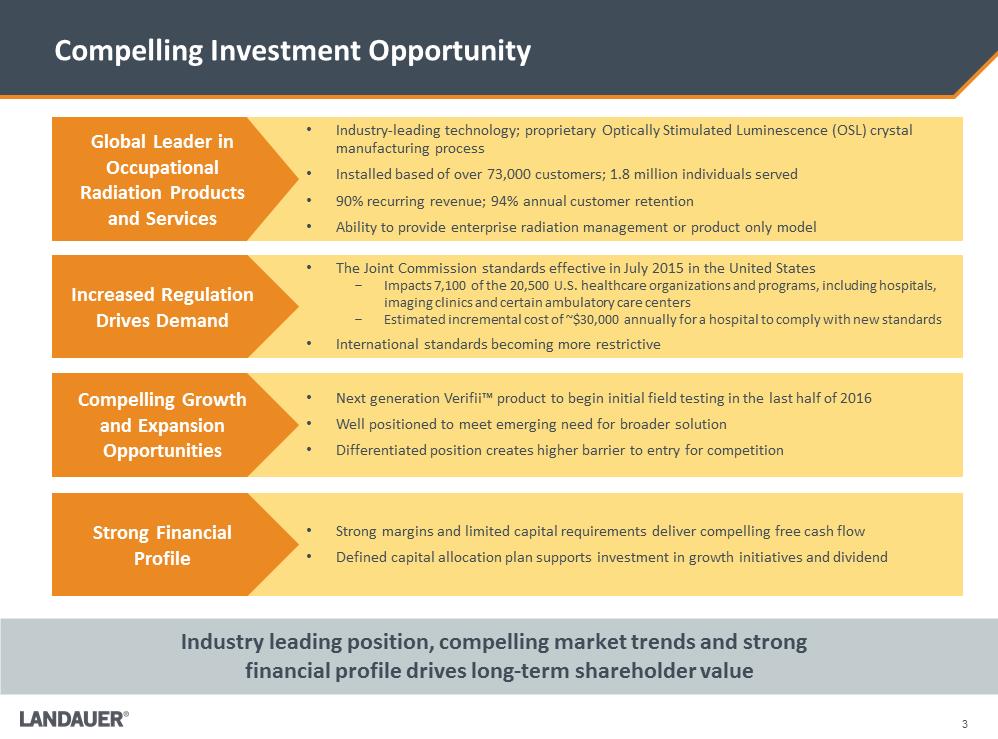 3 Compelling Investment Opportunity Industry leading position, compelling market trends and strong financial profile drives long-term shareholder value •The Joint Commission standards effective in July 2015 in the United States -Impacts 7,100 of the 20,500 U.S. healthcare organizations and programs, including hospitals, imaging clinics and certain ambulatory care centers -Estimated incremental cost of ~$30,000 annually for a hospital to comply with new standards •International standards becoming more restrictive •Next generation Verifii™ product to begin initial field testing in the last half of 2016 •Well positioned to meet emerging need for broader solution •Differentiated position creates higher barrier to entry for competition •Strong margins and limited capital requirements deliver compelling free cash flow •Defined capital allocation plan supports investment in growth initiatives and dividend •Industry-leading technology; proprietary Optically Stimulated Luminescence (OSL) crystal manufacturing process •Installed based of over 73,000 customers; 1.8 million individuals served •90% recurring revenue; 94% annual customer retention •Ability to provide enterprise radiation management or product only model Global Leader in Occupational Radiation Products and Services Increased Regulation Drives Demand Compelling Growth and Expansion Opportunities Strong Financial Profile
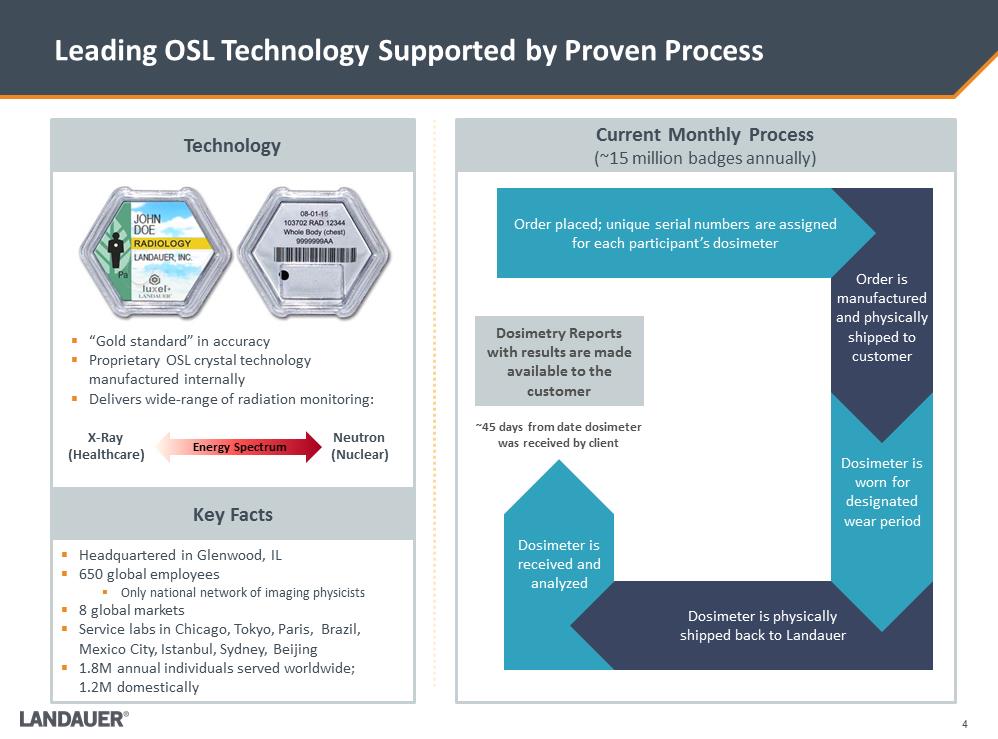 Dosimetry Reports with results are made available to the customer 4 Leading OSL Technology Supported by Proven Process .“Gold standard” in accuracy .Proprietary OSL crystal technology manufactured internally .Delivers wide-range of radiation monitoring: .Headquartered in Glenwood, IL .650 global employees .Only national network of imaging physicists .8 global markets .Service labs in Chicago, Tokyo, Paris, Brazil, Mexico City, Istanbul, Sydney, Beijing .1.8M annual individuals served worldwide; 1.2M domestically Dosimeter is received and analyzed Dosimeter is physically shipped back to Landauer Dosimeter is worn for designated wear period Order is manufactured and physically shipped to customer Order placed; unique serial numbers are assigned for each participant’s dosimeter ~45 days from date dosimeter was received by client Neutron (Nuclear) X-Ray (Healthcare) Current Monthly Process (~15 million badges annually) Technology Key Facts Energy Spectrum
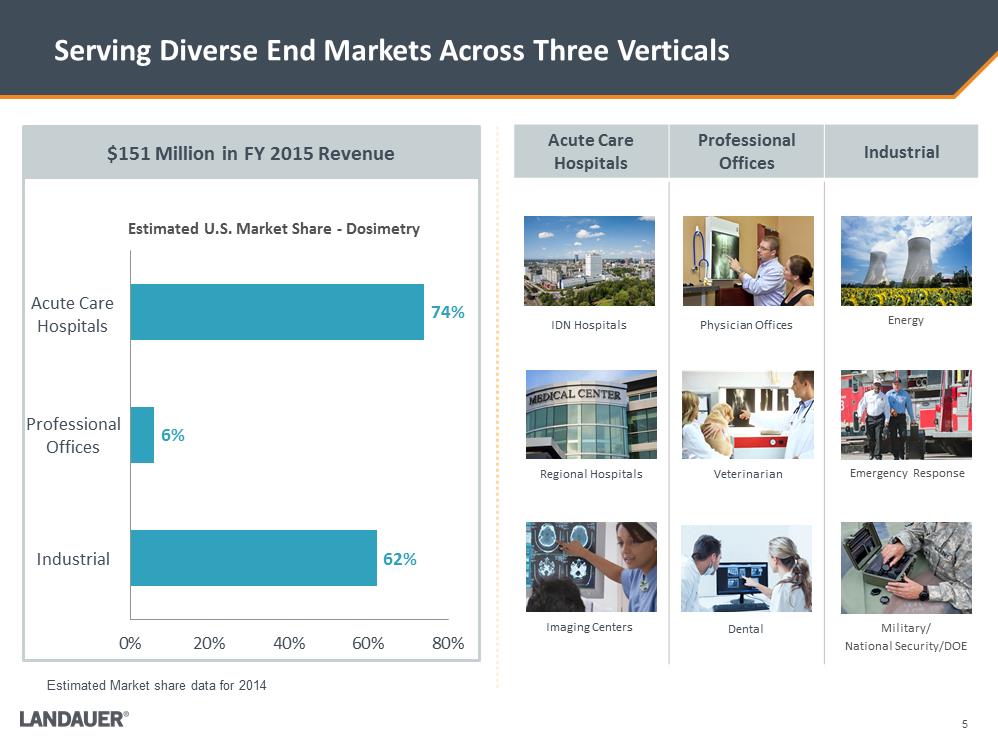 5 Serving Diverse End Markets Across Three Verticals Acute Care Hospitals Professional Offices Industrial Energy Emergency Response Military/ National Security/DOE W:\Landauer\Investors\Investor deck\Images\73470968_5.jpgW:\Landauer\Investors\Investor deck\Images\L41513.2429.jpgPhysician Offices IDN Hospitals Veterinarian Dental Regional Hospitals Imaging Centers $151 Million in FY 2015 Revenue 62% 6% 74% 0%20%40%60%80%Estimated U.S. Market Share - Dosimetry Acute Care Hospitals Professional Offices Industrial Estimated Market share data for 2014
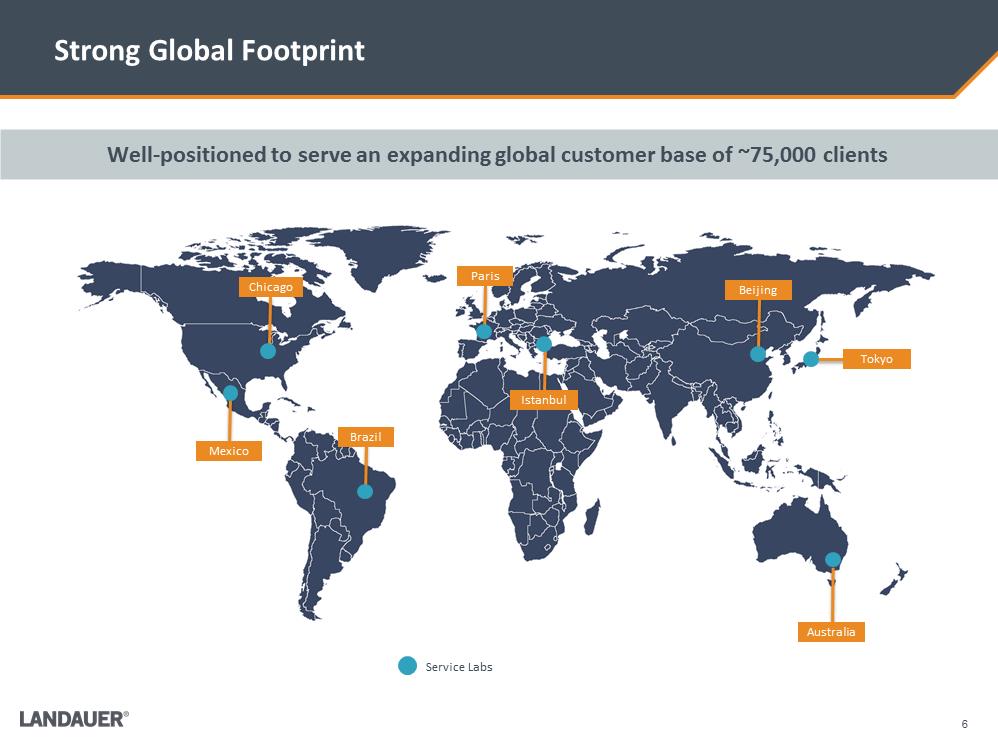 6 Strong Global Footprint Well-positioned to serve an expanding global customer base of ~75,000 clients Service Labs Chicago Mexico Brazil Paris Istanbul Beijing Tokyo Australia
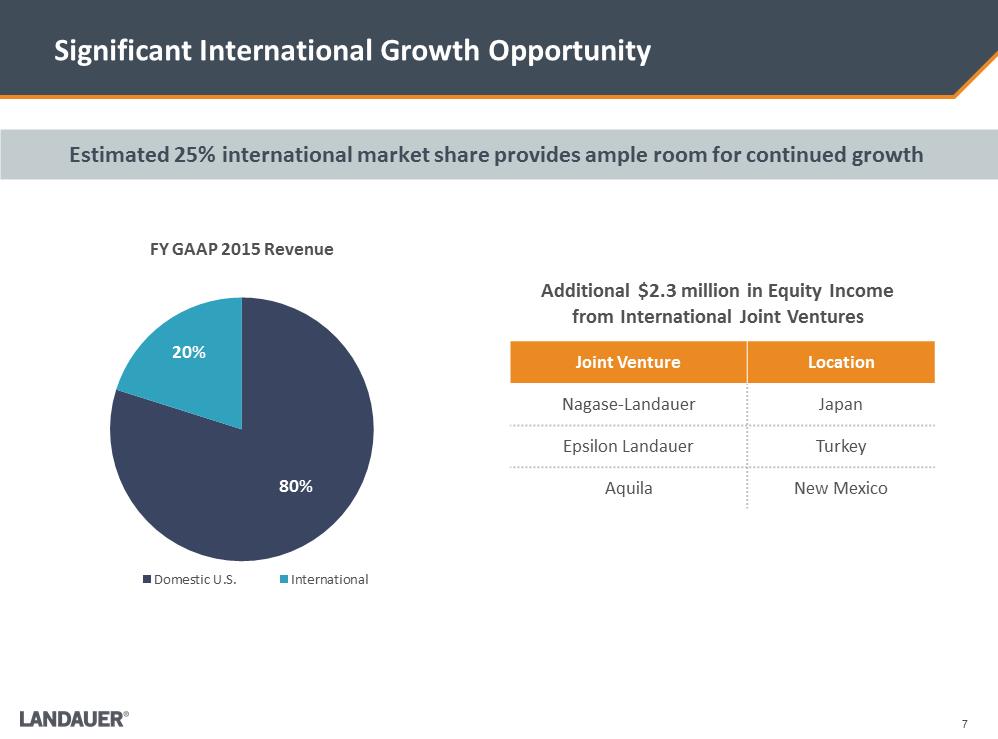 7 Significant International Growth Opportunity 80% 20% FY GAAP 2015 Revenue Domestic U.S.InternationalAdditional $2.3 million in Equity Income from International Joint Ventures Joint Venture Location Nagase-Landauer Japan Epsilon Landauer Turkey Aquila New Mexico Estimated 25% international market share provides ample room for continued growth
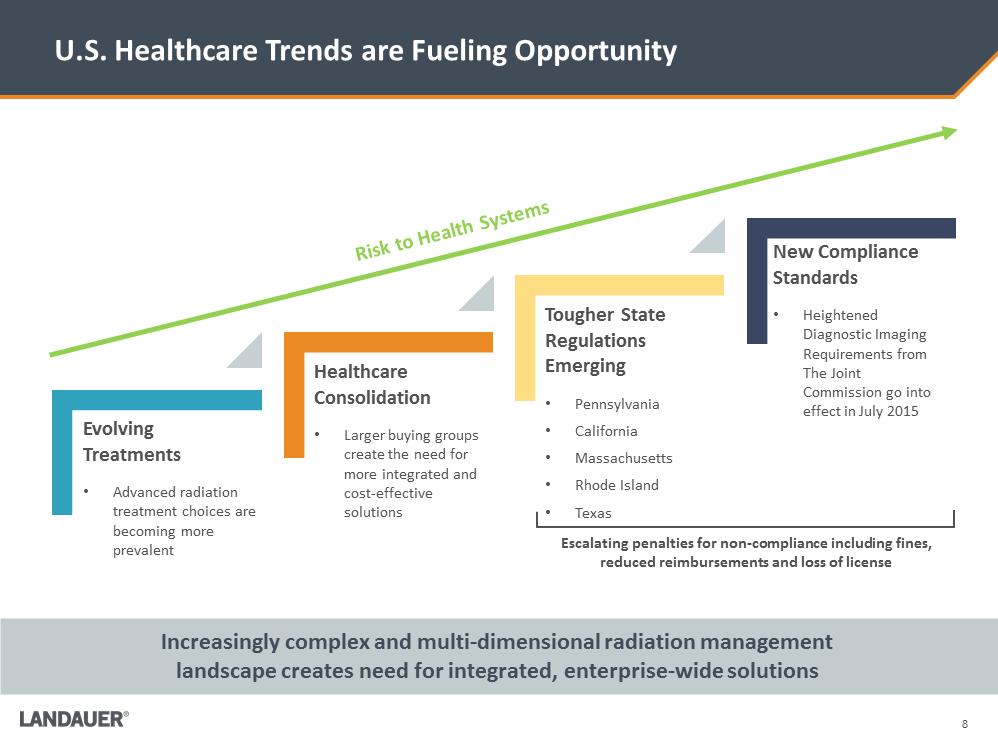 8 U.S. Healthcare Trends are Fueling Opportunity Increasingly complex and multi-dimensional radiation management landscape creates need for integrated, enterprise-wide solutions Risk to Health SystemsTougher State Regulations Emerging •Pennsylvania •California •Massachusetts •Rhode Island •Texas Healthcare Consolidation •Larger buying groups create the need for more integrated and cost-effective solutions Evolving Treatments •Advanced radiation treatment choices are becoming more prevalent New Compliance Standards •Heightened Diagnostic Imaging Requirements from The Joint Commission go into effect in July 2015 Escalating penalties for non-compliance including fines, reduced reimbursements and loss of license
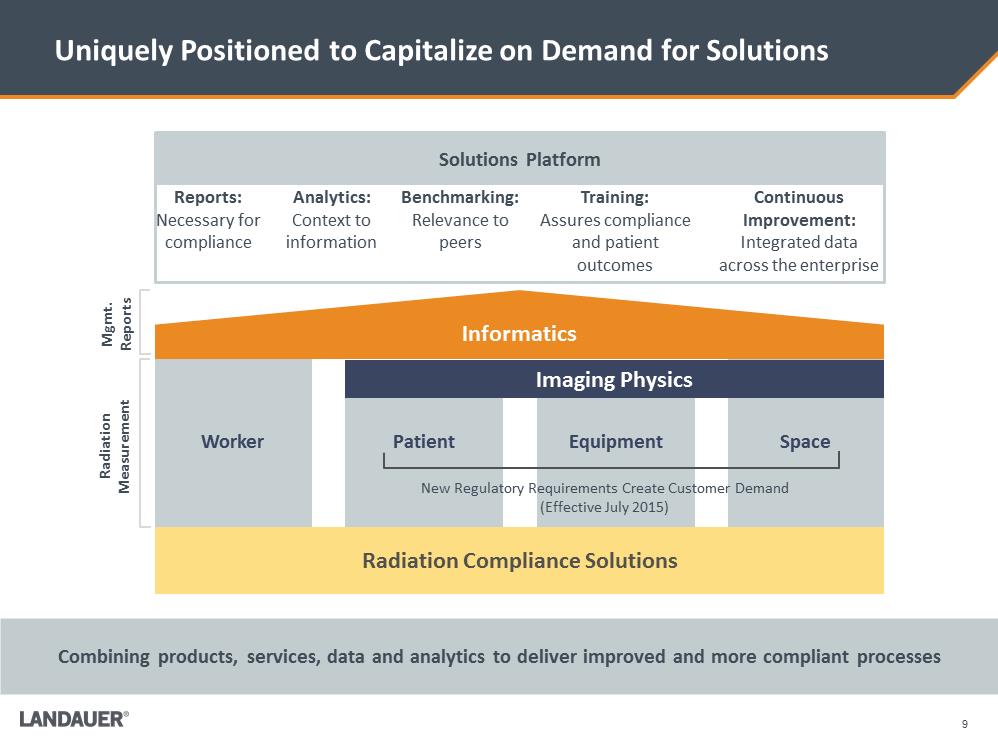 Reports: Necessary for compliance Analytics: Context to information Benchmarking: Relevance to peers Training: Assures compliance and patient outcomes Continuous Improvement: Integrated data across the enterprise 9 Uniquely Positioned to Capitalize on Demand for Solutions Combining products, services, data and analytics to deliver improved and more compliant processes Mgmt. Reports Space Radiation Compliance Solutions Informatics Radiation Measurement Equipment Patient Worker Imaging Physics New Regulatory Requirements Create Customer Demand (Effective July 2015) Solutions Platform
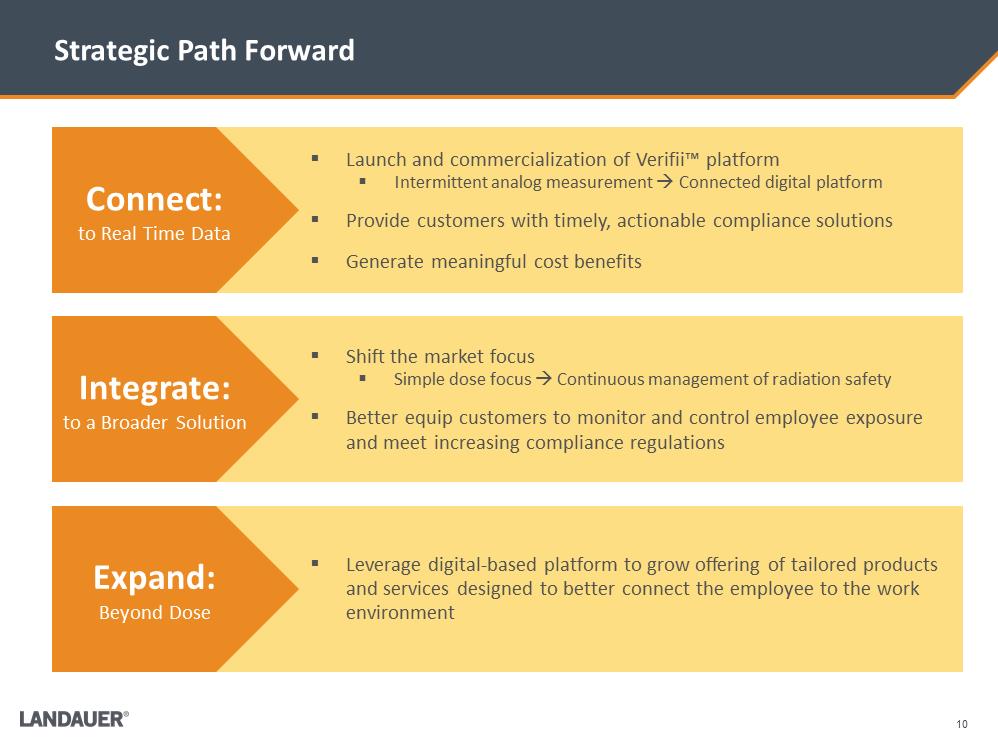 10 Strategic Path Forward .Shift the market focus .Simple dose focus . Continuous management of radiation safety .Better equip customers to monitor and control employee exposure and meet increasing compliance regulations .Leverage digital-based platform to grow offering of tailored products and services designed to better connect the employee to the work environment .Launch and commercialization of Verifii™ platform .Intermittent analog measurement . Connected digital platform .Provide customers with timely, actionable compliance solutions .Generate meaningful cost benefits Connect: to Real Time Data Integrate: to a Broader Solution Expand: Beyond Dose
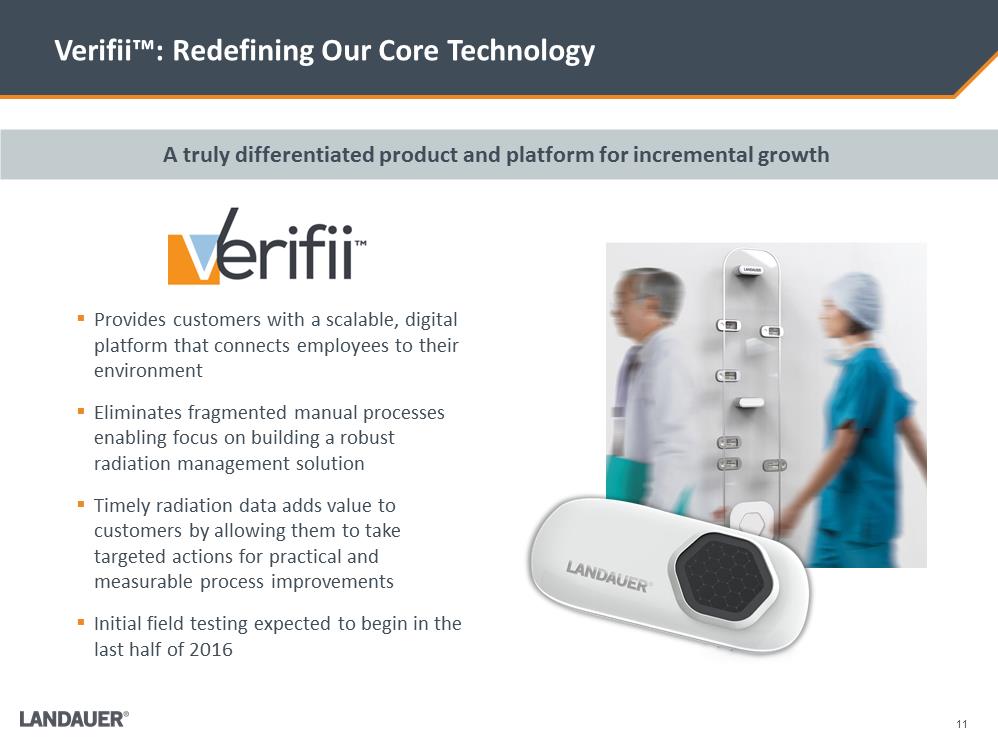 11 Verifii™: Redefining Our Core Technology .Provides customers with a scalable, digital platform that connects employees to their environment .Eliminates fragmented manual processes enabling focus on building a robust radiation management solution .Timely radiation data adds value to customers by allowing them to take targeted actions for practical and measurable process improvements .Initial field testing expected to begin in the last half of 2016 A truly differentiated product and platform for incremental growth C:\Users\mdegraff\AppData\Local\Microsoft\Windows\Temporary Internet Files\Content.Outlook\EQH1N7PW\Dosimeter.2.png
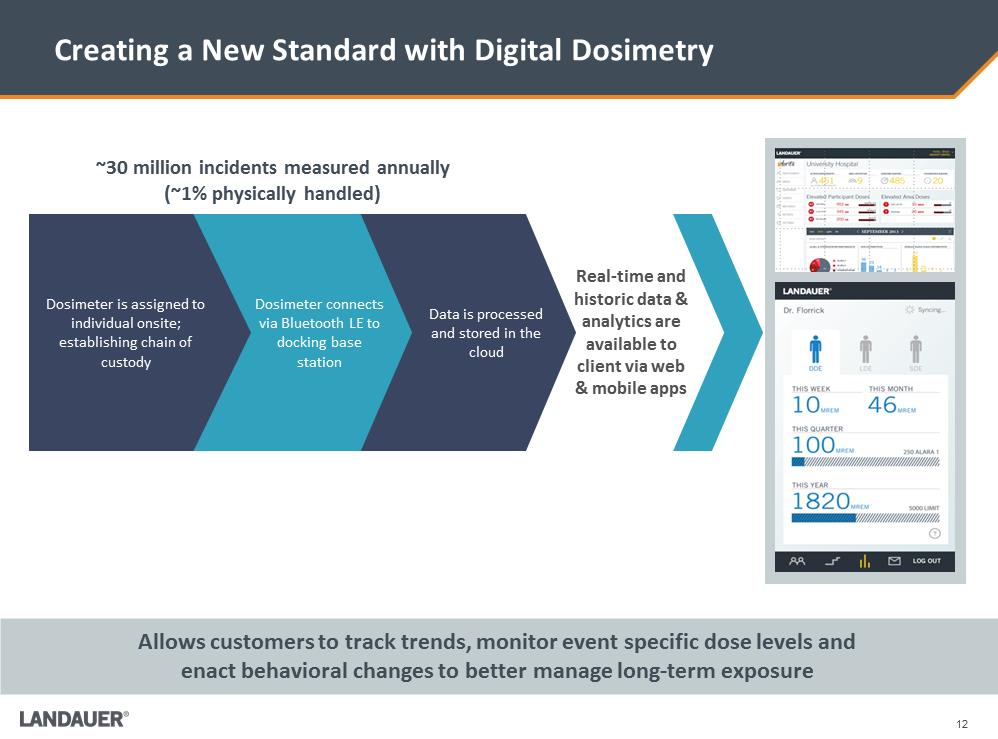 12 Creating a New Standard with Digital Dosimetry Real-time and historic data & analytics are available to client via web & mobile apps Data is processed and stored in the cloud Dosimeter connects via Bluetooth LE to docking base station Dosimeter is assigned to individual onsite; establishing chain of custody ~30 million incidents measured annually (~1% physically handled) Allows customers to track trends, monitor event specific dose levels and enact behavioral changes to better manage long-term exposure
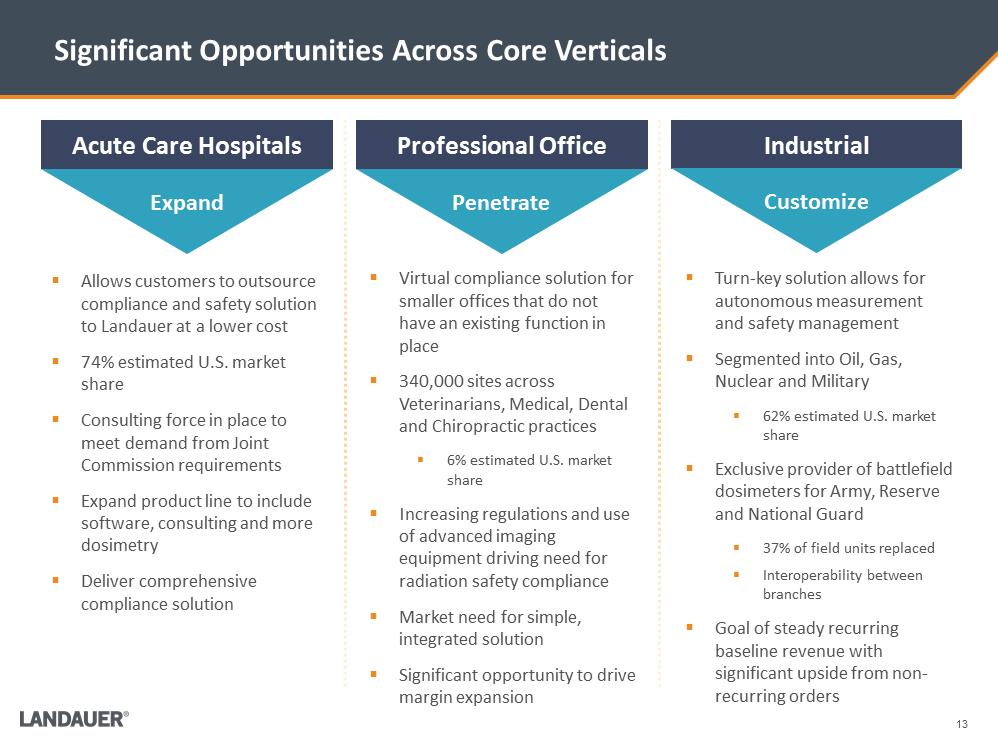 13 Significant Opportunities Across Core Verticals .Virtual compliance solution for smaller offices that do not have an existing function in place .340,000 sites across Veterinarians, Medical, Dental and Chiropractic practices .6% estimated U.S. market share .Increasing regulations and use of advanced imaging equipment driving need for radiation safety compliance .Market need for simple, integrated solution .Significant opportunity to drive margin expansion Acute Care Hospitals Professional Office Industrial .Allows customers to outsource compliance and safety solution to Landauer at a lower cost .74% estimated U.S. market share .Consulting force in place to meet demand from Joint Commission requirements .Expand product line to include software, consulting and more dosimetry .Deliver comprehensive compliance solution .Turn-key solution allows for autonomous measurement and safety management .Segmented into Oil, Gas, Nuclear and Military .62% estimated U.S. market share .Exclusive provider of battlefield dosimeters for Army, Reserve and National Guard .37% of field units replaced .Interoperability between branches .Goal of steady recurring baseline revenue with significant upside from non-recurring orders Expand Penetrate Customize
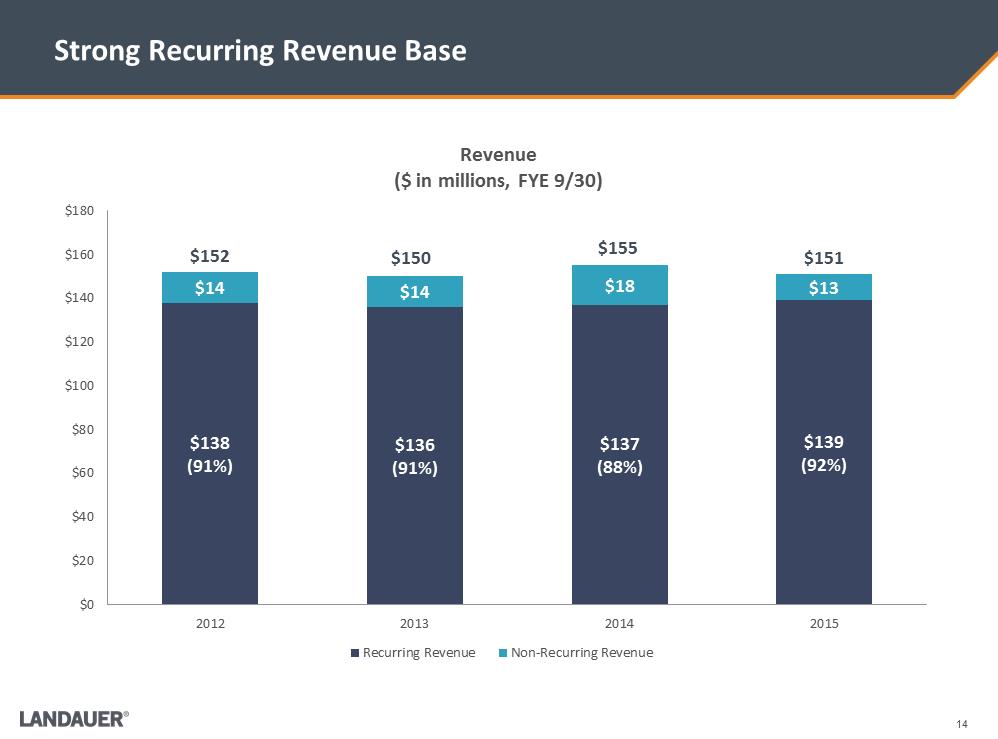 14 Strong Recurring Revenue Base $138 (91%) $136 (91%) $137 (88%) $139 (92%) $14 $14 $18 $13 $0$20$40$60$80$100$120$140$160$1802012201320142015Revenue ($ in millions, FYE 9/30) Recurring RevenueNon-Recurring Revenue$152 $150 $155 $151
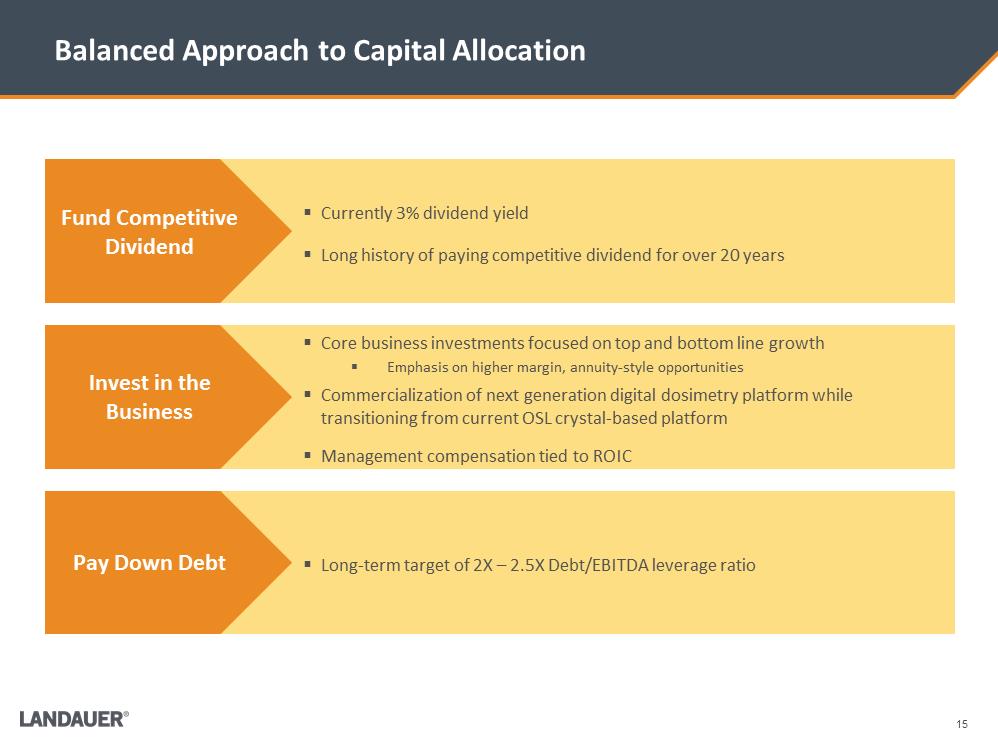 15 Balanced Approach to Capital Allocation .Core business investments focused on top and bottom line growth .Emphasis on higher margin, annuity-style opportunities .Commercialization of next generation digital dosimetry platform while transitioning from current OSL crystal-based platform .Management compensation tied to ROIC .Long-term target of 2X – 2.5X Debt/EBITDA leverage ratio .Currently 3% dividend yield .Long history of paying competitive dividend for over 20 years Fund Competitive Dividend Invest in the Business Pay Down Debt
 16 Compelling Investment Opportunity Industry leading position, compelling market trends and strong financial profile drives long-term shareholder value •The Joint Commission standards effective in July 2015 in the United States -Impacts 7,100 of the 20,500 U.S. healthcare organizations and programs, including hospitals, imaging clinics and certain ambulatory care centers -Estimated incremental cost of ~$30,000 annually for a hospital to comply with new standards •International standards becoming more restrictive •Next generation Verifii™ product to begin initial field testing in the last half of 2016 •Well positioned to meet emerging need for broader solution •Differentiated position creates higher barrier to entry for competition •Strong margins and limited capital requirements deliver compelling free cash flow •Defined capital allocation plan supports investment in growth initiatives and dividend •Industry-leading technology; proprietary Optically Stimulated Luminescence (OSL) crystal manufacturing process •Installed based of over 73,000 customers; 1.8 million individuals served •90% recurring revenue; 94% annual customer retention •Ability to provide enterprise radiation management or product only model Global Leader in Occupational Radiation Products and Services Increased Regulation Drives Demand Compelling Growth and Expansion Opportunities Strong Financial Profile
 Financial Overview
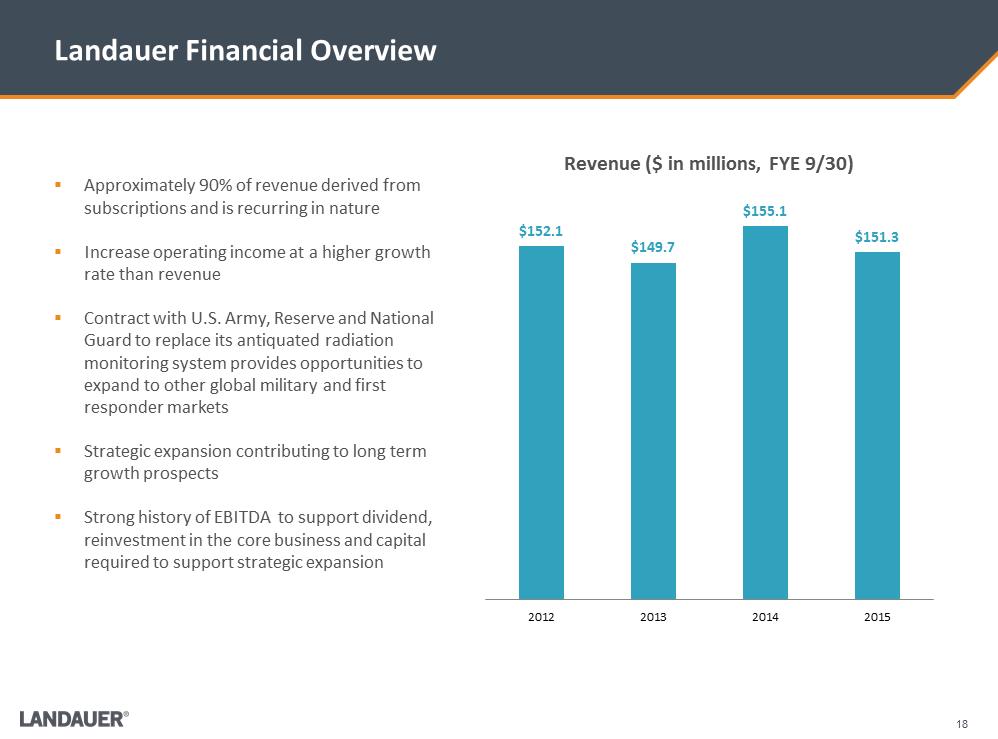 18 Landauer Financial Overview $152.1 $149.7 $155.1 $151.3 2012201320142015Revenue ($ in millions, FYE 9/30) .Approximately 90% of revenue derived from subscriptions and is recurring in nature .Increase operating income at a higher growth rate than revenue .Contract with U.S. Army, Reserve and National Guard to replace its antiquated radiation monitoring system provides opportunities to expand to other global military and first responder markets .Strategic expansion contributing to long term growth prospects .Strong history of EBITDA to support dividend, reinvestment in the core business and capital required to support strategic expansion
 Key Q1 FY 2016 Financial Drivers .Revenue of $36.5 million in the first quarter of fiscal 2016 down $1 million y/y due to unfavorable FX and our divested Radon business .Domestic Radiation Measurement service revenues grew by 2.8% over the prior year period .Medical Physics revenues grew 10.6% over the prior year period, driven by demand for our solutions to The Joint Commission’s new Diagnostic Imaging requirements that became effective July 1, 2015 .Adjusted net income of $4.1 million on pace with full-year fiscal 2016 guidance .Net income of $3.6 million, or $0.38 per diluted share Q1 FY16 Financial Highlights 19 $26.5 $24.7 $8.5 $9.4 $2.6 $2.5 $0$5$10$15$20$25$30$35$40Q1 2015Q1 2016Millions Revenue Rad MeasurementMed PhysicsMed Products$37.5 $36.5
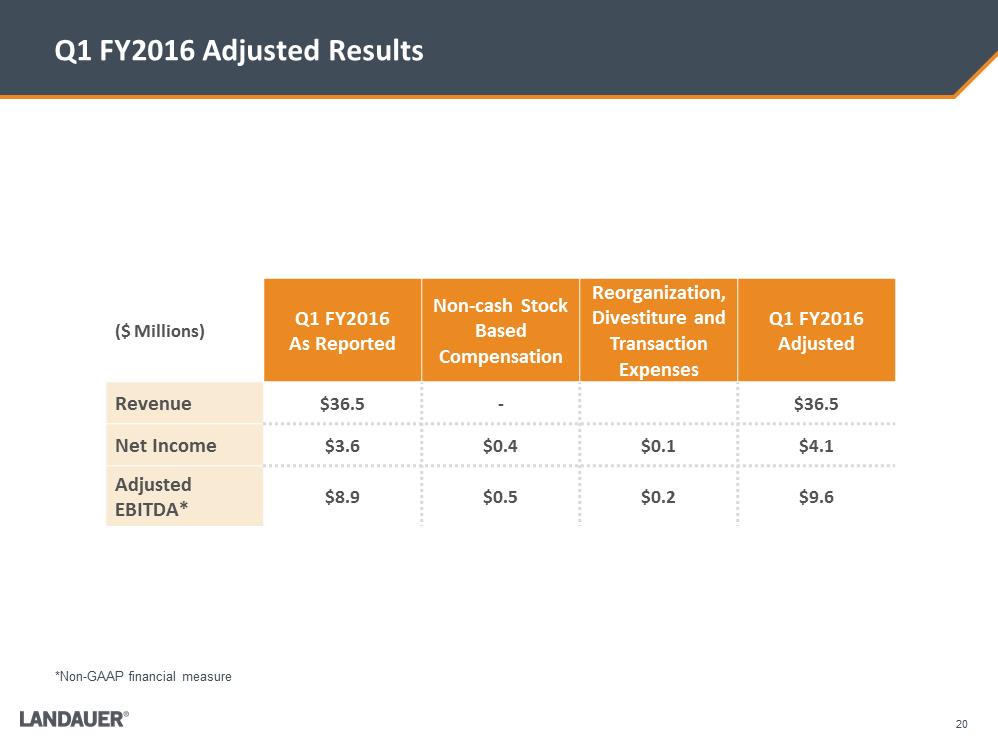 20 Q1 FY2016 Adjusted Results ($ Millions) Q1 FY2016 As Reported Non-cash Stock Based Compensation Reorganization, Divestiture and Transaction Expenses Q1 FY2016 Adjusted Revenue $36.5 - $36.5 Net Income $3.6 $0.4 $0.1 $4.1 Adjusted EBITDA* $8.9 $0.5 $0.2 $9.6 *Non-GAAP financial measure
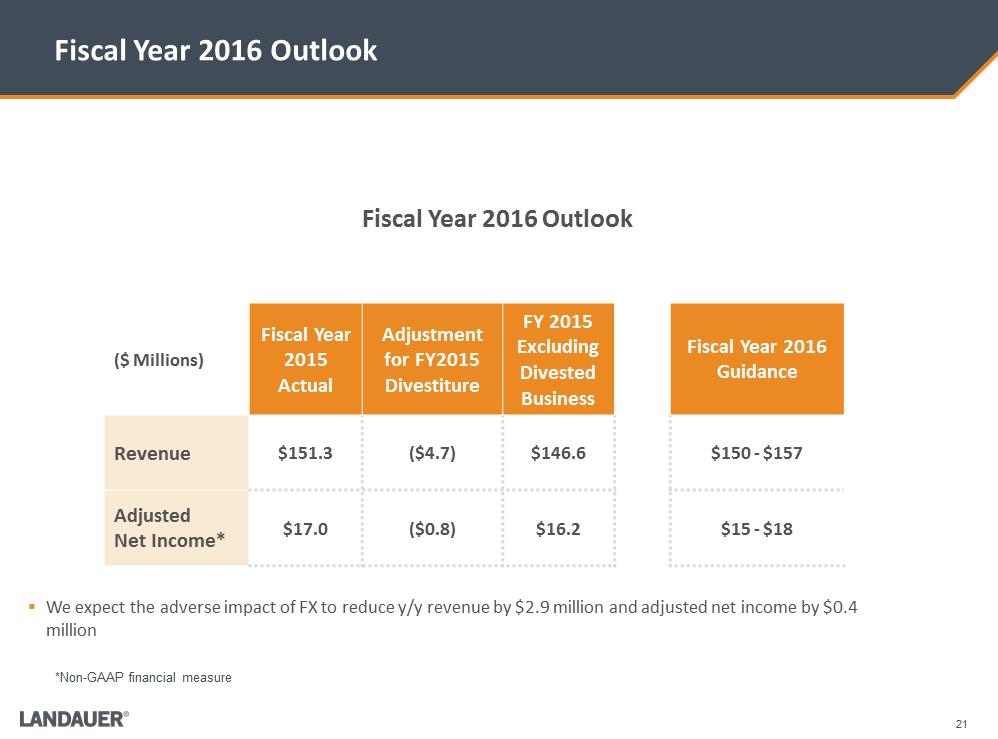 .We expect the adverse impact of FX to reduce y/y revenue by $2.9 million and adjusted net income by $0.4 million Fiscal Year 2016 Outlook 21 Fiscal Year 2016 Outlook ($ Millions) Fiscal Year 2015 Actual Adjustment for FY2015 Divestiture FY 2015 Excluding Divested Business Fiscal Year 2016 Guidance Revenue $151.3 ($4.7) $146.6 $150 - $157 Adjusted Net Income* $17.0 ($0.8) $16.2 $15 - $18 *Non-GAAP financial measure
 Appendix
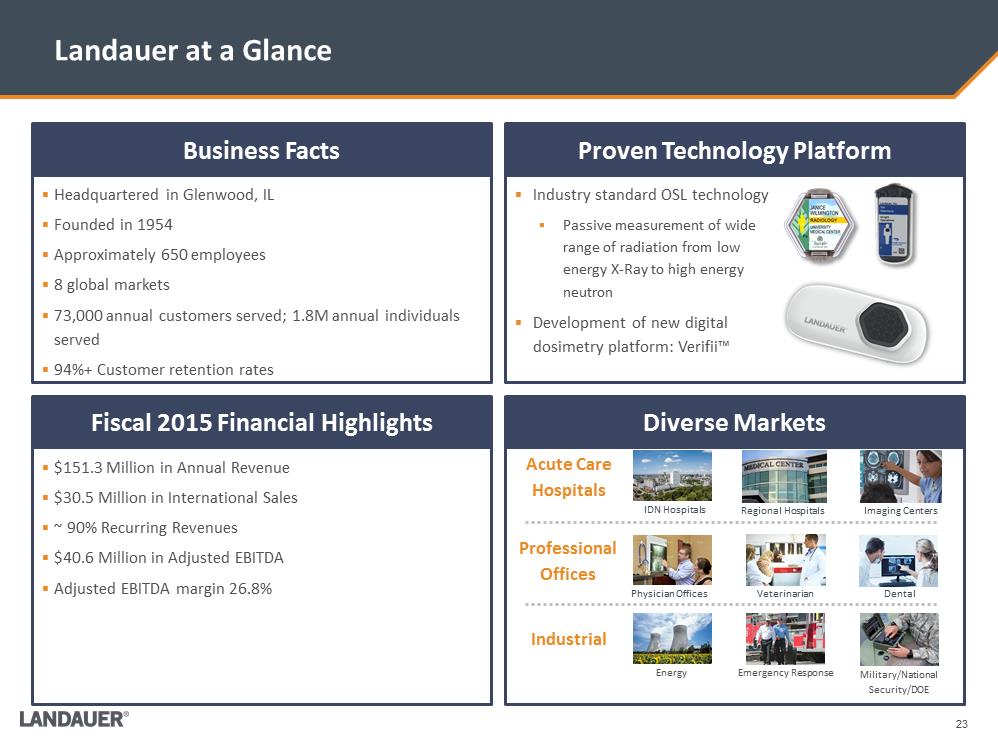 Business Facts Proven Technology Platform Fiscal 2015 Financial Highlights Diverse Markets .$151.3 Million in Annual Revenue .$30.5 Million in International Sales .~ 90% Recurring Revenues .$40.6 Million in Adjusted EBITDA .Adjusted EBITDA margin 26.8% .Headquartered in Glenwood, IL .Founded in 1954 .Approximately 650 employees .8 global markets .73,000 annual customers served; 1.8M annual individuals served .94%+ Customer retention rates Luxel_Waist.pnginlight_clip_holder_front_L.png.Industry standard OSL technology .Passive measurement of wide range of radiation from low energy X-Ray to high energy neutron .Development of new digital dosimetry platform: Verifii™ Landauer at a Glance 23 C:\Users\mdegraff\AppData\Local\Microsoft\Windows\Temporary Internet Files\Content.Outlook\EQH1N7PW\Dosimeter.2.pngIDN Hospitals Imaging Centers Regional Hospitals Physician Offices Veterinarian Dental Energy Emergency Response Military/National Security/DOE W:\Landauer\Investors\Investor deck\Images\73470968_5.jpgW:\Landauer\Investors\Investor deck\Images\L41513.2429.jpgAcute Care Hospitals Professional Offices Industrial
 Adjusted EBITDA is presented here not as an alternative to net income, but rather as a measure of the Company’s operating performance and is not intended to be a presentation in accordance with GAAP. Since EBITDA (generally, net income plus interest expenses, taxes, depreciation and amortization) is not calculated identically by all companies, this presentation may not be comparable to EBITDA or Adjusted EBITDA presentations disclosed by other companies. Adjusted EBITDA represents net income with adjustments for net financing costs, depreciation and amortization, provision for income taxes, stock compensation expense, goodwill and other intangible assets impairments, loss on disposition of business, transaction expenses and acquisition, reorganization and nonrecurring costs. Management believes that Adjusted EBITDA is useful in evaluating the Company’s operating performance compared to that of other companies in its industry because the calculation of Adjusted EBITDA generally eliminates the effects of certain non-cash and other items that may vary for different companies for reasons unrelated to overall operating performance. In addition, the Company’s management used Adjusted Net Income as a measure of earnings to eliminate the effects of certain non-cash and nonrecurring items of the Company. Adjusted Net Income represents net income with tax-effected adjustments for stock compensation expense, goodwill and other intangible assets impairments, loss on disposition of business, transaction expenses and acquisition, reorganization and nonrecurring costs. However, Adjusted EBITDA and Adjusted Net Income are not recognized measurements under GAAP and should not be considered as an alternative to the most directly comparable measures presented in accordance with GAAP. A reconciliation of these non-GAAP measures to the most directly comparable GAAP measures is included above. Use of Non-GAAP Financial Measures
Serious News for Serious Traders! Try StreetInsider.com Premium Free!
You May Also Be Interested In
- Rush Enterprises, Inc. Reports First Quarter 2024 Results, Announces $0.17 Per Share Dividend
- Voodoo Doughnut and Kane Brown Unite in Sweet Harmony with Kane Brown’s In The Air Doughnut
- Timberland Bancorp Reports Second Fiscal Quarter Net Income of $5.71 Million
Create E-mail Alert Related Categories
SEC FilingsSign up for StreetInsider Free!
Receive full access to all new and archived articles, unlimited portfolio tracking, e-mail alerts, custom newswires and RSS feeds - and more!
