

Form 8-K KEYCORP /NEW/ For: Oct 15
 Tweet
Tweet Share
Share
UNITED STATES
SECURITIES AND EXCHANGE COMMISSION
Washington, D.C. 20549
FORM 8-K
CURRENT REPORT
Pursuant to Section 13 or 15(d)
of the Securities Exchange Act of 1934
Date of Report (Date of earliest event reported): October 15, 2015

(Exact name of registrant as specified in charter)
| Ohio |
001-11302 |
34-6542451 | ||
| (State or other jurisdiction of incorporation) |
Commission File Number |
(I.R.S. Employer Identification No.) | ||
| 127 Public Square, Cleveland, Ohio |
44114-1306 | |||
| (Address of principal executive offices) | (Zip Code) | |||
(216) 689-3000
Registrant’s telephone number, including area code
Check the appropriate box below if the Form 8-K filing is intended to simultaneously satisfy the filing obligation of the registrant under any of the following provisions (see General Instruction A.2. below):
| ¨ | Written communications pursuant to Rule 425 under the Securities Act (17 CFR 230.425) |
| ¨ | Soliciting material pursuant to Rule 14a-12 under the Exchange Act (17 CFR 240.14a-12) |
| ¨ | Pre-commencement communications pursuant to Rule 14d-2(b) under the Exchange Act (17 CFR 240.14d-2(b)) |
| ¨ | Pre-commencement communications pursuant to Rule 13e-4(c) under the Exchange Act (17 CFR 240.13e-4(c)) |
| Item 2.02 | Results of Operations and Financial Condition. |
On October 15, 2015, KeyCorp issued a press release announcing its financial results for the three- and nine-month periods ended September 30, 2015 (the “Press Release”), and posted on its website its third quarter 2015 Supplemental Information Package (the “Supplemental Information Package”). The Press Release and Supplemental Information Package are being furnished as Exhibit 99.1 and Exhibit 99.2, respectively.
The information in the preceding paragraph, as well as Exhibit 99.1 and Exhibit 99.2 referenced therein, shall not be deemed “filed” for purposes of the Securities Exchange Act of 1934, as amended (the “Exchange Act”), nor shall it be incorporated by reference in any filing under the Securities Act of 1933, as amended (the “Securities Act”).
KeyCorp’s Consolidated Balance Sheets and Consolidated Statements of Income (collectively, the “Financial Statements”), included as part of the Press Release, are filed as Exhibit 99.3 to this report. Exhibit 99.3 is deemed “filed” for purposes of Section 18 of the Exchange Act and, therefore, may be incorporated by reference in filings under the Securities Act.
| Item 9.01 | Financial Statements and Exhibits. |
| (d) | Exhibits |
The following exhibits are furnished, or filed in the case of Exhibit 99.3, herewith:
| 99.1 | Press Release, dated October 15, 2015, announcing financial results for the three- and nine-month periods ended September 30, 2015. |
| 99.2 | Supplemental Information Package reviewed during the conference call and webcast. |
| 99.3 | Financial Statements. |
SIGNATURE
Pursuant to the requirements of the Securities Exchange Act of 1934, the registrant has duly caused this report to be signed on its behalf by the undersigned hereunto duly authorized.
| KEYCORP | ||||||
| (Registrant) | ||||||
| Date: October 15, 2015 | /s/ Douglas M. Schosser | |||||
| By: | Douglas M. Schosser | |||||
| Chief Accounting Officer | ||||||
Exhibit 99.1

|
NEWS |
FOR IMMEDIATE RELEASE
KEYCORP REPORTS THIRD QUARTER 2015
NET INCOME OF $216 MILLION, OR $.26 PER COMMON SHARE
Positive operating leverage from prior year
Revenue up 7% from prior year, reflecting growth in net interest income
and noninterest income
Average loans up 6% from prior year, driven by a
15% increase in commercial, financial and agricultural loans
Expenses include a $19 million pension settlement charge
Credit quality remains strong, with net charge-offs to average loans of .27%
Disciplined capital management with common share repurchases of $123 million
CLEVELAND, October 15, 2015 — KeyCorp (NYSE: KEY) today announced third quarter net income from continuing operations attributable to Key common shareholders of $216 million, or $.26 per common share, compared to $230 million, or $.27 per common share, for the second quarter of 2015, and $197 million, or $.23 per common share, for the third quarter of 2014. During the third quarter of 2015, Key incurred $19 million, or $.01 per common share, of costs related to a pension settlement charge, compared to $20 million, or $.01 per common share, during the third quarter of 2014.
For the nine months ended September 30, 2015, net income from continuing operations attributable to Key common shareholders was $668 million, or $.78 per common share, compared to $671 million, or $.76 per common share, for the same period one year ago.
“Key’s third quarter results reflect our continued success in growing our business, managing expenses and maintaining strong credit quality,” said Chairman and Chief Executive Officer Beth Mooney.
“We generated positive operating leverage relative to the same period last year, driven by a 7% increase in revenue along with well-managed expenses. Revenue trends reflect growth in new and expanded relationships across our company, which drove higher net interest income, as well as continued momentum in our fee-based businesses,” continued Mooney. “We saw good loan growth again this quarter, with average balances up 6% from the prior year, driven by a 15% increase in commercial, financial and agricultural loans. Loan balances increased in both the Community Bank and Corporate Bank.”
“Results compared with the prior quarter reflect higher net interest income and variability in capital markets revenues, which declined relative to our record second quarter,” said Mooney. “Expenses, excluding the pension settlement charge, were lower than the previous quarter.”
“Additionally, credit quality remains strong, with net charge-offs to average loans of .27%, which is below our targeted range,” added Mooney.
KeyCorp Reports Third Quarter 2015 Profit
October 15, 2015
Page 2
THIRD QUARTER 2015 FINANCIAL RESULTS, from continuing operations
Compared to Third Quarter of 2014
| • | Average loans up 6%, driven by 15% growth in commercial, financial and agricultural loans |
| • | Average deposits, excluding deposits in foreign office, up 3% due to continued growth in commercial mortgage servicing and inflows from commercial and consumer clients |
| • | Net interest income (taxable-equivalent) up $17 million, as higher earning asset balances offset lower earning asset yields |
| • | Noninterest income up $53 million due to strength in Key’s core fee-based businesses, which included a full-quarter impact of the September 2014 Pacific Crest Securities acquisition |
| • | Noninterest expense up $18 million primarily attributable to higher performance-based compensation and a full-quarter impact of the September 2014 Pacific Crest Securities acquisition |
| • | Asset quality remained strong, with net loan charge-offs to average loans of .27% |
| • | Disciplined capital management, repurchasing $123 million of common shares during the third quarter of 2015 and maintaining a solid capital position with an estimated Common Equity Tier 1 ratio of 10.51% |
Compared to Second Quarter of 2015
| • | Average loans up 2%, primarily driven by a 5% increase in commercial, financial and agricultural loans |
| • | Average deposits, excluding deposits in foreign office, down slightly reflecting a decline in short-term noninterest-bearing deposit balances from commercial clients and lower certificates of deposit |
| • | Net interest income (taxable-equivalent) up $7 million attributable to improvement in the earning asset mix, partly offset by slightly lower earning asset yields and loan fees |
| • | Noninterest income down $18 million, primarily due to lower investment banking and debt placement fees partially offset by growth in other fee-based businesses |
| • | Noninterest expense up $13 million, driven by a $19 million pension settlement charge in the third quarter |
| • | Strong asset quality, with net loan charge-offs to average loans remaining below our targeted range of 40-60 basis points |
Selected Financial Highlights
| dollars in millions, except per share data | Change 3Q15 vs. | |||||||||||||||||||
| 3Q15 | 2Q15 | 3Q14 | 2Q15 | 3Q14 | ||||||||||||||||
| Income (loss) from continuing operations attributable to Key common shareholders |
$ | 216 | $ | 230 | $ | 197 | (6.1 | )% | 9.6 | % | ||||||||||
| Income (loss) from continuing operations attributable to Key common shareholders per common share — assuming dilution |
.26 | .27 | .23 | (3.7 | ) | 13.0 | ||||||||||||||
| Return on average total assets from continuing operations |
.95 | % | 1.03 | % | .92 | % | N/A | N/A | ||||||||||||
| Common Equity Tier 1 (a), (b) |
10.51 | 10.71 | N/A | N/A | N/A | |||||||||||||||
| Tier 1 common equity (a) |
N/A | N/A | 11.26 | % | N/A | N/A | ||||||||||||||
| Book value at period end |
$ | 12.47 | $ | 12.21 | $ | 11.74 | 2.1 | % | 6.2 | % | ||||||||||
| Net interest margin (TE) from continuing operations |
2.87 | % | 2.88 | % | 2.96 | % | N/A | N/A | ||||||||||||
| (a) | The table entitled “GAAP to Non-GAAP Reconciliations” in the attached financial supplement presents the computations of certain financial measures related to “Common Equity Tier 1” (compliance date of January 1, 2015, under the Regulatory Capital Rules) and “Tier 1 common equity” (prior to January 1, 2015). The table reconciles the GAAP performance measures to the corresponding non-GAAP measures, which provides a basis for period-to-period comparisons. For further information on the Regulatory Capital Rules, see the “Capital” section of this release. |
| (b) | 9-30-15 ratio is estimated. |
TE = Taxable Equivalent, N/A = Not Applicable
KeyCorp Reports Third Quarter 2015 Profit
October 15, 2015
Page 3
INCOME STATEMENT HIGHLIGHTS
Revenue
| dollars in millions | Change 3Q15 vs. | |||||||||||||||||||
| 3Q15 | 2Q15 | 3Q14 | 2Q15 | 3Q14 | ||||||||||||||||
| Net interest income (TE) |
$ | 598 | $ | 591 | $ | 581 | 1.2 | % | 2.9 | % | ||||||||||
| Noninterest income |
470 | 488 | 417 | (3.7 | ) | 12.7 | ||||||||||||||
|
|
|
|
|
|
|
|
|
|
|
|||||||||||
| Total revenue |
$ | 1,068 | $ | 1,079 | $ | 998 | (1.0 | )% | 7.0 | % | ||||||||||
|
|
|
|
|
|
|
|||||||||||||||
TE = Taxable Equivalent
Taxable-equivalent net interest income was $598 million for the third quarter of 2015, and the net interest margin was 2.87%. These results compare to taxable-equivalent net interest income of $581 million and a net interest margin of 2.96% for the third quarter of 2014. The increase in net interest income reflects higher earning asset balances moderated by lower earning asset yields, which also drove the decline in the net interest margin.
Compared to the second quarter of 2015, taxable-equivalent net interest income increased by $7 million, and the net interest margin was essentially unchanged. The increase in net interest income and the relatively stable net interest margin were primarily attributable to improvement in the earning asset mix, partly offset by slightly lower earning asset yields and loan fees. One additional day in the third quarter of 2015 also contributed to the increase in net interest income compared to the prior quarter.
Noninterest Income
| dollars in millions | Change 3Q15 vs. | |||||||||||||||||||
| 3Q15 | 2Q15 | 3Q14 | 2Q15 | 3Q14 | ||||||||||||||||
| Trust and investment services income |
$ | 108 | $ | 111 | $ | 99 | (2.7 | )% | 9.1 | % | ||||||||||
| Investment banking and debt placement fees |
109 | 141 | 88 | (22.7 | ) | 23.9 | ||||||||||||||
| Service charges on deposit accounts |
68 | 63 | 68 | 7.9 | — | |||||||||||||||
| Operating lease income and other leasing gains |
15 | 24 | 17 | (37.5 | ) | (11.8 | ) | |||||||||||||
| Corporate services income |
57 | 43 | 42 | 32.6 | 35.7 | |||||||||||||||
| Cards and payments income |
47 | 47 | 42 | — | 11.9 | |||||||||||||||
| Corporate-owned life insurance income |
30 | 30 | 26 | — | 15.4 | |||||||||||||||
| Consumer mortgage income |
3 | 4 | 3 | (25.0 | ) | — | ||||||||||||||
| Mortgage servicing fees |
11 | 9 | 9 | 22.2 | 22.2 | |||||||||||||||
| Net gains (losses) from principal investing |
11 | 11 | 9 | — | 22.2 | |||||||||||||||
| Other income |
11 | 5 | 14 | 120.0 | (21.4 | ) | ||||||||||||||
|
|
|
|
|
|
|
|
|
|
|
|||||||||||
| Total noninterest income |
$ | 470 | $ | 488 | $ | 417 | (3.7 | )% | 12.7 | % | ||||||||||
|
|
|
|
|
|
|
|||||||||||||||
Key’s noninterest income was $470 million for the third quarter of 2015, compared to $417 million for the year-ago quarter. The increase from the prior year was primarily attributable to strength in Key’s core fee-based businesses, which included a full-quarter impact of the September 2014 acquisition of Pacific Crest Securities. The third quarter of 2015 included $21 million of higher investment banking and debt placement fees, $15 million of increased corporate services income, and $9 million of higher trust and investment services income. Additionally, cards and payments income increased $5 million due to higher revenue from credit card and merchant fees.
Compared to the second quarter of 2015, noninterest income decreased by $18 million. The primary cause for the decline was $32 million in lower investment banking and debt placement fees, reflecting the variability of the business. Additionally, operating lease income and other leasing gains decreased $9 million. These decreases were partially offset by $14 million in higher corporate services income due to increased derivative income and loan commitment fees, a $6 million increase in other income and $5 million of higher service charges on deposit accounts.
KeyCorp Reports Third Quarter 2015 Profit
October 15, 2015
Page 4
Noninterest Expense
| dollars in millions | Change 3Q15 vs. | |||||||||||||||||||
| 3Q15 | 2Q15 | 3Q14 | 2Q15 | 3Q14 | ||||||||||||||||
| Personnel expense |
$ | 426 | $ | 408 | $ | 405 | 4.4 | % | 5.2 | % | ||||||||||
| Nonpersonnel expense |
298 | 303 | 301 | (1.7 | ) | (1.0 | ) | |||||||||||||
|
|
|
|
|
|
|
|
|
|
|
|||||||||||
| Total noninterest expense |
$ | 724 | $ | 711 | $ | 706 | 1.8 | % | 2.5 | % | ||||||||||
|
|
|
|
|
|
|
|||||||||||||||
Key’s noninterest expense was $724 million for the third quarter of 2015, compared to $706 million in the third quarter of last year. Personnel costs increased $21 million year-over-year primarily due to increased performance-based compensation related to a strong capital markets business performance, along with a full-quarter impact of the September 2014 acquisition of Pacific Crest Securities. Nonpersonnel expense remained relatively stable as lower occupancy costs offset an increase in business services and professional fees.
Compared to the second quarter of 2015, noninterest expense increased by $13 million. This increase was primarily driven by a pension settlement charge of $19 million and partially offset by $5 million in lower nonpersonnel expense, largely related to lower occupancy costs.
BALANCE SHEET HIGHLIGHTS
In the third quarter of 2015, Key had average assets of $94.8 billion compared to $91.3 billion in the third quarter of 2014 and $93.9 billion in the second quarter of 2015.
Average Loans
| dollars in millions | Change 9-30-15 vs. | |||||||||||||||||||
| 9-30-15 | 6-30-15 | 9-30-14 | 6-30-15 | 9-30-14 | ||||||||||||||||
| Commercial, financial and agricultural (a) |
$ | 30,374 | $ | 29,017 | $ | 26,456 | 4.7 | % | 14.8 | % | ||||||||||
| Other commercial loans |
13,098 | 13,161 | 13,317 | (.5 | ) | (1.6 | ) | |||||||||||||
| Total home equity loans |
10,510 | 10,510 | 10,658 | — | (1.4 | ) | ||||||||||||||
| Other consumer loans |
5,299 | 5,290 | 5,365 | .2 | (1.2 | ) | ||||||||||||||
|
|
|
|
|
|
|
|
|
|
|
|||||||||||
| Total loans |
$ | 59,281 | $ | 57,978 | $ | 55,796 | 2.2 | % | 6.2 | % | ||||||||||
|
|
|
|
|
|
|
|||||||||||||||
| (a) | Commercial, financial and agricultural average loan balances include $88 million, $88 million, and $92 million of assets from commercial credit cards at September 30, 2015, June 30, 2015, and September 30, 2014, respectively. |
Average loans were $59.3 billion for the third quarter of 2015, an increase of $3.5 billion compared to the third quarter of 2014. The loan growth occurred primarily in the commercial, financial and agricultural portfolio, which increased $3.9 billion and was broad-based across Key’s commercial lines of business. Consumer loans declined $214 million as a result of the run-off in Key’s consumer exit portfolios. Key’s core consumer loan portfolio remained relatively stable to the year-ago quarter.
Compared to the second quarter of 2015, average loans increased by $1.3 billion, driven by commercial, financial and agricultural loans, which grew $1.8 billion on a period-end basis.
KeyCorp Reports Third Quarter 2015 Profit
October 15, 2015
Page 5
Average Deposits
| dollars in millions | Change 9-30-15 vs. | |||||||||||||||||||
| 9-30-15 | 6-30-15 | 9-30-14 | 6-30-15 | 9-30-14 | ||||||||||||||||
| Non-time deposits (a) |
$ | 64,928 | $ | 65,109 | $ | 61,699 | (.3 | )% | 5.2 | % | ||||||||||
| Certificates of deposit ($100,000 or more) |
1,985 | 2,010 | 2,629 | (1.2 | ) | (24.5 | ) | |||||||||||||
| Other time deposits |
3,064 | 3,136 | 3,413 | (2.3 | ) | (10.2 | ) | |||||||||||||
|
|
|
|
|
|
|
|
|
|
|
|||||||||||
| Total deposits |
$ | 69,977 | $ | 70,255 | $ | 67,741 | (.4 | )% | 3.3 | % | ||||||||||
|
|
|
|
|
|
|
|||||||||||||||
| Cost of total deposits (a) |
.15 | % | .15 | % | .16 | % | N/A | N/A | ||||||||||||
| (a) | Excludes deposits in foreign office. |
N/A = Not Applicable
Average deposits, excluding deposits in foreign office, totaled $70 billion for the third quarter of 2015, an increase of $2.2 billion compared to the year-ago quarter. NOW and money market deposit accounts increased by $2.3 billion, and noninterest-bearing deposits increased by $966 million, reflecting continued growth in the commercial mortgage servicing business and inflows from commercial and consumer clients. These increases were partially offset by a decline in certificates of deposit.
Compared to the second quarter of 2015, average deposits, excluding deposits in foreign office, decreased by $278 million. The decrease was driven by a decline in short-term noninterest-bearing deposit balances from commercial clients and lower certificates of deposit. These decreases were partly offset by increases in NOW and money market deposit accounts.
ASSET QUALITY
| dollars in millions | Change 3Q15 vs. | |||||||||||||||||||
| 3Q15 | 2Q15 | 3Q14 | 2Q15 | 3Q14 | ||||||||||||||||
| Net loan charge-offs |
$ | 41 | $ | 36 | $ | 31 | 13.9 | % | 32.3 | % | ||||||||||
| Net loan charge-offs to average total loans |
.27 | % | .25 | % | .22 | % | N/A | N/A | ||||||||||||
| Nonperforming loans at period end (a) |
$ | 400 | $ | 419 | $ | 401 | (4.5 | )% | (.2 | )% | ||||||||||
| Nonperforming assets at period end |
417 | 440 | 418 | (5.2 | ) | (.2 | ) | |||||||||||||
| Allowance for loan and lease losses |
790 | 796 | 804 | (.8 | ) | (1.7 | ) | |||||||||||||
| Allowance for loan and lease losses to nonperforming loans |
197.5 | % | 190.0 | % | 200.5 | % | N/A | N/A | ||||||||||||
| Provision for credit losses |
$ | 45 | $ | 41 | $ | 19 | 9.8 | % | 136.8 | % | ||||||||||
| (a) | Loan balances exclude $12 million, $12 million, and $14 million of purchased credit impaired loans at September 30, 2015, June 30, 2015, and September 30, 2014, respectively. |
N/A = Not Applicable
Key’s provision for credit losses was $45 million for the third quarter of 2015, compared to $19 million for the third quarter of 2014 and $41 million for the second quarter of 2015. Key’s allowance for loan and lease losses was $790 million, or 1.31% of total period-end loans, at September 30, 2015, compared to 1.43% at September 30, 2014, and 1.37% at June 30, 2015.
Net loan charge-offs for the third quarter of 2015 totaled $41 million, or .27% of average total loans. These results compare to $31 million, or .22%, for the third quarter of 2014, and $36 million, or .25%, for the second quarter of 2015.
At September 30, 2015, Key’s nonperforming loans totaled $400 million and represented .67% of period-end portfolio loans, compared to .71% at September 30, 2014, and .72% at June 30, 2015. Nonperforming assets at September 30, 2015 totaled $417 million and represented .69% of period-end portfolio loans and OREO and other nonperforming assets, compared to .74% at September 30, 2014, and .75% at June 30, 2015.
KeyCorp Reports Third Quarter 2015 Profit
October 15, 2015
Page 6
CAPITAL
Key’s estimated risk-based capital ratios included in the following table continued to exceed all “well-capitalized” regulatory benchmarks at September 30, 2015.
Capital Ratios
| 9-30-15 | 6-30-15 | 9-30-14 | ||||||||||
| Common Equity Tier 1 (a), (b) |
10.51 | % | 10.71 | % | N/A | |||||||
| Tier 1 common equity (b) |
N/A | N/A | 11.26 | % | ||||||||
| Tier 1 risk-based capital (a) |
10.90 | % | 11.11 | % | 12.01 | |||||||
| Total risk based capital (a) |
12.51 | 12.66 | 14.10 | |||||||||
| Tangible common equity to tangible assets (b) |
9.90 | 9.86 | 10.26 | |||||||||
| Leverage (a) |
10.67 | 10.74 | 11.15 | |||||||||
| (a) | 9-30-15 ratio is estimated. |
| (b) | The table entitled “GAAP to Non-GAAP Reconciliations” in the attached financial supplement presents the computations of certain financial measures related to “Common Equity Tier 1” (compliance date of January 1, 2015, under the Regulatory Capital Rules) and “Tier 1 common equity” (prior to January 1, 2015). The table reconciles the GAAP performance measures to the corresponding non-GAAP measures, which provides a basis for period-to-period comparisons. See below for further information on the Regulatory Capital Rules. |
As shown in the preceding table, at September 30, 2015, Key’s estimated Common Equity Tier 1 and Tier 1 risk-based capital ratios stood at 10.51% and 10.90%, respectively. In addition, the tangible common equity ratio was 9.90% at September 30, 2015.
In October 2013, federal banking regulators published the final Basel III capital framework for U.S. banking organizations (the “Regulatory Capital Rules”). The mandatory compliance date for Key as a “standardized approach” banking organization began on January 1, 2015, subject to transitional provisions extending to January 1, 2019. Key’s estimated Common Equity Tier 1 ratio as calculated under the fully phased-in Regulatory Capital Rules was 10.41% at September 30, 2015. This estimate exceeds the fully phased-in required minimum Common Equity Tier 1 and Capital Conservation Buffer of 7.00%.
Summary of Changes in Common Shares Outstanding
| in thousands | Change 3Q15 vs. | |||||||||||||||||||
| 3Q15 | 2Q15 | 3Q14 | 2Q15 | 3Q14 | ||||||||||||||||
| Shares outstanding at beginning of period |
843,608 | 850,920 | 876,823 | (.9 | )% | (3.8 | )% | |||||||||||||
| Common shares repurchased |
(8,386 | ) | (8,794 | ) | (8,830 | ) | (4.6 | ) | (5.0 | ) | ||||||||||
| Shares reissued (returned) under employee benefit plans |
63 | 1,482 | 484 | (95.7 | ) | (87.0 | ) | |||||||||||||
|
|
|
|
|
|
|
|
|
|
|
|||||||||||
| Shares outstanding at end of period |
835,285 | 843,608 | 868,477 | (1.0 | )% | (3.8 | )% | |||||||||||||
|
|
|
|
|
|
|
|||||||||||||||
As previously reported, Key’s 2015 capital plan includes common share repurchases of up to $725 million, which are expected to be executed through the second quarter of 2016. During the third quarter of 2015, Key completed $123 million of common share repurchases, including repurchases to offset issuances of common shares under employee compensation plans.
LINE OF BUSINESS RESULTS
The following table shows the contribution made by each major business segment to Key’s taxable-equivalent revenue from continuing operations and income (loss) from continuing operations attributable to Key for the periods presented. For more detailed financial information pertaining to each business segment, see the tables at the end of this release.
KeyCorp Reports Third Quarter 2015 Profit
October 15, 2015
Page 7
In the third quarter of 2015, Key enhanced the approach used to determine the commercial reserve factors used in estimating the quantitative component of the commercial allowance for loan and lease losses. In addition, Key began utilizing an enhanced framework to quantify commercial allowance for loan and lease loss adjustments resulting from qualitative factors not fully captured within the statistical analysis of expected loss. The impact of these changes was largely neutral to the total allowance for loan and lease losses at September 30, 2015. However, because the quantitative reserve is allocated to the business segments at a loan level, while the qualitative portion is allocated at the portfolio level, the impact of the methodology enhancements on the allowance for each business segment and each portfolio caused the business segment and commercial portfolio reserves to increase or decrease accordingly. While the impact of the increases and decreases on the business segment and commercial portfolio reserves was not significant, the current quarter provision for credit losses within each business segment is not comparable to prior period amounts as a result of these methodology enhancements.
Major Business Segments
| dollars in millions | Change 3Q15 vs. | |||||||||||||||||||
| 3Q15 | 2Q15 | 3Q14 | 2Q15 | 3Q14 | ||||||||||||||||
| Revenue from continuing operations (TE) |
||||||||||||||||||||
| Key Community Bank |
$ | 579 | $ | 560 | $ | 558 | 3.4 | % | 3.8 | % | ||||||||||
| Key Corporate Bank |
454 | 477 | 400 | (4.8 | ) | 13.5 | ||||||||||||||
| Other Segments |
35 | 44 | 44 | (20.5 | ) | (20.5 | ) | |||||||||||||
|
|
|
|
|
|
|
|
|
|
|
|||||||||||
| Total segments |
1,068 | 1,081 | 1,002 | (1.2 | ) | 6.6 | ||||||||||||||
| Reconciling Items |
— | (2 | ) | (4 | ) | N/M | N/M | |||||||||||||
|
|
|
|
|
|
|
|
|
|
|
|||||||||||
| Total |
$ | 1,068 | $ | 1,079 | $ | 998 | (1.0 | )% | 7.0 | % | ||||||||||
|
|
|
|
|
|
|
|||||||||||||||
| Income (loss) from continuing operations attributable to Key |
||||||||||||||||||||
| Key Community Bank |
$ | 71 | $ | 67 | $ | 60 | 6.0 | % | 18.3 | % | ||||||||||
| Key Corporate Bank |
138 | 133 | 134 | 3.8 | 3.0 | |||||||||||||||
| Other Segments |
26 | 31 | 27 | (16.1 | ) | (3.7 | ) | |||||||||||||
|
|
|
|
|
|
|
|
|
|
|
|||||||||||
| Total segments |
235 | 231 | 221 | 1.7 | 6.3 | |||||||||||||||
| Reconciling Items |
(13 | ) | 4 | (18 | ) | N/M | N/M | |||||||||||||
|
|
|
|
|
|
|
|
|
|
|
|||||||||||
| Total |
$ | 222 | $ | 235 | $ | 203 | (5.5 | )% | 9.4 | % | ||||||||||
|
|
|
|
|
|
|
|||||||||||||||
TE = Taxable Equivalent, N/M = Not Meaningful
Key Community Bank
| dollars in millions | Change 3Q15 vs. | |||||||||||||||||||
| 3Q15 | 2Q15 | 3Q14 | 2Q15 | 3Q14 | ||||||||||||||||
| Summary of operations |
||||||||||||||||||||
| Net interest income (TE) |
$ | 379 | $ | 362 | $ | 359 | 4.7 | % | 5.6 | % | ||||||||||
| Noninterest income |
200 | 198 | 199 | 1.0 | .5 | |||||||||||||||
|
|
|
|
|
|
|
|
|
|
|
|||||||||||
| Total revenue (TE) |
579 | 560 | 558 | 3.4 | 3.8 | |||||||||||||||
| Provision for credit losses |
18 | 3 | 21 | 500.0 | (14.3 | ) | ||||||||||||||
| Noninterest expense |
448 | 450 | 441 | (.4 | ) | 1.6 | ||||||||||||||
|
|
|
|
|
|
|
|
|
|
|
|||||||||||
| Income (loss) before income taxes (TE) |
113 | 107 | 96 | 5.6 | 17.7 | |||||||||||||||
| Allocated income taxes (benefit) and TE adjustments |
42 | 40 | 36 | 5.0 | 16.7 | |||||||||||||||
|
|
|
|
|
|
|
|
|
|
|
|||||||||||
| Net income (loss) attributable to Key |
$ | 71 | $ | 67 | $ | 60 | 6.0 | % | 18.3 | % | ||||||||||
|
|
|
|
|
|
|
|||||||||||||||
| Average balances |
||||||||||||||||||||
| Loans and leases |
$ | 31,039 | $ | 30,707 | $ | 30,103 | 1.1 | % | 3.1 | % | ||||||||||
| Total assets |
33,090 | 32,753 | 32,173 | 1.0 | 2.9 | |||||||||||||||
| Deposits |
51,234 | 50,766 | 50,303 | .9 | 1.9 | |||||||||||||||
| Assets under management at period end |
$ | 35,158 | $ | 38,399 | $ | 39,249 | (8.4 | )% | (10.4 | )% | ||||||||||
TE = Taxable Equivalent
KeyCorp Reports Third Quarter 2015 Profit
October 15, 2015
Page 8
Additional Key Community Bank Data
| dollars in millions | Change 3Q15 vs. | |||||||||||||||||||
| 3Q15 | 2Q15 | 3Q14 | 2Q15 | 3Q14 | ||||||||||||||||
| Noninterest income |
|
|||||||||||||||||||
| Trust and investment services income |
$ | 73 | $ | 76 | $ | 73 | (3.9 | )% | — | |||||||||||
| Service charges on deposit accounts |
56 | 52 | 57 | 7.7 | (1.8 | )% | ||||||||||||||
| Cards and payments income |
43 | 43 | 39 | — | 10.3 | |||||||||||||||
| Other noninterest income |
28 | 27 | 30 | 3.7 | (6.7 | ) | ||||||||||||||
|
|
|
|
|
|
|
|
|
|
|
|||||||||||
| Total noninterest income |
$ | 200 | $ | 198 | $ | 199 | 1.0 | % | .5 | % | ||||||||||
|
|
|
|
|
|
|
|||||||||||||||
| Average deposit balances |
||||||||||||||||||||
| NOW and money market deposit accounts |
$ | 28,568 | $ | 28,284 | $ | 27,403 | 1.0 | % | 4.3 | % | ||||||||||
| Savings deposits |
2,362 | 2,385 | 2,419 | (1.0 | ) | (2.4 | ) | |||||||||||||
| Certificates of deposit ($100,000 or more) |
1,560 | 1,547 | 2,072 | .8 | (24.7 | ) | ||||||||||||||
| Other time deposits |
3,061 | 3,132 | 3,406 | (2.3 | ) | (10.1 | ) | |||||||||||||
| Deposits in foreign office |
271 | 299 | 320 | (9.4 | ) | (15.3 | ) | |||||||||||||
| Noninterest-bearing deposits |
15,412 | 15,119 | 14,683 | 1.9 | 5.0 | |||||||||||||||
|
|
|
|
|
|
|
|
|
|
|
|||||||||||
| Total deposits |
$ | 51,234 | $ | 50,766 | $ | 50,303 | .9 | % | 1.9 | % | ||||||||||
|
|
|
|
|
|
|
|||||||||||||||
| Home equity loans |
||||||||||||||||||||
| Average balance |
$ | 10,281 | $ | 10,266 | $ | 10,368 | ||||||||||||||
| Weighted-average loan-to-value ratio (at date of origination) |
71 | % | 71 | % | 71 | % | ||||||||||||||
| Percent first lien positions |
60 | 60 | 59 | |||||||||||||||||
| Other data |
||||||||||||||||||||
| Branches |
972 | 989 | 997 | |||||||||||||||||
| Automated teller machines |
1,259 | 1,280 | 1,290 | |||||||||||||||||
Key Community Bank Summary of Operations
| • | Positive operating leverage from prior year |
| • | Net income increased to $71 million, up 18.3% from prior year |
| • | Commercial, financial and agricultural loan growth of $1 billion, or 8.7% from prior year |
| • | Average deposits up $931 million, or 1.9% from the prior year |
Key Community Bank recorded net income attributable to Key of $71 million for the third quarter of 2015, compared to net income attributable to Key of $60 million for the year-ago quarter.
Taxable-equivalent net interest income increased by $20 million, or 5.6%, from the third quarter of 2014 due to an increase in average loans and leases of 3.1%, including commercial, financial and agricultural loans, which grew by $1 billion, or 8.7%, from the prior year. Average deposits increased 1.9% from one year ago.
Noninterest income remained relatively stable from the year-ago quarter. Core revenue continues to improve, driven by growth in cards and payments income of $4 million, mostly offset by lower service charges on deposit accounts and a decrease in other income.
The provision for credit losses decreased by $3 million, or 14.3%, from the third quarter of 2014, due to the enhancements to the approach utilized to determine the allowance for loan and lease losses discussed above.
Noninterest expense increased by $7 million, or 1.6%, from the year-ago quarter. Personnel expense increased $1 million while nonpersonnel expense increased by $6 million.
KeyCorp Reports Third Quarter 2015 Profit
October 15, 2015
Page 9
Key Corporate Bank
| dollars in millions | Change 3Q15 vs. | |||||||||||||||||||
| 3Q15 | 2Q15 | 3Q14 | 2Q15 | 3Q14 | ||||||||||||||||
| Summary of operations |
|
|||||||||||||||||||
| Net interest income (TE) |
$ | 220 | $ | 227 | $ | 215 | (3.1 | )% | 2.3 | % | ||||||||||
| Noninterest income |
234 | 250 | 185 | (6.4 | ) | 26.5 | ||||||||||||||
|
|
|
|
|
|
|
|
|
|
|
|||||||||||
| Total revenue (TE) |
454 | 477 | 400 | (4.8 | ) | 13.5 | ||||||||||||||
| Provision for credit losses |
30 | 41 | 2 | (26.8 | ) | N/M | ||||||||||||||
| Noninterest expense |
246 | 252 | 213 | (2.4 | ) | 15.5 | ||||||||||||||
|
|
|
|
|
|
|
|
|
|
|
|||||||||||
| Income (loss) before income taxes (TE) |
178 | 184 | 185 | (3.3 | ) | (3.8 | ) | |||||||||||||
| Allocated income taxes and TE adjustments |
42 | 51 | 51 | (17.6 | ) | (17.6 | ) | |||||||||||||
|
|
|
|
|
|
|
|
|
|
|
|||||||||||
| Net income (loss) |
136 | 133 | 134 | 2.3 | 1.5 | |||||||||||||||
| Less: Net income (loss) attributable to noncontrolling interests |
(2 | ) | — | — | N/M | N/M | ||||||||||||||
|
|
|
|
|
|
|
|
|
|
|
|||||||||||
| Net income (loss) attributable to Key |
$ | 138 | $ | 133 | $ | 134 | 3.8 | % | 3.0 | % | ||||||||||
|
|
|
|
|
|
|
|||||||||||||||
| Average balances |
||||||||||||||||||||
| Loans and leases |
$ | 26,425 | $ | 25,298 | $ | 23,215 | 4.5 | % | 13.8 | % | ||||||||||
| Loans held for sale |
918 | 1,234 | 481 | (25.6 | ) | 90.9 | ||||||||||||||
| Total assets |
32,163 | 31,228 | 28,268 | 3.0 | 13.8 | |||||||||||||||
| Deposits |
18,809 | 19,708 | 17,599 | (4.6 | ) | 6.9 | ||||||||||||||
| Assets under management at period end |
— | — | $ | 34 | N/M | N/M | ||||||||||||||
TE = Taxable Equivalent, N/M = Not Meaningful
Additional Key Corporate Bank Data
| dollars in millions | Change 3Q15 vs. | |||||||||||||||||||
| 3Q15 | 2Q15 | 3Q14 | 2Q15 | 3Q14 | ||||||||||||||||
| Noninterest income |
|
|||||||||||||||||||
| Trust and investment services income |
$ | 35 | $ | 35 | $ | 26 | — | 34.6 | % | |||||||||||
| Investment banking and debt placement fees |
108 | 139 | 86 | (22.3 | )% | 25.6 | ||||||||||||||
| Operating lease income and other leasing gains |
16 | 18 | 14 | (11.1 | ) | 14.3 | ||||||||||||||
| Corporate services income |
46 | 33 | 30 | 39.4 | 53.3 | |||||||||||||||
| Service charges on deposit accounts |
11 | 11 | 11 | — | — | |||||||||||||||
| Cards and payments income |
4 | 4 | 3 | — | 33.3 | |||||||||||||||
|
|
|
|
|
|
|
|
|
|
|
|||||||||||
| Payments and services income |
61 | 48 | 44 | 27.1 | 38.6 | |||||||||||||||
| Mortgage servicing fees |
11 | 9 | 9 | 22.2 | 22.2 | |||||||||||||||
| Other noninterest income |
3 | 1 | 6 | 200.0 | (50.0 | ) | ||||||||||||||
|
|
|
|
|
|
|
|
|
|
|
|||||||||||
| Total noninterest income |
$ | 234 | $ | 250 | $ | 185 | (6.4 | )% | 26.5 | % | ||||||||||
|
|
|
|
|
|
|
|||||||||||||||
N/M = Not Meaningful
Key Corporate Bank Summary of Operations
| • | Investment banking and debt placement fees up 25.6% from the prior year |
| • | Revenue up 13.5% from the prior year |
| • | Average loan and lease balances up 13.8% from the prior year |
Key Corporate Bank recorded net income attributable to Key of $138 million for the third quarter of 2015, an increase of $4 million, or 3%, from the same period one year ago.
Taxable-equivalent net interest income increased by $5 million, or 2.3%, compared to the third quarter of 2014. Average earning assets increased $3 billion, or 12.2%, from the year-ago quarter, primarily driven by growth in commercial, financial and agricultural loans. Average deposit balances increased $1.2 billion, or 6.9%, from the year-ago quarter, driven by commercial mortgage servicing deposits and other commercial client inflows.
KeyCorp Reports Third Quarter 2015 Profit
October 15, 2015
Page 10
Noninterest income was up $49 million, or 26.5% from the prior year. Investment banking and debt placement fees increased $22 million, or 25.6%, driven by strength in syndications, debt underwriting, and financial advisory fees. Corporate services income increased $16 million, or 53.3%, due to higher derivatives income and loan commitment fees. Trust and investment services income increased $9 million, or 34.6%, primarily due to the September 2014 acquisition of Pacific Crest Securities.
The provision for credit losses increased $28 million from the same period one year ago, primarily due to the enhancements to the approach utilized to determine the allowance for loan and lease losses discussed above, as well as a 13.8% increase in average loan balances.
Noninterest expense increased by $33 million, or 15.5%, from the third quarter of 2014. This increase was driven primarily by higher personnel expense, from increased performance-based compensation related to a strong capital markets business performance, along with a full quarter impact of the September 2014 acquisition of Pacific Crest Securities.
Other Segments
Other Segments consist of Corporate Treasury, Key’s Principal Investing unit and various exit portfolios. Other Segments generated net income attributable to Key of $26 million for the third quarter of 2015, essentially unchanged compared to net income attributable to Key of $27 million for the same period last year.
*****
KeyCorp was organized more than 160 years ago and is headquartered in Cleveland, Ohio. One of the nation’s largest bank-based financial services companies, Key had assets of approximately $95.4 billion at September 30, 2015.
Key provides deposit, lending, cash management and investment services to individuals and small and mid-sized businesses in 12 states under the name KeyBank National Association. Key also provides a broad range of sophisticated corporate and investment banking products, such as merger and acquisition advice, public and private debt and equity, syndications and derivatives to middle market companies in selected industries throughout the United States under the KeyBanc Capital Markets trade name. For more information, visit https://www.key.com/. KeyBank is Member FDIC.
KeyCorp Reports Third Quarter 2015 Profit
October 15, 2015
Page 11
CONTACTS:
| ANALYSTS Vernon L. Patterson 216.689.0520
Melanie S. Misconish 216.689.4545 |
MEDIA Jack Sparks 720.904.4554 Twitter: @keybank_news |
| INVESTOR RELATIONS: www.key.com/ir |
KEY MEDIA NEWSROOM: www.key.com/newsroom |
This earnings release contains forward-looking statements within the meaning of the Private Securities Litigation Reform Act of 1995. These statements do not relate strictly to historical or current facts. Forward-looking statements usually can be identified by the use of words such as “goal,” “objective,” “plan,” “expect,” “assume,” “anticipate,” “intend,” “project,” “believe,” “estimate,” or other words of similar meaning. Forward-looking statements provide our current expectations or forecasts of future events, circumstances, results, or aspirations. Forward-looking statements, by their nature, are subject to assumptions, risks and uncertainties, many of which are outside of our control. Our actual results may differ materially from those set forth in our forward-looking statements. There is no assurance that any list of risks and uncertainties or risk factors is complete. Factors that could cause Key’s actual results to differ from those described in the forward-looking statements can be found in KeyCorp’s Form 10-K for the year ended December 31, 2014, as well as in KeyCorp’s subsequent SEC filings, all of which have been filed with the Securities and Exchange Commission (the “SEC”) and are available on Key’s website (www.key.com/ir) and on the SEC’s website (www.sec.gov). These factors may include, among others: deterioration of commercial real estate market fundamentals, adverse changes in credit quality trends, declining asset prices, a reversal of the U.S. economic recovery due to financial, political, or other shocks, and the extensive and increasing regulation of the U.S. financial services industry. Any forward-looking statements made by us or on our behalf speak only as of the date they are made and we do not undertake any obligation to update any forward-looking statement to reflect the impact of subsequent events or circumstances.
Notes to Editors:
A live Internet broadcast of KeyCorp’s conference call to discuss quarterly results and currently anticipated earnings trends and to answer analysts’ questions can be accessed through the Investor Relations section at https://www.key.com/ir at 9:00 a.m. ET, on Thursday, October 15, 2015. An audio replay of the call will be available through October 22, 2015.
For up-to-date company information, media contacts, and facts and figures about Key’s lines of business, visit our Media Newsroom at https://www.key.com/newsroom.
*****
KeyCorp Reports Third Quarter 2015 Profit
October 15, 2015
Page 12
KeyCorp
Third Quarter 2015
Financial Supplement
Page
| 13 | Financial Highlights |
| 15 | GAAP to Non-GAAP Reconciliation |
| 18 | Consolidated Balance Sheets |
| 19 | Consolidated Statements of Income |
| 20 | Consolidated Average Balance Sheets, and Net Interest Income and Yields/Rates From Continuing Operations |
| 22 | Noninterest Expense |
| 22 | Personnel Expense |
| 23 | Loan Composition |
| 23 | Loans Held for Sale Composition |
| 23 | Summary of Changes in Loans Held for Sale |
| 24 | Exit Loan Portfolio From Continuing Operations |
| 24 | Asset Quality Statistics From Continuing Operations |
| 25 | Summary of Loan and Lease Loss Experience From Continuing Operations |
| 26 | Summary of Nonperforming Assets and Past Due Loans From Continuing Operations |
| 27 | Summary of Changes in Nonperforming Loans From Continuing Operations |
| 27 | Summary of Changes in Other Real Estate Owned, Net of Allowance, From Continuing Operations |
| 28 | Line of Business Results |
KeyCorp Reports Third Quarter 2015 Profit
October 15, 2015
Page 13
Financial Highlights
(dollars in millions, except per share amounts)
| Three months ended | ||||||||||||
| 9-30-15 | 6-30-15 | 9-30-14 | ||||||||||
| Summary of operations |
||||||||||||
| Net interest income (TE) |
$ | 598 | $ | 591 | $ | 581 | ||||||
| Noninterest income |
470 | 488 | 417 | |||||||||
|
|
|
|
|
|
|
|||||||
| Total revenue (TE) |
1,068 | 1,079 | 998 | |||||||||
| Provision for credit losses |
45 | 41 | 19 | |||||||||
| Noninterest expense |
724 | 711 | 706 | |||||||||
| Income (loss) from continuing operations attributable to Key |
222 | 235 | 203 | |||||||||
| Income (loss) from discontinued operations, net of taxes (a) |
(3 | ) | 3 | (17 | ) | |||||||
| Net income (loss) attributable to Key |
219 | 238 | 186 | |||||||||
| Income (loss) from continuing operations attributable to Key common shareholders |
$ | 216 | $ | 230 | $ | 197 | ||||||
| Income (loss) from discontinued operations, net of taxes (a) |
(3 | ) | 3 | (17 | ) | |||||||
| Net income (loss) attributable to Key common shareholders |
213 | 233 | 180 | |||||||||
| Per common share |
||||||||||||
| Income (loss) from continuing operations attributable to Key common shareholders |
$ | .26 | $ | .27 | $ | .23 | ||||||
| Income (loss) from discontinued operations, net of taxes (a) |
— | — | (.02 | ) | ||||||||
| Net income (loss) attributable to Key common shareholders (b) |
.26 | .28 | .21 | |||||||||
| Income (loss) from continuing operations attributable to Key common shareholders — assuming dilution |
.26 | .27 | .23 | |||||||||
| Income (loss) from discontinued operations, net of taxes — assuming dilution (a) |
— | — | (.02 | ) | ||||||||
| Net income (loss) attributable to Key common shareholders — assuming dilution (b) |
.25 | .27 | .21 | |||||||||
| Cash dividends paid |
.075 | .075 | .065 | |||||||||
| Book value at period end |
12.47 | 12.21 | 11.74 | |||||||||
| Tangible book value at period end |
11.17 | 10.92 | 10.47 | |||||||||
| Market price at period end |
13.01 | 15.02 | 13.33 | |||||||||
| Performance ratios |
||||||||||||
| From continuing operations: |
||||||||||||
| Return on average total assets |
.95 | % | 1.03 | % | .92 | % | ||||||
| Return on average common equity |
8.30 | 8.96 | 7.68 | |||||||||
| Return on average tangible common equity (c) |
9.27 | 10.01 | 8.55 | |||||||||
| Net interest margin (TE) |
2.87 | 2.88 | 2.96 | |||||||||
| Cash efficiency ratio (c) |
66.9 | 65.1 | 69.7 | |||||||||
| From consolidated operations: |
|
|||||||||||
| Return on average total assets |
.92 | % | 1.02 | % | .81 | % | ||||||
| Return on average common equity |
8.19 | 9.07 | 7.01 | |||||||||
| Return on average tangible common equity (c) |
9.14 | 10.14 | 7.81 | |||||||||
| Net interest margin (TE) |
2.84 | 2.85 | 2.94 | |||||||||
| Loan to deposit (d) |
89.3 | 87.3 | 87.4 | |||||||||
| Capital ratios at period end |
||||||||||||
| Key shareholders’ equity to assets |
11.22 | % | 11.19 | % | 11.68 | % | ||||||
| Key common shareholders’ equity to assets |
10.91 | 10.89 | 11.36 | |||||||||
| Tangible common equity to tangible assets (c) |
9.90 | 9.86 | 10.26 | |||||||||
| Common Equity Tier 1 (c), (e) |
10.51 | 10.71 | N/A | |||||||||
| Tier 1 common equity (c) |
N/A | N/A | 11.26 | |||||||||
| Tier 1 risk-based capital (e) |
10.90 | 11.11 | 12.01 | |||||||||
| Total risk-based capital (e) |
12.51 | 12.66 | 14.10 | |||||||||
| Leverage (e) |
10.67 | 10.74 | 11.15 | |||||||||
| Asset quality — from continuing operations |
||||||||||||
| Net loan charge-offs |
$ | 41 | $ | 36 | $ | 31 | ||||||
| Net loan charge-offs to average loans |
.27 | % | .25 | % | .22 | % | ||||||
| Allowance for loan and lease losses |
$ | 790 | $ | 796 | $ | 804 | ||||||
| Allowance for credit losses |
844 | 841 | 839 | |||||||||
| Allowance for loan and lease losses to period-end loans |
1.31 | % | 1.37 | % | 1.43 | % | ||||||
| Allowance for credit losses to period-end loans |
1.40 | 1.44 | 1.49 | |||||||||
| Allowance for loan and lease losses to nonperforming loans |
197.5 | 190.0 | 200.5 | |||||||||
| Allowance for credit losses to nonperforming loans |
211.0 | 200.7 | 209.2 | |||||||||
| Nonperforming loans at period end (f) |
$ | 400 | $ | 419 | $ | 401 | ||||||
| Nonperforming assets at period end |
417 | 440 | 418 | |||||||||
| Nonperforming loans to period-end portfolio loans |
.67 | % | .72 | % | .71 | % | ||||||
| Nonperforming assets to period-end portfolio loans plus OREO and other nonperforming assets |
.69 | .75 | .74 | |||||||||
| Trust and brokerage assets |
||||||||||||
| Assets under management |
$ | 35,158 | $ | 38,399 | $ | 39,283 | ||||||
| Nonmanaged and brokerage assets |
46,796 | 48,789 | 48,273 | |||||||||
| Other data |
||||||||||||
| Average full-time equivalent employees |
13,555 | 13,455 | 13,905 | |||||||||
| Branches |
972 | 989 | 997 | |||||||||
| Taxable-equivalent adjustment |
$ | 7 | $ | 7 | $ | 6 | ||||||
KeyCorp Reports Third Quarter 2015 Profit
October 15, 2015
Page 14
Financial Highlights (continued)
(dollars in millions, except per share amounts)
| Nine months ended | ||||||||
| 9-30-15 | 9-30-14 | |||||||
| Summary of operations |
||||||||
| Net interest income (TE) |
$ | 1,766 | $ | 1,729 | ||||
| Noninterest income |
1,395 | 1,307 | ||||||
|
|
|
|
|
|||||
| Total revenue (TE) |
3,161 | 3,036 | ||||||
| Provision for credit losses |
121 | 35 | ||||||
| Noninterest expense |
2,104 | 2,057 | ||||||
| Income (loss) from continuing operations attributable to Key |
685 | 688 | ||||||
| Income (loss) from discontinued operations, net of taxes (a) |
5 | (41 | ) | |||||
| Net income (loss) attributable to Key |
690 | 647 | ||||||
| Income (loss) from continuing operations attributable to Key common shareholders |
$ | 668 | $ | 671 | ||||
| Income (loss) from discontinued operations, net of taxes (a) |
5 | (41 | ) | |||||
| Net income (loss) attributable to Key common shareholders |
673 | 630 | ||||||
| Per common share |
||||||||
| Income (loss) from continuing operations attributable to Key common shareholders |
$ | .79 | $ | .77 | ||||
| Income (loss) from discontinued operations, net of taxes (a) |
.01 | (.05 | ) | |||||
| Net income (loss) attributable to Key common shareholders (b) |
.80 | .72 | ||||||
| Income (loss) from continuing operations attributable to Key common shareholders — assuming dilution |
.78 | .76 | ||||||
| Income (loss) from discontinued operations, net of taxes — assuming dilution (a) |
.01 | (.05 | ) | |||||
| Net income (loss) attributable to Key common shareholders — assuming dilution (b) |
.79 | .71 | ||||||
| Cash dividends paid |
.215 | .185 | ||||||
| Performance ratios |
||||||||
| From continuing operations: |
||||||||
| Return on average total assets |
1.00 | % | 1.06 | % | ||||
| Return on average common equity |
8.67 | 8.84 | ||||||
| Return on average tangible common equity (c) |
9.69 | 9.83 | ||||||
| Net interest margin (TE) |
2.88 | 2.98 | ||||||
| Cash efficiency ratio (c) |
65.7 | 66.7 | ||||||
| From consolidated operations: |
||||||||
| Return on average total assets |
.99 | % | .95 | % | ||||
| Return on average common equity |
8.74 | 8.30 | ||||||
| Return on average tangible common equity (c) |
9.76 | 9.23 | ||||||
| Net interest margin (TE) |
2.85 | 2.94 | ||||||
| Asset quality — from continuing operations |
||||||||
| Net loan charge-offs |
$ | 105 | $ | 81 | ||||
| Net loan charge-offs to average total loans |
.24 | % | .20 | % | ||||
| Other data |
||||||||
| Average full-time equivalent employees |
13,525 | 13,942 | ||||||
| Taxable-equivalent adjustment |
$ | 20 | $ | 18 | ||||
| (a) | In April 2009, management decided to wind down the operations of Austin Capital Management, Ltd., a subsidiary that specialized in managing hedge fund investments for institutional customers. In September 2009, management decided to discontinue the education lending business conducted through Key Education Resources, the education payment and financing unit of KeyBank National Association. In February 2013, Key decided to sell its investment subsidiary, Victory Capital Management, and its broker-dealer affiliate, Victory Capital Advisors, to a private equity fund. As a result of these decisions, Key has accounted for these businesses as discontinued operations. |
| (b) | Earnings per share may not foot due to rounding. |
| (c) | The following table entitled “GAAP to Non-GAAP Reconciliations” presents the computations of certain financial measures related to “tangible common equity,” “Common Equity Tier 1” (compliance date of January 1, 2015, under the Regulatory Capital Rules) “Tier 1 common equity” (prior to January 1, 2015), and “cash efficiency.” The table reconciles the GAAP performance measures to the corresponding non-GAAP measures, which provides a basis for period-to-period comparisons. For further information on the Regulatory Capital Rules, see the “Capital” section of this release. |
| (d) | Represents period-end consolidated total loans and loans held for sale (excluding education loans in the securitization trusts for periods prior to September 30, 2014) divided by period-end consolidated total deposits (excluding deposits in foreign office). |
| (e) | 9-30-15 ratio is estimated. |
| (f) | Loan balances exclude $12 million, $12 million, and $14 million of purchased credit impaired loans at September 30, 2015, June 30, 2015, and September 30, 2014, respectively. |
TE = Taxable Equivalent, GAAP = U.S. generally accepted accounting principles
KeyCorp Reports Third Quarter 2015 Profit
October 15, 2015
Page 15
GAAP to Non-GAAP Reconciliations
(dollars in millions)
The table below presents certain non-GAAP financial measures related to “tangible common equity,” “return on tangible common equity,” “Common Equity Tier 1,” “Tier 1 common equity,” “pre-provision net revenue,” and “cash efficiency ratio.”
The tangible common equity ratio and the return on tangible common equity ratio have been a focus for some investors, and management believes these ratios may assist investors in analyzing Key’s capital position without regard to the effects of intangible assets and preferred stock. Traditionally, the banking regulators have assessed bank and bank holding company capital adequacy based on both the amount and the composition of capital, the calculation of which is prescribed in federal banking regulations. In October 2013, the federal banking regulators published the final Basel III capital framework for U.S. banking organizations (the “Regulatory Capital Rules”). The Regulatory Capital Rules require higher and better-quality capital and introduces a new capital measure, “Common Equity Tier 1,” a non-GAAP financial measure. The mandatory compliance date for Key as a “standardized approach” banking organization began on January 1, 2015, subject to transitional provisions extending to January 1, 2019. Prior to January 1, 2015, the Federal Reserve focused its assessment of capital adequacy on a component of Tier 1 risk-based capital known as Tier 1 common equity, also a non-GAAP financial measure.
Common Equity Tier 1 is not formally defined by GAAP and is considered to be a non-GAAP financial measure. Since analysts and banking regulators may assess Key’s capital adequacy using tangible common equity and Common Equity Tier 1, management believes it is useful to enable investors to assess Key’s capital adequacy on these same bases. The table also reconciles the GAAP performance measures to the corresponding non-GAAP measures.
The table also shows the computation for pre-provision net revenue, which is not formally defined by GAAP. Management believes that eliminating the effects of the provision for loan and lease losses makes it easier to analyze the results by presenting them on a more comparable basis.
The cash efficiency ratio is a ratio of two non-GAAP performance measures. As such, there is no directly comparable GAAP performance measure. The cash efficiency ratio performance measure removes the impact of Key’s intangible asset amortization from the calculation. Management believes this ratio provides greater consistency and comparability between Key’s results and those of its peer banks. Additionally, this ratio is used by analysts and investors as they develop earnings forecasts and peer bank analysis.
Non-GAAP financial measures have inherent limitations, are not required to be uniformly applied, and are not audited. Although these non-GAAP financial measures are frequently used by investors to evaluate a company, they have limitations as analytical tools, and should not be considered in isolation, or as a substitute for analyses of results as reported under GAAP.
| Three months ended | ||||||||||||
| 9-30-15 | 6-30-15 | 9-30-14 | ||||||||||
| Tangible common equity to tangible assets at period end |
|
|||||||||||
| Key shareholders’ equity (GAAP) |
$ | 10,705 | $ | 10,590 | $ | 10,486 | ||||||
| Less: Intangible assets (a) |
1,084 | 1,085 | 1,105 | |||||||||
| Preferred Stock, Series A (b) |
281 | 281 | 282 | |||||||||
|
|
|
|
|
|
|
|||||||
| Tangible common equity (non-GAAP) |
$ | 9,340 | $ | 9,224 | $ | 9,099 | ||||||
|
|
|
|
|
|
|
|||||||
| Total assets (GAAP) |
$ | 95,422 | $ | 94,606 | $ | 89,784 | ||||||
| Less: Intangible assets (a) |
1,084 | 1,085 | 1,105 | |||||||||
|
|
|
|
|
|
|
|||||||
| Tangible assets (non-GAAP) |
$ | 94,338 | $ | 93,521 | $ | 88,679 | ||||||
|
|
|
|
|
|
|
|||||||
| Tangible common equity to tangible assets ratio (non-GAAP) |
9.90 | % | 9.86 | % | 10.26 | % | ||||||
| Common Equity Tier 1 at period end |
||||||||||||
| Key shareholders’ equity (GAAP) |
$ | 10,705 | $ | 10,590 | — | |||||||
| Less: Preferred Stock, Series A (b) |
281 | 281 | — | |||||||||
|
|
|
|
|
|
|
|||||||
| Common Equity Tier 1 capital before adjustments and deductions |
10,424 | 10,309 | — | |||||||||
| Less: Goodwill, net of deferred taxes |
1,037 | 1,034 | — | |||||||||
| Intangible assets, net of deferred taxes |
30 | 33 | — | |||||||||
| Deferred tax assets |
1 | 1 | — | |||||||||
| Net unrealized gains (losses) on
available-for-sale |
55 | — | — | |||||||||
| Accumulated gains (losses) on cash flow hedges, net
of |
20 | (20 | ) | — | ||||||||
| Amounts in accumulated other comprehensive
income |
(386 | ) | (361 | ) | — | |||||||
|
|
|
|
|
|
|
|||||||
| Total Common Equity Tier 1 capital (c) |
$ | 9,667 | $ | 9,622 | — | |||||||
|
|
|
|
|
|
|
|||||||
| Net risk-weighted assets (regulatory) (c) |
$ | 91,998 | $ | 89,851 | — | |||||||
| Common Equity Tier 1 ratio (non-GAAP) (c) |
10.51 | % | 10.71 | % | — | |||||||
| Tier 1 common equity at period end |
||||||||||||
| Key shareholders’ equity (GAAP) |
— | — | $ | 10,486 | ||||||||
| Qualifying capital securities |
— | — | 340 | |||||||||
| Less: Goodwill |
— | — | 1,051 | |||||||||
| Accumulated other comprehensive income (loss) (d) |
— | — | (366 | ) | ||||||||
| Other assets (e) |
— | — | 110 | |||||||||
|
|
|
|
|
|
|
|||||||
| Total Tier 1 capital (regulatory) |
— | — | 10,031 | |||||||||
| Less: Qualifying capital securities |
— | — | 340 | |||||||||
| Preferred Stock, Series A (b) |
— | — | 282 | |||||||||
|
|
|
|
|
|
|
|||||||
| Total Tier 1 common equity (non-GAAP) |
— | — | $ | 9,409 | ||||||||
|
|
|
|
|
|
|
|||||||
| Net risk-weighted assets (regulatory) |
— | — | $ | 83,547 | ||||||||
| Tier 1 common equity ratio (non-GAAP) |
— | — | 11.26 | % | ||||||||
KeyCorp Reports Third Quarter 2015 Profit
October 15, 2015
Page 16
GAAP to Non-GAAP Reconciliations (continued)
(dollars in millions)
| Three months ended | ||||||||||||
| 9-30-15 | 6-30-15 | 9-30-14 | ||||||||||
| Pre-provision net revenue |
|
|||||||||||
| Net interest income (GAAP) |
$ | 591 | $ | 584 | $ | 575 | ||||||
| Plus: Taxable-equivalent adjustment |
7 | 7 | 6 | |||||||||
| Noninterest income (GAAP) |
470 | 488 | 417 | |||||||||
| Less: Noninterest expense (GAAP) |
724 | 711 | 706 | |||||||||
|
|
|
|
|
|
|
|||||||
| Pre-provision net revenue from continuing operations (non-GAAP) |
$ | 344 | $ | 368 | $ | 292 | ||||||
|
|
|
|
|
|
|
|||||||
| Average tangible common equity |
||||||||||||
| Average Key shareholders’ equity (GAAP) |
$ | 10,614 | $ | 10,590 | $ | 10,473 | ||||||
| Less: Intangible assets (average) (f) |
1,083 | 1,086 | 1,037 | |||||||||
| Preferred Stock, Series A (average) |
290 | 290 | 291 | |||||||||
|
|
|
|
|
|
|
|||||||
| Average tangible common equity (non-GAAP) |
$ | 9,241 | $ | 9,214 | $ | 9,145 | ||||||
|
|
|
|
|
|
|
|||||||
| Return on average tangible common equity from continuing operations |
||||||||||||
| Net income (loss) from continuing operations attributable to Key common shareholders (GAAP) |
$ | 216 | $ | 230 | $ | 197 | ||||||
| Average tangible common equity (non-GAAP) |
9,241 | 9,214 | 9,145 | |||||||||
| Return on average tangible common equity from continuing operations (non-GAAP) |
9.27 | % | 10.01 | % | 8.55 | % | ||||||
| Return on average tangible common equity consolidated |
||||||||||||
| Net income (loss) attributable to Key common shareholders (GAAP) |
$ | 213 | $ | 233 | $ | 180 | ||||||
| Average tangible common equity (non-GAAP) |
9,241 | 9,214 | 9,145 | |||||||||
| Return on average tangible common equity consolidated (non-GAAP) |
9.14 | % | 10.14 | % | 7.81 | % | ||||||
| Cash efficiency ratio |
||||||||||||
| Noninterest expense (GAAP) |
$ | 724 | $ | 711 | $ | 706 | ||||||
| Less: Intangible asset amortization (GAAP) |
9 | 9 | 10 | |||||||||
|
|
|
|
|
|
|
|||||||
| Adjusted noninterest expense (non-GAAP) |
$ | 715 | $ | 702 | $ | 696 | ||||||
|
|
|
|
|
|
|
|||||||
| Net interest income (GAAP) |
$ | 591 | $ | 584 | $ | 575 | ||||||
| Plus: Taxable-equivalent adjustment |
7 | 7 | 6 | |||||||||
| Noninterest income (GAAP) |
470 | 488 | 417 | |||||||||
|
|
|
|
|
|
|
|||||||
| Total taxable-equivalent revenue (non-GAAP) |
$ | 1,068 | $ | 1,079 | $ | 998 | ||||||
|
|
|
|
|
|
|
|||||||
| Cash efficiency ratio (non-GAAP) |
66.9 | % | 65.1 | % | 69.7 | % | ||||||
| Three months ended |
||||||||||||
| 9-30-15 | ||||||||||||
| Common Equity Tier 1 under the Regulatory Capital Rules (“RCR”) (estimates) |
||||||||||||
| Common Equity Tier 1 under current RCR |
$ | 9,667 | ||||||||||
| Adjustments from current RCR to the fully phased-in RCR: |
||||||||||||
| Deferred tax assets and other intangible assets (g) |
(45 | ) | ||||||||||
|
|
|
|||||||||||
| Common Equity Tier 1 anticipated under the fully phased-in RCR (h) |
$ | 9,622 | ||||||||||
|
|
|
|||||||||||
| Net risk-weighted assets under current RCR |
$ | 91,998 | ||||||||||
| Adjustments from current RCR to the fully phased-in RCR: |
||||||||||||
| Mortgage servicing assets (i) |
479 | |||||||||||
| All other assets (j) |
(10 | ) | ||||||||||
|
|
|
|||||||||||
| Total risk-weighted assets anticipated under the fully phased-in RCR (h) |
$ | 92,467 | ||||||||||
|
|
|
|||||||||||
| Common Equity Tier 1 ratio under the fully phased-in RCR (h) |
10.41 | % | ||||||||||
KeyCorp Reports Third Quarter 2015 Profit
October 15, 2015
Page 17
GAAP to Non-GAAP Reconciliations (continued)
(dollars in millions)
| Nine months ended | ||||||||
| 9-30-15 | 9-30-14 | |||||||
| Pre-provision net revenue |
|
|||||||
| Net interest income (GAAP) |
$ | 1,746 | $ | 1,711 | ||||
| Plus: Taxable-equivalent adjustment |
20 | 18 | ||||||
| Noninterest income (GAAP) |
1,395 | 1,307 | ||||||
| Less: Noninterest expense (GAAP) |
2,104 | 2,057 | ||||||
|
|
|
|
|
|||||
| Pre-provision net revenue from continuing operations (non-GAAP) |
$ | 1,057 | $ | 979 | ||||
|
|
|
|
|
|||||
| Average tangible common equity |
||||||||
| Average Key shareholders’ equity (GAAP) |
$ | 10,591 | $ | 10,435 | ||||
| Less: Intangible assets (average) (k) |
1,086 | 1,020 | ||||||
| Preferred Stock, Series A (average) |
290 | 291 | ||||||
|
|
|
|
|
|||||
| Average tangible common equity (non-GAAP) |
$ | 9,215 | $ | 9,124 | ||||
|
|
|
|
|
|||||
| Return on average tangible common equity from continuing operations |
||||||||
| Net income (loss) from continuing operations attributable to Key common shareholders (GAAP) |
$ | 668 | $ | 671 | ||||
| Average tangible common equity (non-GAAP) |
9,215 | 9,124 | ||||||
| Return on average tangible common equity from continuing operations (non-GAAP) |
9.69 | % | 9.83 | % | ||||
| Return on average tangible common equity consolidated |
||||||||
| Net income (loss) attributable to Key common shareholders (GAAP) |
$ | 673 | $ | 630 | ||||
| Average tangible common equity (non-GAAP) |
9,215 | 9,124 | ||||||
| Return on average tangible common equity consolidated (non-GAAP) |
9.76 | % | 9.23 | % | ||||
| Cash efficiency ratio |
||||||||
| Noninterest expense (GAAP) |
$ | 2,104 | $ | 2,057 | ||||
| Less: Intangible asset amortization (GAAP) |
27 | 29 | ||||||
|
|
|
|
|
|||||
| Adjusted noninterest expense (non-GAAP) |
$ | 2,077 | $ | 2,028 | ||||
|
|
|
|
|
|||||
| Net interest income (GAAP) |
$ | 1,746 | $ | 1,711 | ||||
| Plus: Taxable-equivalent adjustment |
20 | 18 | ||||||
| Noninterest income (GAAP) |
1,395 | 1,307 | ||||||
|
|
|
|
|
|||||
| Total taxable-equivalent revenue (non-GAAP) |
$ | 3,161 | $ | 3,036 | ||||
|
|
|
|
|
|||||
| Cash efficiency ratio (non-GAAP) |
65.7 | % | 66.8 | % | ||||
| (a) | For the three months ended September 30, 2015, June 30, 2015, and September 30, 2014, intangible assets exclude $50 million, $55 million, and $72 million, respectively, of period-end purchased credit card receivables. |
| (b) | Net of capital surplus. |
| (c) | 9-30-15 amount is estimated. |
| (d) | Includes net unrealized gains or losses on securities available for sale (except for net unrealized losses on marketable equity securities), net gains or losses on cash flow hedges, and amounts resulting from the application of the applicable accounting guidance for defined benefit and other postretirement plans. |
| (e) | Other assets deducted from Tier 1 capital and net risk-weighted assets consist of disallowed intangible assets (excluding goodwill) and deductible portions of nonfinancial equity investments. There were no disallowed deferred tax assets at September 30, 2014. |
| (f) | For the three months ended September 30, 2015, June 30, 2015, and September 30, 2014, average intangible assets exclude $52 million, $58 million, and $76 million, respectively, of average purchased credit card receivables. |
| (g) | Includes the deferred tax asset subject to future taxable income for realization, primarily tax credit carryforwards, as well as intangible assets (other than goodwill and mortgage servicing assets) subject to the transition provisions of the final rule. |
| (h) | The anticipated amount of regulatory capital and risk-weighted assets is based upon the federal banking agencies’ Regulatory Capital Rules (as fully phased-in on January 1, 2019); Key is subject to the Regulatory Capital Rules under the “standardized approach.” |
| (i) | Item is included in the 10%/15% exceptions bucket calculation and is risk-weighted at 250%. |
| (j) | Under the fully implemented rule, certain deferred tax assets and intangible assets subject to the transition provision are no longer required to be risk-weighted because they are deducted directly from capital. |
| (k) | For the nine months ended September 30, 2015, and September 30, 2014, average intangible assets exclude $58 million and $82 million, respectively, of average purchased credit card receivables. |
GAAP = U.S. generally accepted accounting principles
KeyCorp Reports Third Quarter 2015 Profit
October 15, 2015
Page 18
Consolidated Balance Sheets
(dollars in millions)
| 9-30-15 | 6-30-15 | 9-30-14 | ||||||||||
| Assets |
||||||||||||
| Loans |
$ | 60,085 | $ | 58,264 | $ | 56,155 | ||||||
| Loans held for sale |
916 | 835 | 784 | |||||||||
| Securities available for sale |
14,376 | 14,244 | 12,245 | |||||||||
| Held-to-maturity securities |
4,936 | 5,022 | 4,997 | |||||||||
| Trading account assets |
811 | 674 | 965 | |||||||||
| Short-term investments |
1,964 | 3,222 | 2,342 | |||||||||
| Other investments |
691 | 703 | 822 | |||||||||
|
|
|
|
|
|
|
|||||||
| Total earning assets |
83,779 | 82,964 | 78,310 | |||||||||
| Allowance for loan and lease losses |
(790 | ) | (796 | ) | (804 | ) | ||||||
| Cash and due from banks |
470 | 693 | 651 | |||||||||
| Premises and equipment |
771 | 788 | 832 | |||||||||
| Operating lease assets |
315 | 296 | 304 | |||||||||
| Goodwill |
1,060 | 1,057 | 1,051 | |||||||||
| Other intangible assets |
74 | 83 | 126 | |||||||||
| Corporate-owned life insurance |
3,516 | 3,502 | 3,456 | |||||||||
| Derivative assets |
793 | 536 | 413 | |||||||||
| Accrued income and other assets |
3,348 | 3,314 | 3,024 | |||||||||
| Discontinued assets |
2,086 | 2,169 | 2,421 | |||||||||
|
|
|
|
|
|
|
|||||||
| Total assets |
$ | 95,422 | $ | 94,606 | $ | 89,784 | ||||||
|
|
|
|
|
|
|
|||||||
| Liabilities |
||||||||||||
| Deposits in domestic offices: |
||||||||||||
| NOW and money market deposit accounts |
$ | 37,301 | $ | 36,024 | $ | 33,941 | ||||||
| Savings deposits |
2,338 | 2,370 | 2,390 | |||||||||
| Certificates of deposit ($100,000 or more) |
2,001 | 2,032 | 2,533 | |||||||||
| Other time deposits |
3,020 | 3,105 | 3,338 | |||||||||
|
|
|
|
|
|
|
|||||||
| Total interest-bearing deposits |
44,660 | 43,531 | 42,202 | |||||||||
| Noninterest-bearing deposits |
25,985 | 26,640 | 25,697 | |||||||||
| Deposits in foreign office — interest-bearing |
428 | 498 | 557 | |||||||||
|
|
|
|
|
|
|
|||||||
| Total deposits |
71,073 | 70,669 | 68,456 | |||||||||
| Federal funds purchased and securities sold under repurchase agreements |
407 | 444 | 657 | |||||||||
| Bank notes and other short-term borrowings |
677 | 528 | 996 | |||||||||
| Derivative liabilities |
676 | 560 | 384 | |||||||||
| Accrued expense and other liabilities |
1,562 | 1,537 | 1,613 | |||||||||
| Long-term debt |
10,310 | 10,267 | 7,172 | |||||||||
| Discontinued liabilities |
— | — | 3 | |||||||||
|
|
|
|
|
|
|
|||||||
| Total liabilities |
84,705 | 84,005 | 79,281 | |||||||||
| Equity |
||||||||||||
| Preferred stock, Series A |
290 | 290 | 291 | |||||||||
| Common shares |
1,017 | 1,017 | 1,017 | |||||||||
| Capital surplus |
3,914 | 3,898 | 3,984 | |||||||||
| Retained earnings |
8,764 | 8,614 | 8,082 | |||||||||
| Treasury stock, at cost |
(3,008 | ) | (2,884 | ) | (2,563 | ) | ||||||
| Accumulated other comprehensive income (loss) |
(272 | ) | (345 | ) | (325 | ) | ||||||
|
|
|
|
|
|
|
|||||||
| Key shareholders’ equity |
10,705 | 10,590 | 10,486 | |||||||||
| Noncontrolling interests |
12 | 11 | 17 | |||||||||
|
|
|
|
|
|
|
|||||||
| Total equity |
10,717 | 10,601 | 10,503 | |||||||||
|
|
|
|
|
|
|
|||||||
| Total liabilities and equity |
$ | 95,422 | $ | 94,606 | $ | 89,784 | ||||||
|
|
|
|
|
|
|
|||||||
| Common shares outstanding (000) |
835,285 | 843,608 | 868,477 | |||||||||
KeyCorp Reports Third Quarter 2015 Profit
October 15, 2015
Page 19
Consolidated Statements of Income
(dollars in millions, except per share amounts)
| Three months ended | Nine months ended | |||||||||||||||||||
| 9-30-15 | 6-30-15 | 9-30-14 | 9-30-15 | 9-30-14 | ||||||||||||||||
| Interest income |
|
|||||||||||||||||||
| Loans |
$ | 542 | $ | 532 | $ | 531 | $ | 1,597 | $ | 1,576 | ||||||||||
| Loans held for sale |
10 | 12 | 4 | 29 | 13 | |||||||||||||||
| Securities available for sale |
75 | 72 | 67 | 217 | 210 | |||||||||||||||
| Held-to-maturity securities |
24 | 24 | 25 | 72 | 70 | |||||||||||||||
| Trading account assets |
5 | 5 | 6 | 15 | 19 | |||||||||||||||
| Short-term investments |
1 | 2 | 2 | 5 | 4 | |||||||||||||||
| Other investments |
4 | 5 | 4 | 14 | 16 | |||||||||||||||
|
|
|
|
|
|
|
|
|
|
|
|||||||||||
| Total interest income |
661 | 652 | 639 | 1,949 | 1,908 | |||||||||||||||
| Interest expense |
||||||||||||||||||||
| Deposits |
27 | 26 | 28 | 79 | 91 | |||||||||||||||
| Federal funds purchased and securities sold under repurchase agreements |
— | — | 1 | — | 2 | |||||||||||||||
| Bank notes and other short-term borrowings |
2 | 2 | 2 | 6 | 6 | |||||||||||||||
| Long-term debt |
41 | 40 | 33 | 118 | 98 | |||||||||||||||
|
|
|
|
|
|
|
|
|
|
|
|||||||||||
| Total interest expense |
70 | 68 | 64 | 203 | 197 | |||||||||||||||
|
|
|
|
|
|
|
|
|
|
|
|||||||||||
| Net interest income |
591 | 584 | 575 | 1,746 | 1,711 | |||||||||||||||
| Provision for credit losses |
45 | 41 | 19 | 121 | 35 | |||||||||||||||
|
|
|
|
|
|
|
|
|
|
|
|||||||||||
| Net interest income after provision for credit losses |
546 | 543 | 556 | 1,625 | 1,676 | |||||||||||||||
| Noninterest income |
||||||||||||||||||||
| Trust and investment services income |
108 | 111 | 99 | 328 | 291 | |||||||||||||||
| Investment banking and debt placement fees |
109 | 141 | 88 | 318 | 271 | |||||||||||||||
| Service charges on deposit accounts |
68 | 63 | 68 | 192 | 197 | |||||||||||||||
| Operating lease income and other leasing gains |
15 | 24 | 17 | 58 | 81 | |||||||||||||||
| Corporate services income |
57 | 43 | 42 | 143 | 125 | |||||||||||||||
| Cards and payments income |
47 | 47 | 42 | 136 | 123 | |||||||||||||||
| Corporate-owned life insurance income |
30 | 30 | 26 | 91 | 80 | |||||||||||||||
| Consumer mortgage income |
3 | 4 | 3 | 10 | 7 | |||||||||||||||
| Mortgage servicing fees |
11 | 9 | 9 | 33 | 35 | |||||||||||||||
| Net gains (losses) from principal investing |
11 | 11 | 9 | 51 | 60 | |||||||||||||||
| Other income (a) |
11 | 5 | 14 | 35 | 37 | |||||||||||||||
|
|
|
|
|
|
|
|
|
|
|
|||||||||||
| Total noninterest income |
470 | 488 | 417 | 1,395 | 1,307 | |||||||||||||||
| Noninterest expense |
||||||||||||||||||||
| Personnel |
426 | 408 | 405 | 1,223 | 1,182 | |||||||||||||||
| Net occupancy |
60 | 66 | 66 | 191 | 198 | |||||||||||||||
| Computer processing |
41 | 42 | 39 | 121 | 118 | |||||||||||||||
| Business services and professional fees |
40 | 42 | 36 | 115 | 118 | |||||||||||||||
| Equipment |
22 | 22 | 25 | 66 | 73 | |||||||||||||||
| Operating lease expense |
11 | 12 | 11 | 34 | 31 | |||||||||||||||
| Marketing |
17 | 15 | 15 | 40 | 33 | |||||||||||||||
| FDIC assessment |
8 | 8 | 9 | 24 | 21 | |||||||||||||||
| Intangible asset amortization |
9 | 9 | 10 | 27 | 29 | |||||||||||||||
| OREO expense, net |
2 | 1 | 1 | 5 | 3 | |||||||||||||||
| Other expense |
88 | 86 | 89 | 258 | 251 | |||||||||||||||
|
|
|
|
|
|
|
|
|
|
|
|||||||||||
| Total noninterest expense |
724 | 711 | 706 | 2,104 | 2,057 | |||||||||||||||
|
|
|
|
|
|
|
|
|
|
|
|||||||||||
| Income (loss) from continuing operations before income taxes |
292 | 320 | 267 | 916 | 926 | |||||||||||||||
| Income taxes |
72 | 84 | 64 | 230 | 232 | |||||||||||||||
|
|
|
|
|
|
|
|
|
|
|
|||||||||||
| Income (loss) from continuing operations |
220 | 236 | 203 | 686 | 694 | |||||||||||||||
| Income (loss) from discontinued operations, net of taxes |
(3 | ) | 3 | (17 | ) | 5 | (41 | ) | ||||||||||||
|
|
|
|
|
|
|
|
|
|
|
|||||||||||
| Net income (loss) |
217 | 239 | 186 | 691 | 653 | |||||||||||||||
| Less: Net income (loss) attributable to noncontrolling interests |
(2 | ) | 1 | — | 1 | 6 | ||||||||||||||
|
|
|
|
|
|
|
|
|
|
|
|||||||||||
| Net income (loss) attributable to Key |
$ | 219 | $ | 238 | $ | 186 | $ | 690 | $ | 647 | ||||||||||
|
|
|
|
|
|
|
|
|
|
|
|||||||||||
| Income (loss) from continuing operations attributable to Key common shareholders |
$ | 216 | $ | 230 | $ | 197 | $ | 668 | $ | 671 | ||||||||||
| Net income (loss) attributable to Key common shareholders |
213 | 233 | 180 | 673 | 630 | |||||||||||||||
| Per common share |
||||||||||||||||||||
| Income (loss) from continuing operations attributable to Key common shareholders |
$ | .26 | $ | .27 | $ | .23 | $ | .79 | $ | .77 | ||||||||||
| Income (loss) from discontinued operations, net of taxes |
— | — | (.02 | ) | .01 | (.05 | ) | |||||||||||||
| Net income (loss) attributable to Key common shareholders (b) |
.26 | .28 | .21 | .80 | .72 | |||||||||||||||
| Per common share — assuming dilution |
||||||||||||||||||||
| Income (loss) from continuing operations attributable to Key common shareholders |
$ | .26 | $ | .27 | $ | .23 | $ | .78 | $ | .76 | ||||||||||
| Income (loss) from discontinued operations, net of taxes |
— | — | (.02 | ) | .01 | (.05 | ) | |||||||||||||
| Net income (loss) attributable to Key common shareholders (b) |
.25 | .27 | .21 | .79 | .71 | |||||||||||||||
| Cash dividends declared per common share |
$ | .075 | $ | .075 | $ | .065 | $ | .215 | $ | .185 | ||||||||||
| Weighted-average common shares outstanding (000) |
831,430 | 839,454 | 867,350 | 839,758 | 875,728 | |||||||||||||||
| Effect of common share options and other stock awards |
7,450 | 6,858 | 6,772 | 7,613 | 6,723 | |||||||||||||||
|
|
|
|
|
|
|
|
|
|
|
|||||||||||
| Weighted-average common shares and potential common shares outstanding (000) (c) |
838,880 | 846,312 | 874,122 | 847,371 | 882,451 | |||||||||||||||
|
|
|
|
|
|
|
|
|
|
|
|||||||||||
| (a) | For each of the three months ended September 30, 2015, June 30, 2015, and September 30, 2014, net securities gains (losses) totaled less than $1 million. For the three months ended September 30, 2015, June 30, 2015, and September 30, 2014, Key did not have any impairment losses related to securities. |
| (b) | Earnings per share may not foot due to rounding. |
| (c) | Assumes conversion of common share options and other stock awards and/or convertible preferred stock, as applicable. |
KeyCorp Reports Third Quarter 2015 Profit
October 15, 2015
Page 20
Consolidated Average Balance Sheets, and Net Interest Income and Yields/Rates From Continuing Operations
(dollars in millions)
| Third Quarter 2015 | Second Quarter 2015 | Third Quarter 2014 | ||||||||||||||||||||||||||||||||||
| Average Balance |
Interest (a) | Yield/ Rate (a) |
Average Balance |
Interest (a) | Yield/ Rate (a) |
Average Balance |
Interest (a) | Yield/ Rate (a) |
||||||||||||||||||||||||||||
| Assets |
||||||||||||||||||||||||||||||||||||
| Loans: (b), (c) |
||||||||||||||||||||||||||||||||||||
| Commercial, financial and agricultural (d) |
$ | 30,374 | $ | 244 | 3.19 | % | $ | 29,017 | $ | 233 | 3.23 | % | $ | 26,456 | $ | 218 | 3.28 | % | ||||||||||||||||||
| Real estate — commercial mortgage |
7,988 | 73 | 3.65 | 7,981 | 74 | 3.70 | 8,142 | 78 | 3.79 | |||||||||||||||||||||||||||
| Real estate — construction |
1,164 | 11 | 3.78 | 1,199 | 11 | 3.60 | 1,030 | 10 | 3.78 | |||||||||||||||||||||||||||
| Commercial lease financing |
3,946 | 35 | 3.57 | 3,981 | 36 | 3.58 | 4,145 | 38 | 3.66 | |||||||||||||||||||||||||||
|
|
|
|
|
|
|
|
|
|
|
|
|
|
|
|
|
|
|
|||||||||||||||||||
| Total commercial loans |
43,472 | 363 | 3.32 | 42,178 | 354 | 3.36 | 39,773 | 344 | 3.44 | |||||||||||||||||||||||||||
| Real estate — residential mortgage |
2,258 | 24 | 4.19 | 2,237 | 23 | 4.22 | 2,204 | 24 | 4.35 | |||||||||||||||||||||||||||
| Home equity: |
||||||||||||||||||||||||||||||||||||
| Key Community Bank |
10,281 | 101 | 3.88 | 10,266 | 99 | 3.89 | 10,368 | 102 | 3.91 | |||||||||||||||||||||||||||
| Other |
229 | 4 | 7.87 | 244 | 5 | 7.86 | 290 | 6 | 7.80 | |||||||||||||||||||||||||||
|
|
|
|
|
|
|
|
|
|
|
|
|
|
|
|
|
|
|
|||||||||||||||||||
| Total home equity loans |
10,510 | 105 | 3.96 | 10,510 | 104 | 3.98 | 10,658 | 108 | 4.01 | |||||||||||||||||||||||||||
| Consumer other — Key Community Bank |
1,597 | 26 | 6.51 | 1,571 | 26 | 6.52 | 1,534 | 26 | 6.87 | |||||||||||||||||||||||||||
| Credit cards |
759 | 21 | 10.74 | 737 | 19 | 10.57 | 716 | 20 | 11.12 | |||||||||||||||||||||||||||
| Consumer other: |
||||||||||||||||||||||||||||||||||||
| Marine |
645 | 10 | 6.38 | 702 | 11 | 6.30 | 856 | 13 | 6.23 | |||||||||||||||||||||||||||
| Other |
40 | 1 | 8.00 | 43 | 1 | 7.77 | 55 | 2 | 7.63 | |||||||||||||||||||||||||||
|
|
|
|
|
|
|
|
|
|
|
|
|
|
|
|
|
|
|
|||||||||||||||||||
| Total consumer other |
685 | 11 | 6.47 | 745 | 12 | 6.38 | 911 | 15 | 6.32 | |||||||||||||||||||||||||||
|
|
|
|
|
|
|
|
|
|
|
|
|
|
|
|
|
|
|
|||||||||||||||||||
| Total consumer loans |
15,809 | 187 | 4.69 | 15,800 | 184 | 4.69 | 16,023 | 193 | 4.78 | |||||||||||||||||||||||||||
|
|
|
|
|
|
|
|
|
|
|
|
|
|
|
|
|
|
|
|||||||||||||||||||
| Total loans |
59,281 | 550 | 3.69 | 57,978 | 538 | 3.72 | 55,796 | 537 | 3.82 | |||||||||||||||||||||||||||
| Loans held for sale |
939 | 10 | 3.96 | 1,263 | 12 | 3.91 | 502 | 4 | 3.87 | |||||||||||||||||||||||||||
| Securities available for sale (b), (e) |
14,247 | 74 | 2.11 | 13,360 | 73 | 2.17 | 11,939 | 67 | 2.25 | |||||||||||||||||||||||||||
| Held-to-maturity securities (b) |
4,923 | 24 | 1.95 | 4,965 | 24 | 1.91 | 5,108 | 25 | 1.90 | |||||||||||||||||||||||||||
| Trading account assets |
699 | 5 | 2.50 | 805 | 5 | 2.55 | 893 | 6 | 2.68 | |||||||||||||||||||||||||||
| Short-term investments |
2,257 | 1 | .26 | 3,228 | 2 | .26 | 3,048 | 2 | .19 | |||||||||||||||||||||||||||
| Other investments (e) |
696 | 4 | 2.52 | 713 | 5 | 2.48 | 847 | 4 | 2.12 | |||||||||||||||||||||||||||
|
|
|
|
|
|
|
|
|
|
|
|
|
|
|
|
|
|
|
|||||||||||||||||||
| Total earning assets |
83,042 | 668 | 3.21 | 82,312 | 659 | 3.21 | 78,133 | 645 | 3.30 | |||||||||||||||||||||||||||
| Allowance for loan and lease losses |
(790 | ) | (793 | ) | (809 | ) | ||||||||||||||||||||||||||||||
| Accrued income and other assets |
10,399 | 10,140 | 9,799 | |||||||||||||||||||||||||||||||||
| Discontinued assets |
2,118 | 2,194 | 4,138 | |||||||||||||||||||||||||||||||||
|
|
|
|
|
|
|
|||||||||||||||||||||||||||||||
| Total assets |
$ | 94,769 | $ | 93,853 | $ | 91,261 | ||||||||||||||||||||||||||||||
|
|
|
|
|
|
|
|||||||||||||||||||||||||||||||
| Liabilities |
||||||||||||||||||||||||||||||||||||
| NOW and money market deposit accounts |
$ | 36,289 | 15 | .16 | $ | 36,122 | 14 | .16 | $ | 33,969 | 12 | .14 | ||||||||||||||||||||||||
| Savings deposits |
2,371 | — | .02 | 2,393 | — | .02 | 2,428 | 1 | .02 | |||||||||||||||||||||||||||
| Certificates of deposit ($100,000 or more) (f) |
1,985 | 6 | 1.27 | 2,010 | 6 | 1.25 | 2,629 | 8 | 1.23 | |||||||||||||||||||||||||||
| Other time deposits |
3,064 | 6 | .70 | 3,136 | 5 | .70 | 3,413 | 7 | .83 | |||||||||||||||||||||||||||
| Deposits in foreign office |
492 | — | .23 | 583 | 1 | .23 | 595 | — | .23 | |||||||||||||||||||||||||||
|
|
|
|
|
|
|
|
|
|
|
|
|
|
|
|
|
|
|
|||||||||||||||||||
| Total interest-bearing deposits |
44,201 | 27 | .24 | 44,244 | 26 | .24 | 43,034 | 28 | .26 | |||||||||||||||||||||||||||
| Federal funds purchased and securities sold under repurchase agreements |
859 | — | .08 | 557 | — | .02 | 1,176 | 1 | .19 | |||||||||||||||||||||||||||
| Bank notes and other short-term borrowings |
567 | 2 | 1.51 | 657 | 2 | 1.39 | 484 | 2 | 1.79 | |||||||||||||||||||||||||||
| Long-term debt (f), (g) |
7,895 | 41 | 2.19 | 6,968 | 40 | 2.30 | 4,868 | 33 | 2.88 | |||||||||||||||||||||||||||
|
|
|
|
|
|
|
|
|
|
|
|
|
|
|
|
|
|
|
|||||||||||||||||||
| Total interest-bearing liabilities |
53,522 | 70 | .53 | 52,426 | 68 | .52 | 49,562 | 64 | .52 | |||||||||||||||||||||||||||
|
|
|
|
|
|
|
|
|
|
|
|
|
|
|
|
|
|
|
|||||||||||||||||||
| Noninterest-bearing deposits |
26,268 | 26,594 | 25,302 | |||||||||||||||||||||||||||||||||
| Accrued expense and other liabilities |
2,236 | 2,039 | 1,768 | |||||||||||||||||||||||||||||||||
| Discontinued liabilities (g) |
2,118 | 2,194 | 4,138 | |||||||||||||||||||||||||||||||||
|
|
|
|
|
|
|
|||||||||||||||||||||||||||||||
| Total liabilities |
84,144 | 83,253 | 80,770 | |||||||||||||||||||||||||||||||||
| Equity |
||||||||||||||||||||||||||||||||||||
| Key shareholders’ equity |
10,614 | 10,590 | 10,473 | |||||||||||||||||||||||||||||||||
| Noncontrolling interests |
11 | 10 | 18 | |||||||||||||||||||||||||||||||||
|
|
|
|
|
|
|
|||||||||||||||||||||||||||||||
| Total equity |
10,625 | 10,600 | 10,491 | |||||||||||||||||||||||||||||||||
|
|
|
|
|
|
|
|||||||||||||||||||||||||||||||
| Total liabilities and equity |
$ | 94,769 | $ | 93,853 | $ | 91,261 | ||||||||||||||||||||||||||||||
|
|
|
|
|
|
|
|||||||||||||||||||||||||||||||
| Interest rate spread (TE) |
2.68 | % | 2.69 | % | 2.78 | % | ||||||||||||||||||||||||||||||
|
|
|
|
|
|
|
|||||||||||||||||||||||||||||||
| Net interest income (TE) and net interest margin (TE) |
598 | 2.87 | % | 591 | 2.88 | % | 581 | 2.96 | % | |||||||||||||||||||||||||||
|
|
|
|
|
|
|
|||||||||||||||||||||||||||||||
| TE adjustment (b) |
7 | 7 | 6 | |||||||||||||||||||||||||||||||||
|
|
|
|
|
|
|
|||||||||||||||||||||||||||||||
| Net interest income, GAAP basis |
$ | 591 | $ | 584 | $ | 575 | ||||||||||||||||||||||||||||||
|
|
|
|
|
|
|
|||||||||||||||||||||||||||||||
| (a) | Results are from continuing operations. Interest excludes the interest associated with the liabilities referred to in (g) below, calculated using a matched funds transfer pricing methodology. |
| (b) | Interest income on tax-exempt securities and loans has been adjusted to a taxable-equivalent basis using the statutory federal income tax rate of 35%. |
| (c) | For purposes of these computations, nonaccrual loans are included in average loan balances. |
| (d) | Commercial, financial and agricultural average balances include $88 million, $88 million, and $92 million of assets from commercial credit cards for the three months ended September 30, 2015, June 30, 2015, and September 30, 2014, respectively. |
| (e) | Yield is calculated on the basis of amortized cost. |
| (f) | Rate calculation excludes basis adjustments related to fair value hedges. |
| (g) | A portion of long-term debt and the related interest expense is allocated to discontinued liabilities as a result of applying Key’s matched funds transfer pricing methodology to discontinued operations. |
TE = Taxable Equivalent, GAAP = U.S. generally accepted accounting principles
KeyCorp Reports Third Quarter 2015 Profit
October 15, 2015
Page 21
Consolidated Average Balance Sheets, and Net Interest Income and Yields/Rates From Continuing Operations
(dollars in millions)
| Nine months ended September 30, 2015 |
Nine months ended September 30, 2014 |
|||||||||||||||||||||||
| Average Balance |
Interest (a) | Yield/ Rate (a) |
Average Balance |
Interest (a) | Yield/ Rate (a) |
|||||||||||||||||||
| Assets |
||||||||||||||||||||||||
| Loans: (b), (c) |
||||||||||||||||||||||||
| Commercial, financial and agricultural (d) |
$ | 29,244 | $ | 700 | 3.20 | % | $ | 26,100 | $ | 643 | 3.29 | % | ||||||||||||
| Real estate — commercial mortgage |
8,021 | 220 | 3.67 | 7,944 | 226 | 3.81 | ||||||||||||||||||
| Real estate — construction |
1,168 | 33 | 3.76 | 1,056 | 33 | 4.13 | ||||||||||||||||||
| Commercial lease financing |
3,998 | 107 | 3.57 | 4,280 | 118 | 3.67 | ||||||||||||||||||
|
|
|
|
|
|
|
|
|
|
|
|
|
|||||||||||||
| Total commercial loans |
42,431 | 1,060 | 3.34 | 39,380 | 1,020 | 3.46 | ||||||||||||||||||
| Real estate — residential mortgage |
2,241 | 71 | 4.22 | 2,193 | 72 | 4.40 | ||||||||||||||||||
| Home equity: |
||||||||||||||||||||||||
| Key Community Bank |
10,287 | 299 | 3.89 | 10,332 | 302 | 3.92 | ||||||||||||||||||
| Other |
244 | 14 | 7.85 | 307 | 18 | 7.79 | ||||||||||||||||||
|
|
|
|
|
|
|
|
|
|
|
|
|
|||||||||||||
| Total home equity loans |
10,531 | 313 | 3.98 | 10,639 | 320 | 4.03 | ||||||||||||||||||
| Consumer other — Key Community Bank |
1,572 | 77 | 6.56 | 1,484 | 77 | 6.96 | ||||||||||||||||||
| Credit cards |
743 | 60 | 10.80 | 706 | 58 | 10.93 | ||||||||||||||||||
| Consumer other: |
||||||||||||||||||||||||
| Marine |
701 | 33 | 6.34 | 926 | 43 | 6.20 | ||||||||||||||||||
| Other |
44 | 3 | 7.68 | 60 | 4 | 7.75 | ||||||||||||||||||
|
|
|
|
|
|
|
|
|
|
|
|
|
|||||||||||||
| Total consumer other |
745 | 36 | 6.42 | 986 | 47 | 6.29 | ||||||||||||||||||
|
|
|
|
|
|
|
|
|
|
|
|
|
|||||||||||||
| Total consumer loans |
15,832 | 557 | 4.71 | 16,008 | 574 | 4.79 | ||||||||||||||||||
|
|
|
|
|
|
|
|
|
|
|
|
|
|||||||||||||
| Total loans |
58,263 | 1,617 | 3.71 | 55,388 | 1,594 | 3.85 | ||||||||||||||||||
| Loans held for sale |
1,000 | 29 | 3.77 | 469 | 13 | 3.79 | ||||||||||||||||||
| Securities available for sale (b), (e) |
13,569 | 217 | 2.15 | 12,229 | 210 | 2.29 | ||||||||||||||||||
| Held-to-maturity securities (b) |
4,945 | 72 | 1.93 | 4,950 | 70 | 1.87 | ||||||||||||||||||
| Trading account assets |
740 | 15 | 2.62 | 953 | 19 | 2.66 | ||||||||||||||||||
| Short-term investments |
2,627 | 5 | .26 | 2,672 | 4 | .18 | ||||||||||||||||||
| Other investments (e) |
717 | 14 | 2.60 | 890 | 16 | 2.45 | ||||||||||||||||||
|
|
|
|
|
|
|
|
|
|
|
|
|
|||||||||||||
| Total earning assets |
81,861 | 1,969 | 3.22 | 77,551 | 1,926 | 3.31 | ||||||||||||||||||
| Allowance for loan and lease losses |
(792 | ) | (825 | ) | ||||||||||||||||||||
| Accrued income and other assets |
10,255 | 9,786 | ||||||||||||||||||||||
| Discontinued assets |
2,194 | 4,323 | ||||||||||||||||||||||
|
|
|
|
|
|||||||||||||||||||||
| Total assets |
$ | 93,518 | $ | 90,835 | ||||||||||||||||||||
|
|
|
|
|
|||||||||||||||||||||
| Liabilities |
||||||||||||||||||||||||
| NOW and money market deposit accounts |
$ | 35,793 | 42 | .15 | $ | 34,105 | 35 | .14 | ||||||||||||||||
| Savings deposits |
2,383 | — | .02 | 2,466 | 1 | .03 | ||||||||||||||||||
| Certificates of deposit ($100,000 or more) (f) |
2,004 | 19 | 1.27 | 2,731 | 28 | 1.38 | ||||||||||||||||||
| Other time deposits |
3,138 | 17 | .71 | 3,558 | 26 | .96 | ||||||||||||||||||
| Deposits in foreign office |
534 | 1 | .23 | 639 | 1 | .23 | ||||||||||||||||||
|
|
|
|
|
|
|
|
|
|
|
|
|
|||||||||||||
| Total interest-bearing deposits |
43,852 | 79 | .24 | 43,499 | 91 | .28 | ||||||||||||||||||
| Federal funds purchased and securities sold under repurchase agreements |
713 | — | .05 | 1,371 | 2 | .18 | ||||||||||||||||||
| Bank notes and other short-term borrowings |
577 | 6 | 1.48 | 538 | 6 | 1.65 | ||||||||||||||||||
| Long-term debt (f), (g) |
7,003 | 118 | 2.32 | 5,169 | 98 | 2.65 | ||||||||||||||||||
|
|
|
|
|
|
|
|
|
|
|
|
|
|||||||||||||
| Total interest-bearing liabilities |
52,145 | 203 | .52 | 50,577 | 197 | .52 | ||||||||||||||||||
|
|
|
|
|
|
|
|
|
|
|
|
|
|||||||||||||
| Noninterest-bearing deposits |
26,377 | 23,760 | ||||||||||||||||||||||
| Accrued expense and other liabilities |
2,200 | 1,724 | ||||||||||||||||||||||
| Discontinued liabilities (g) |
2,194 | 4,323 | ||||||||||||||||||||||
|
|
|
|
|
|||||||||||||||||||||
| Total liabilities |
82,916 | 80,384 | ||||||||||||||||||||||
| Equity |
||||||||||||||||||||||||
| Key shareholders’ equity |
10,591 | 10,435 | ||||||||||||||||||||||
| Noncontrolling interests |
11 | 16 | ||||||||||||||||||||||
|
|
|
|
|
|||||||||||||||||||||
| Total equity |
10,602 | 10,451 | ||||||||||||||||||||||
|
|
|
|
|
|||||||||||||||||||||
| Total liabilities and equity |
$ | 93,518 | $ | 90,835 | ||||||||||||||||||||
|
|
|
|
|
|||||||||||||||||||||
| Interest rate spread (TE) |
2.70 | % | 2.79 | % | ||||||||||||||||||||
|
|
|
|
|
|||||||||||||||||||||
| Net interest income (TE) and net interest margin (TE) |
1,766 | 2.88 | % | 1,729 | 2.98 | % | ||||||||||||||||||
|
|
|
|
|
|
|
|
|
|||||||||||||||||
| TE adjustment (b) |
20 | 18 | ||||||||||||||||||||||
|
|
|
|
|
|||||||||||||||||||||
| Net interest income, GAAP basis |
$ | 1,746 | $ | 1,711 | ||||||||||||||||||||
|
|
|
|
|
|||||||||||||||||||||
| (a) | Results are from continuing operations. Interest excludes the interest associated with the liabilities referred to in (g) below, calculated using a matched funds transfer pricing methodology. |
| (b) | Interest income on tax-exempt securities and loans has been adjusted to a taxable-equivalent basis using the statutory federal income tax rate of 35%. |
| (c) | For purposes of these computations, nonaccrual loans are included in average loan balances. |
| (d) | Commercial, financial and agricultural average balances include $88 million and $94 million of assets from commercial credit cards for the nine months ended September 30, 2015, and September 30, 2014, respectively. |
| (e) | Yield is calculated on the basis of amortized cost. |
| (f) | Rate calculation excludes basis adjustments related to fair value hedges. |
| (g) | A portion of long-term debt and the related interest expense is allocated to discontinued liabilities as a result of applying Key’s matched funds transfer pricing methodology to discontinued operations. |
TE = Taxable Equivalent, GAAP = U.S. generally accepted accounting principles
KeyCorp Reports Third Quarter 2015 Profit
October 15, 2015
Page 22
Noninterest Expense
(dollars in millions)
| Three months ended | Nine months ended | |||||||||||||||||||
| 9-30-15 | 6-30-15 | 9-30-14 | 9-30-15 | 9-30-14 | ||||||||||||||||
| Personnel (a) |
$ | 426 | $ | 408 | $ | 405 | $ | 1,223 | $ | 1,182 | ||||||||||
| Net occupancy |
60 | 66 | 66 | 191 | 198 | |||||||||||||||
| Computer processing |
41 | 42 | 39 | 121 | 118 | |||||||||||||||
| Business services and professional fees |
40 | 42 | 36 | 115 | 118 | |||||||||||||||
| Equipment |
22 | 22 | 25 | 66 | 73 | |||||||||||||||
| Operating lease expense |
11 | 12 | 11 | 34 | 31 | |||||||||||||||
| Marketing |
17 | 15 | 15 | 40 | 33 | |||||||||||||||
| FDIC assessment |
8 | 8 | 9 | 24 | 21 | |||||||||||||||
| Intangible asset amortization |
9 | 9 | 10 | 27 | 29 | |||||||||||||||
| OREO expense, net |
2 | 1 | 1 | 5 | 3 | |||||||||||||||
| Other expense |
88 | 86 | 89 | 258 | 251 | |||||||||||||||
|
|
|
|
|
|
|
|
|
|
|
|||||||||||
| Total noninterest expense |
$ | 724 | $ | 711 | $ | 706 | $ | 2,104 | $ | 2,057 | ||||||||||
|
|
|
|
|
|
|
|
|
|
|
|||||||||||
| Average full-time equivalent employees (b) |
13,555 | 13,455 | 13,905 | 13,525 | 13,942 | |||||||||||||||
| (a) | Additional detail provided in table below. |
| (b) | The number of average full-time equivalent employees has not been adjusted for discontinued operations. |
Personnel Expense
(in millions)
| Three months ended | Nine months ended | |||||||||||||||||||
| 9-30-15 | 6-30-15 | 9-30-14 | 9-30-15 | 9-30-14 | ||||||||||||||||
| Salaries |
$ | 234 | $ | 227 | $ | 227 | $ | 681 | $ | 667 | ||||||||||
| Technology contract labor, net |
13 | 11 | 11 | 33 | 43 | |||||||||||||||
| Incentive and stock-based compensation |
103 | 109 | 89 | 295 | 263 | |||||||||||||||
| Employee benefits |
75 | 56 | 71 | 202 | 187 | |||||||||||||||
| Severance |
1 | 5 | 7 | 12 | 22 | |||||||||||||||
|
|
|
|
|
|
|
|
|
|
|
|||||||||||
| Total personnel expense |
$ | 426 | $ | 408 | $ | 405 | $ | 1,223 | $ | 1,182 | ||||||||||
|
|
|
|
|
|
|
|
|
|
|
|||||||||||
KeyCorp Reports Third Quarter 2015 Profit
October 15, 2015
Page 23
Loan Composition
(dollars in millions)
| Percent change 9-30-15 vs. |
||||||||||||||||||||
| 9-30-15 | 6-30-15 | 9-30-14 | 6-30-15 | 9-30-14 | ||||||||||||||||
| Commercial, financial and agricultural (a) |
$ | 31,095 | $ | 29,285 | $ | 26,683 | 6.2 | % | 16.5 | % | ||||||||||
| Commercial real estate: |
||||||||||||||||||||
| Commercial mortgage |
8,180 | 7,874 | 8,276 | 3.9 | (1.2 | ) | ||||||||||||||
| Construction |
1,070 | 1,254 | 1,036 | (14.7 | ) | 3.3 | ||||||||||||||
|
|
|
|
|
|
|
|
|
|
|
|||||||||||
| Total commercial real estate loans |
9,250 | 9,128 | 9,312 | 1.3 | (.7 | ) | ||||||||||||||
| Commercial lease financing (b) |
3,929 | 4,010 | 4,135 | (2.0 | ) | (5.0 | ) | |||||||||||||
|
|
|
|
|
|
|
|
|
|
|
|||||||||||
| Total commercial loans |
44,274 | 42,423 | 40,130 | 4.4 | 10.3 | |||||||||||||||
| Residential — prime loans: |
||||||||||||||||||||
| Real estate — residential mortgage |
2,267 | 2,252 | 2,213 | .7 | 2.4 | |||||||||||||||
| Home equity: |
||||||||||||||||||||
| Key Community Bank |
10,282 | 10,296 | 10,380 | (.1 | ) | (.9 | ) | |||||||||||||
| Other |
222 | 236 | 283 | (5.9 | ) | (21.6 | ) | |||||||||||||
|
|
|
|
|
|
|
|
|
|
|
|||||||||||
| Total home equity loans |
10,504 | 10,532 | 10,663 | (.3 | ) | (1.5 | ) | |||||||||||||
|
|
|
|
|
|
|
|
|
|
|
|||||||||||
| Total residential — prime loans |
12,771 | 12,784 | 12,876 | (.1 | ) | (.8 | ) | |||||||||||||
| Consumer other — Key Community Bank |
1,612 | 1,595 | 1,546 | 1.1 | 4.3 | |||||||||||||||
| Credit cards |
770 | 753 | 724 | 2.3 | 6.4 | |||||||||||||||
| Consumer other: |
||||||||||||||||||||
| Marine |
620 | 673 | 828 | (7.9 | ) | (25.1 | ) | |||||||||||||
| Other |
38 | 36 | 51 | 5.6 | (25.5 | ) | ||||||||||||||
|
|
|
|
|
|
|
|
|
|
|
|||||||||||
| Total consumer other |
658 | 709 | 879 | (7.2 | ) | (25.1 | ) | |||||||||||||
|
|
|
|
|
|
|
|
|
|
|
|||||||||||
| Total consumer loans |
15,811 | 15,841 | 16,025 | (.2 | ) | (1.3 | ) | |||||||||||||
|
|
|
|
|
|
|
|
|
|
|
|||||||||||
| Total loans (c), (d) |
$ | 60,085 | $ | 58,264 | $ | 56,155 | 3.1 | % | 7.0 | % | ||||||||||
|
|
|
|
|
|
|
|||||||||||||||
Loans Held for Sale Composition
(dollars in millions)
| Percent change 9-30-15 vs. |
||||||||||||||||||||
| 9-30-15 | 6-30-15 | 9-30-14 | 6-30-15 | 9-30-14 | ||||||||||||||||
| Commercial, financial and agricultural |
$ | 74 | $ | 217 | $ | 30 | (65.9 | )% | 146.7 | % | ||||||||||
| Real estate — commercial mortgage |
806 | 576 | 725 | 39.9 | 11.2 | |||||||||||||||
| Commercial lease financing |
10 | 7 | 10 | 42.9 | — | |||||||||||||||
| Real estate — residential mortgage |
26 | 35 | 19 | (25.7 | ) | 36.8 | ||||||||||||||
|
|
|
|
|
|
|
|
|
|
|
|||||||||||
| Total loans held for sale (e) |
$ | 916 | $ | 835 | $ | 784 | 9.7 | % | 16.8 | % | ||||||||||
|
|
|
|
|
|
|
|||||||||||||||
Summary of Changes in Loans Held for Sale
(in millions)
| 3Q15 | 2Q15 | 1Q15 | 4Q14 | 3Q14 | ||||||||||||||||
| Balance at beginning of period |
$ | 835 | $ | 1,649 | $ | 734 | $ | 784 | $ | 435 | ||||||||||
| New originations |
1,673 | 1,650 | 2,130 | 2,465 | 1,593 | |||||||||||||||
| Transfers from (to) held to maturity, net |
24 | 6 | 10 | 2 | — | |||||||||||||||
| Loan sales |
(1,616 | ) | (2,466 | ) | (1,204 | ) | (2,516 | ) | (1,243 | ) | ||||||||||
| Loan draws (payments), net |
— | (4 | ) | (21 | ) | (1 | ) | (1 | ) | |||||||||||
|
|
|
|
|
|
|
|
|
|
|
|||||||||||
| Balance at end of period (e) |
$ | 916 | $ | 835 | $ | 1,649 | $ | 734 | $ | 784 | ||||||||||
|
|
|
|
|
|
|
|
|
|
|
|||||||||||
| (a) | Loan balances include $88 million, $89 million, and $90 million of commercial credit card balances at September 30, 2015, June 30, 2015, and September 30, 2014, respectively. |
| (b) | Commercial lease financing includes receivables held as collateral for a secured borrowing of $162 million, $191 million, and $367 million at September 30, 2015, June 30, 2015, and September 30, 2014, respectively. Principal reductions are based on the cash payments received from these related receivables. |
| (c) | At September 30, 2015, total loans include purchased loans of $119 million, of which $12 million were purchased credit impaired. At June 30, 2015, total loans include purchased loans of $125 million, of which $12 million were purchased credit impaired. At September 30, 2014, total loans include purchased loans of $143 million, of which $14 million were purchased credit impaired. |
| (d) | Total loans exclude loans of $1.9 billion at September 30, 2015, $2 billion at June 30, 2015, and $2.4 billion at September 30, 2014, related to the discontinued operations of the education lending business. |
| (e) | Total loans held for sale exclude loans held for sale of $169 million at September 30, 2015, and $179 million at June 30, 2015, related to the discontinued operations of the education lending business. |
N/M = Not Meaningful
KeyCorp Reports Third Quarter 2015 Profit
October 15, 2015
Page 24
Exit Loan Portfolio From Continuing Operations
(in millions)
| Balance Outstanding |
Change 9-30-15 vs. 6-30-15 |
Net Loan Charge-offs |
Balance on Nonperforming Status |
|||||||||||||||||||||||||
| 9-30-15 | 6-30-15 | 3Q15 (c) | 2Q15 | 9-30-15 | 6-30-15 | |||||||||||||||||||||||
| Residential properties — homebuilder |
$ | 6 | $ | 6 | — | — | — | $ | 5 | $ | 8 | |||||||||||||||||
| Marine and RV floor plan |
1 | 2 | $ | (1 | ) | — | — | — | 1 | |||||||||||||||||||
| Commercial lease financing (a) |
798 | 831 | (33 | ) | $ | (1 | ) | — | — | — | ||||||||||||||||||
|
|
|
|
|
|
|
|
|
|
|
|
|
|
|
|||||||||||||||
| Total commercial loans |
805 | 839 | (34 | ) | (1 | ) | — | 5 | 9 | |||||||||||||||||||
| Home equity — Other |
222 | 236 | (14 | ) | (1 | ) | $ | 1 | 7 | 8 | ||||||||||||||||||
| Marine |
620 | 673 | (53 | ) | 3 | 3 | 6 | 8 | ||||||||||||||||||||
| RV and other consumer |
44 | 47 | (3 | ) | (1 | ) | — | 1 | 1 | |||||||||||||||||||
|
|
|
|
|
|
|
|
|
|
|
|
|
|
|
|||||||||||||||
| Total consumer loans |
886 | 956 | (70 | ) | 1 | 4 | 14 | 17 | ||||||||||||||||||||
|
|
|
|
|
|
|
|
|
|
|
|
|
|
|
|||||||||||||||
| Total exit loans in loan portfolio |
$ | 1,691 | $ | 1,795 | $ | (104 | ) | — | $ | 4 | $ | 19 | $ | 26 | ||||||||||||||
|
|
|
|
|
|
|
|
|
|
|
|
|
|
|
|||||||||||||||
| Discontinued operations — education lending business (not included in exit loans above) (b) |
$ | 1,891 | $ | 1,962 | $ | (71 | ) | $ | 7 | $ | 2 | $ | 8 | $ | 6 | |||||||||||||
| (a) | Includes (1) the business aviation, commercial vehicle, office products, construction, and industrial leases; (2) Canadian lease financing portfolios; (3) European lease financing portfolios; and (4) all remaining balances related to lease in, lease out; sale in, lease out; service contract leases; and qualified technological equipment leases. |
| (b) | Excludes loans held for sale of $169 million at September 30, 2015, and $179 million at June 30, 2015. |
| (c) | Credit amounts indicate recoveries exceeded charge-offs. |
Asset Quality Statistics From Continuing Operations
(dollars in millions)
| 3Q15 | 2Q15 | 1Q15 | 4Q14 | 3Q14 | ||||||||||||||||
| Net loan charge-offs |
$ | 41 | $ | 36 | $ | 28 | $ | 32 | $ | 31 | ||||||||||
| Net loan charge-offs to average total loans |
.27 | % | .25 | % | .20 | % | .22 | % | .22 | % | ||||||||||
| Allowance for loan and lease losses |
$ | 790 | $ | 796 | $ | 794 | $ | 794 | $ | 804 | ||||||||||
| Allowance for credit losses (a) |
844 | 841 | 835 | 829 | 839 | |||||||||||||||
| Allowance for loan and lease losses to period-end loans |
1.31 | % | 1.37 | % | 1.37 | % | 1.38 | % | 1.43 | % | ||||||||||
| Allowance for credit losses to period-end loans |
1.40 | 1.44 | 1.44 | 1.44 | 1.49 | |||||||||||||||
| Allowance for loan and lease losses to nonperforming loans |
197.5 | 190.0 | 181.7 | 190.0 | 200.5 | |||||||||||||||
| Allowance for credit losses to nonperforming loans |
211.0 | 200.7 | 191.1 | 198.3 | 209.2 | |||||||||||||||
| Nonperforming loans at period end (b) |
$ | 400 | $ | 419 | $ | 437 | $ | 418 | $ | 401 | ||||||||||
| Nonperforming assets at period end |
417 | 440 | 457 | 436 | 418 | |||||||||||||||
| Nonperforming loans to period-end portfolio loans |
.67 | % | .72 | % | .75 | % | .73 | % | .71 | % | ||||||||||
| Nonperforming assets to period-end portfolio loans plus OREO and other nonperforming assets |
.69 | .75 | .79 | .76 | .74 | |||||||||||||||
| (a) | Includes the allowance for loan and lease losses plus the liability for credit losses on lending-related unfunded commitments. |
| (b) | Loan balances exclude $12 million, $12 million, $12 million, $13 million, and $14 million of purchased credit impaired loans at September 30, 2015, June 30, 2015, March 31, 2015, December 31, 2014, and September 30, 2014, respectively. |
KeyCorp Reports Third Quarter 2015 Profit
October 15, 2015
Page 25
Summary of Loan and Lease Loss Experience From Continuing Operations
(dollars in millions)
| Three months ended | Nine months ended | |||||||||||||||||||
| 9-30-15 | 6-30-15 | 9-30-14 | 9-30-15 | 9-30-14 | ||||||||||||||||
| Average loans outstanding |
$ | 59,281 | $ | 57,978 | $ | 55,796 | $ | 58,263 | $ | 55,388 | ||||||||||
|
|
|
|
|
|
|
|
|
|
|
|||||||||||
| Allowance for loan and lease losses at beginning of period |
$ | 796 | $ | 794 | $ | 814 | $ | 794 | $ | 848 | ||||||||||
| Loans charged off: |
||||||||||||||||||||
| Commercial, financial and agricultural |
26 | 21 | 12 | 59 | 35 | |||||||||||||||
| Real estate — commercial mortgage |
— | — | — | 2 | 3 | |||||||||||||||
| Real estate — construction |
— | — | 2 | 1 | 4 | |||||||||||||||
|
|
|
|
|
|
|
|
|
|
|
|||||||||||
| Total commercial real estate loans |
— | — | 2 | 3 | 7 | |||||||||||||||
| Commercial lease financing |
2 | 1 | 1 | 5 | 6 | |||||||||||||||
|
|
|
|
|
|
|
|
|
|
|
|||||||||||
| Total commercial loans |
28 | 22 | 15 | 67 | 48 | |||||||||||||||
| Real estate — residential mortgage |
1 | 1 | 2 | 4 | 7 | |||||||||||||||
| Home equity: |
||||||||||||||||||||
| Key Community Bank |
6 | 8 | 9 | 21 | 29 | |||||||||||||||
| Other |
1 | 2 | 2 | 4 | 8 | |||||||||||||||
|
|
|
|
|
|
|
|
|
|
|
|||||||||||
| Total home equity loans |
7 | 10 | 11 | 25 | 37 | |||||||||||||||
| Consumer other — Key Community Bank |
6 | 6 | 7 | 18 | 23 | |||||||||||||||
| Credit cards |
7 | 8 | 9 | 23 | 27 | |||||||||||||||
| Consumer other: |
||||||||||||||||||||
| Marine |
4 | 5 | 4 | 14 | 18 | |||||||||||||||
| Other |
— | — | 1 | 1 | 2 | |||||||||||||||
|
|
|
|
|
|
|
|
|
|
|
|||||||||||
| Total consumer other |
4 | 5 | 5 | 15 | 20 | |||||||||||||||
|
|
|
|
|
|
|
|
|
|
|
|||||||||||
| Total consumer loans |
25 | 30 | 34 | 85 | 114 | |||||||||||||||
|
|
|
|
|
|
|
|
|
|
|
|||||||||||
| Total loans charged off |
53 | 52 | 49 | 152 | 162 | |||||||||||||||
| Recoveries: |
||||||||||||||||||||
| Commercial, financial and agricultural |
2 | 6 | 6 | 13 | 27 | |||||||||||||||
| Real estate — commercial mortgage |
— | — | 2 | 2 | 4 | |||||||||||||||
| Real estate — construction |
— | 1 | 1 | 1 | 16 | |||||||||||||||
|
|
|
|
|
|
|
|
|
|
|
|||||||||||
| Total commercial real estate loans |
— | 1 | 3 | 3 | 20 | |||||||||||||||
| Commercial lease financing |
2 | 1 | 2 | 7 | 8 | |||||||||||||||
|
|
|
|
|
|
|
|
|
|
|
|||||||||||
| Total commercial loans |
4 | 8 | 11 | 23 | 55 | |||||||||||||||
| Real estate — residential mortgage |
— | 1 | — | 1 | 2 | |||||||||||||||
| Home equity: |
||||||||||||||||||||
| Key Community Bank |
2 | 1 | 3 | 5 | 7 | |||||||||||||||
| Other |
2 | 1 | 1 | 4 | 4 | |||||||||||||||
|
|
|
|
|
|
|
|
|
|
|
|||||||||||
| Total home equity loans |
4 | 2 | 4 | 9 | 11 | |||||||||||||||
| Consumer other — Key Community Bank |
1 | 2 | 1 | 5 | 4 | |||||||||||||||
| Credit cards |
1 | 1 | — | 2 | 1 | |||||||||||||||
| Consumer other: |
||||||||||||||||||||
| Marine |
1 | 2 | 2 | 6 | 7 | |||||||||||||||
| Other |
1 | — | — | 1 | 1 | |||||||||||||||
|
|
|
|
|
|
|
|
|
|
|
|||||||||||
| Total consumer other |
2 | 2 | 2 | 7 | 8 | |||||||||||||||
|
|
|
|
|
|
|
|
|
|
|
|||||||||||
| Total consumer loans |
8 | 8 | 7 | 24 | 26 | |||||||||||||||
|
|
|
|
|
|
|
|
|
|
|
|||||||||||
| Total recoveries |
12 | 16 | 18 | 47 | 81 | |||||||||||||||
|
|
|
|
|
|
|
|
|
|
|
|||||||||||
| Net loan charge-offs |
(41 | ) | (36 | ) | (31 | ) | (105 | ) | (81 | ) | ||||||||||
| Provision (credit) for loan and lease losses |
36 | 37 | 21 | 102 | 37 | |||||||||||||||
| Foreign currency translation adjustment |
(1 | ) | 1 | — | (1 | ) | — | |||||||||||||
|
|
|
|
|
|
|
|
|
|
|
|||||||||||
| Allowance for loan and lease losses at end of period |
$ | 790 | $ | 796 | $ | 804 | $ | 790 | $ | 804 | ||||||||||
|
|
|
|
|
|
|
|
|
|
|
|||||||||||
| Liability for credit losses on lending-related commitments at beginning of period |
$ | 45 | $ | 41 | $ | 37 | $ | 35 | $ | 37 | ||||||||||
| Provision (credit) for losses on lending-related commitments |
9 | 4 | (2 | ) | 19 | (2 | ) | |||||||||||||
|
|
|
|
|
|
|
|
|
|
|
|||||||||||
| Liability for credit losses on lending-related commitments at end of period (a) |
$ | 54 | $ | 45 | $ | 35 | $ | 54 | $ | 35 | ||||||||||
|
|
|
|
|
|
|
|
|
|
|
|||||||||||
| Total allowance for credit losses at end of period |
$ | 844 | $ | 841 | $ | 839 | $ | 844 | $ | 839 | ||||||||||
|
|
|
|
|
|
|
|
|
|
|
|||||||||||
| Net loan charge-offs to average total loans |
.27 | % | .25 | % | .22 | % | .24 | % | .20 | % | ||||||||||
| Allowance for loan and lease losses to period-end loans |
1.31 | 1.37 | 1.43 | 1.31 | 1.43 | |||||||||||||||
| Allowance for credit losses to period-end loans |
1.40 | 1.44 | 1.49 | 1.40 | 1.49 | |||||||||||||||
| Allowance for loan and lease losses to nonperforming loans |
197.5 | 190.0 | 200.5 | 197.5 | 200.5 | |||||||||||||||
| Allowance for credit losses to nonperforming loans |
211.0 | 200.7 | 209.2 | 211.0 | 209.2 | |||||||||||||||
| Discontinued operations — education lending business: |
||||||||||||||||||||
| Loans charged off |
$ | 9 | $ | 6 | $ | 10 | $ | 25 | $ | 34 | ||||||||||
| Recoveries |
2 | 4 | 3 | 10 | 11 | |||||||||||||||
|
|
|
|
|
|
|
|
|
|
|
|||||||||||
| Net loan charge-offs |
$ | (7 | ) | $ | (2 | ) | $ | (7 | ) | $ | (15 | ) | $ | (23 | ) | |||||
|
|
|
|
|
|
|
|
|
|
|
|||||||||||
| (a) | Included in “accrued expense and other liabilities” on the balance sheet. |
KeyCorp Reports Third Quarter 2015 Profit
October 15, 2015
Page 26
Summary of Nonperforming Assets and Past Due Loans From Continuing Operations
(dollars in millions)
| 9-30-15 | 6-30-15 | 3-31-15 | 12-31-14 | 9-30-14 | ||||||||||||||||
| Commercial, financial and agricultural |
$ | 89 | $ | 100 | $ | 98 | $ | 59 | $ | 47 | ||||||||||
| Real estate — commercial mortgage |
23 | 26 | 30 | 34 | 41 | |||||||||||||||
| Real estate — construction |
9 | 12 | 12 | 13 | 14 | |||||||||||||||
|
|
|
|
|
|
|
|
|
|
|
|||||||||||
| Total commercial real estate loans |
32 | 38 | 42 | 47 | 55 | |||||||||||||||
| Commercial lease financing |
21 | 18 | 20 | 18 | 14 | |||||||||||||||
|
|
|
|
|
|
|
|
|
|
|
|||||||||||
| Total commercial loans |
142 | 156 | 160 | 124 | 116 | |||||||||||||||
| Real estate — residential mortgage |
67 | 67 | 72 | 79 | 81 | |||||||||||||||
| Home equity: |
||||||||||||||||||||
| Key Community Bank |
174 | 176 | 182 | 185 | 174 | |||||||||||||||
| Other |
7 | 8 | 9 | 10 | 10 | |||||||||||||||
|
|
|
|
|
|
|
|
|
|
|
|||||||||||
| Total home equity loans |
181 | 184 | 191 | 195 | 184 | |||||||||||||||
| Consumer other — Key Community Bank |
1 | 1 | 2 | 2 | 2 | |||||||||||||||
| Credit cards |
2 | 2 | 2 | 2 | 1 | |||||||||||||||
| Consumer other: |
||||||||||||||||||||
| Marine |
6 | 8 | 9 | 15 | 16 | |||||||||||||||
| Other |
1 | 1 | 1 | 1 | 1 | |||||||||||||||
|
|
|
|
|
|
|
|
|
|
|
|||||||||||
| Total consumer other |
7 | 9 | 10 | 16 | 17 | |||||||||||||||
|
|
|
|
|
|
|
|
|
|
|
|||||||||||
| Total consumer loans |
258 | 263 | 277 | 294 | 285 | |||||||||||||||
|
|
|
|
|
|
|
|
|
|
|
|||||||||||
| Total nonperforming loans (a) |
400 | 419 | 437 | 418 | 401 | |||||||||||||||
| Nonperforming loans held for sale |
— | — | — | — | — | |||||||||||||||
| OREO |
17 | 20 | 20 | 18 | 16 | |||||||||||||||
| Other nonperforming assets |
— | 1 | — | — | 1 | |||||||||||||||
|
|
|
|
|
|
|
|
|
|
|
|||||||||||
| Total nonperforming assets |
$ | 417 | $ | 440 | $ | 457 | $ | 436 | $ | 418 | ||||||||||
|
|
|
|
|
|
|
|
|
|
|
|||||||||||
| Accruing loans past due 90 days or more |
$ | 54 | $ | 66 | $ | 111 | $ | 96 | $ | 71 | ||||||||||
| Accruing loans past due 30 through 89 days |
271 | 181 | 216 | 235 | 340 | |||||||||||||||
| Restructured loans — accruing and nonaccruing (b) |
287 | 300 | 268 | 270 | 264 | |||||||||||||||
| Restructured loans included in nonperforming loans (b) |
160 | 170 | 141 | 157 | 137 | |||||||||||||||
| Nonperforming assets from discontinued operations — education lending business |
8 | 6 | 8 | 11 | 9 | |||||||||||||||
| Nonperforming loans to period-end portfolio loans |
.67 | % | .72 | % | .75 | % | .73 | % | .71 | % | ||||||||||
| Nonperforming assets to period-end portfolio loans plus OREO and other nonperforming assets |
.69 | .75 | .79 | .76 | .74 | |||||||||||||||
| (a) | Loan balances exclude $12 million, $12 million, $12 million, $13 million, and $14 million of purchased credit impaired loans at September 30, 2015, June 30, 2015, March 31, 2015, December 31, 2014, and September 30, 2014, respectively. |
| (b) | Restructured loans (i.e., troubled debt restructurings) are those for which Key, for reasons related to a borrower’s financial difficulties, grants a concession to the borrower that it would not otherwise consider. These concessions are made to improve the collectability of the loan and generally take the form of a reduction of the interest rate, extension of the maturity date or reduction in the principal balance. |
KeyCorp Reports Third Quarter 2015 Profit
October 15, 2015
Page 27
Summary of Changes in Nonperforming Loans From Continuing Operations
(in millions)
| 3Q15 | 2Q15 | 1Q15 | 4Q14 | 3Q14 | ||||||||||||||||
| Balance at beginning of period |
$ | 419 | $ | 437 | $ | 418 | $ | 401 | $ | 396 | ||||||||||
| Loans placed on nonaccrual status |
81 | 92 | 123 | 103 | 109 | |||||||||||||||
| Charge-offs |
(53 | ) | (52 | ) | (47 | ) | (49 | ) | (49 | ) | ||||||||||
| Loans sold |
(2 | ) | — | — | (2 | ) | — | |||||||||||||
| Payments |
(16 | ) | (25 | ) | (9 | ) | (17 | ) | (13 | ) | ||||||||||
| Transfers to OREO |
(4 | ) | (5 | ) | (7 | ) | (6 | ) | (7 | ) | ||||||||||
| Loans returned to accrual status |
(25 | ) | (28 | ) | (41 | ) | (12 | ) | (35 | ) | ||||||||||
|
|
|
|
|
|
|
|
|
|
|
|||||||||||
| Balance at end of period (a) |
$ | 400 | $ | 419 | $ | 437 | $ | 418 | $ | 401 | ||||||||||
|
|
|
|
|
|
|
|
|
|
|
|||||||||||
| (a) | Loan balances exclude $12 million, $12 million, $12 million, $13 million, and $14 million of purchased credit impaired loans at September 30, 2015, June 30, 2015, March 31, 2015, December 31, 2014, and September 30, 2014, respectively. |
Summary of Changes in Other Real Estate Owned, Net of Allowance, From Continuing Operations
(in millions)
| 3Q15 | 2Q15 | 1Q15 | 4Q14 | 3Q14 | ||||||||||||||||
| Balance at beginning of period |
$ | 20 | $ | 20 | $ | 18 | $ | 16 | $ | 12 | ||||||||||
| Properties acquired — nonperforming loans |
4 | 5 | 7 | 6 | 7 | |||||||||||||||
| Valuation adjustments |
(2 | ) | (1 | ) | (1 | ) | (2 | ) | (1 | ) | ||||||||||
| Properties sold |
(5 | ) | (4 | ) | (4 | ) | (2 | ) | (2 | ) | ||||||||||
|
|
|
|
|
|
|
|
|
|
|
|||||||||||
| Balance at end of period |
$ | 17 | $ | 20 | $ | 20 | $ | 18 | $ | 16 | ||||||||||
|
|
|
|
|
|
|
|
|
|
|
|||||||||||
KeyCorp Reports Third Quarter 2015 Profit
October 15, 2015
Page 28
Line of Business Results
(dollars in millions)
| Percent change 3Q15 vs. |
||||||||||||||||||||||||||||
| 3Q15 | 2Q15 | 1Q15 | 4Q14 | 3Q14 | 2Q15 | 3Q14 | ||||||||||||||||||||||
| Key Community Bank |
||||||||||||||||||||||||||||
| Summary of operations |
||||||||||||||||||||||||||||
| Total revenue (TE) |
$ | 579 | $ | 560 | $ | 549 | $ | 558 | $ | 558 | 3.4 | % | 3.8 | % | ||||||||||||||
| Provision for credit losses |
18 | 3 | 30 | 11 | 21 | 500.0 | (14.3 | ) | ||||||||||||||||||||
| Noninterest expense |
448 | 450 | 441 | 449 | 441 | (.4 | ) | 1.6 | ||||||||||||||||||||
| Net income (loss) attributable to Key |
71 | 67 | 49 | 62 | 60 | 6.0 | 18.3 | |||||||||||||||||||||
| Average loans and leases |
31,039 | 30,707 | 30,662 | 30,478 | 30,103 | 1.1 | 3.1 | |||||||||||||||||||||
| Average deposits |
51,234 | 50,766 | 50,417 | 50,851 | 50,303 | .9 | 1.9 | |||||||||||||||||||||
| Net loan charge-offs |
21 | 20 | 28 | 28 | 28 | 5.0 | (25.0 | ) | ||||||||||||||||||||
| Net loan charge-offs to average total loans |
.27 | % | .26 | % | .37 | % | .36 | % | .37 | % | N/A | N/A | ||||||||||||||||
| Nonperforming assets at period end |
$ | 307 | $ | 305 | $ | 328 | $ | 340 | $ | 338 | .7 | (9.2 | ) | |||||||||||||||
| Return on average allocated equity |
10.49 | % | 10.05 | % | 7.27 | % | 9.15 | % | 8.89 | % | N/A | N/A | ||||||||||||||||
| Average full-time equivalent employees |
7,326 | 7,400 | 7,452 | 7,414 | 7,573 | (1.0 | ) | (3.3 | ) | |||||||||||||||||||
| Key Corporate Bank |
||||||||||||||||||||||||||||
| Summary of operations |
||||||||||||||||||||||||||||
| Total revenue (TE) |
$ | 454 | $ | 477 | $ | 401 | $ | 460 | $ | 400 | (4.8 | )% | 13.5 | % | ||||||||||||||
| Provision for credit losses |
30 | 41 | 6 | 7 | 2 | (26.8 | ) | N/M | ||||||||||||||||||||
| Noninterest expense |
246 | 252 | 214 | 244 | 213 | (2.4 | ) | 15.5 | ||||||||||||||||||||
| Net income (loss) attributable to Key |
138 | 133 | 129 | 149 | 134 | 3.8 | 3.0 | |||||||||||||||||||||
| Average loans and leases |
26,425 | 25,298 | 24,722 | 23,798 | 23,215 | 4.5 | 13.8 | |||||||||||||||||||||
| Average loans held for sale |
918 | 1,234 | 775 | 855 | 481 | (25.6 | ) | 90.9 | ||||||||||||||||||||
| Average deposits |
18,809 | 19,708 | 18,567 | 18,355 | 17,599 | (4.6 | ) | 6.9 | ||||||||||||||||||||
| Net loan charge-offs |
20 | 12 | (4 | ) | (3 | ) | (1 | ) | 66.7 | N/M | ||||||||||||||||||
| Net loan charge-offs to average total loans |
.30 | % | .19 | % | (.07 | )% | (.05 | )% | (.02 | )% | N/A | N/A | ||||||||||||||||
| Nonperforming assets at period end |
$ | 85 | $ | 105 | $ | 93 | $ | 41 | $ | 20 | (19.0 | ) | 325.0 | |||||||||||||||
| Return on average allocated equity |
28.65 | % | 29.62 | % | 28.04 | % | 33.63 | % | 31.59 | % | N/A | N/A | ||||||||||||||||
| Average full-time equivalent employees |
2,173 | 2,058 | 2,057 | 2,043 | 1,998 | 5.6 | 8.8 | |||||||||||||||||||||
TE = Taxable Equivalent, N/A = Not Applicable, N/M = Not Meaningful
| KeyCorp Third Quarter 2015 Earnings Review October 15, 2015 Beth E. Mooney Chairman and Chief Executive Officer Don Kimble Chief Financial Officer Exhibit 99.2 |
| 2 FORWARD-LOOKING STATEMENTS AND ADDITIONAL INFORMATION DISCLOSURE This presentation contains forward-looking statements within the meaning of the Private Securities Litigation Reform Act of 1995. These
statements do not relate strictly to historical or current facts.
Forward-looking statements usually can be identified by the use of words such as “goal,” “objective,” “plan,” “expect,” “assume,” “anticipate,” “intend,” “project,” “believe,”
“estimate,” or other words of similar meaning. Forward-looking statements provide management’s current expectations or forecasts of future events, circumstances, results or aspirations. Forward-looking statements, by
their nature, are
subject to assumptions, risks, and uncertainties, many of which are outside of our control. Our actual results may differ materially from those set forth in our forward-looking statements. There is no assurance that any list of risks and uncertainties or risk factors is complete. Factors that could cause actual results to
differ from those described in forward-looking statements include,
but are not limited to: (1) deterioration of commercial real estate market fundamentals; (2) declining asset prices; (3) adverse changes in credit quality trends; (4) our concentrated credit exposure in commercial, financial, and agricultural
loans; (5) defaults by our loan counterparties or clients; (6) the
extensive and increasing regulation of the U.S. financial services industry; (7) changes in accounting policies, standards, and interpretations; (8) increasing capital and liquidity standards under applicable regulatory rules; (9)
unanticipated changes in our liquidity position, including but not
limited to, changes in the cost of liquidity, our ability to enter the financial markets and to secure alternative funding sources; (10) our ability to receive dividends from our subsidiary, KeyBank; (11) downgrades in our credit ratings or those
of KeyBank; (12) operational or risk management failures by us or
critical third-parties; (13) breaches of security or failures of our technology systems due to technological or other factors and cybersecurity threats; (14) negative outcomes from claims or litigation; (15) the occurrence of natural or man-
made disasters or conflicts or terrorist attacks; (16) a reversal of the U.S. economic
recovery due to financial, political or other shocks; (17) our ability to
anticipate interest rate changes and manage interest rate risk; (18) deterioration of economic conditions in the geographic regions where we operate; (19) the soundness of other financial institutions; (20) our ability to attract and retain talented executives and employees and to manage our reputational risks; (21) our ability to timely and effectively implement our strategic initiatives; (22) increased competitive pressure due to
industry consolidation; (23) unanticipated adverse effects of strategic
partnerships or acquisitions and dispositions of assets or businesses; and (24) our ability to develop and effectively use the quantitative models we rely upon in our business planning.
We provide greater detail regarding these factors in our 2014 Form 10-K and
subsequent filings, which are available online at www.key.com/ir and
www.sec.gov. Any forward-looking statements made by us or on our behalf speak only
as of the date they are made, and Key does not undertake any obligation
to update any forward-looking statement to reflect the impact of subsequent events or circumstances. This presentation also includes certain non-GAAP financial measures related to “tangible common equity,” “Common Equity Tier 1,” “Tier 1 common equity,” “pre-provision net revenue,” and “cash efficiency ratio.” Management believes these ratios may assist
investors, analysts and regulators in analyzing Key’s financials.
Although Key has procedures in place to ensure that these measures are calculated using the appropriate GAAP or regulatory components, they have limitations as analytical tools and should not be considered in isolation, or as a substitute for analysis of
results under GAAP. For more information on these calculations and to
view the reconciliations to the most comparable GAAP measures, please refer to the Appendix of this presentation and to page 97 of our Form 10-Q dated June 30, 2015. |
 3 Asset quality remains strong - NCOs represented 27 bps of average loans in 3Q15, below targeted range - NPLs remain at a low level: 67 bps of period-end loans Remaining disciplined with structure and relationship focus Strong Risk Management Strong Risk Management Generated positive operating leverage from prior year Revenue up 7% from 3Q14: higher net interest income and noninterest income - Average loans increased 6%, driven by a 15% increase in CF&A loans - Strong fee-based income from corporate services, investment banking and debt placement
fees, and cards and payments income
Expenses well-managed
- 3Q15 results include a pension settlement charge and full-quarter impact from the
September 2014 Pacific Crest Securities acquisition
Positive Operating Leverage Positive Operating Leverage Investor Highlights – 3Q15 Repurchased $123 million of common shares in 3Q15 (a) Total 2015 payout estimated to be among the highest in our peer group for third consecutive year Disciplined Capital Management Disciplined Capital Management (a) Common share repurchase amount includes repurchases to offset issuances of common shares under our employee compensation plans
|
| 4 Financial Review * * * * * * * * * * * * * * * * |
 5 Financial Highlights TE = Taxable equivalent, EOP = End of Period (a) From continuing operations (b) Year-over-year average balance growth (c) From consolidated operations (d) 9-30-15 ratios are estimated (e) Non-GAAP measure: see Appendix for reconciliation EPS – assuming dilution $ .26 $ .27 $ .26 $ .28 $ .23 Cash efficiency ratio (e) 66.9 % 65.1 % 65.1 % 64.4 % 69.7 % Net interest margin (TE) 2.87 2.88 2.91 2.94 2.96 Return on average total assets .95 1.03 1.03 1.12 .92 Total loans and leases 6 % 4 % 5 % 5 % 5 % CF&A loans 15 10 12 12 11 Deposits (excl. foreign deposits) 3 6 5 2 4 Common Equity Tier 1 (d), (e) 10.5 % 10.7 % 10.6 % - - Tier 1 common equity (e) - - - 11.2 % 11.3 % Tier 1 risk-based capital (d) 10.9 11.1 11.0 11.9 12.0 Tangible common equity to tangible assets (e) 9.9 9.9 9.9 9.9 10.3 NCOs to average loans .27 % .25 % .20 % .22 % .22 % NPLs to EOP portfolio loans .67 .72 .75 .73 .71 Allowance for loan losses to EOP loans 1.31 1.37 1.37 1.38 1.43 Balance Sheet Growth (a), (b) Balance Sheet Growth (a), (b) Capital (c) Capital (c) Asset Quality (a) Asset Quality (a) Financial Performance (a) Metrics 3Q15 2Q15 1Q15 4Q14 3Q14 |
 6 Loans $ in billions Average Commercial, Financial & Agricultural Loans Average Commercial, Financial & Agricultural Loans Total Average Loans Total Average Loans Exit Portfolios Home Equity & Other Commercial $ in billions Period-end total loans up 7% in 3Q15 from prior year, driven by CF&A loans up 17% – Period-end total loans up in both the Community Bank and the Corporate Bank Total commitments continue to grow with utilization relatively stable Average Loans Period-End Loans CF&A loans up 15% Highlights Highlights Total average loans up 6% Average total loans up 6% in 3Q15 from prior year, driven by CF&A loans up 15% – Average total loans up in both the Community Bank and the Corporate Bank |
 Deposits
down slightly from 2Q15 reflecting: –
Decline in short-term noninterest-bearing
deposit balances from commercial clients and
lower certificates of deposit
– Partially offset by increases in NOW and MMDA Interest-bearing liability cost remains relatively stable at .53% 7 3Q15 Deposit Mix 3Q15 Deposit Mix Deposit cost continues to improve compared to prior year Deposit growth of 3% from 3Q14 related to: – Continued growth in commercial mortgage servicing – Inflows from both commercial and consumer clients – Transaction deposit balances up 4% from 3Q14 Average Deposits (a) Average Deposits (a) Note: Transaction deposits include noninterest-bearing, as well as NOW and MMDA
(a) Excludes deposits in foreign office Cost of total deposits (a) CDs and other time deposits Savings Noninterest-bearing NOW and MMDA Total average deposits (a) Highlights Highlights Deposits Total average deposits up 3% vs. Prior Quarter vs. Prior Year $ in billions $ in billions |
 NII up
$7 MM, or 1%, from the prior quarter, primarily due to improvement in the
earning asset mix, partially offset by lower earning asset
yields and loan fees 8 TE = Taxable equivalent Net interest income (TE) NIM (TE) NIM Change (bps): vs. 2Q15 Earning asset mix / lower levels of excess liquidity 0.03 Lower earning asset yields (0.02) Loan fees (0.02) Total Change (0.01) Maintained moderate asset sensitivity – Naturally asset sensitive balance sheet flows: approximately 70% of loans variable rate – High quality investment portfolio with average life of 3.8 years – Flexibility to quickly adjust interest rate risk position vs. Prior Year Net interest income up $17 MM, or 3%, from the prior year, reflecting higher earning asset balances, partially offset by lower earning asset yields vs. Prior Quarter Net Interest Income and Margin Net Interest Income & Net Interest Margin Trend (TE) Net Interest Income & Net Interest Margin Trend (TE) Highlights Highlights $ in millions; continuing operations |
 9 Noninterest Income Noninterest Income Noninterest Income $ in millions 3Q15 vs. 2Q15 vs. 3Q14 Trust and investment services income $ 108 $ (3) $ 9 Investment banking and debt placement fees 109 (32) 21 Service charges on deposit accounts 68 5 - Operating lease income and other leasing gains 15 (9) (2) Corporate services income 57 14 15 Cards and payments income 47 - 5 Corporate-owned life insurance 30 - 4 Consumer mortgage income 3 (1) - Mortgage servicing fees 11 2 2 Net gains (losses) from principal investing 11 - 2 Other income 11 6 (3) Total noninterest income $ 470 $ (18) $ 53 Highlights Highlights Noninterest income up 13% from 3Q14, driven by strength in core businesses: – Corporate services income up $15 MM – Investment banking and debt placement fees up $21 MM – Cards and payments income up $5 MM Noninterest income down 4% from 2Q15: – Lower investment banking and debt placement fees, reflecting normal variability – Offset by strong corporate services income, other income, and increased service charges on deposit accounts vs. Prior Quarter vs. Prior Year (a) (a) Other includes corporate-owned life insurance, principal investing, etc. |
 Noninterest expense $ in millions 3Q15 vs. 2Q15 vs. 3Q14 Personnel (a) $ 426 $ 18 $ 21 Net occupancy 60 (6) (6) Computer processing 41 (1) 2 Business services, professional fees 40 (2) 4 Equipment 22 - (3) Operating lease expense 11 (1) - Marketing 17 2 2 FDIC assessment 8 - (1) Intangible asset amortization 9 - (1) OREO expense, net 2 1 1 Other expense 88 2 (1) Total noninterest expense $ 724 $ 13 $ 18 Total noninterest expense (excl. pension settlement charge) $ 705 $ (6) $ 19 10 Noninterest Expense Noninterest Expense Noninterest Expense (a) Includes a pension settlement charge of $19 million in 3Q15 and $20 million in 3Q14
(b) Non-GAAP measure: see Appendix for reconciliation Highlights Highlights Cash efficiency ratio, excl. efficiency and pension settlement charge Cash efficiency ratio (b) 3Q15 noninterest expense up 3% from 3Q14 – A full-quarter impact of the September 2014 acquisition of Pacific Crest Securities – Higher personnel costs related to: Investments in senior bankers and client- facing roles in the Community Bank and Corporate Bank Higher performance-based compensation related to strong capital markets business Expense growth of 2% from 2Q15 – Pension settlement charge of $19 MM in 3Q15 – Impact from increase in business days – Offset by: Lower occupancy costs Lower performance-based compensation related to capital markets business performance vs. Prior Year vs. Prior Quarter $724
|
 11 Nonperforming Assets Nonperforming Assets Net Charge-offs & Provision for Credit Losses Net Charge-offs & Provision for Credit Losses NPLs NPLs to period-end loans NCOs Provision for credit losses NCOs to average loans $ in millions NPLs held for sale, OREO & other NPAs Credit Quality Highlights Highlights Net loan charge-offs remain below targeted range, at 27 basis points of average loans Nonperforming loans represented 67 basis points of period-end loans Allowance for loan and lease losses represented 1.31% of period-end loans: 198% coverage of nonperforming loans Allowance for Loan and Lease Losses Allowance for Loan and Lease Losses Allowance for loan and lease losses to NPLs Allowance for loan and lease losses $ in millions $418 $417 $ in millions |
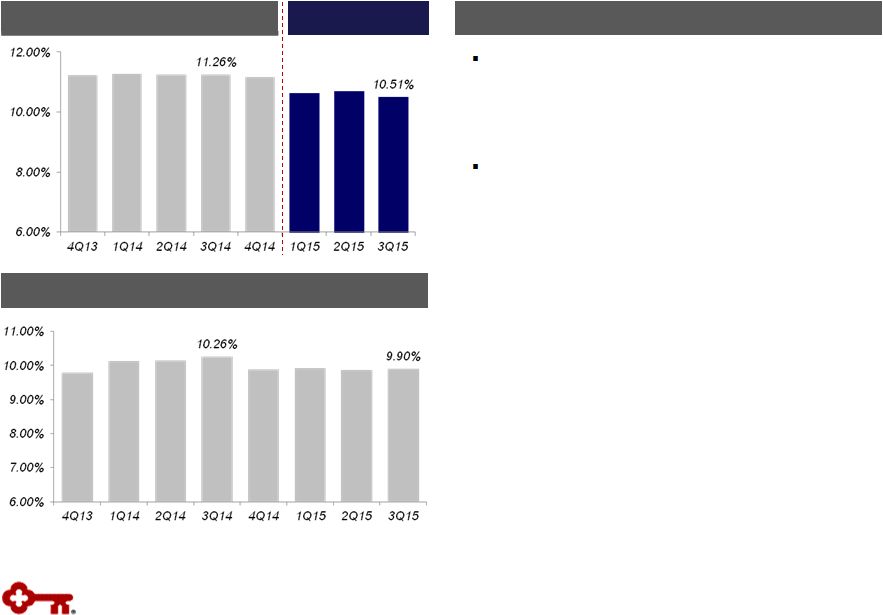 12 Disciplined capital management – Executing on capital priorities: organic growth, dividends, share repurchases and opportunistic growth 2015 Capital Plan includes share repurchases of up to $725 million in common shares (2Q15 through 2Q16) – Repurchased $123 MM of common shares in 3Q15 – Year-to-date shareholder payout is estimated to be among the highest in our peer group Tier 1 Common Equity (a) Tier 1 Common Equity (a) Tangible Common Equity to Tangible Assets (a) Tangible Common Equity to Tangible Assets (a) Highlights Highlights Note: Common share repurchase amounts include repurchases to offset issuances of common shares under our employee compensation plans
(a) Non-GAAP measure: see Appendix for reconciliations (b) 9-30-15 ratio is estimated (c) The Regulatory Capital Rules, effective January 1, 2015 for Key, introduced a new capital measure, “Common Equity Tier 1”
Common Equity Tier 1 (a), (b), (c) Common Equity Tier 1 (a), (b), (c) Capital |
 Outlook and
Expectations Average Loans
• Mid-single digit growth vs. FY 2014 Net Interest Income • Up low single-digits without the benefit of higher rates • NIM: down from FY 2014, reflecting continued elevated levels of liquidity; relatively
stable with 2Q15 reported level
Noninterest Income • Mid-single digit growth compared to 2014 Expense • Relatively stable with 2014 Efficiency / Productivity • Positive operating leverage Asset Quality • Net charge-offs to average loans below targeted range of 40 – 60 bps • Provision expected to approximate net charge-offs Capital • Disciplined management of capital including dividends and share repurchases 13 Guidance ranges: relatively stable: +/- 2%; low single-digit: <5%; mid-single digit: 4% -
6%; low double-digit: 10% -
13% FY 2015 FY 2015 |
| 14 Appendix * * * * * * * * * * * * * * * * * |
 Progress on
Targets for Success (a)
Continuing operations, unless otherwise noted
(b) Represents period-end consolidated total loans and loans held for sale divided by period-end consolidated total deposits (excluding
deposits in foreign office) (c)
Excludes intangible asset amortization; non-GAAP measure: see Appendix for
reconciliation 15
Balance Sheet Efficiency Balance Sheet Efficiency Moderate Risk Profile Moderate Risk Profile High Quality, Diverse Revenue Streams High Quality, Diverse Revenue Streams Positive Operating Leverage Positive Operating Leverage Disciplined Capital Management Disciplined Capital Management Metrics (a) Metrics (a) 3Q15 3Q15 2Q15 2Q15 Targets Targets Loan to deposit ratio (b) Loan to deposit ratio (b) NCOs to average loans NCOs to average loans Provision for credit losses
to average loans Provision for credit losses
to average loans Net interest margin Net interest margin Noninterest income to total revenue Noninterest income to total revenue Cash efficiency ratio (c) Cash efficiency ratio (c) Return on average assets Return on average assets 89% 87% .27% .25% 66.9% 65.1% .95% 1.03% .30% .28% 2.87% 2.88% 44% 45% 90% -100% 40 - 60 bps LT: >3.50% LT: <60% 1.00% -1.25% >40% |
 16 Efficiency Ratio: Driving to 60% and Below Business plans and macroeconomic environment provide path to an efficiency ratio below 60% Cash Efficiency Ratio (a),(b) Outlook Cash Efficiency Ratio (a),(b) Outlook (a) Non-GAAP measure: see Appendix for reconciliation (b) 3Q15 cash efficiency ratio excludes pension settlement charge of $19 million
(c) Assumes implied forward curve 2-3 year outlook: 60% Long-term, committed to moving below 60% (c) |
 17 Average Total Investment Securities Average Total Investment Securities Highlights Highlights Average AFS securities Investment Portfolio Portfolio composed primarily of GNMA and GSE- backed MBS and CMOs Continue to position portfolio for upcoming regulatory liquidity requirements: – 2015 average balance growth reflects actions taken to increase liquidity reserves – Growth and reinvestment of portfolio cash flows have been predominantly in GNMA securities (~49% of total portfolio was GNMA at 9/30/15) Securities cash flows of $1.1 billion in 3Q15, unchanged from 2Q15 Average portfolio life at 9/30/15 of 3.8 years, unchanged from 6/30/15 Securities to Total Assets (b) Securities to Total Assets (b) (a) Yield is calculated on the basis of amortized cost (b) Includes end-of-period held-to-maturity and available-for-sale securities
Average yield (a) Average HTM securities 2.15% $17.0 $19.2 $ in billions |
 Interest
Rate Risk Management Naturally Asset Sensitive Balance Sheet
Naturally Asset Sensitive Balance Sheet
Actively Managing Rate Risk
Actively Managing Rate Risk
• High quality • Fixed rate agency MBS and CMOs • Average maturity: 3.8 years • GNMAs total 49% of total portfolio • Reinvesting cash flows into GNMAs $10.7 $17 $7.1 $7.1 Size of swap portfolio Modeled asset sensitivity ~3% 0% 7% $7.1 Flexibility to Adjust Rate Sensitivity with Swaps (c) Loan Portfolio Variable: 70% Fixed: 30% Deposits (a) Flexibility to adjust rate sensitivity for changes in balance sheet growth/mix as well as interest rate outlook Debt hedges A/LM hedges Investment Portfolio Noninterest- bearing: 38% Interest- bearing, non- time: 55% CDs: 7% • Maintained moderate asset sensitive position of ~3% (b) - Assumes 200 basis point increase in short and intermediate- term rates over a 12-month period • Utilize swaps for debt hedging and asset liability management - Fairly even pace of A/LM swap maturities - $2.9B A/LM swaps scheduled to mature by year end 2016 9/30/15 Swaps ($ in B) 9/30/15 Notional Amt. Wtd. Avg. Maturity (Yrs.) Receive Rate Pay Rate A/L Management $ 10.7 2.6 1.0% .2% Debt 7.1 3.9 2.0 .2 $ 17.8 1.4% .2% 3Q15 avg. balances (c) $19.2 B AFS: $14.2 B HTM: $4.9 B Balance sheet has relatively short duration and is impacted by the short-end of the curve $17.8 B 18 Note: Loan, deposit and investment portfolio balances reflect quarterly average balances
(a) Excludes deposits in foreign office (b) Preliminary estimate (c) May not foot due to rounding 3Q15 3Q15 |
 19 Credit Quality Trends Criticized Outstandings (a) to Period-end Total Loans Criticized Outstandings (a) to Period-end Total Loans Delinquencies to Period-end Total Loans Delinquencies to Period-end Total Loans (a) Loan and lease outstandings (b) From continuing operations 30 – 89 days delinquent 90+ days delinquent Metric (b) 3Q15 2Q15 1Q15 4Q14 3Q14 Delinquencies to EOP total loans: 30-89 days .45 % .31 % .37 % .41 % .61 % Delinquencies to EOP total loans: 90+ days .09 .11 .19 .17 .13 NPLs to EOP portfolio loans .67 .72 .75 .73 .71 NPAs to EOP portfolio loans + OREO + Other NPAs .69 .75 .79 .76 .74 Allowance for loan losses to period-end loans 1.31 1.37 1.37 1.38 1.43 Allowance for loan losses to NPLs 197.5 190.0 181.7 190.0 200.5 Continuing operations Continuing operations |
 Period- end loans Average loans Net loan charge- offs Net loan charge-offs (b) / average loans (%) Nonperforming loans (c) Ending allowance (d) Allowance / period-end loans (d) (%) Allowance / NPLs (%) 9/30/15 3Q15 3Q15 3Q15 9/30/15 9/30/15 9/30/15 9/30/15 Commercial, financial and agricultural (a) $ 31,095 $ 30,374 $ 24 .31% $ 89
$
438 1.41%
492.13% Commercial real estate: Commercial Mortgage 8,180 7,988 - - 23 139 1.70 604.35 Construction 1,070 1,164 - - 9 25 2.34 277.78 Commercial lease financing 3,929 3,946 - - 21 45 1.15 214.29 Real estate – residential mortgage 2,267 2,258 1 .18 67 19 .84 28.36 Home equity 10,504 10,510 3 .11 181 58 .55 32.04 Credit cards 770 759 6 3.14 2 32 4.16 N/M Consumer other – Key Community Bank 1,612 1,597 5 1.24 1 20 1.24 N/M Consumer other – Exit Portfolio 658 685 2 1.16 7 14 2.13 200.00 Continuing total (e) $ 60,085 $ 59,281 $ 41 .27% $ 400
$
790 1.31 197.50% Discontinued operations 1,891 1,920 7 1.45 8 23 1.22 287.50 Consolidated total $ 61,976 $ 61,201 $ 48 .31% $ 408
$
813 1.31 199.26% Credit Quality by Portfolio Credit Quality by Portfolio Credit Quality $ in millions 20 (a) 9-30-15 ending loan balance includes $88 million of commercial credit card balances; 9-30-15 average loan balance includes $88 million of assets from commercial credit cards (b) Net loan charge-off amounts are annualized in calculation (c) 9-30-15 NPL amount excludes $12 million of purchased credit impaired loans
(d) 9-30-15 allowance by portfolio is estimated (e) 9-30-15 ending loan balance includes purchased loans of $119 million, of which $12 million were purchased credit impaired
N/M = Not meaningful |
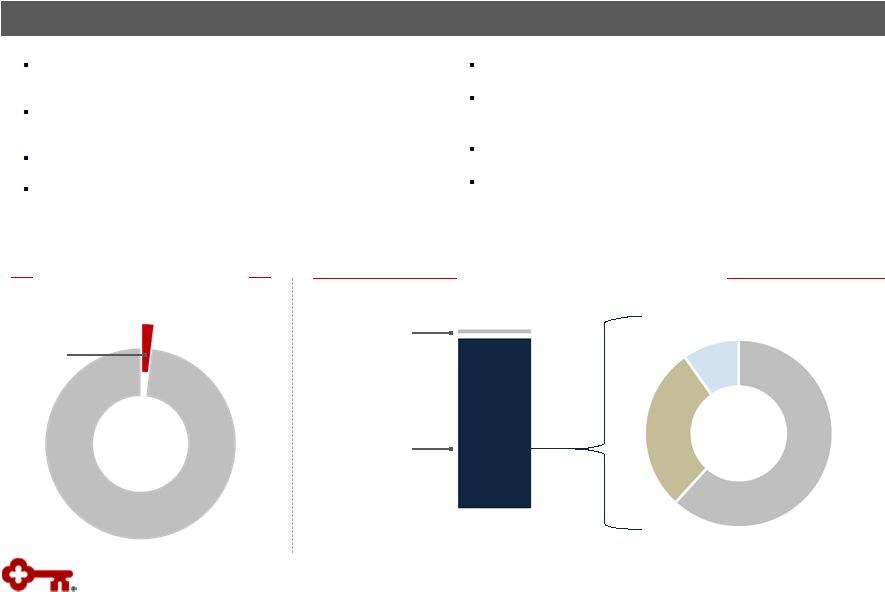 Oil &
Gas Longstanding history, expertise and relationships
21 Strong Portfolio Characteristics Strong Portfolio Characteristics >10 years of experience in energy lending with >20 specialists dedicated to oil & gas Focused on middle market companies, aligned with our relationship strategy Portfolio regularly stress tested Primarily secured by proven reserves Total Loans Outstanding, 9/30/15 >40% of clients’ 2015 production is hedged Relationships contribute to noninterest income; ~5% of FY14 investment banking and debt placement fees Net charge-offs lower than overall portfolio Allowance reflects estimated impact of current oil prices Oil & Gas: 2% Other: 98% Oil & Gas Outstanding Balances, 9/30/15 Oilfield Services Upstream: 62%, $0.7 B Midstream: 28%, $0.3 B Downstream: 10%, $0.1 B $0.1 B Oil & Gas $1.1 B |
 Vintage
(% of Loans) Loan
Balances Average Loan Size ($) Average FICO Average LTV (a) % of Loans LTV>90% 2012 and later 2011 2010 2009 2008 and prior Loans and lines First lien $ 6,216 $ 71,075 771 67 % .6 % 57 % 4 % 2 % 3 % 34 % Second lien 4,066 46,473 767 76 3.4 39 4 3 3 51 Community Bank $ 10,282 58,771 769 71 1.7 50 4 3 3 40 Exit portfolio 222 19,131 728 80 29.0 - - - - 100 Total home equity portfolio $ 10,504 Nonaccrual loans and lines First lien $ 102
$ 63,852
715 72 % 3.6 % 13 % 3 % 3 % 4 % 77 % Second lien 72 47,851 710 78 3.3 6 2 2 4 86 Community Bank $ 174
56,075 713 75 3.5 10 3 2 4 81 Exit portfolio 7 22,584 704 78 23.1 - - - - 100 Total home equity nonaccruals $ 181
Third quarter net charge-offs (NCOs)
Community Bank $ 4
13 % - 1 % 8 % 78 % % of average loans .15 % Exit Portfolio $ (1)
- - - - - % of average loans (1.73) % (a) Average LTVs are at origination; current average LTVs for Community Bank total home equity loans and lines is approximately 68%,
unchanged from 68% at the end of the second quarter of 2015
Home Equity Portfolio –
9/30/15 Home Equity Portfolio – 9/30/15 $ in millions, except average loan size Home Equity Portfolio Highlights Highlights High quality portfolio Community bank loans and lines: 98% of total portfolio; branch- originated – 60% first lien position – Average FICO score of 769 – Average LTV at origination: 71% $3.9 billion of the total portfolio are fixed rate loans that require principal and interest payments; $6.3 billion are lines $1.2 billion in lines outstanding (12% of the total portfolio) come to end of draw period in the next four years – Proactive communication and client outreach initiated near end of draw period 22 |
 Balance
Outstanding Change
Net Loan Charge-offs
Balance on Nonperforming Status 9-30-15 6-30-15 9-30-15 vs. 6-30-15 3Q15 (b) 2Q15 9-30-15 6-30-15 Residential properties – homebuilder $ 6 $ 6 - - - $ 5 $ 8 Marine and RV floor plan 1 2 $ (1) - - - 1 Commercial lease financing (a) 798 831 (33) $ (1) - - - Total commercial loans 805 839 (34) (1) - 5 9 Home equity – Other 222 236 (14) (1) $ 1 7 8 Marine 620 673 (53) 3 3 6 8 RV and other consumer 44 47 (3) (1) - 1 1 Total consumer loans 886 956 (70) 1 4 14 17 Total exit loans in loan portfolio $ 1,691 $ 1,795 $ (104) $ - $ 4 $ 19 $ 26 Discontinued operations – education lending business (not included in exit loans above) (c) $ 1,891 $ 1,962 $ (71) $ 7 $ 2 $ 8 $ 6 $ in millions; average balances (a) Includes (1) the business aviation, commercial vehicle, office products, construction and industrial leases; (2) Canadian lease financing
portfolios; (3) European lease financing portfolios; and (4) all
remaining balances related to lease in, lease out; sale in, lease out; service contract leases; and qualified technological equipment leases. (b) Credit amounts indicate recoveries exceeded charge-offs (c) Excludes loans held for sale of $169 million at September 30, 2015, and $179 million at June 30, 2015.
$ in millions Exit Loan Portfolio Exit Loan Portfolio Exit Loan Portfolio 23 |
 Three
months ended 9-30-15
6-30-15 3-31-15 12-31-14 9-30-14 Tangible common equity to tangible assets at period end Key shareholders’ equity (GAAP) $ 10,705 $ 10,590 $ 10,603 $ 10,530 $ 10,486 Less: Intangible assets (a) 1,084 1,085 1,088 1,090 1,105 Preferred Stock, Series A (b) 281 281 281 282 282 Tangible common equity (non-GAAP) $ 9,340 $ 9,224 $ 9,234 $ 9,158 $ 9,099 Total assets (GAAP) $ 95,422 $ 94,606 $ 94,206 $ 93,821 $ 89,784 Less: Intangible assets (a) 1,084 1,085 1,088 1,090 1,105 Tangible assets (non-GAAP) $ 94,338 $ 93,521 $ 93,118 $ 92,731 $ 88,679 Tangible common equity to tangible assets ratio (non-GAAP) 9.90 % 9.86 % 9.92 % 9.88 % 10.26 % Common Equity Tier 1 at period end Key shareholders’ equity (GAAP) $ 10,705 $ 10,590 $ 10,603 - - Less: Preferred Stock, Series A (b) 281 281 281 - - Common Equity Tier 1 capital before adjustments and deductions 10,424 10,309 10,322 - - Less: Goodwill, net of deferred taxes 1,037 1,034 1,036 - - Intangible assets, net of deferred taxes 30 33 36 - - Deferred tax assets 1 1 1 - - Net unrealized gains (losses) on available-for-sale securities, net of
deferred taxes 55 - 52 - - Accumulated gains (losses) on cash flow hedges, net of deferred taxes 20 (20) (8) - - Amounts in accumulated other comprehensive income (loss) attributed to pension and postretirement benefit costs, net of deferred taxes (386) (361) (364) - - Total Common Equity Tier 1 capital (c) $ 9,667 $ 9,622 $ 9,569 - - Net risk-weighted assets (regulatory) (c) $ 91,998 $ 89,851 $ 89,967 - - Common Equity Tier 1 ratio (non-GAAP) (c) 10.51 % 10.71 % 10.64 % - - Tier 1 common equity at period end Key shareholders’ equity (GAAP) - - $ 10,530 $ 10,486 Qualifying capital securities - - 339 340 Less: Goodwill - - - 1,057 1,051 Accumulated other comprehensive income (loss) (d) - - - (395) (366) Other assets (e) - - - 83 110 Total Tier 1 capital (regulatory) - - - 10,124 10,031 Less: Qualifying capital securities - - - 339 340 Preferred Stock, Series A (b) - - - 282 282 Total Tier 1 common equity (non-GAAP) - - - $ 9,503 $ 9,409 Net risk-weighted assets (regulatory) - - - $ 85,100 $ 83,547 Tier 1 common equity ratio (non-GAAP) - - - 11.17 % 11.26 % GAAP to Non-GAAP Reconciliation $ in millions 24 a) Three months ended 9/30/15, 6/30/15, 3/31/15, 12/31/14, and 9/30/14, exclude $50 million, $55 million, $61 million, $68 million, and $72 million, respectively, of period-end purchased credit card receivables b) Net of capital surplus c) 9-30-15 amount is estimated d) Includes net unrealized gains or losses on securities available for sale (except for net unrealized losses on marketable equity securities), net
gains or losses on cash flow hedges, and amounts resulting from the
application of the applicable accounting guidance for defined benefit and other postretirement plans e) Other assets deducted from Tier 1 capital and net risk-weighted assets consist of disallowed intangible assets (excluding goodwill) and
deductible portions of nonfinancial equity investments. There were no
disallowed deferred tax assets at December 31, 2014 and September 30, 2014. |
 Three
months ended 9-30-15
6-30-15 3-31-15 12-31-14 9-30-14 Pre-provision net revenue Net interest income (GAAP) $ 591 $ 584 $ 571 $ 582 $ 575 Plus: Taxable-equivalent adjustment 7 7 6 6 6 Noninterest income (GAAP) 470 488 437 490 417 Less: Noninterest expense (GAAP) 724 711 669 704 706 Pre-provision net revenue from continuing operations (non-GAAP) $ 344 $ 368 $ 345 $ 374 $ 292 Average tangible common equity Average Key shareholders’ equity (GAAP) $ 10,614 $ 10,590 $ 10,570 $ 10,562 $ 10,473 Less: Intangible assets (average) (a) 1,083 1,086 1,089 1,096 1,037 Preferred Stock, Series A (average) 290 290 290 291 291 Average tangible common equity (non-GAAP) $ 9,241 $ 9,214 $ 9,191 $ 9,175 $ 9,145 Return on average tangible common equity from continuing operations Net income (loss) from continuing operations attributable to Key common shareholders (GAAP) $ 216 $ 230 $ 222 $ 246 $ 197 Average tangible common equity (non-GAAP) 9,241 9,214 9,191 9,175 9,145 Return on average tangible common equity from continuing operations (non-GAAP)
9.27 % 10.01 % 9.80 % 10.64 % 8.55 % Return on average tangible common equity consolidated Net income (loss) attributable to Key common shareholders (GAAP) $ 213 $ 233 $ 227 $ 248 $ 180 Average tangible common equity (non-GAAP) 9,241 9,214 9,191 9,175 9,145 Return on average tangible common equity consolidated (non-GAAP) 9.14 % 10.14 % 10.02 % 10.72 % 7.81 % Cash efficiency ratio Noninterest expense (GAAP) $ 724 $ 711 $ 669 $ 704 $ 706 Less: Intangible asset amortization (GAAP) 9 9 9 10 10 Adjusted noninterest expense (non-GAAP) $ 715 $ 702 $ 660 $ 694 $ 696 Net interest income (GAAP) $ 591 $ 584 $ 571 $ 582 $ 575 Plus: Taxable-equivalent adjustment 7 7 6 6 6 Noninterest income (GAAP) 470 488 437 490 417 Total taxable-equivalent revenue (non-GAAP) $ 1,068 $ 1,079 $ 1,014 $ 1,078 $ 998 Cash efficiency ratio (non-GAAP) 66.9 % 65.1 % 65.1 % 64.4 % 69.7 % GAAP to Non-GAAP Reconciliation (continued) $ in millions (a) Three months ended 9/30/15, 6/30/15, 3/31/15, 12/31/14, and 9/30/14 exclude $52 million, $58 million, $64 million, $69 million, and $76 million,
respectively, of average purchased credit card receivable
intangible assets 25 |
 KeyCorp & Subsidiaries $ in billions Quarter ended September 30, 2015 Common Equity Tier 1 under current RCR $ 9.7
Adjustments from current RCR to the fully phased-in RCR: Deferred tax assets and other intangible assets (b) - Common Equity Tier 1 anticipated under the fully phased-in RCR (c) $ 9.6
Net risk-weighted assets under current RCR
$
92.0 Adjustments from
current RCR to the fully phased-in RCR:
Mortgage servicing assets (d) .5 All other assets (e) - Total risk-weighted assets anticipated under the fully phased-in RCR (c) $ 92.5
Common Equity Tier 1 under the fully phased-in RCR
10.4 % (a) Common Equity Tier 1 capital is a non-generally accepted accounting principle (GAAP) financial measure that is used by investors, analysts
and bank regulatory agencies to assess the capital position of financial
services companies. Management reviews Common Equity Tier 1 along with other measures of capital as part of its financial analyses (b) Includes the deferred tax asset subject to future taxable income for realization, primarily tax credit carryforwards, as well as intangible assets (other than goodwill and mortgage servicing assets) subject to the transition provisions of the final rule.
(c) The anticipated amount of regulatory capital and risk-weighted assets is based upon the federal banking agencies’ Regulatory Capital
Rules (as fully phased-in on January 1, 2019); Key is subject to the
Regulatory Capital Rules under the “standardized approach”
(d) Item is included in the 10%/15% exceptions bucket calculation and is risk-weighted at 250%
(e) Under the fully implemented rule, certain deferred tax assets and intangible assets subject to the transition provision are no longer required to
be risk-weighted because they are deducted directly from
capital. Table may not foot due to rounding
26 Common Equity Tier 1 Under the Regulatory Capital Rules (RCR) (estimated) (a) |
Exhibit 99.3
Consolidated Balance Sheets
(dollars in millions)
| 9-30-15 | 6-30-15 | 9-30-14 | ||||||||||
| Assets |
||||||||||||
| Loans |
$ | 60,085 | $ | 58,264 | $ | 56,155 | ||||||
| Loans held for sale |
916 | 835 | 784 | |||||||||
| Securities available for sale |
14,376 | 14,244 | 12,245 | |||||||||
| Held-to-maturity securities |
4,936 | 5,022 | 4,997 | |||||||||
| Trading account assets |
811 | 674 | 965 | |||||||||
| Short-term investments |
1,964 | 3,222 | 2,342 | |||||||||
| Other investments |
691 | 703 | 822 | |||||||||
|
|
|
|
|
|
|
|||||||
| Total earning assets |
83,779 | 82,964 | 78,310 | |||||||||
| Allowance for loan and lease losses |
(790 | ) | (796 | ) | (804 | ) | ||||||
| Cash and due from banks |
470 | 693 | 651 | |||||||||
| Premises and equipment |
771 | 788 | 832 | |||||||||
| Operating lease assets |
315 | 296 | 304 | |||||||||
| Goodwill |
1,060 | 1,057 | 1,051 | |||||||||
| Other intangible assets |
74 | 83 | 126 | |||||||||
| Corporate-owned life insurance |
3,516 | 3,502 | 3,456 | |||||||||
| Derivative assets |
793 | 536 | 413 | |||||||||
| Accrued income and other assets |
3,348 | 3,314 | 3,024 | |||||||||
| Discontinued assets |
2,086 | 2,169 | 2,421 | |||||||||
|
|
|
|
|
|
|
|||||||
| Total assets |
$ | 95,422 | $ | 94,606 | $ | 89,784 | ||||||
|
|
|
|
|
|
|
|||||||
| Liabilities |
||||||||||||
| Deposits in domestic offices: |
||||||||||||
| NOW and money market deposit accounts |
$ | 37,301 | $ | 36,024 | $ | 33,941 | ||||||
| Savings deposits |
2,338 | 2,370 | 2,390 | |||||||||
| Certificates of deposit ($100,000 or more) |
2,001 | 2,032 | 2,533 | |||||||||
| Other time deposits |
3,020 | 3,105 | 3,338 | |||||||||
|
|
|
|
|
|
|
|||||||
| Total interest-bearing deposits |
44,660 | 43,531 | 42,202 | |||||||||
| Noninterest-bearing deposits |
25,985 | 26,640 | 25,697 | |||||||||
| Deposits in foreign office — interest-bearing |
428 | 498 | 557 | |||||||||
|
|
|
|
|
|
|
|||||||
| Total deposits |
71,073 | 70,669 | 68,456 | |||||||||
| Federal funds purchased and securities sold under repurchase agreements |
407 | 444 | 657 | |||||||||
| Bank notes and other short-term borrowings |
677 | 528 | 996 | |||||||||
| Derivative liabilities |
676 | 560 | 384 | |||||||||
| Accrued expense and other liabilities |
1,562 | 1,537 | 1,613 | |||||||||
| Long-term debt |
10,310 | 10,267 | 7,172 | |||||||||
| Discontinued liabilities |
— | — | 3 | |||||||||
|
|
|
|
|
|
|
|||||||
| Total liabilities |
84,705 | 84,005 | 79,281 | |||||||||
| Equity |
||||||||||||
| Preferred stock, Series A |
290 | 290 | 291 | |||||||||
| Common shares |
1,017 | 1,017 | 1,017 | |||||||||
| Capital surplus |
3,914 | 3,898 | 3,984 | |||||||||
| Retained earnings |
8,764 | 8,614 | 8,082 | |||||||||
| Treasury stock, at cost |
(3,008 | ) | (2,884 | ) | (2,563 | ) | ||||||
| Accumulated other comprehensive income (loss) |
(272 | ) | (345 | ) | (325 | ) | ||||||
|
|
|
|
|
|
|
|||||||
| Key shareholders’ equity |
10,705 | 10,590 | 10,486 | |||||||||
| Noncontrolling interests |
12 | 11 | 17 | |||||||||
|
|
|
|
|
|
|
|||||||
| Total equity |
10,717 | 10,601 | 10,503 | |||||||||
|
|
|
|
|
|
|
|||||||
| Total liabilities and equity |
$ | 95,422 | $ | 94,606 | $ | 89,784 | ||||||
|
|
|
|
|
|
|
|||||||
| Common shares outstanding (000) |
835,285 | 843,608 | 868,477 | |||||||||
Consolidated Statements of Income
(dollars in millions, except per share amounts)
| Three months ended | Nine months ended | |||||||||||||||||||
| 9-30-15 | 6-30-15 | 9-30-14 | 9-30-15 | 9-30-14 | ||||||||||||||||
| Interest income |
||||||||||||||||||||
| Loans |
$ | 542 | $ | 532 | $ | 531 | $ | 1,597 | $ | 1,576 | ||||||||||
| Loans held for sale |
10 | 12 | 4 | 29 | 13 | |||||||||||||||
| Securities available for sale |
75 | 72 | 67 | 217 | 210 | |||||||||||||||
| Held-to-maturity securities |
24 | 24 | 25 | 72 | 70 | |||||||||||||||
| Trading account assets |
5 | 5 | 6 | 15 | 19 | |||||||||||||||
| Short-term investments |
1 | 2 | 2 | 5 | 4 | |||||||||||||||
| Other investments |
4 | 5 | 4 | 14 | 16 | |||||||||||||||
|
|
|
|
|
|
|
|
|
|
|
|||||||||||
| Total interest income |
661 | 652 | 639 | 1,949 | 1,908 | |||||||||||||||
| Interest expense |
||||||||||||||||||||
| Deposits |
27 | 26 | 28 | 79 | 91 | |||||||||||||||
| Federal funds purchased and securities sold under repurchase agreements |
— | — | 1 | — | 2 | |||||||||||||||
| Bank notes and other short-term borrowings |
2 | 2 | 2 | 6 | 6 | |||||||||||||||
| Long-term debt |
41 | 40 | 33 | 118 | 98 | |||||||||||||||
|
|
|
|
|
|
|
|
|
|
|
|||||||||||
| Total interest expense |
70 | 68 | 64 | 203 | 197 | |||||||||||||||
|
|
|
|
|
|
|
|
|
|
|
|||||||||||
| Net interest income |
591 | 584 | 575 | 1,746 | 1,711 | |||||||||||||||
| Provision for credit losses |
45 | 41 | 19 | 121 | 35 | |||||||||||||||
|
|
|
|
|
|
|
|
|
|
|
|||||||||||
| Net interest income after provision for credit losses |
546 | 543 | 556 | 1,625 | 1,676 | |||||||||||||||
| Noninterest income |
||||||||||||||||||||
| Trust and investment services income |
108 | 111 | 99 | 328 | 291 | |||||||||||||||
| Investment banking and debt placement fees |
109 | 141 | 88 | 318 | 271 | |||||||||||||||
| Service charges on deposit accounts |
68 | 63 | 68 | 192 | 197 | |||||||||||||||
| Operating lease income and other leasing gains |
15 | 24 | 17 | 58 | 81 | |||||||||||||||
| Corporate services income |
57 | 43 | 42 | 143 | 125 | |||||||||||||||
| Cards and payments income |
47 | 47 | 42 | 136 | 123 | |||||||||||||||
| Corporate-owned life insurance income |
30 | 30 | 26 | 91 | 80 | |||||||||||||||
| Consumer mortgage income |
3 | 4 | 3 | 10 | 7 | |||||||||||||||
| Mortgage servicing fees |
11 | 9 | 9 | 33 | 35 | |||||||||||||||
| Net gains (losses) from principal investing |
11 | 11 | 9 | 51 | 60 | |||||||||||||||
| Other income (a) |
11 | 5 | 14 | 35 | 37 | |||||||||||||||
|
|
|
|
|
|
|
|
|
|
|
|||||||||||
| Total noninterest income |
470 | 488 | 417 | 1,395 | 1,307 | |||||||||||||||
| Noninterest expense |
||||||||||||||||||||
| Personnel |
426 | 408 | 405 | 1,223 | 1,182 | |||||||||||||||
| Net occupancy |
60 | 66 | 66 | 191 | 198 | |||||||||||||||
| Computer processing |
41 | 42 | 39 | 121 | 118 | |||||||||||||||
| Business services and professional fees |
40 | 42 | 36 | 115 | 118 | |||||||||||||||
| Equipment |
22 | 22 | 25 | 66 | 73 | |||||||||||||||
| Operating lease expense |
11 | 12 | 11 | 34 | 31 | |||||||||||||||
| Marketing |
17 | 15 | 15 | 40 | 33 | |||||||||||||||
| FDIC assessment |
8 | 8 | 9 | 24 | 21 | |||||||||||||||
| Intangible asset amortization |
9 | 9 | 10 | 27 | 29 | |||||||||||||||
| OREO expense, net |
2 | 1 | 1 | 5 | 3 | |||||||||||||||
| Other expense |
88 | 86 | 89 | 258 | 251 | |||||||||||||||
|
|
|
|
|
|
|
|
|
|
|
|||||||||||
| Total noninterest expense |
724 | 711 | 706 | 2,104 | 2,057 | |||||||||||||||
|
|
|
|
|
|
|
|
|
|
|
|||||||||||
| Income (loss) from continuing operations before income taxes |
292 | 320 | 267 | 916 | 926 | |||||||||||||||
| Income taxes |
72 | 84 | 64 | 230 | 232 | |||||||||||||||
|
|
|
|
|
|
|
|
|
|
|
|||||||||||
| Income (loss) from continuing operations |
220 | 236 | 203 | 686 | 694 | |||||||||||||||
| Income (loss) from discontinued operations, net of taxes |
(3 | ) | 3 | (17 | ) | 5 | (41 | ) | ||||||||||||
|
|
|
|
|
|
|
|
|
|
|
|||||||||||
| Net income (loss) |
217 | 239 | 186 | 691 | 653 | |||||||||||||||
| Less: Net income (loss) attributable to noncontrolling interests |
(2 | ) | 1 | — | 1 | 6 | ||||||||||||||
|
|
|
|
|
|
|
|
|
|
|
|||||||||||
| Net income (loss) attributable to Key |
$ | 219 | $ | 238 | $ | 186 | $ | 690 | $ | 647 | ||||||||||
|
|
|
|
|
|
|
|
|
|
|
|||||||||||
| Income (loss) from continuing operations attributable to Key common shareholders |
$ | 216 | $ | 230 | $ | 197 | $ | 668 | $ | 671 | ||||||||||
| Net income (loss) attributable to Key common shareholders |
213 | 233 | 180 | 673 | 630 | |||||||||||||||
| Per common share |
||||||||||||||||||||
| Income (loss) from continuing operations attributable to Key common shareholders |
$ | .26 | $ | .27 | $ | .23 | $ | .79 | $ | .77 | ||||||||||
| Income (loss) from discontinued operations, net of taxes |
— | — | (.02 | ) | .01 | (.05 | ) | |||||||||||||
| Net income (loss) attributable to Key common shareholders (b) |
.26 | .28 | .21 | .80 | .72 | |||||||||||||||
| Per common share — assuming dilution |
||||||||||||||||||||
| Income (loss) from continuing operations attributable to Key common shareholders |
$ | .26 | $ | .27 | $ | .23 | $ | .78 | $ | .76 | ||||||||||
| Income (loss) from discontinued operations, net of taxes |
— | — | (.02 | ) | .01 | (.05 | ) | |||||||||||||
| Net income (loss) attributable to Key common shareholders (b) |
.25 | .27 | .21 | .79 | .71 | |||||||||||||||
| Cash dividends declared per common share |
$ | .075 | $ | .075 | $ | .065 | $ | .215 | $ | .185 | ||||||||||
| Weighted-average common shares outstanding (000) |
831,430 | 839,454 | 867,350 | 839,758 | 875,728 | |||||||||||||||
| Weighted-average common shares and potential common shares outstanding (000) (c) |
838,880 | 846,312 | 874,122 | 847,371 | 882,451 | |||||||||||||||
| (a) | For each of the three months ended September 30, 2015, June 30, 2015, and September 30, 2014, net securities gains (losses) totaled less than $1 million. For the three months ended September 30, 2015, June 30, 2015, and September 30, 2014, Key did not have any impairment losses related to securities. |
| (b) | Earnings per share may not foot due to rounding. |
| (c) | Assumes conversion of common share options and other stock awards and/or convertible preferred stock, as applicable. |
Serious News for Serious Traders! Try StreetInsider.com Premium Free!
You May Also Be Interested In
- KeyCorp (KEY) PT Lowered to $16 at UBS
- Netflix's subscribers, TSMC, Tesla upside - what's moving markets
- Engel & Völkers Dallas Fort Worth Presents $20,824 to Special Olympics
Create E-mail Alert Related Categories
SEC FilingsSign up for StreetInsider Free!
Receive full access to all new and archived articles, unlimited portfolio tracking, e-mail alerts, custom newswires and RSS feeds - and more!
