Form 8-K KEMPER Corp For: Sep 20
UNITED STATES
SECURITIES AND EXCHANGE COMMISSION
Washington, D.C. 20549
Form 8-K
CURRENT REPORT
Pursuant to Section 13 or 15(d) of the
Securities Exchange Act of 1934
Date of Report (Date of earliest event reported): September 20, 2016
Kemper Corporation
(Exact name of registrant as specified in its charter)
Commission File Number: 001-18298
DE | 95-4255452 | |
(State or other jurisdiction of incorporation) | (IRS Employer Identification No.) | |
One East Wacker Drive, Chicago, IL 60601
(Address of principal executive offices, including zip code)
312-661-4600
(Registrant’s telephone number, including area code)
(Former name or former address, if changed since last report)
Check the appropriate box below if the Form 8-K filing is intended to simultaneously satisfy the filing obligation of the Registrant under any of the following provisions (see General Instruction A.2.below):
¨ | Written communications pursuant to Rule 425 under the Securities Act (17 CFR 230.425) |
¨ | Soliciting material pursuant to Rule 14a-12 under the Exchange Act (17 CFR 240.14a-12) |
¨ | Pre-commencement communications pursuant to Rule 14d-2(b) under the Exchange Act (17 CFR 240.14d-2(b)) |
¨ | Pre-commencement communications pursuant to Rule 13e-4(c) under the Exchange Act (17 CFR 240.13e-4(c)) |
Section 7. – Regulation FD
Item 7.01. Regulation FD Disclosure.
Exhibit 99.1 is a set of slides to be presented during a conference call being hosted by Kemper Corporation (“Kemper”) to share its strategic update for investors. The conference call will be held on Wednesday, September 21, 2016 at 3:00 p.m. Eastern (2:00 p.m. Central) and will be accessible by telephone at 866.393.1565 or via webcast on Kemper’s website. To listen via webcast, register online at the investor section on kemper.com at least 15 minutes prior to the webcast to install any necessary software and to download the presentation materials.
The information contained in this report is furnished and shall not be deemed filed for purposes of Section 18 of the Securities Exchange Act of 1934, as amended, or otherwise subject to the liabilities of that section, or incorporated by reference into any registration statement or other document filed pursuant to the Securities Act of 1933, as amended, except as expressly stated in such filing.
This report may contain or incorporate by reference information that includes or is based on forward-looking statements within the meaning of the safe-harbor provisions of the Private Securities Litigation Reform Act of 1995. Forward-looking statements give expectations or forecasts of future events, and can be identified by the fact that they relate to future actions, performance or results rather than strictly to historical or current facts.
Any or all forward-looking statements may turn out to be wrong, and, accordingly, readers are cautioned not to place undue reliance on such statements, which speak only as of the date of this report. Forward-looking statements involve a number of risks and uncertainties that are difficult to predict, and are not guarantees of future performance. Among the general factors that could cause actual results and financial condition to differ materially from estimated results and financial condition are those listed in periodic reports filed by Kemper with the Securities Exchange Commission (the “SEC”). No assurances can be given that the results and financial condition contemplated in any forward-looking statements will be achieved or will be achieved in any particular timetable. Kemper assumes no obligation to publicly correct or update any forward-looking statements as a result of events or developments subsequent to the date of this report. The reader is advised, however, to consult any further disclosures Kemper makes on related subjects in its filings with the SEC.
Section 9. – Financial Statements and Exhibits
Item 9.01. Financial Statements and Exhibits.
(d) Exhibits
99.1 Presentation materials for Kemper’s Strategic Update for Investors call on September 21, 2016.
SIGNATURES
Pursuant to the requirements of the Securities Exchange Act of 1934, the Registrant has duly caused this report to be signed on its behalf by the undersigned hereunto duly authorized.
Kemper Corporation | ||||
Date: | September 21, 2016 | /s/ Richard Roeske | ||
Richard Roeske | ||||
Vice President and Chief Accounting Officer | ||||
Exhibit Index
99.1 | Presentation materials for Kemper’s Strategic Update for Investors call on September 21, 2016. | ||

Strategic Update
for Investors
September 21, 2016

2 Strategic Update for Investors – September 21, 2016
Caution Regarding Forward-looking Statements
This presentation may contain or incorporate by reference information that includes or is based on
forward-looking statements within the meaning of the safe-harbor provisions of the Private
Securities Litigation Reform Act of 1995. Forward-looking statements give expectations or forecasts
of future events, and can be identified by the fact that they relate to future actions, performance or
results rather than strictly to historical or current facts.
Any or all forward-looking statements may turn out to be wrong, and, accordingly, Kemper cautions
readers not to place undue reliance on such statements. Kemper bases these statements on current
expectations and the current economic environment as of the date of this presentation. They
involve a number of risks and uncertainties that are difficult to predict. These statements are not
guarantees of future performance; actual results could differ materially from those expressed or
implied in the forward-looking statements. Forward-looking statements can be affected by
inaccurate assumptions or by known or unknown risks and uncertainties that may be important in
determining the company’s actual future results and financial condition. Kemper assumes no
obligation to publicly correct or update any forward-looking statements as a result of events or
developments subsequent to the date of this presentation. Kemper advises the reader to consult
any further disclosures Kemper makes on related subjects in its filings with the SEC.
This presentation contains non-GAAP financial measures that the company believes are meaningful
to investors. Non-GAAP financial measures are defined and reconciled to the most comparable
GAAP financial measure at the end of this report.
Data in this presentation is as of and for the period ending June 30, 2016 unless otherwise stated

3 Strategic Update for Investors – September 21, 2016
Strategy Outline
• Current State
• Resetting the Table
– Strategic focus
– Senior executive team
– Our businesses
• Our Path Forward
• Progress Made in 2016
• The Case for Kemper

4 Strategic Update for Investors – September 21, 2016
Baseline: Year End 2015
• Unclear strategic framework & focus
– Limited external focus
– Constrained analytical curiosity
• Financial underperformance
– Low earnings & ROE
– Declining revenue
– Heavy expense base
• Significant “deferred maintenance”
– Aging IT infrastructure
– Dated processes
• Culture of complacency
– Diffusion of accountability
– Collaboration impeded
1 See Non-GAAP Financial Measures in Appendix
2 Source: SNL Financial
Average Normalized Earnings from 2011-20151
Price to Book Value versus ROE-20152
G
ro
w
th
Legacy Non-
Standard Auto
Alliance United
Preferred Home and Auto
Life & Health
Bubble sized with avg. of
Earned Premium from
2011-2015
(AU last 12 months)
Normalized
Earnings
-20%
-10%
0%
10%
20%
30%
25 75
A
vg.
P
rice
t
o
B
o
o
k
V
al
u
e
-
2
0
1
5
ALL
CINF
HIG HMN KMPR
MCY
NGHC
PGR
SIGI
STFC
THG
TRV
50%
150%
250%
0% 5% 10% 15% 20%
2015 Return on Equity

5 Strategic Update for Investors – September 21, 2016
Current State
Strong capital position
• More than $200MM of excess capital
• Steady capital creation from life businesses
Distinguished brand
• Recognized in market
• Positive impression yet undefined
Flexible regulatory foundation
• Broadly licensed (multiple products) in 50 states
Broad business portfolio
• Diversified product platforms
• Non-correlated risks
• Leverageable growth opportunities
Strong Investments function
• Outperform similarly sized peers
Proven senior executive team
• Broad experience
• Track record of results
Poor execution
Limited strategic focus
• Overall and within specific businesses
Culture of complacency
Financial underperformance
• Declining revenues
• Heavy expense base
Weak technology infrastructure
• Aging platforms
• Dated and slow processes to update and maintain
• Lack of agility
Tangible Strengths
Tremendous unrealized potential
Fixable Weaknesses

Resetting the Table

7 Strategic Update for Investors – September 21, 2016
Strategic Focus
• Focus on consumer-related businesses with niche opportunities that:
– Target underserved markets
– Have limited, weak or unfocused competition
– Require unique expertise (underwriting, claim, distribution, other)
• Build and leverage key core capabilities:
– Nimble—ability to take advantage of opportunities quickly
– Execution excellence
– Disciplined underwriting and risk management
– Business intelligence and analytics expertise
– Efficient expense structure
– Optimal technology utilization
• Create value organically and through M&A
• Produce high single-digit/low double-digit ROE and grow BVPS consistently
Utilize scale and nimbleness as advantage

8 Strategic Update for Investors – September 21, 2016
Senior Executive Team
Experienced leadership team with proven history of delivering results
Joe Lacher
President and
Chief Executive Officer
• 20+ years of insurance industry experience
• Joined Kemper in 2015; Track record of turning around under-
performing businesses to realize their full potential
• Previous experience: Allstate, Travelers
John Boschelli
Chief Investment Officer
• 25+ years of insurance industry experience; Rejoined Kemper in 1997
• Held various investment, finance and accounting positions
Charles Brooks
Chief Information Officer
• 25+ years of IT and operations experience; Joined Kemper in 2016
• Previous experience: ACE Group, Travelers and Accenture
Chip Dufala
President, Property & Casualty
• 20+ years of insurance industry experience; Joined Kemper in 2016
• Previous experience: Senior sales and operational roles at Erie Ins.
Tom Evans
Secretary & General Counsel
• 30+ years of legal experience, majority in the insurance industry
• Joined Kemper in 1992; served in various legal roles
Mark Green
President, Life & Health
• 25+ years of insurance industry experience; Joined Kemper in 2016
• Previous experience: Allstate, AIX Group, Wells Fargo Ins., Chubb
Jim McKinney
Chief Financial Officer
• 14+ years of finance experience; Joining Kemper in November
• Previous experience: Banc of California, AerCap, RBS Citizens, KPMG
Christine Mullins
Chief Human Resources Officer
• 25+ years of human resources experience; Joining Kemper in October
• Previous experience: CEO.works, Zurich, Motorola

9 Strategic Update for Investors – September 21, 2016
Life & Health
Our Results
Market & consumer focus
• Modest income consumers
• Simple “final expense” type life product
• Limited, diffused, smaller competition
• Consistently profitable segment
Keys to success
• Efficient and consistent pricing, underwriting and claim functions
• Strong and cost-conscious distribution
Priorities
• Finalize the replacement of policy administration system
• Expand current distribution model; evaluate new distribution sources
• Move beyond DMF issue
Life Insurance
Market & consumer focus
• Indemnity medical supplemental products
• Rural and dissatisfied ACA consumers
• Limited larger or sophisticated players
Keys to success
• Being opportunistic and nimble when addressing market gaps
• Efficient distribution of product
Priorities
• Evaluate new products to take advantage of market disruption
• Higher-yielding distribution capabilities
Health Insurance
1 See Non-GAAP Financial Measures in Appendix
² 2015 normalized for deferred premium adjustment
0
50
100
2011 2012 2013 2014 2015 1H16
Normalized Earnings¹
(10)%
(5)%
0%
5%
2011 2012 2013 2014 2015 1H16
Growth Rate²
($MM)

10 Strategic Update for Investors – September 21, 2016
Property & Casualty
Market & consumer focus
• Regional independent agency player
• Main Street consumer focus
• Historically leveraged package product strength
Keys to success
• Product/pricing sophistication
• Claims effectiveness
• Ease of doing business
Priorities
• Finish program to replace policy administration and agency
interface systems
• Overhaul claim capabilities
• Expand homeowners capability
• Lead with homeowners strength; deliver auto at parity
• Intensify business intelligence and analytics competency
1 Includes Preferred Personal Automobile, Homeowners and Other Personal Lines Insurance
2 See Non-GAAP Financial Measures in Appendix
Preferred Personal Lines1 Our Results
80%
95%
110%
2011 2012 2013 2014 2015 1H16
Normalized Combined Ratio²
(15)%
(10)%
(5)%
0%
2011 2012 2013 2014 2015 1H16
Written Premium Growth Rate
11 Strategic Update for Investors – September 21, 2016
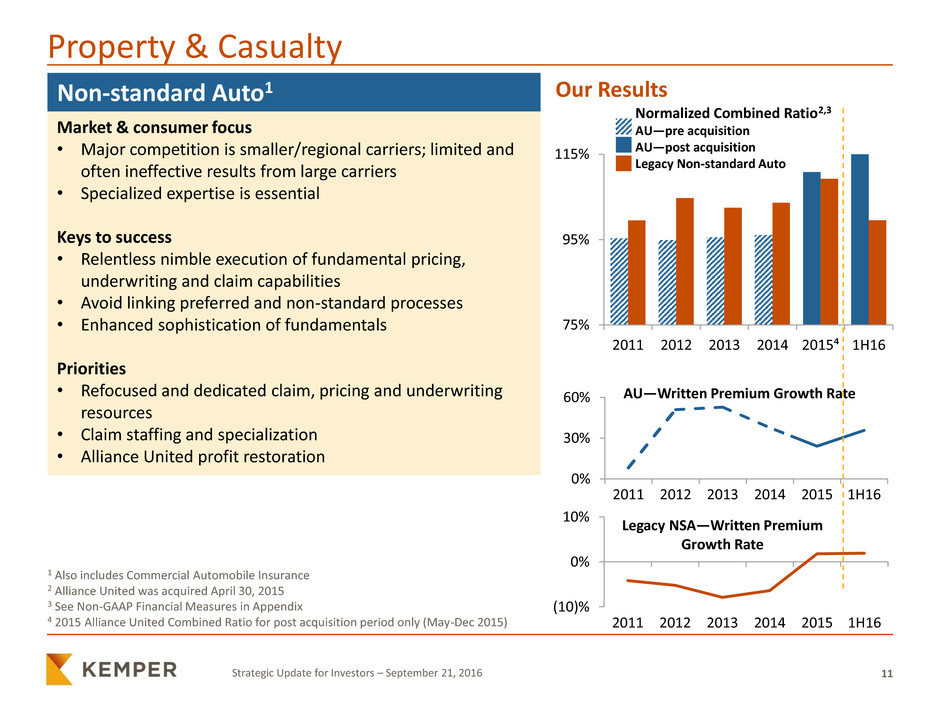
75%
95%
115%
2011 2012 2013 2014 2015⁴ 1H16
Property & Casualty
Market & consumer focus
• Major competition is smaller/regional carriers; limited and
often ineffective results from large carriers
• Specialized expertise is essential
Keys to success
• Relentless nimble execution of fundamental pricing,
underwriting and claim capabilities
• Avoid linking preferred and non-standard processes
• Enhanced sophistication of fundamentals
Priorities
• Refocused and dedicated claim, pricing and underwriting
resources
• Claim staffing and specialization
• Alliance United profit restoration
Non-standard Auto1
1 Also includes Commercial Automobile Insurance
2 Alliance United was acquired April 30, 2015
3 See Non-GAAP Financial Measures in Appendix
4 2015 Alliance United Combined Ratio for post acquisition period only (May-Dec 2015)
Normalized Combined Ratio2,3
AU—pre acquisition
AU—post acquisition
Legacy Non-standard Auto
Our Results
0%
30%
60%
2011 2012 2013 2014 2015 1H16
AU—Written Premium Growth Rate
(10)%
0%
10%
2011 2012 2013 2014 2015 1H16
Legacy NSA—Written Premium
Growth Rate

12 Strategic Update for Investors – September 21, 2016
Investments
Goal
Balance risk and return to maximize investment portfolio’s
after-tax yield and total return
Approach to Investment Management
• Take advantage of multi-line businesses allowing for greater
optimization and asset diversification
• Collaborate within the group and among our internal and
external partners
• Combine top-down and bottom-up analyses with an emphasis
on risk management
• Encourage proactive and innovative problem-solving
• Adapt quickly to the constantly evolving investment landscape
• Execute strategy opportunistically and efficiently using our
size to our advantage
Track Record
Returns (yields & total return) have been strong relative to the
industry while maintaining a similar risk profile
4,542
542
365
295
532
441
2Q16
Investment Portfolio
Total Investments: $6,717MM
3,033
1,647
294
110
2Q16
Fixed Maturity Portfolio
Total Fixed Maturities: $5,084MM
Other1
Alternative Inv.2
Equities3
Non-Inv. Grade FM
Inv. Grade FM
Short-term
Other
Muni’s
Corporate Bonds &
Notes
US Gov’t & Agencies
($MM)
($MM)
1 Includes $291MM of policyholder loans, $145MM of Real Estate and $5MM of other investments
2 Includes $134MM of Fair Value Option Investments, $183MM of Equity Method Limited Liability
Investments and $215MM of Other Equity Interests at Fair Value
3 Excludes $215MM of Other Equity Interests at Fair Value

13 Strategic Update for Investors – September 21, 2016
Path Forward to Unlock Embedded Value
W
or
k /
E
ff
or
t
• Assemble top quality leadership team
• Resolve DMF/UCP issue
• Refocus & strengthen Non-standard Auto
competency
• Restore Alliance United profitability
Broader
• Reinvigorate culture
• Focus on relentlessly delivering execution excellence
• Expand and fully leverage business intelligence & analytics capabilities
Phase 1—Key Elements:
Grow
Build &
Leverage,
Rebuild
Phase 1 Phase 2 Phase 3
Incubate
• Redesign P&C claim service delivery model
• Complete IT re-platforming in P&C and Life
• Reset expense base & ongoing expense
management
Specific

14 Strategic Update for Investors – September 21, 2016
Life Insurance Claims—DMF/Unclaimed Property Issue
• Some insurers used Social Security Death Master File (DMF) to halt annuities but
failed to see if person also had life policy—had notice of death but did not pay claim
• Kemper was not one of those companies
• Officials imposed penalties and reforms on the offending companies
• Consensus among states on proper DMF use for non-offending companies never
materialized
• Social Security Administration admits DMF is flawed—urges data verification
• Some officials took simplistic approaches to a complex issue in new laws and
regulations
Background
• Kemper voluntarily implementing a process to use DMF and other databases to
identify and investigate instances where beneficiary may have failed to file claim
• Good customer service suggests reasonable use of DMF even if solid legal
arguments support other viewpoint
• Process will result in estimated after-tax charge of $50 million in 3Q16
Kemper’s Go-Forward Approach
15 Strategic Update for Investors – September 21, 2016
Restore Alliance United Profitability
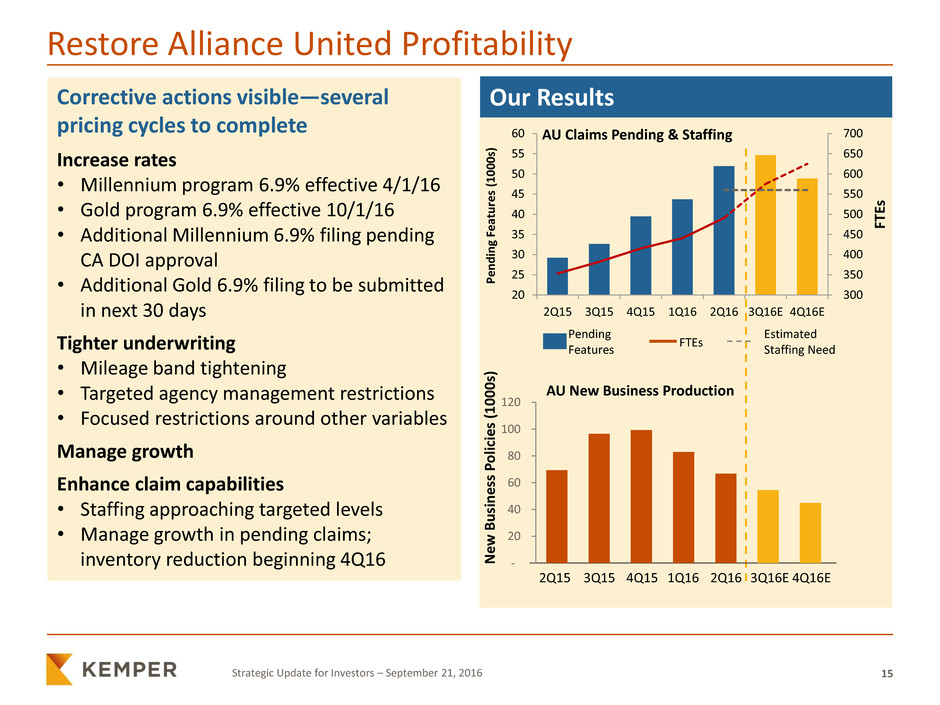
Corrective actions visible—several
pricing cycles to complete
Increase rates
• Millennium program 6.9% effective 4/1/16
• Gold program 6.9% effective 10/1/16
• Additional Millennium 6.9% filing pending
CA DOI approval
• Additional Gold 6.9% filing to be submitted
in next 30 days
Tighter underwriting
• Mileage band tightening
• Targeted agency management restrictions
• Focused restrictions around other variables
Manage growth
Enhance claim capabilities
• Staffing approaching targeted levels
• Manage growth in pending claims;
inventory reduction beginning 4Q16
Our Results
AU Claims Pending & Staffing
AU New Business Production
Ne
w
Bu
si
n
ess
P
o
lic
ie
s
(1
0
0
0
s)
2Q15 3Q15 4Q15 1Q16 2Q16 3Q16E 4Q16E
Pending
Features
FTEs
Estimated
Staffing Need
-
20
40
60
80
100
120
300
350
400
450
500
550
600
650
700
20
25
30
35
40
45
50
55
60
2Q15 3Q15 4Q15 1Q16 2Q16 3Q16E 4Q16E
FT
Es
Pe
n
d
in
g F
e
at
u
re
s
(1000
s)
16 Strategic Update for Investors – September 21, 2016
P&C Claims Effectiveness
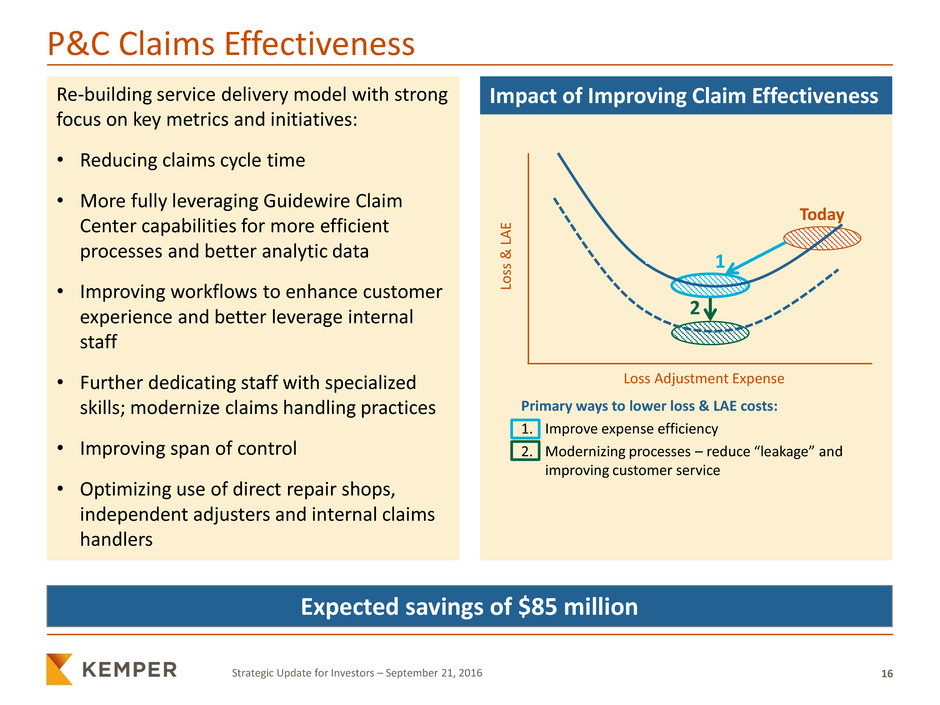
Re-building service delivery model with strong
focus on key metrics and initiatives:
• Reducing claims cycle time
• More fully leveraging Guidewire Claim
Center capabilities for more efficient
processes and better analytic data
• Improving workflows to enhance customer
experience and better leverage internal
staff
• Further dedicating staff with specialized
skills; modernize claims handling practices
• Improving span of control
• Optimizing use of direct repair shops,
independent adjusters and internal claims
handlers
Expected savings of $85 million
Primary ways to lower loss & LAE costs:
1. Improve expense efficiency
2. Modernizing processes – reduce “leakage” and
improving customer service
Loss Adjustment Expense
Loss
&
LA
E
1
2
Today
Impact of Improving Claim Effectiveness

17 Strategic Update for Investors – September 21, 2016
Property & Casualty—Key Technology Investments
• Multi-year effort to upgrade key
components of core legacy systems
• Enterprise claims system upgrade
completed—in process of being fully
leveraged
• Finished 2 of 4 development phases of new
Preferred platform
• Initial phase of new Non-standard Auto
platform under development
• Remaining components of core systems
architecture are currently adequate
• New platforms will:
– Enable more sophisticated products
– Reduce operational costs
– Be scalable for organic/inorganic growth
Policy
Administration
Sales
CRM
Data
Warehouse
Billing Rating
Claims
P
Scope of
current
project
AgencyPort
Guidewire
Enhancing current
Agency Front End Policyholder Experience
P Complete
P&C Technology Framework

18 Strategic Update for Investors – September 21, 2016
Expense Management
Goal:
Reduce expenses $50MM - $65MM by YE18
Competitively priced products require further expense discipline
Expenses1
Initiatives:
• Increase utilization of shared services &
outsourcing
• Increase automation and consolidate
activities
• Improved vendor management
• Increased span of control
2016-2017 Actions
Realization of Net Expense Savings
$20MM Actions already taken
$20MM - $25MM Savings to be realized by YE17
$10MM - $20MM Savings to be realized by YE18
$50MM - $65MM Savings
1 Includes General Expenses and Interest and Other
420 405 50 355 505 490
50
440
350 300
235-250
50-65
0
200
400
2015 1H16
Annualized
Initiatives Pro Forma
Expenses Savings($MM)

19 Strategic Update for Investors – September 21, 2016
Capital Deployment Priorities
1. Fund profitable organic growth—improve margins in all lines
2. Strategic acquisitions:
• Bolt-on Non-standard Auto and Preferred opportunities
• Leverage scale in Life operations
• Other niche specialized businesses
3. Return capital to shareholders:
• Maintain competitive dividends
• Repurchase shares
20 Strategic Update for Investors – September 21, 2016
Significant Progress Made During 2016
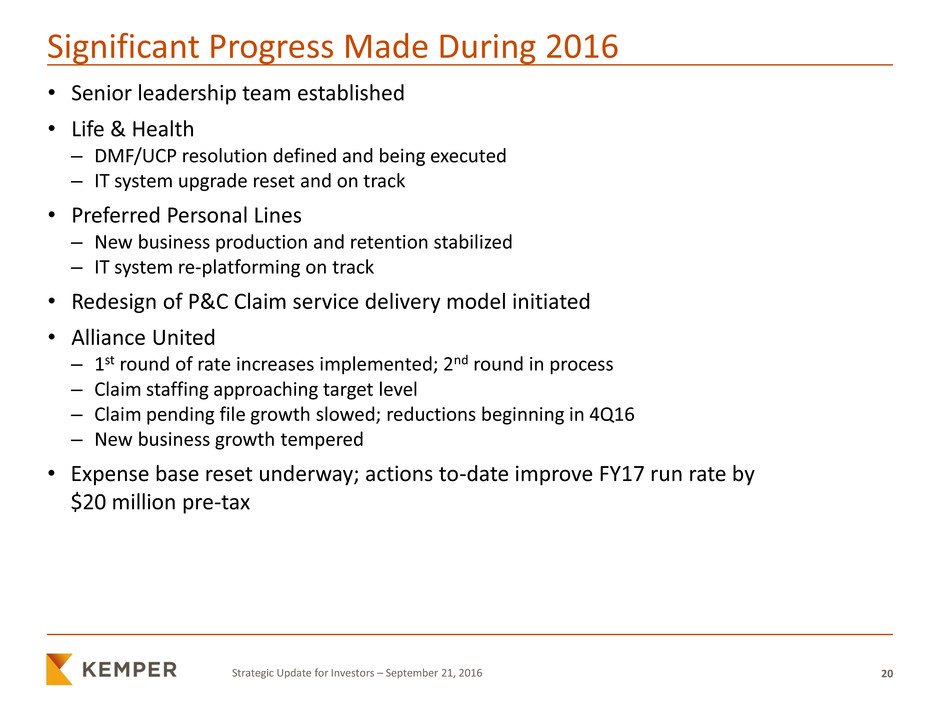
• Senior leadership team established
• Life & Health
– DMF/UCP resolution defined and being executed
– IT system upgrade reset and on track
• Preferred Personal Lines
– New business production and retention stabilized
– IT system re-platforming on track
• Redesign of P&C Claim service delivery model initiated
• Alliance United
– 1st round of rate increases implemented; 2nd round in process
– Claim staffing approaching target level
– Claim pending file growth slowed; reductions beginning in 4Q16
– New business growth tempered
• Expense base reset underway; actions to-date improve FY17 run rate by
$20 million pre-tax
21 Strategic Update for Investors – September 21, 2016
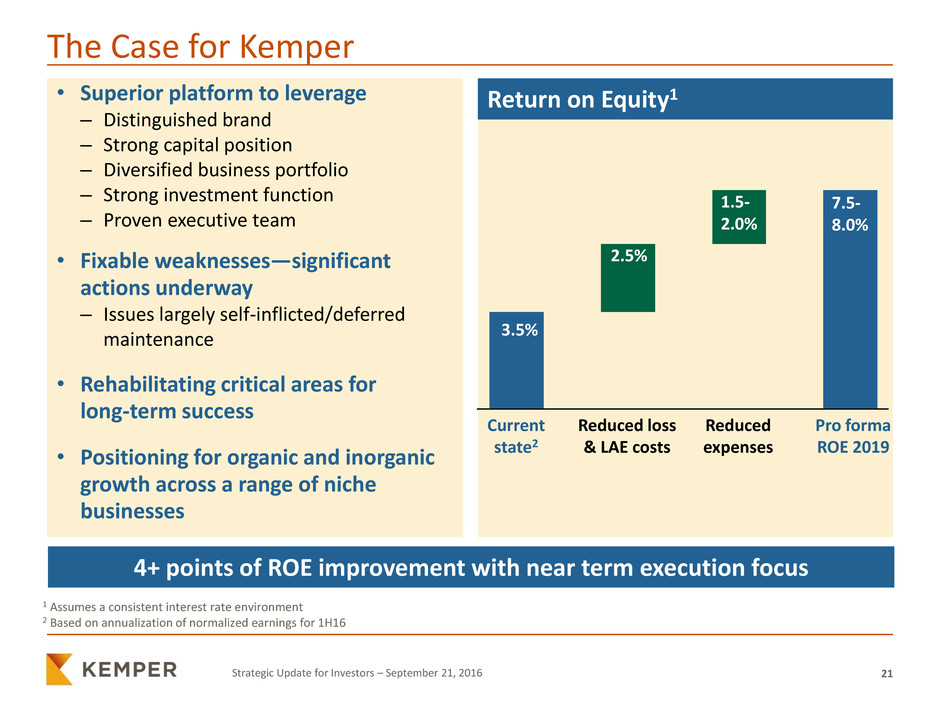
The Case for Kemper
• Superior platform to leverage
– Distinguished brand
– Strong capital position
– Diversified business portfolio
– Strong investment function
– Proven executive team
• Fixable weaknesses—significant
actions underway
– Issues largely self-inflicted/deferred
maintenance
• Rehabilitating critical areas for
long-term success
• Positioning for organic and inorganic
growth across a range of niche
businesses
Return on Equity1
5.0
9.0
Current
state2
Reduced loss
& LAE costs
Reduced
expenses
Pro forma
ROE 2019
3.5%
2.5%
1.5-
2.0%
7.5-
8.0%
4+ points of ROE improvement with near term execution focus
1 Assumes a consistent interest rate environment
2 Based on annualization of normalized earnings for 1H16

22 Strategic Update for Investors – September 21, 2016

Appendix

24 Strategic Update for Investors – September 21, 2016
Non-GAAP Financial Measures
Normalized Earnings is an after-tax, non-GAAP financial measure that is most directly comparable to the GAAP financial measure of
Segment or Product Line Net Operating Income. For the company’s Life & Health business, Normalized Earnings is calculated by 1)
normalizing catastrophe losses and LAE by removing the GAAP-reported amounts (including development) and including the
Company’s planned load for catastrophe losses and LAE, 2) excluding investment income in 2014 from one company that had sold
substantially all of its operations and 3) excluding an adjustment recorded in 2015 to correct deferred premium reserves on certain
limited pay life insurance policies. For the company’s Preferred Personal Lines and Legacy Non-standard Auto businesses, Normalized
Earnings is computed by normalizing catastrophe losses and LAE by removing the GAAP-reported amounts (including development)
and including the Company’s planned load for catastrophe losses and LAE. No adjustments were necessary to compute Normalized
Earnings for the Alliance United business. The Preferred Personal Lines business consists of Preferred Personal Automobile Insurance,
Homeowners Insurance and Other Personal Insurance product lines. The Legacy Non-standard Auto business consists of Non-
standard Personal Automobile Insurance, excluding Alliance United, and Commercial Automobile Insurance product lines.
Six Months
Ended
(Dollars in Millions) 2011 2012 2013 2014 2015 1H 2016
Life & Health
Net Operating Income 98.9$ 90.8$ 89.3$ 91.8$ 71.7$ 36.7$
Adjustments, After-tax:
Normalize Catastrophe Losses and LAE:
Rem ve: Catastrophe Losses and LAE
I l i g Development, as Reported 4.9 4.0 1.0 2.0 2.5 2.1
A : Catastrophe Losses and LAE at
Pla ned Load (3.6) (2.7) (2.3) (1.8) (1.8) (0.1)
Remove: Special Dividend From One Investment - - - (13.9) - -
Remove: Deferred Premium Reserve Adjustment - - - - 4.9 -
Total Adjustments, After-tax 1.3 1.3 (1.3) (13.7) 5.6 2.0
Normalized Earnings 100.2$ 92.1$ 88.0$ 78.1$ 77.3$ 38.7$
Year Ended December 31,

25 Strategic Update for Investors – September 21, 2016
Non-GAAP Financial Measures
Normalized Earnings (continued)
Six Months
Ended
(Dollars in Millions) 2011 2012 2013 2014 2015 1H 2016
Preferred Personal Lines
Net Operating Income (Loss) (45.1)$ (12.1)$ 90.4$ 57.3$ 55.2$ (6.2)$
Adjustments, After-Tax:
Normalize Catastrophe Losses and LAE:
Remove: Catastrophe Losses and LAE
Including Development, as Reported 94.8 69.7 20.1 50.1 34.3 45.3
Add: Catastrophe Losses and LAE at
Planned Load (33.9) (35.9) (43.0) (40.3) (35.0) (15.1)
Total Adjustments, After-tax 60.9 33.8 (22.9) 9.8 (0.7) 30.2
Normalized Earnings 15.8$ 21.7$ 67.5$ 67.1$ 54.5$ 24.0$
Legacy Non-standard Auto
Net Operating Income (Loss) 19.8$ 1.2$ 10.4$ 3.1$ (9.1)$ 4.6$
Adjustments, After-Tax:
Normalize Catastrophe Losses and LAE:
Remove: Catastrophe Losses and LAE
Including Development, as Reported 2.5 3.2 2.4 2.4 2.5 2.9
Add: Catastrophe Losses and LAE at
Planned Load (1.8) (1.8) (2.4) (2.1) (2.1) (1.5)
Total Adjustments, After-tax 0.7 1.4 - 0.3 0.4 1.4
Normalized Earnings 20.5$ 2.6$ 10.4$ 3.4$ (8.7)$ 6.0$
Year Ended December 31,
26 Strategic Update for Investors – September 21, 2016
Non-GAAP Financial Measures
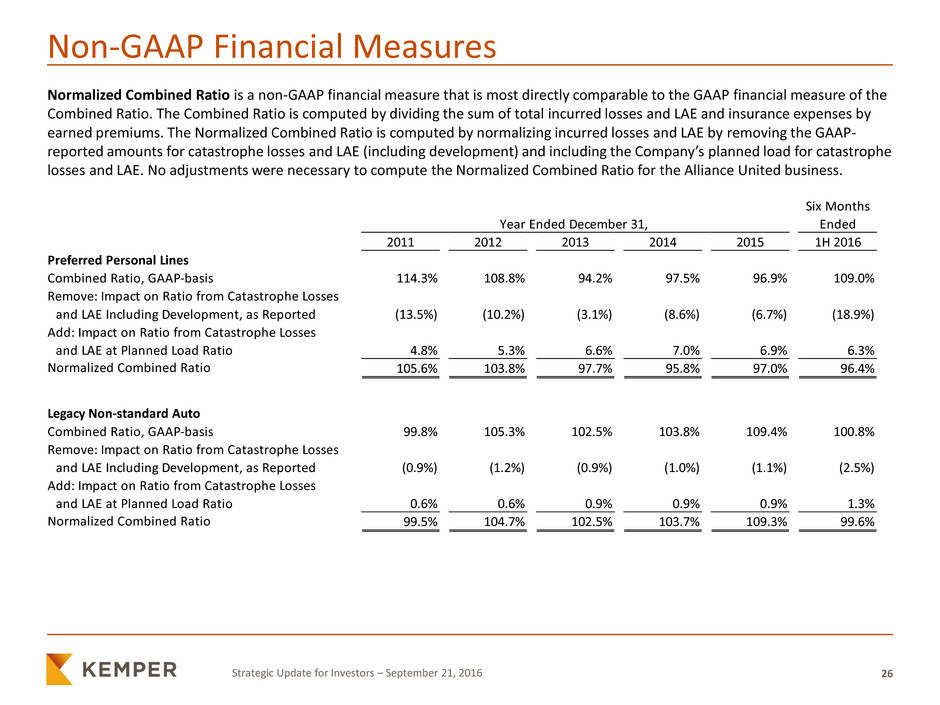
Normalized Combined Ratio is a non-GAAP financial measure that is most directly comparable to the GAAP financial measure of the
Combined Ratio. The Combined Ratio is computed by dividing the sum of total incurred losses and LAE and insurance expenses by
earned premiums. The Normalized Combined Ratio is computed by normalizing incurred losses and LAE by removing the GAAP-
reported amounts for catastrophe losses and LAE (including development) and including the Company’s planned load for catastrophe
losses and LAE. No adjustments were necessary to compute the Normalized Combined Ratio for the Alliance United business.
Six Months
Ended
2011 2012 2013 2014 2015 1H 2016
Preferred Personal Lines
Combined Ratio, GAAP-basis 114.3% 108.8% 94.2% 97.5% 96.9% 109.0%
Remove: Impact on Ratio from Catastrophe Losses
and LAE Including Development, as Reported (13.5%) (10.2%) (3.1%) (8.6%) (6.7%) (18.9%)
Add: Impact on Ratio from Catastrophe Losses
and LAE at Planned Load Ratio 4.8% 5.3% 6.6% 7.0% 6.9% 6.3%
Normalized Combined Ratio 105.6% 103.8% 97.7% 95.8% 97.0% 96.4%
C mb ne Ra io, GAAP-basis 99.8% 105.3% 102.5% 103.8% 109.4% 100.8%
Remove: Impact on Ratio from Catastrophe Losses
and LAE Including Development, as Reported (0.9%) (1.2%) (0.9%) (1.0%) (1.1%) (2.5%)
Add: Impact on Ratio from Catastrophe Losses
and LAE at Planned Load Ratio 0.6% 0.6% 0.9% 0.9% 0.9% 1.3%
Normalized Combined Ratio 99.5% 104.7% 102.5% 103.7% 109.3% 99.6%
Year Ended December 31,
Legacy Non-standard Auto
Serious News for Serious Traders! Try StreetInsider.com Premium Free!
You May Also Be Interested In
- Kemper Announces First Quarter Preliminary Results and Schedule for Earnings Release
- Dime Community Bancshares Declares Quarterly Cash Dividend for Series A Preferred Stock
- USCB Financial Holdings, Inc. Reports Diluted EPS of $0.23 for Q1 2024 and Announces Adoption of New 500,000 Share Repurchase Program
Create E-mail Alert Related Categories
SEC FilingsSign up for StreetInsider Free!
Receive full access to all new and archived articles, unlimited portfolio tracking, e-mail alerts, custom newswires and RSS feeds - and more!


 Tweet
Tweet Share
Share