

Form 8-K Johnson Controls Interna For: Dec 05
 Tweet
Tweet Share
Share
UNITED STATES
SECURITIES AND EXCHANGE COMMISSION
Washington, D.C. 20549
FORM 8-K
CURRENT REPORT
Pursuant to Section 13 or 15(d) of the
Securities Exchange Act of 1934
Date of Report (date of earliest event reported): December 5, 2016
JOHNSON CONTROLS INTERNATIONAL PLC
(Exact name of registrant as specified in its charter)
|
Ireland |
|
001-13836 |
|
98-0390500 |
|
(State or Other Jurisdiction of |
|
(Commission File Number) |
|
(IRS Employer Identification |
|
1 Albert Quay |
|
|
(Address of principal executive offices) |
|
Registrant’s telephone number, including area code: 353-21-423-5000
Not Applicable
(Former name or former address, if changed since last report)
Check the appropriate box below if the Form 8-K filing is intended to simultaneously satisfy the filing obligation of the registrants under any of the following provisions (see General Instruction A.2. below):
o Written communications pursuant to Rule 425 under the Securities Act (17 CFR 230.425)
o Soliciting material pursuant to Rule 14a-12 under the Exchange Act (17 CFR 240.14a-12)
o Pre-commencement communications pursuant to Rule 14d-2(b) under the Exchange Act (17 CFR 240.14d-2(b))
o Pre-commencement communications pursuant to Rule 13e-4(c) under the Exchange Act (17 CFR 240.13e-4(c))
Item 7.01. Regulation FD Disclosure
Attached and incorporated herein by reference as Exhibit 99.1 is a copy of the press release dated December 5, 2016 issued by Johnson Controls International plc (the “Company”) relating to the Company’s fiscal 2017 and mid-term outlook..
Attached and incorporated herein by reference as Exhibit 99.2 is a copy of the Company’s Investor Day presentation for the analyst meeting held on December 5, 2016.
Exhibit 99.1 and Exhibit 99.2 are being furnished and shall not be deemed “filed” for purposes of Section 18 of the Securities Exchange Act of 1934, as amended, or otherwise subject to the liabilities of that section, nor shall they be deemed to be incorporated by reference in any registration statement or other document filed under the U.S. Securities Act of 1933, as amended, except as otherwise expressly stated in such filing.
Item 9.01. Financial Statements and Exhibits.
(d) Exhibits.
|
Exhibit No. |
|
Exhibit Description |
|
99.1 |
|
Press Release, issued December 5, 2016 |
|
|
|
|
|
99.2 |
|
Investor Day Presentation, dated December 5, 2016 |
SIGNATURE
Pursuant to the requirements of the Securities Exchange Act of 1934, the registrant has duly caused this report to be signed on its behalf by the undersigned hereunto duly authorized.
|
|
JOHNSON CONTROLS INTERNATIONAL PLC | |
|
|
| |
|
|
| |
|
Date: December 5, 2016 |
By: |
/s/ Brian J. Stief |
|
|
Name: |
Brian J. Stief |
|
|
Title: |
Executive Vice President and Chief Financial Officer |
EXHIBIT INDEX
|
Exhibit No. |
|
Exhibit Description |
|
99.1 |
|
Press Release, issued December 5, 2016 |
|
|
|
|
|
99.2 |
|
Investor Day Presentation, dated December 5, 2016 |
Exhibit 99.1
|
|
|

FOR IMMEDIATE RELEASE
|
CONTACT: |
Investors: |
|
|
Antonella Franzen |
|
|
(609) 720-4665 |
|
|
|
|
|
Ryan Edelman |
|
|
(609) 720-4545 |
|
|
|
|
|
Media: |
|
|
Fraser Engerman |
|
|
(414) 524-2733 |
Johnson Controls announces fiscal 2017 guidance and introduces mid-term outlook
+12 to 15 percent EPS growth CAGR through fiscal 2020
Board approves $0.25 per share quarterly cash dividend
CORK, Ireland, Dec. 5, 2016 — In connection with its investor and analyst meeting being held today in New York City, Johnson Controls International, plc (NYSE: JCI) announces fiscal 2017 EPS before special items guidance of $2.60 to $2.75 per share, a 13 percent to 19 percent year over year increase, compared to the pro forma fiscal 2016 base of $2.31 per share. Guidance includes an organic revenue growth range of 2.5 percent to 4.5 percent and EBIT margin expansion before special items of 80 to 110 basis points.
“Fiscal 2016 was a year of significant transformation,” said Chairman and Chief Executive Officer Alex Molinaroli. “As we transition to fiscal 2017, we are instilling our new Company’s vision, mission and values throughout the organization to drive a strong performance and growth-oriented culture”, said Molinaroli.
“We are well positioned as a market leader to accelerate growth in our core buildings and energy businesses. We will maintain a consistent focus on investing for profitable growth, improving free cash flow conversion, driving the Johnson Controls Operating System and creating long-term value for our shareholders and customers. We expect fiscal 2017 to be another year of strong earnings performance for Johnson Controls based on both solid operational execution and merger related cost synergies.”
In addition, the board of directors approved a quarterly cash dividend payment of $0.25 per share payable on Jan. 6, 2017, to shareholders of record as of the close of business on Dec. 14, 2016. Johnson Controls has paid a consecutive dividend since 1887.
The Company is introducing mid-term financial targets covering the fiscal years through 2020:
Fiscal 2020 Financial Targets
· +12 to 15 percent EPS before special items CAGR
· +3 to 4 percent organic revenue CAGR including $500 million in run-rate sales synergies
· +40 to 55 percent EBIT growth before special items with +300 to 380 basis points of margin expansion
· ~$1 billion of productivity/merger cost savings plus $150 million of tax synergies
· FCF conversion target of 90 percent+ before special items
Molinaroli continued, “Looking forward to our mid-term outlook, we have a significant amount of earnings growth within our control. We have developed financial targets which we believe are attainable through dedicated and consistent execution across the portfolio. Within our planning horizon, we will look to supplement core financial performance with disciplined capital deployment. We are enthusiastic about the revenue synergy opportunities in front of us and expect to reach a run rate of at least $500 million by fiscal 2020.”
A live video webcast of today’s meeting will begin at 8:00am EST and conclude at approximately 12:30pm EST. The event and presentation materials can be accessed through the Investor Relations section of the Company’s website: http://investors.johnsoncontrols.com. A replay of the webcast will be made available after the conclusion of the presentation.
###
About Johnson Controls:
Johnson Controls is a global diversified technology and multi industrial leader serving a wide range of customers in more than 150 countries. Our 130,000 employees create intelligent buildings, efficient energy solutions, integrated infrastructure and next generation transportation systems that work seamlessly together to deliver on the promise of smart cities and communities. Our commitment to sustainability dates back to our roots in 1885, with the invention of the first electric room thermostat. We are committed to helping our customers win and creating greater value for all of our stakeholders through strategic focus on our buildings and energy growth platforms. For additional information, please visit http://www.johnsoncontrols.com or follow us @johnsoncontrols on Twitter.
###
Johnson Controls International plc Cautionary Statement Regarding Forward-Looking Statements
Johnson Controls International plc has made statements in this communication that are forward-looking and therefore are subject to risks and uncertainties. All statements in this communication other than statements of historical fact are, or could be, “forward-looking statements” within the meaning of the Private Securities Litigation Reform Act of 1995. In this communication, statements regarding Johnson Controls’ future financial position, sales, costs, earnings, cash flows, other measures of results of operations, synergies and integration opportunities, capital expenditures and debt levels are forward-looking statements. Words such as “may,” “will,” “expect,” “intend,” “estimate,” “anticipate,” “believe,” “should,” “forecast,” “project” or “plan” and terms of similar meaning are generally intended to identify forward-looking statements. However, the absence of these words does not mean that a statement is not forward-looking. Johnson Controls cautions that these statements are subject to numerous important risks, uncertainties, assumptions and other factors, some of which are beyond Johnson Controls’ control, that could cause Johnson Controls’ actual results to differ materially from those expressed or implied by such forward-looking statements, including, among others, risks related to: any delay or inability of Johnson Controls to realize the expected benefits and synergies of recent portfolio transactions such as the merger with Tyco and the spin-off of Adient, changes in tax laws, regulations, rates, policies or interpretations, the loss of key senior management, the tax treatment of recent portfolio transactions, significant transaction costs and/or unknown liabilities associated with such transactions, the outcome of actual or potential litigation relating to such transactions, the risk that disruptions from recent transactions will harm Johnson Controls’ business, the strength of the U.S. or other economies, automotive vehicle production levels, mix and schedules, energy and commodity prices, the availability of raw materials and component products, currency exchange rates, and cancellation of or changes to commercial arrangements. A detailed discussion of risks related to Johnson Controls’ business is included in the section entitled “Risk Factors” in Johnson Controls’ Annual Report on Form 10-K for the 2016 fiscal year filed with the SEC on November 23, 2016, and available at www.sec.gov and www.johnsoncontrols.com under the “Investors” tab. Shareholders, potential investors and others should consider these factors in evaluating the forward-looking statements and should not place undue reliance on such statements. The forward-looking statements included in this communication are made only as of the date of this communication, unless otherwise specified, and, except as required by law, Johnson Controls assumes no obligation, and disclaims any obligation, to update such statements to reflect events or circumstances occurring after the date of this communication.
###
Non GAAP Financial Information
This communication contains financial information regarding earnings per share (EPS) and earnings before interest and taxes (EBIT), in each case before special items, which are non-GAAP performance measures. Special items include mark-to-market adjustments for pension and postretirement plans/settlement losses, transaction/integration/separation costs, restructuring and impairment costs, significant gains or losses on business divestitures, nonrecurring purchase accounting impacts related to the Tyco merger and discrete tax items. Management believes that, when considered together with unadjusted amounts, these non-GAAP measures are useful to investors in understanding period-over-period operating results and business trends of the Company. Management may also use these metrics as guides in forecasting, budgeting and long-term planning processes and for compensation purposes. These metrics should be considered in addition to, and not as replacements for, the most comparable GAAP measure. Projected results do not reflect the potential impact of special items (and the tax effect of all such items) because the Johnson Controls cannot reliably predict or estimate those items or expenses or their impact to its financial statements. Accordingly, a reconciliation of non-
GAAP financial measures to the equivalent GAAP financial measures for projected results is not available without unreasonable effort.
##
|
Non-GAAP Reconciliation |
|
|
|
|
|
|
|
|
| ||||
|
|
|
|
|
|
|
|
|
|
| ||||
|
|
|
(A) |
|
(B) |
|
(C) |
|
(D) |
| ||||
|
$(in millions, except EPS) |
|
Year Ended September 30, 2016 |
| ||||||||||
|
|
|
GAAP |
|
|
|
|
|
Non-GAAP |
| ||||
|
Sales |
|
$ |
37,674 |
|
$ |
37,694 |
|
$ |
(8,125 |
) |
$ |
29,569 |
|
|
|
|
|
|
|
|
|
|
|
| ||||
|
Income from Continuing Operations before Income Taxes |
|
1,586 |
|
3,493 |
|
(675 |
) |
2,818 |
| ||||
|
|
|
|
|
|
|
|
|
|
| ||||
|
Income Tax Expense |
|
(2,238 |
) |
(591 |
) |
112 |
|
(479 |
) | ||||
|
|
|
|
|
|
|
|
|
|
| ||||
|
Non-controlling Interest |
|
(216 |
) |
(253 |
) |
87 |
|
(166 |
) | ||||
|
|
|
|
|
|
|
|
|
|
| ||||
|
Net Income |
|
(868 |
) |
2,649 |
|
(476 |
) |
2,173 |
| ||||
|
|
|
|
|
|
|
|
|
|
| ||||
|
Diluted EPS |
|
$ |
(1.30 |
) |
$ |
3.94 |
|
|
|
$ |
2.31 |
* | |
* Includes annual amortization expense of $430 million $(290 million after-tax; $0.31 per diluted EPS)
(A) Johnson Controls International plc, as reported
(B) Adjusted to exclude special items because these costs are not considered to be directly related to the underlying operating performance of the Company. Management believes these non-GAAP measures are useful to investors in better understanding the ongoing operations and business trends of the Company.
Special items include
:
· Increase to sales of $20 million related to nonrecurring fair value adjustment of Tyco’s deferred revenue in purchase accounting
· Non-cash mark-to-market for pension / postretirement plans and settlement losses of $514 million ($357 million after-tax and non-controlling interest)
· Transaction, integration and separation costs of $692 million ($621 million after-tax and non-controlling interest)
· Restructuring and non-cash impairment charges of $627 million ($517 million after-tax and non-controlling interest)
· Non-recurring portion of purchase accounting expenses of $74 million ($54 million after-tax)
· Discrete income tax expense of $1,968 million
(C) Includes Tyco Non-GAAP results and recurring purchase accounting adjustments for the period October 1, 2015 through September 2, 2016 less Adient results for the twelve months ended September 30, 2016 on a discontinued operations basis.
(D) Pro forma financial information as if Adient was reflected as a discontinued operation and the merger with Tyco was completed on October 1, 2015. Reflects 17% tax rate and 940 million share count.
Exhibit 99.2
Johnson Controls Analyst Day December 5, 2016

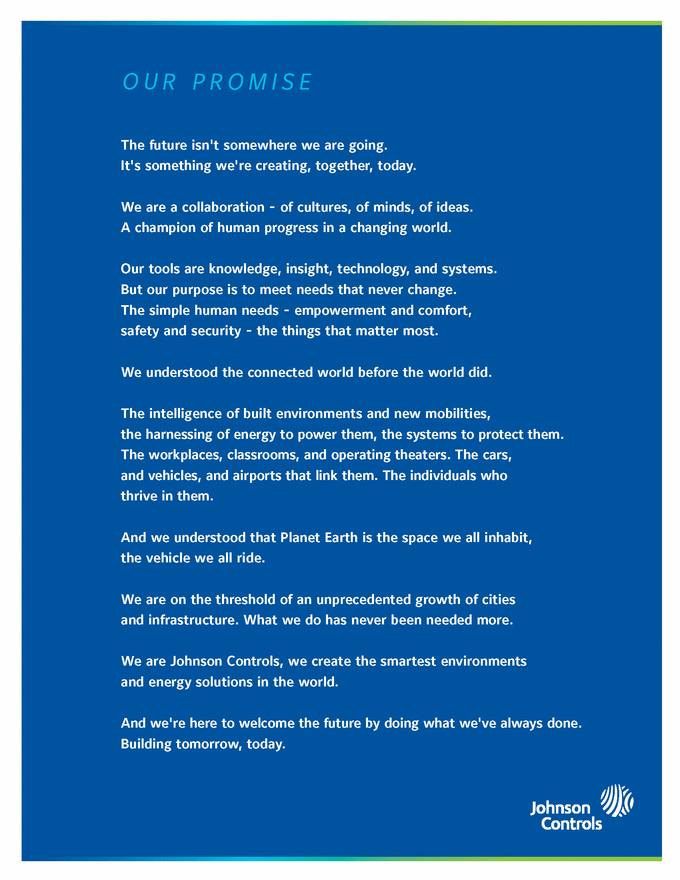
OURPR OMISE The future isn't somewhere we are going. It's something we're creating, together, today. We are a collaboration - of cultures, of minds, of ideas. A champion of human progress in a changing world. Our tools are knowledge, insight, technology, and systems. But our purpose is to meet needs that never change. The simple human needs - empowerment and comfort, safety and security - the things that matter most. We understood the connected world before the world did. The intelligence of built environments and new mobilities, the harnessing of energy to power them, the systems to protect them. The workplaces, classrooms, and operating theaters. The cars, and vehicles, and airports that link them. The individuals who thrive in them. And we understood that Planet Earth is the space we all inhabit, the vehicle we all ride. We are on the threshold of an unprecedented growth of cities and infrastructure. What we do has never been needed more. We are Johnson Controls, we create the smartest environments and energy solutions in the world. And we're here to welcome the future by doing what we've always done. Building tomorrow, today.
and stay connected.#JCIAnalystDay$JCI ENTERPRISE @JohnsonControls INVESTOR RELATIONS @JCI_IR ALEX MOLINAROLI @AMolinaroli KIM METCALF-KUPRES @KMetKup Johnson Controls Analyst Day December 5, 2016

Johnson Controls International plc has made statements in this communication that are forward-looking and therefore are subject to risks and uncertainties. All statements in this communication other than statements of historical fact are, or could be, “forward-looking statements” within the meaning of the Private Securities Litigation Reform Act of 1995. In this communication, statements regarding Johnson Controls’ future financial position, sales, costs, earnings, cash flows, other measures of results of operations, synergies and integration opportunities, capital expenditures and debt levels are forward-looking statements. Words such as “may,” “will,” “expect,” “intend,” “estimate,” “anticipate,” “believe,” “should,” “forecast,” “project” or “plan” and terms of similar meaning are generally intended to identify forward-looking statements. However, the absence of these words does not mean that a statement is not forward-looking. Johnson Controls cautions that these statements are subject to numerous important risks, uncertainties, assumptions and other factors, some of which are beyond Johnson Controls’ control, that could cause Johnson Controls’ actual results to differ materially from those expressed or implied by such forward-looking statements, including, among others, risks related to: any delay or inability of Johnson Controls to realize the expected benefits and synergies of recent portfolio transactions such as the merger with Tyco and the spin-off of Adient, changes in tax laws, regulations, rates, policies or interpretations, the loss of key senior management, the tax treatment of recent portfolio transactions, significant transaction costs and/or unknown liabilities associated with such transactions, the outcome of actual or potential litigation relating to such transactions, the risk that disruptions from recent transactions will harm Johnson Controls’ business, the strength of the U.S. or other economies, automotive vehicle production levels, mix and schedules, energy and commodity prices, the availability of raw materials and component products, currency exchange rates, and cancellation of or changes to commercial arrangements. A detailed discussion of risks related to Johnson Controls’ business is included in the section entitled “Risk Factors” in Johnson Controls’ Annual Report on Form 10-K for the 2016 fiscal year filed with the SEC on November 23, 2016, and available at www.sec.gov and www.johnsoncontrols.com under the “Investors” tab. Shareholders, potential investors and others should consider these factors in evaluating the forward-looking statements and should not place undue reliance on such statements. The forward-looking statements included in this communication are made only as of the date of this communication, unless otherwise specified, and, except as required by law, Johnson Controls assumes no obligation, and disclaims any obligation, to update such statements to reflect events or circumstances occurring after the date of this communication. Forward Looking Statements
This communication contains financial information regarding earnings per share and earnings before interest and taxes (EBIT), in each case before special items, which are non-GAAP performance measures. Special items include mark-to-market adjustments for pension and postretirement plans/settlement losses, transaction/integration/separation costs, restructuring and impairment costs, significant gains or losses on business divestitures, nonrecurring purchase accounting impacts related to the Tyco merger and discrete tax items. Management believes that, when considered together with unadjusted amounts, these non-GAAP measures are useful to investors in understanding period-over-period operating results and business trends of the Company. Management may also use these metrics as guides in forecasting, budgeting and long-term planning processes and for compensation purposes. These metrics should be considered in addition to, and not as replacements for, the most comparable GAAP measure. Projected results do not reflect the potential impact of special items (and the tax effect of all such items) because Johnson Controls cannot reliably predict or estimate those items or expenses or their impact to its financial statements. Accordingly, a reconciliation of non-GAAP financial measures to the equivalent GAAP financial measures for projected results is not available without unreasonable effort. Non GAAP Financial Information
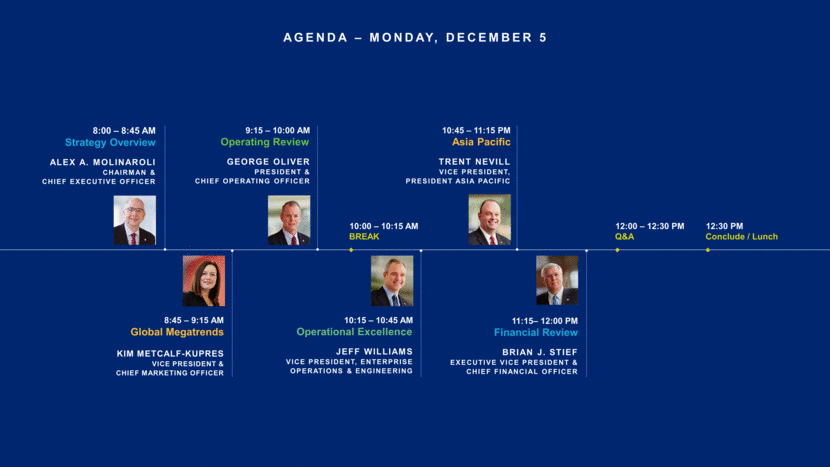
AGENDA – MONDAY, DECEMBER 5 12:00 – 12:30 PM Q&A 12:30 PM Conclude / Lunch 8:00 – 8:45 AM Strategy Overview ALEX A. MOLINAROLI CHAIRMAN & CHIEF EXECUTIVE OFFICER 9:15 – 10:00 AM Operating Review GEORGE OLIVER PRESIDENT & CHIEF OPERATING OFFICER 11:15– 12:00 PM Financial Review BRIAN J. STIEF EXECUTIVE VICE PRESIDENT & CHIEF FINANCIAL OFFICER 8:45 – 9:15 AM Global Megatrends KIM METCALF-KUPRES VICE PRESIDENT & CHIEF MARKETING OFFICER 10:45 – 11:15 PM Asia Pacific TRENT NEVILL VICE PRESIDENT, PRESIDENT ASIA PACIFIC 10:00 – 10:15 AM BREAK 10:15 – 10:45 AM Operational Excellence JEFF WILLIAMS VICE PRESIDENT, ENTERPRISE OPERATIONS & ENGINEERING
[LOGO]

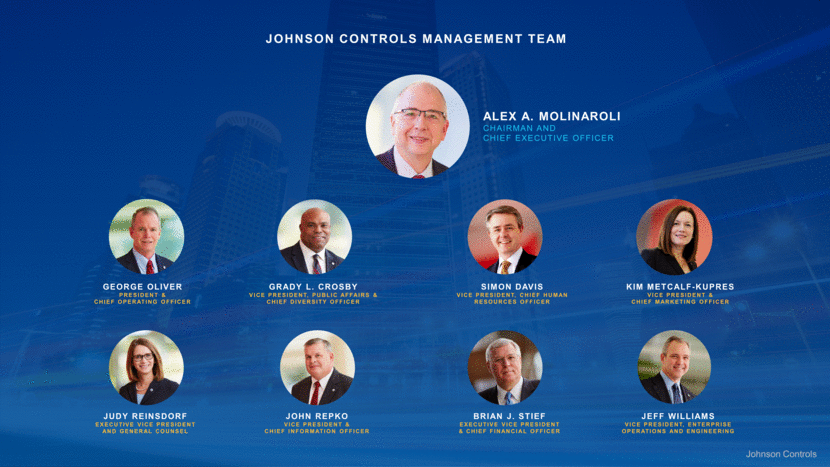
Johnson Controls Management Team Johnson Controls ALEX A. MOLINAROLI CHAIRMAN AND CHIEF EXECUTIVE OFFICER GEORGE OLIVER PRESIDENT & CHIEF OPERATING OFFICER GRADY L. CROSBY VICE PRESIDENT, PUBLIC AFFAIRS & CHIEF DIVERSITY OFFICER SIMON DAVIS VICE PRESIDENT, CHIEF HUMAN RESOURCES OFFICER KIM METCALF-KUPRES VICE PRESIDENT & CHIEF MARKETING OFFICER JUDY REINSDORF EXECUTIVE VICE PRESIDENT AND GENERAL COUNSEL JOHN REPKO VICE PRESIDENT & CHIEF INFORMATION OFFICER BRIAN J. STIEF EXECUTIVE VICE PRESIDENT & CHIEF FINANCIAL OFFICER JEFF WILLIAMS VICE PRESIDENT, ENTERPRISE OPERATIONS AND ENGINEERING
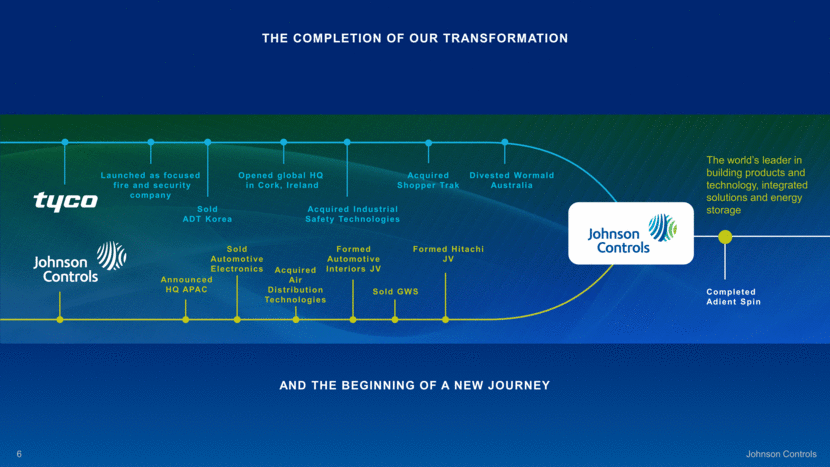
THE COMPLETION OF OUR TRANSFORMATION AND THE BEGINNING OF A NEW JOURNEY THE COMPLETION OF OUR TRANSFORMATION AND THE BEGINNING OF A NEW JOURNEY Launched as focused fire and security company Sold ADT Korea Opened global HQ in Cork, Ireland Acquired Industrial Safety Technologies Announced HQ APAC Acquired Air Distribution Technologies Sold Automotive Electronics Formed Automotive Interiors JV Formed Hitachi JV Sold GWS The world’s leader in building products and technology, integrated solutions and energy storage Completed Adient Spin Divested Wormald Australia Acquired Shopper Trak
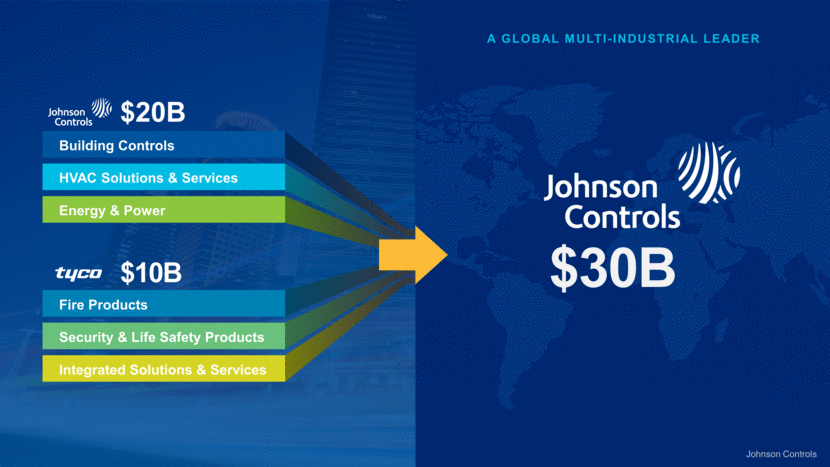
A GLOBAL MULTI-INDUSTRIAL LEADER $30B $20B $10B Building Controls HVAC Solutions & Services Energy & Power Fire Products Security & Life Safety Products Integrated Solutions & Services Johnson Controls
VISION A safe, comfortable and sustainable world MISSION Helping our customers win everywhere, every day VALUES Integrity First Purpose Led Customer Driven Future Focused One Team Johnson Controls

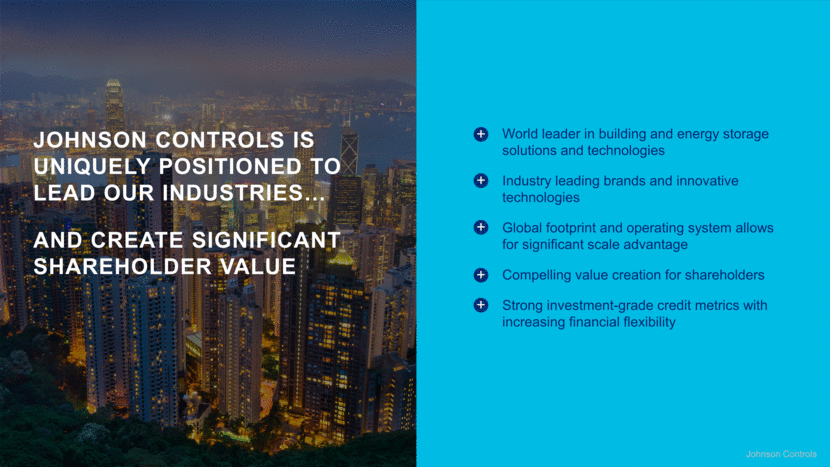
World leader in building and energy storage solutions and technologies Industry leading brands and innovative technologies Global footprint and operating system allows for significant scale advantage Compelling value creation for shareholders Strong investment-grade credit metrics with increasing financial flexibility JOHNSON CONTROLS IS UNIQUELY POSITIONED TO LEAD OUR INDUSTRIES AND CREATE SIGNIFICANT SHAREHOLDER VALUE Johnson Controls + + + + +
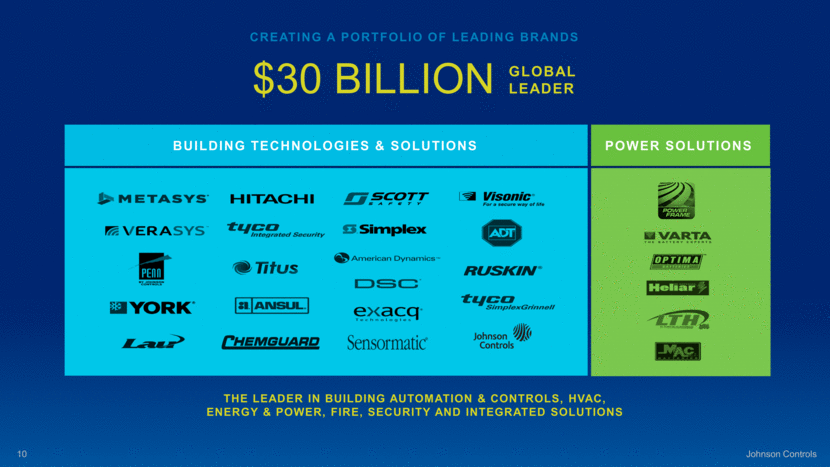
CREATING A PORTFOLIO OF LEADING BRANDS $30 BILLION THE LEADER IN BUILDING AUTOMATION & CONTROLS, HVAC, ENERGY & POWER, FIRE, SECURITY AND INTEGRATED SOLUTIONS Building TECHNOLOGIES & SOLUTIONS POWER SOLUTIONS GLOBAL LEADER Jenni - Graphic looks distorted Jenni – 1) need to fix Chemguard logo 2) move one of Tyco logos to a different spot so they are not right next to eachother
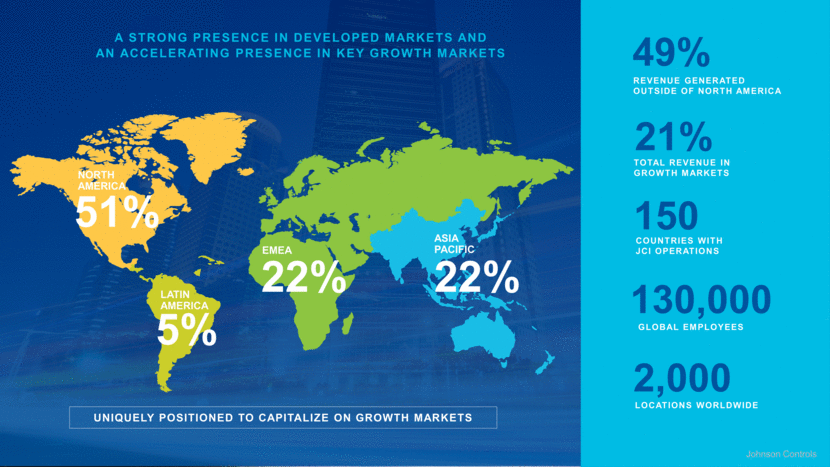
A STRONG PRESENCE IN DEVELOPED MARKETS AND AN ACCELERATING PRESENCE IN KEY GROWTH MARKETS 51% NORTH AMERICA 22% EMEA 5% LATIN AMERICA 22% ASIA PACIFIC UNIQUELY POSITIONED TO CAPITALIZE ON GROWTH MARKETS 130,000 GLOBAL EMPLOYEES 2,000 LOCATIONS WORLDWIDE 21% TOTAL REVENUE IN GROWTH MARKETS 150 COUNTRIES WITH JCI OPERATIONS Johnson Controls REVENUE GENERATED OUTSIDE OF NORTH AMERICA 49%
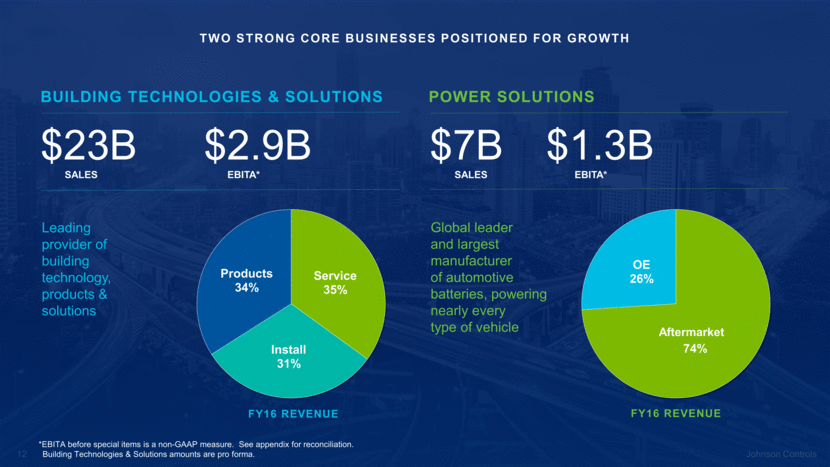
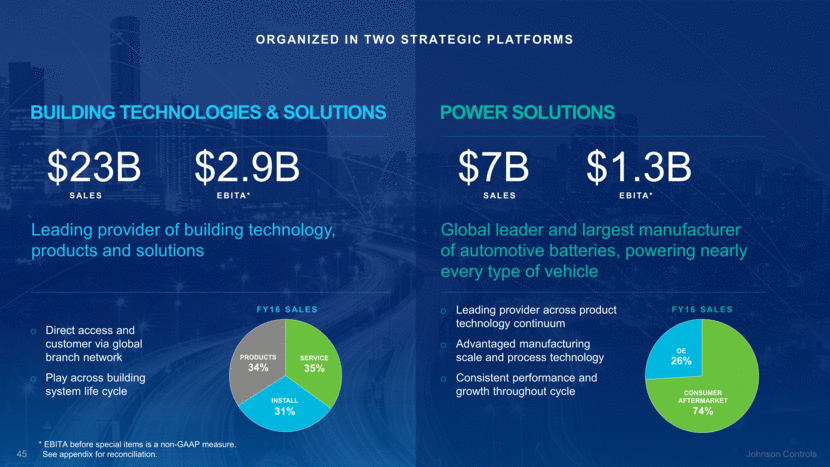
TWO STRONG CORE BUSINESSES POSITIONED FOR GROWTH *EBITA before special items is a non-GAAP measure. See appendix for reconciliation. Building Technologies & Solutions amounts are pro forma. Leading provider of building technology, products & solutions SALES $23B $2.9B EBITA* BUILDING TECHNOLOGIES & SOLUTIONS FY16 REVENUE Global leader and largest manufacturer of automotive batteries, powering nearly every type of vehicle POWER SOLUTIONS SALES $7B $1.3B EBITA* FY16 REVENUE Aftermarket
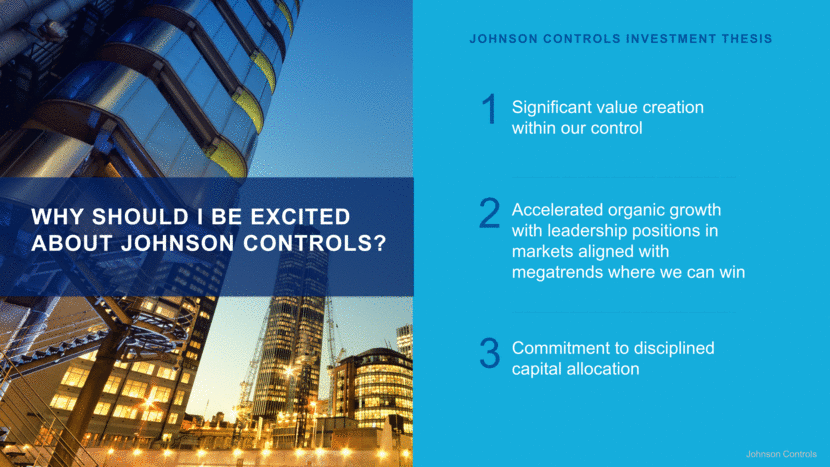
WHY SHOULD I BE EXCITED ABOUT JOHNSON CONTROLS? Significant value creation within our control 1 Accelerated organic growth with leadership positions in markets aligned with megatrends where we can win 2 Commitment to disciplined capital allocation 3 JOHNSON CONTROLS INVESTMENT THESIS Johnson Controls
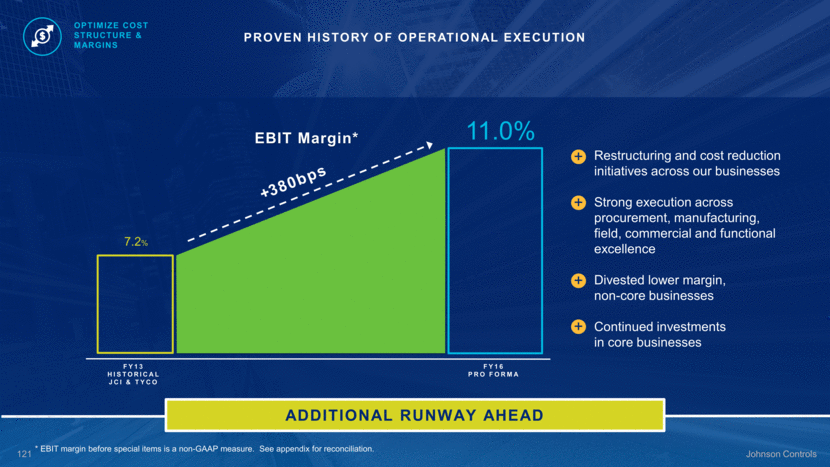
*EBIT before special items is a non-GAAP measure. See appendix for reconciliation. Restructuring and cost reduction initiatives across our businesses Strong execution across procurement, manufacturing, field, commercial and functional excellence Divested lower margin, non-core businesses Continued investments in core businesses + + + + A PROVEN HISTORY OF OPERATIONAL EXECUTION WITH ADDITIONAL RUNWAY AHEAD EBIT Margin* Historical JCI & Tyco Pro Forma Johnson Controls 7.2% 11.0% FY13 FY16

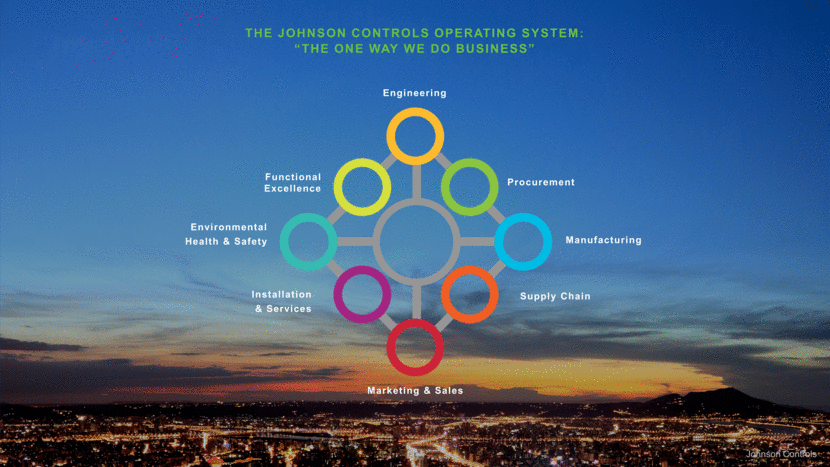
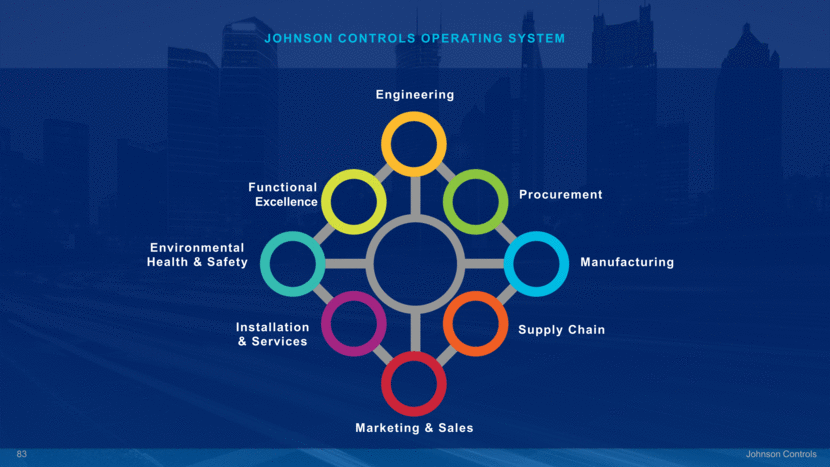
THE JOHNSON CONTROLS OPERATING SYSTEM: “THE ONE WAY WE DO BUSINESS” Marketing & Sales Manufacturing Environmental Health & Safety Functional Excellence Installation & Services Procurement Supply Chain Engineering Johnson Controls
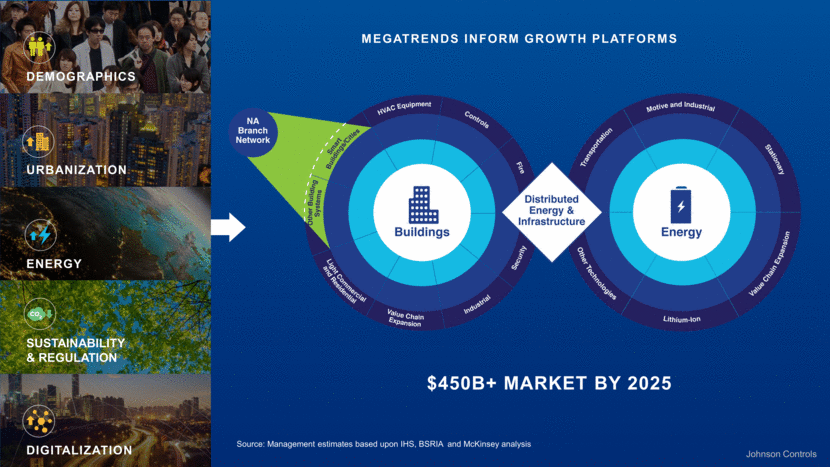
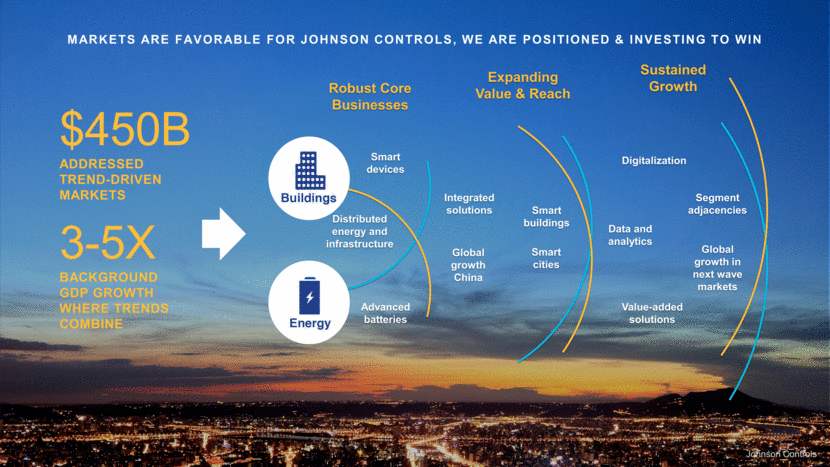
$450B+ MARKET BY 2025 Source: Management estimates based upon IHS, BSRIA and McKinsey analysis 16 Johnson Controls MEGATRENDS INFORM GROWTH PLATFORMS Demographics Urbanization Energy SUSTAINABILITY & REGULATION Digitalization
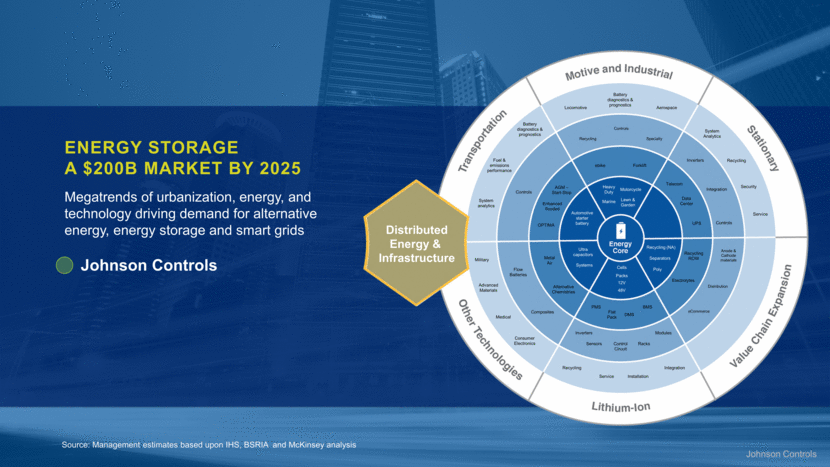
ENERGY STORAGE A $200B MARKET BY 2025 Megatrends of urbanization, energy, and technology driving demand for alternative energy, energy storage and smart grids Johnson Controls Source: Management estimates based upon IHS, BSRIA and McKinsey analysis Johnson Controls Heavy Duty Ultra capacitors AGM – Start-Stop Inverters Integration Automotive starter battery Enhanced flooded OPTIMA Controls Battery diagnostics & prognostics Fuel & emissions performance System analytics Motorcycle Marine Lawn & Garden Forklift Controls Battery diagnostics & prognostics Telecom Data Center UPS Controls Recycling (NA) Separators Poly Recycling ROW Electrolytes Distribution Cells Packs 12V 48V BMS DMS Flat Pack PMS Sensors Control Circuit Racks Modules Installation Service Recycling Systems Metal Air Composites Flow Batteries Advanced Materials Anode & Cathode materials eCommerce Integration Inverters System Analytics Recycling Security Service Locomotive Specialty ebike Recycling Aerospace Military Medical Alternative Chemistries Distributed Energy & Infrastructure Consumer Electronics
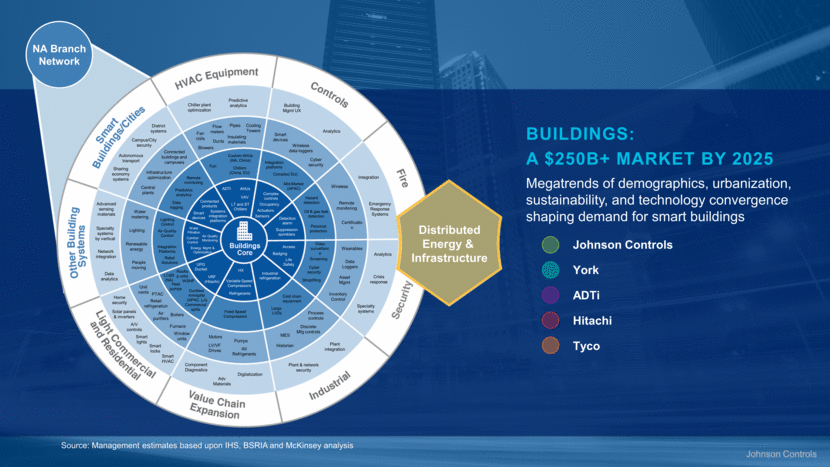
BUILDINGS: A $250B+ MARKET BY 2025 Megatrends of demographics, urbanization, sustainability, and technology convergence shaping demand for smart buildings Johnson Controls York ADTi Hitachi Tyco Source: Management estimates based upon IHS, BSRIA and McKinsey analysis Johnson Controls LT and ST Chillers VAV AHUs ADTi Chillers (China, EU) Fan Custom AHUs (NA, China) Blowers Ducts Insulating materials Fan coils Flow meters Pipes Cooling Towers Predictive analytics Sensors Actuators Occupancy Complex controls Hazard detection Complex( EU) Mid-Market (APAC) Building Mgmt UX Integration platforms Cyber security Analytics Industrial refrigeration Suppression sprinklers Oil & gas leak detection Video surveillance Wireless Remote monitoring Certification Integration Wireless data loggers Emergency Response Systems Access Life Safety Screening Cyber security Shoplifting Wearables Data Loggers Asset Mgmt Inventory Control Analytics Crisis response Specialty systems Cold chain equipment Large LVDs Process controls Discrete Mfg controls MES Historian Plant integration Plant & network security HX Variable Speed Compressors Detection alarm Refrigerants Fixed Speed Compressors Motors LV/VF Drives Pumps Alt Refrigerants Component Diagnostics Adv Materials Digitalization VRF (Hitachi) UPG Ducted Heat pumps Rooftop units LC&R (NA) WSHP Ductless minisplits (APAC, LA) Unit vents PTAC Retail refrigeration Boilers Air purifiers Furnace Window units Home security Solar panels & inverters A/V controls Smart lights Smart locks Smart HVAC Energy Mgmt & Optimization Water Filtration Air Quality Monitoring Comfort Control Lighting Control Air Quality Control Integration Platforms Retail Solutions Water metering Lighting Renewable energy People moving Advanced sensing materials Specialty systems by vertical Network integration Data analytics Smart devices Connected products Systems integration platforms Remote monitoring Predictive analytics Data logging Connected buildings and campuses Infrastructure optimization Central plants District systems Campus/City security Autonomous transport Sharing economy systems Chiller plant optimization Smart devices Personal protection Badging Commercial splits NA Branch Network Distributed Energy & Infrastructure
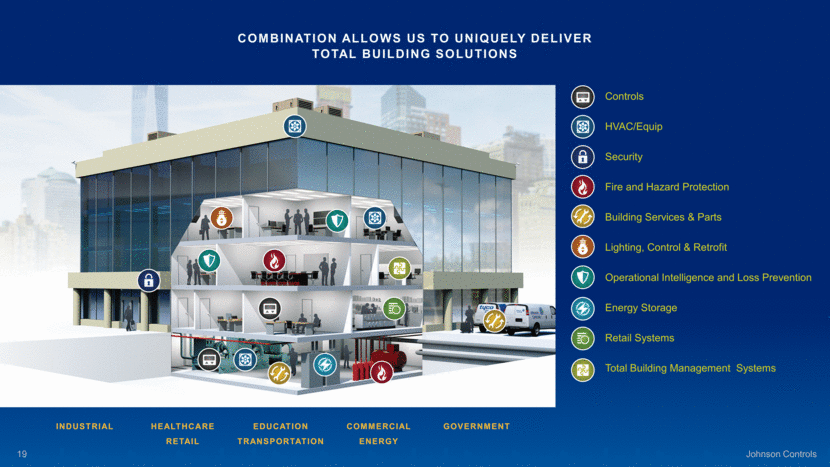
COMBINATION ALLOWS US TO UNIQUELY DELIVER TOTAL BUILDING SOLUTIONS Controls HVAC/Equip Security Fire and Hazard Protection Building Services & Parts Lighting, Control & Retrofit Operational Intelligence and Loss Prevention Energy Storage Retail Systems Total Building Management Systems INDUSTRIAL HEALTHCARE EDUCATION COMMERCIAL GOVERNMENT Transportation RETAIL ENERGY
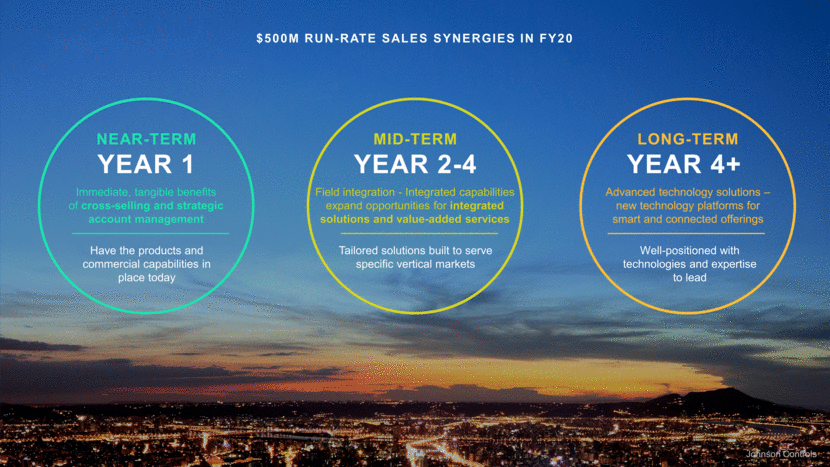
$500M RUN-RATE SALES SYNERGIES IN FY20 NEAR-TERM YEAR 1 Immediate, tangible benefits of cross-selling and strategic account management Have the products and commercial capabilities in place today MID-TERM YEAR 2-4 Field integration - Integrated capabilities expand opportunities for integrated solutions and value-added services Tailored solutions built to serve specific vertical markets LONG-TERM YEAR 4+ Advanced technology solutions – new technology platforms for smart and connected offerings Well-positioned with technologies and expertise to lead Johnson Controls Jenni – please make font within circles larger (expand circles if needed)
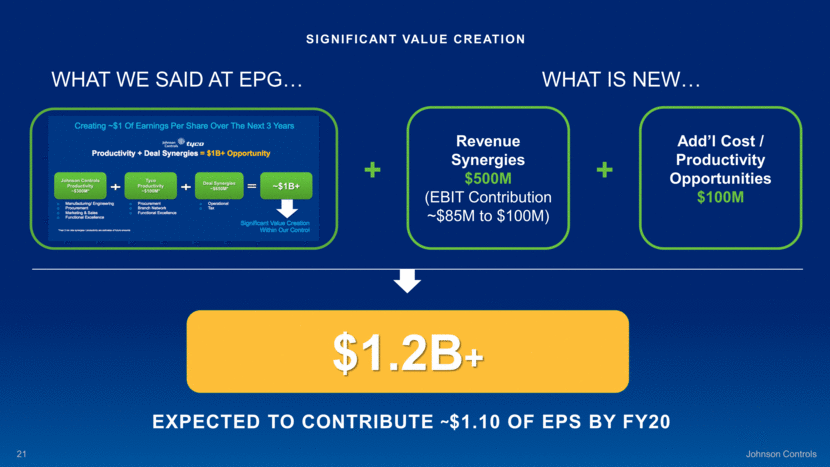
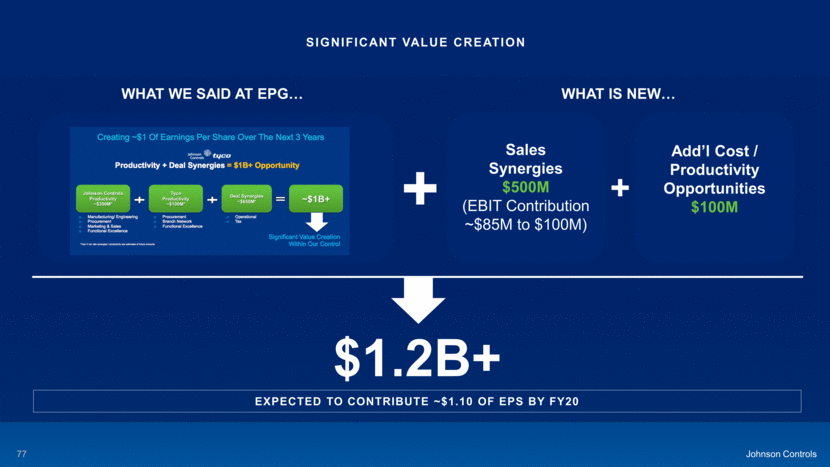
SIGNIFICANT VALUE CREATION $1.2B+ EXPECTED TO CONTRIBUTE ˜$1.10 OF EPS BY FY20 WHAT WE SAID AT EPG + Revenue Synergies $500M (EBIT Contribution ~$85M to $100M) + Add’l Cost / Productivity Opportunities $100M WHAT IS NEW
Johnson Controls KEY PRIORITIES OVER THE NEXT 18 MONTHS Bring together culture of both companies Deliver on operating and financial plans ADVANCE INTEGRATED STRATEGIC PLAN CONTINUOUS EVALUATION OF PORTFOLIO Disciplined capital allocation

DISCIPLINED CAPITAL ALLOCATION Johnson Controls ORGANIC INVESTMENTS COMPETITIVE DIVIDEND STRATEGIC M&A SHARE REPURCHASES

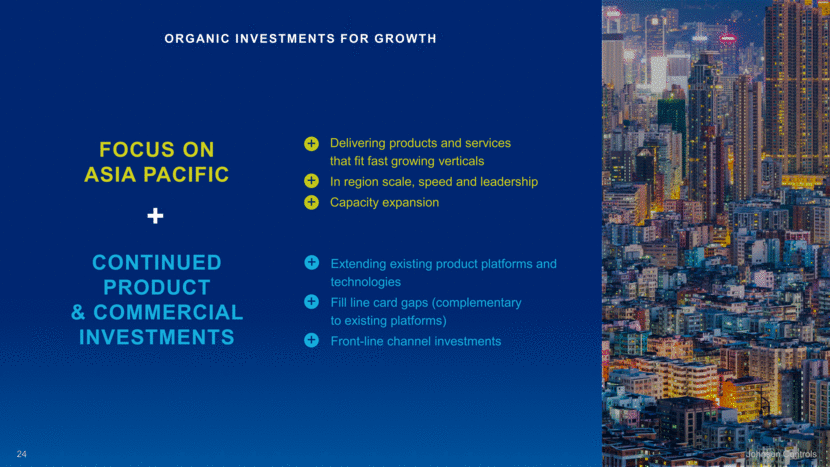
ORGANIC INVESTMENTS FOR GROWTH Extending existing product platforms and technologies Fill line card gaps (complementary to existing platforms) Front-line channel investments + CONTINUED PRODUCT & COMMERCIAL INVESTMENTS + + + + Delivering products and services that fit fast growing verticals In region scale, speed and leadership Capacity expansion FOCUS ON ASIA PACIFIC + + Johnson Controls
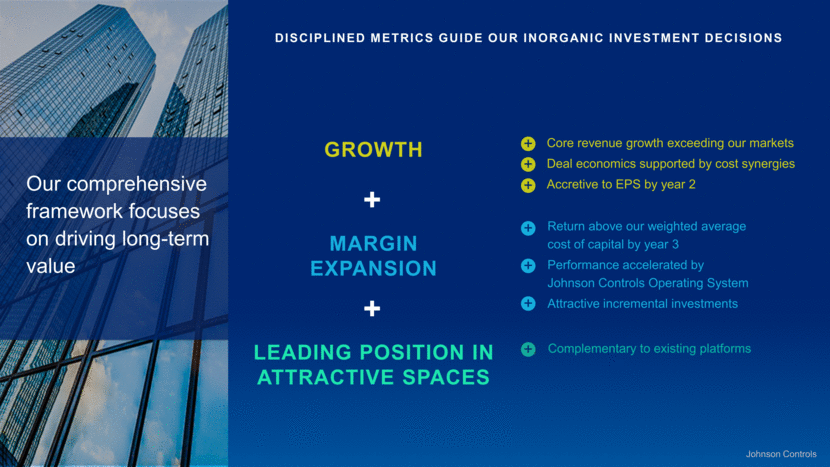
DISCIPLINED METRICS GUIDE OUR INORGANIC INVESTMENT DECISIONS Our comprehensive framework focuses on driving long-term value + Core revenue growth exceeding our markets Deal economics supported by cost synergies Accretive to EPS by year 2 GROWTH + + Return above our weighted average cost of capital by year 3 Performance accelerated by Johnson Controls Operating System Attractive incremental investments + MARGIN EXPANSION + + + Complementary to existing platforms + LEADING POSITION IN ATTRACTIVE SPACES +
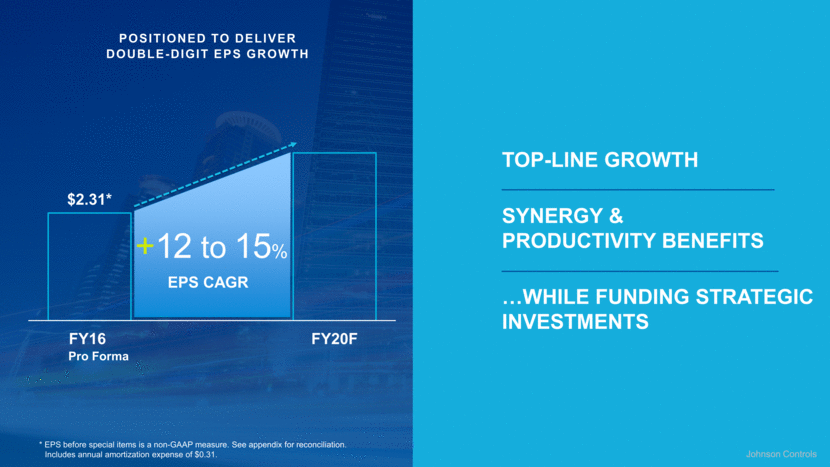
POSITIONED TO DELIVER DOUBLE-DIGIT EPS GROWTH +12 to 15% EPS CAGR TOP-LINE GROWTH SYNERGY & PRODUCTIVITY BENEFITS WHILE FUNDING STRATEGIC INVESTMENTS Johnson Controls * EPS before special items is a non-GAAP measure. See appendix for reconciliation. Includes annual amortization expense of $0.31. Jenni – have Pro Forma go below FY16 S Pro Forma $ 2.31* FY16 FY20F
Johnson Controls POSITIONED TO WIN GROWTH Strong portfolio well-positioned to take advantage of changes in technology EXECUTION Deliver on operating and financial plans SHAREHOLDER VALUE A leading multi-industrial company with significant opportunity to drive shareholder value + + +

[LOGO]

global megatrends shape johnson controls’ growth agendas Johnson Controls Demographics Urbanization Energy SUSTAINABILITY & REGULATION Digitalization

new urban middle class globally 500M of new urban middle class in Asia Pacific 77% working-age proportion of global population (peaked in 2015) 66% 2026 Urban middle class 2016 Urban middle class THE GROWING MIDDLE CLASS A surging middle class AND An aging world DEMOGRAPHICS Johnson Controls MEGATREND Source: Management estimates based on United Nations, Pew Foundation, IMF and CEIC data.

Increased demand for security, productivity, comfort and mobility Growth centered in Asia Pacific Aging populations Investment in infrastructure and institutions Shifting demands and gaps in skilled workforce DEMOGRAPHICS Johnson Controls MEGATREND Implications for Johnson Controls + + + + + A surging middle class AND An aging world

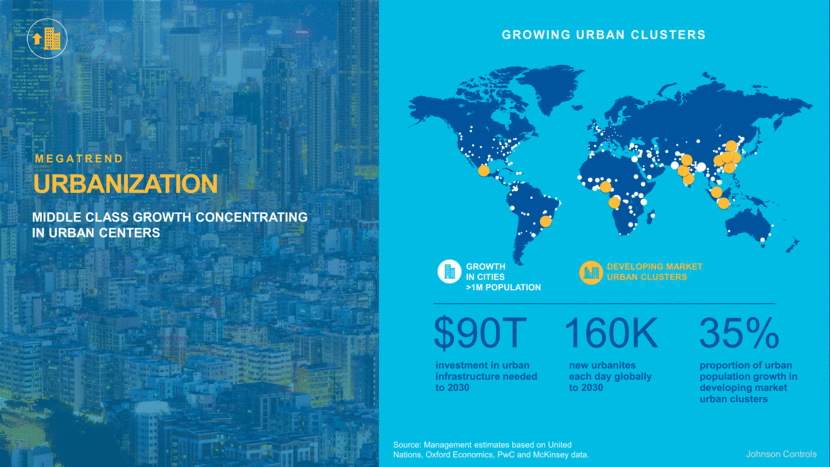
Growing URBAN clusters investment in urban infrastructure needed to 2030 $90T new urbanites each day globally to 2030 160K proportion of urban population growth in developing market urban clusters 35% GROWTH IN cities >1M POPULATION DEVELOPING MARKET Urban CLUSters URBANIZATION MEGATREND middle class GROWTH CONCENTRATING IN urban centers Johnson Controls Source: Management estimates based on United Nations, Oxford Economics, PwC and McKinsey data.
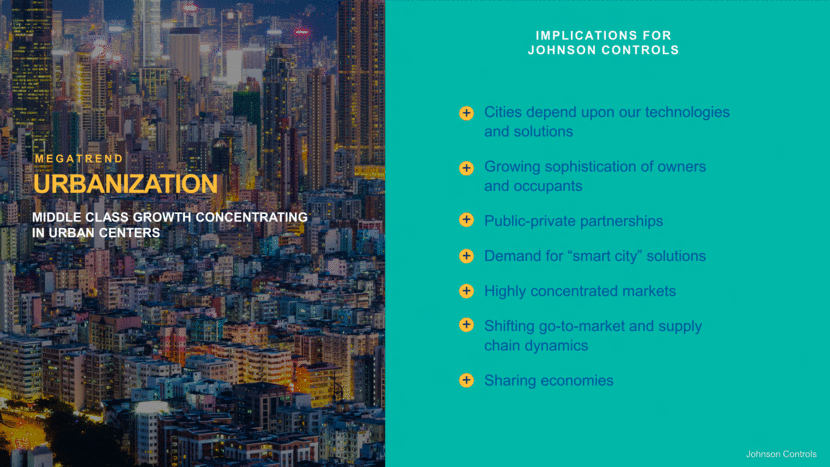
URBANIZATION MEGATREND Johnson Controls Implications for Johnson Controls Cities depend upon our technologies and solutions Growing sophistication of owners and occupants Public-private partnerships Demand for “smart city” solutions Highly concentrated markets Shifting go-to-market and supply chain dynamics Sharing economies + + + + + + + middle class GROWTH CONCENTRATING IN urban centers
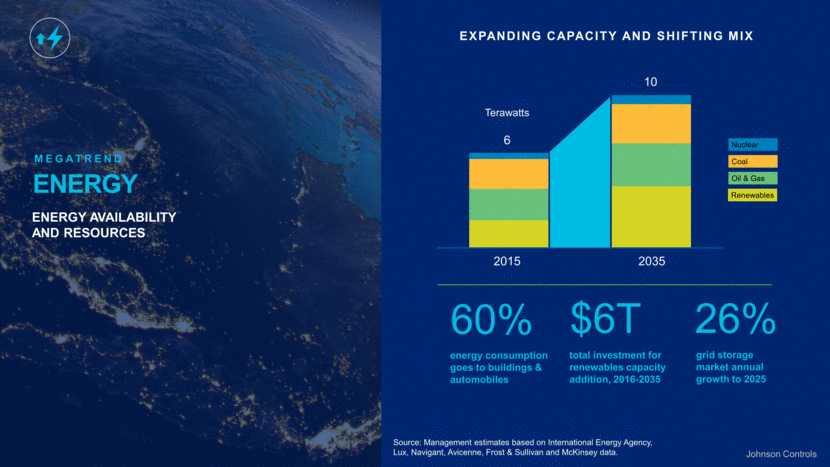
ENERGY Energy availability and resources MEGATREND Johnson Controls total investment for renewables capacity addition, 2016-2035 $6T grid storage market annual growth to 2025 26% 6 2015 2035 10 Terawatts Expanding capacity and shifting mix energy consumption goes to buildings & automobiles 60% Renewables Oil & Gas Coal Nuclear Source: Management estimates based on International Energy Agency, Lux, Navigant, Avicenne, Frost & Sullivan and McKinsey data.
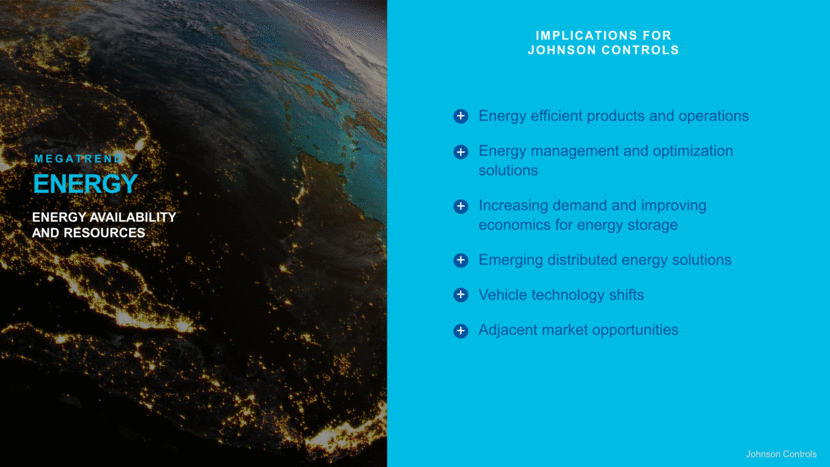
ENERGY MEGATREND Johnson Controls Implications for Johnson Controls Energy efficient products and operations Energy management and optimization solutions Increasing demand and improving economics for energy storage Emerging distributed energy solutions Vehicle technology shifts Adjacent market opportunities + + + + Energy availability and resources + +
Paris climate change agreement Johnson Controls SUSTAINABILITY AND REGULATION MEGATREND carbon emissions increase from developing countries since 1985 3x commitment to worldwide reductions 43% G20 economies covered by mandatory fuel economy standards 70% 33% 60% 28% 38% 27% 31% 30% Source: Management estimates based on COP21 country submissions, World Bank and IMF data. Targets are increasing globally

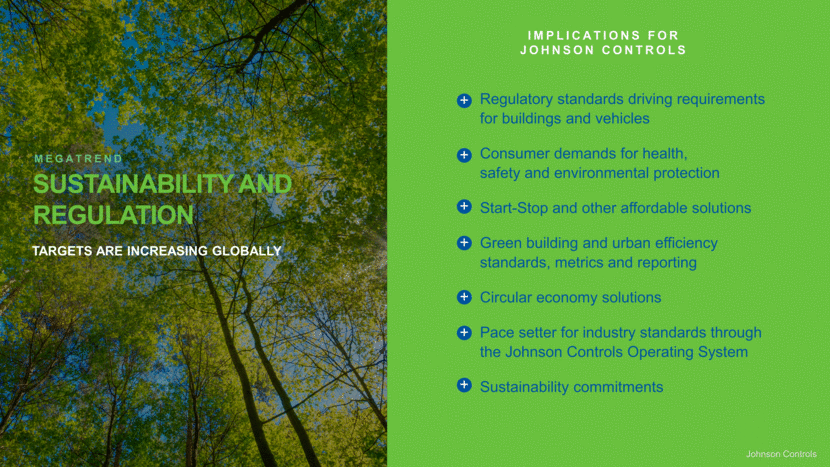
Johnson Controls Regulatory standards driving requirements for buildings and vehicles Consumer demands for health, safety and environmental protection Start-Stop and other affordable solutions Green building and urban efficiency standards, metrics and reporting Circular economy solutions Pace setter for industry standards through the Johnson Controls Operating System Sustainability commitments Implications for Johnson Controls + + + + + + + SUSTAINABILITY AND REGULATION Targets are increasing globally MEGATREND
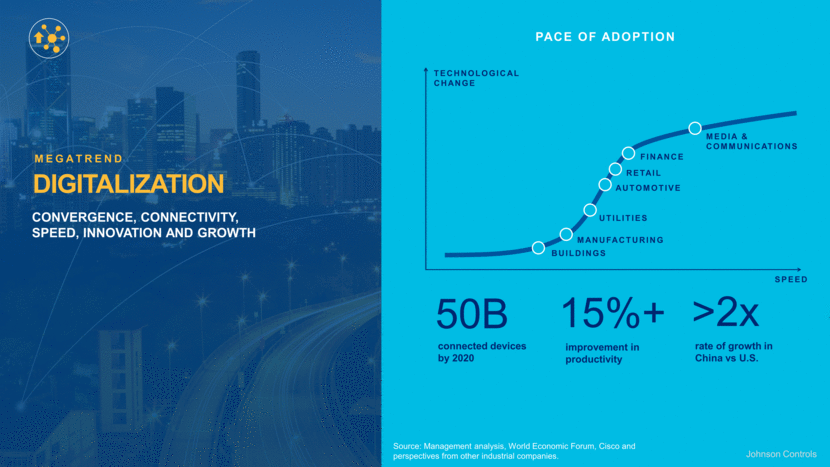
connected devices by 2020 50B improvement in productivity 15%+ Pace of adoption >2x rate of growth in China vs U.S. DIGITALIZATION MEGATREND SPEED TECHNOLOGICAL CHANGE convergence, connectivity, speed, innovation AND growth Johnson Controls BUILDINGS MANUFACTURING RETAIL FINANCE AUTOMOTIVE UTILITIES MEDIA & COMMUNICATIONS Source: Management analysis, World Economic Forum, Cisco and perspectives from other industrial companies.
MEGATREND DIGITALIZATION Johnson Controls Implications for Johnson Controls Technology convergence Smart connected products and solutions Advanced analytics and services Digitalization of value chain Cybersecurity Autonomy Augmented intelligence and virtual reality Agility and speed + + + + + + + + convergence, connectivity, speed, innovation AND growth

$450B addressed trend-driven markets 3-5x Background GDP growth where trends combine Johnson Controls Markets are favorable for Johnson controls, we are positioned & investing to win Distributed energy and infrastructure Robust Core Businesses Smart devices Advanced batteries Integrated solutions Global growth China Expanding Value & Reach Smart buildings Smart cities Global growth in next wave markets Segment adjacencies Sustained Growth Data and analytics Digitalization Value-added solutions
[LOGO]

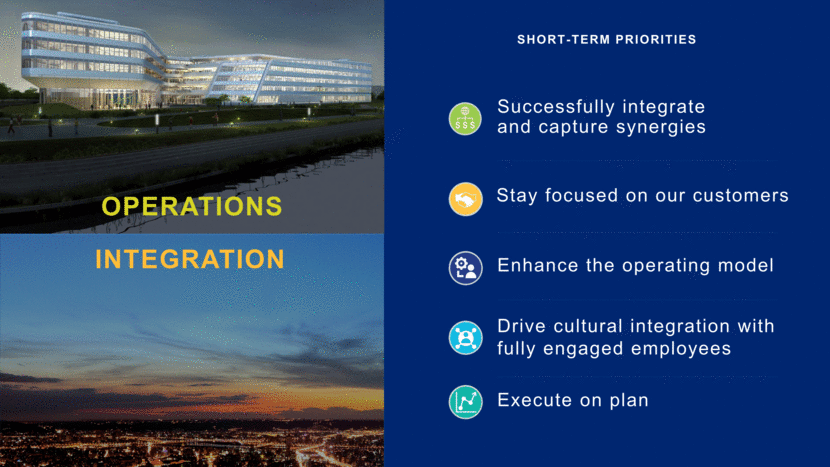
INTEGRATION Short-term priorities OPERATIONS Successfully integrate and capture synergies Stay focused on our customers Enhance the operating model Drive cultural integration with fully engaged employees Execute on plan
Positioned to win— two complementary strategic platforms Cost savings & synergies to expand margins Accelerated Growth 1 2 3 Strategic focus Intense focus on achieving cost synergies Combine and leverage operating systems Drive productivity initiatives Global products leader in HVAC, building controls, fire, security and energy storage Global installation and service leader with unmatched branch network Strong portfolio of brands Drive commercial excellence leveraging JCOS tools Enhance cross-selling opportunities and expand presence in China/Growth Markets Invest in technology and lead convergence with advanced technology integration

Positioned to Win - Two Complementary Strategic Platforms

Leading provider of building technology, products and solutions Global leader and largest manufacturer of automotive batteries, powering nearly every type of vehicle Direct access and customer via global branch network Play across building system life cycle Leading provider across product technology continuum Advantaged manufacturing scale and process technology Consistent performance and growth throughout cycle CONSUMER AFTERMARKET 74% Organized in two strategic platforms BUILDING TECHNOLOGIES & SOLUTIONS POWER SOLUTIONS SALES $23B $2.9B EBITA* SALES $7B $1.3B EBITA* FY16 SALES FY16 SALES * EBITA before special items is a non-GAAP measure. See appendix for reconciliation. SERVICE 35% INSTALL 31% PRODUCTS 34% OE 26%
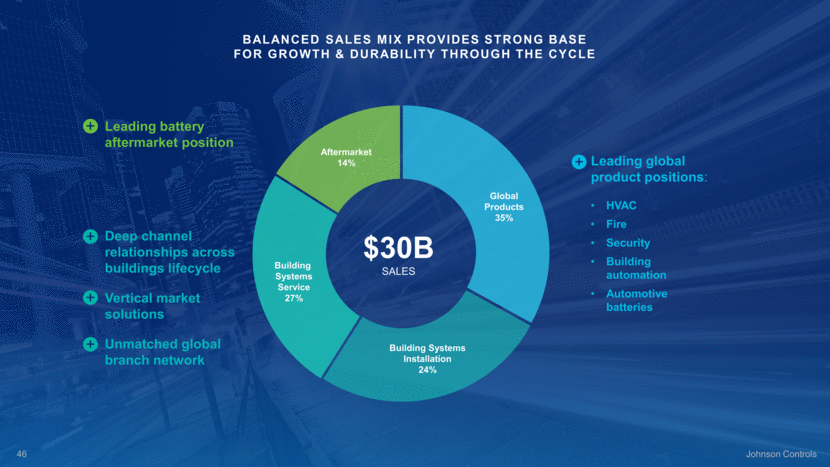
$30B SALES BALANCED SALES MIX PROVIDES STRONG BASE FOR GROWTH & DURABILITY THROUGH THE CYCLE Leading battery aftermarket position + Deep channel relationships across buildings lifecycle Vertical market solutions Unmatched global branch network + + + Leading global product positions: HVAC Fire Security Building automation Automotive batteries + Aftermarket 14% Global Products 35% Building Systems Installation 24% Building Systems Service 27%
Power Solutions Johnson Controls

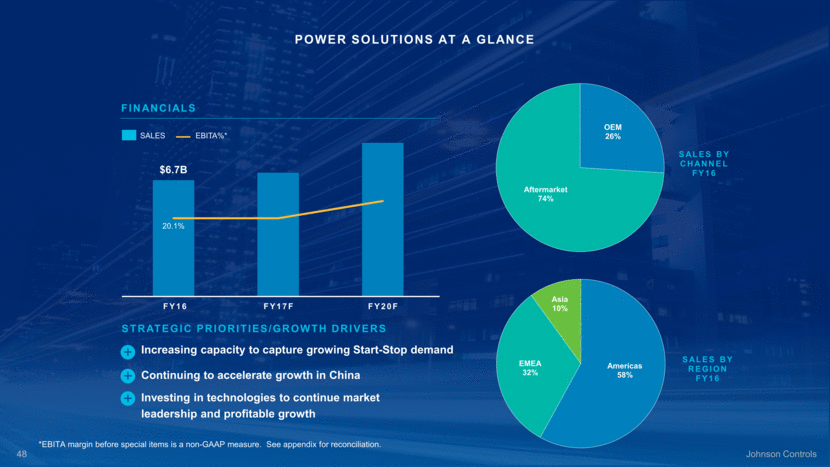
$6.7B POWER SOLUTIONS AT A GLANCE STRATEGIC PRIORITIES/GROWTH DRIVERS Increasing capacity to capture growing Start-Stop demand Continuing to accelerate growth in China Investing in technologies to continue market leadership and profitable growth + + + FY16 FY17F FY20F FINANCIALS SALES EBITA%* *EBITA margin before special items is a non-GAAP measure. See appendix for reconciliation. 20.1% OEM 26% Aftermarket 74% SALES BY CHANNEL FY16 Americas 58% EMEA 32% Asia 10% SALES BY REGION FY16
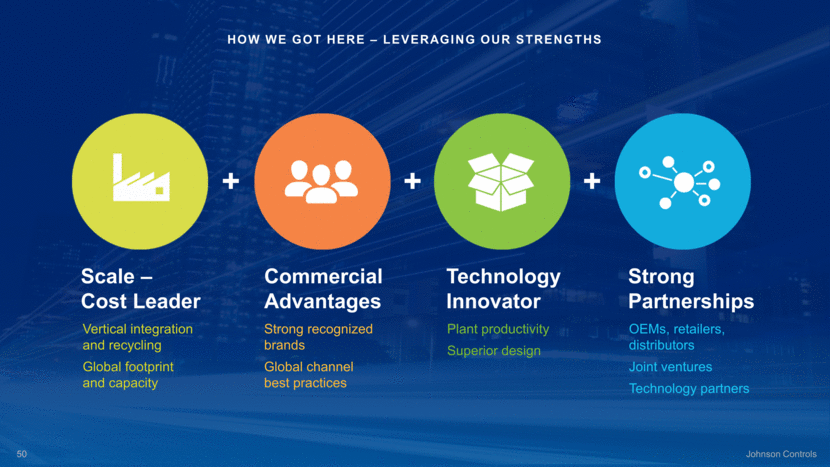
49 POWER SOLUTIONS IS THE INDUSTRY LEADER WITH SIGNIFICANT COMPETITIVE ADVANTAGES STRONG RECOGNIZED BRANDS

Vertical integration and recycling Global footprint and capacity Scale – Cost Leader Technology Innovator Plant productivity Superior design Commercial Advantages Strong recognized brands Global channel best practices Strong Partnerships OEMs, retailers, distributors Joint ventures Technology partners + + + HOW WE GOT HERE – LEVERAGING OUR STRENGTHS
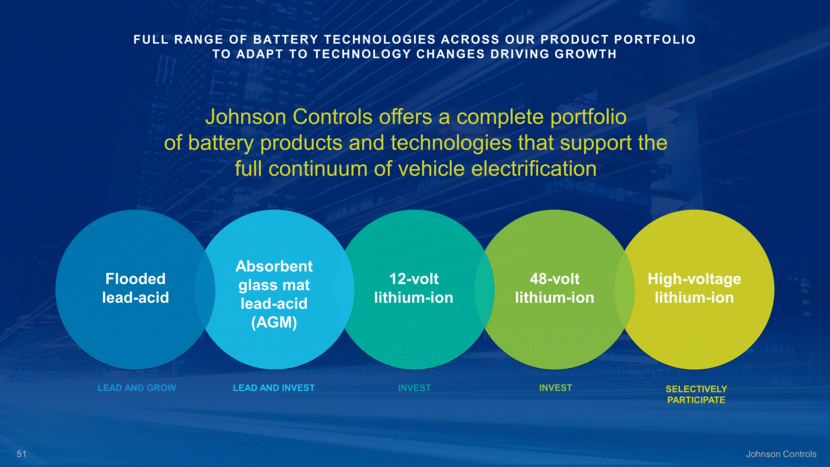
LEAD AND INVEST LEAD AND GROW INVEST SELECTIVELY PARTICIPATE INVEST Johnson Controls offers a complete portfolio of battery products and technologies that support the full continuum of vehicle electrification Absorbent glass mat lead-acid (AGM) 12-volt lithium-ion 48-volt lithium-ion High-voltage lithium-ion Flooded lead-acid Full range of battery technologies across our product portfolio to adapt to technology changes driving growth
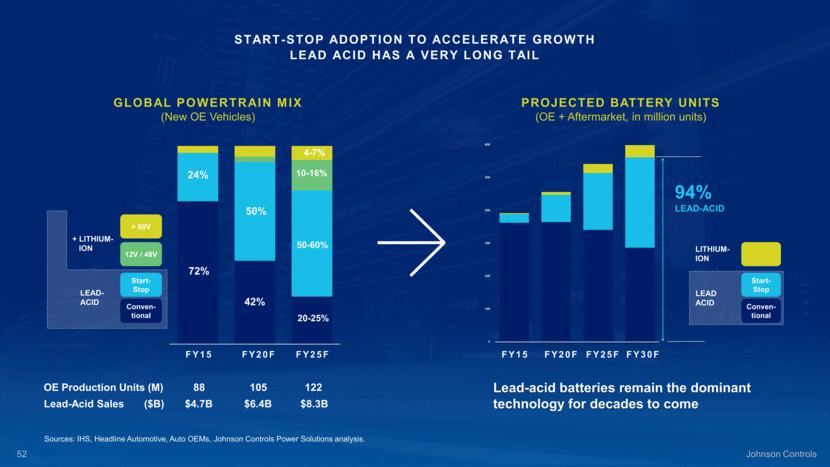
88 105 122 > 60V Start- Stop Conven- tional 12V / 48V OE Production Units (M) FY25F FY20F FY15 20-25% 24% 50-60% 4-7% 72% 50% 42% 10-16% GLOBAL POWERTRAIN MIX (New OE Vehicles) $4.7B $6.4B $8.3B Lead-Acid Sales ($B) LITHIUM- ION LEAD ACID Start- Stop Conven-tional PROJECTED BATTERY UNITS (OE + Aftermarket, in million units) Lead-acid batteries remain the dominant technology for decades to come 94% LEAD-ACID FY25F FY20F FY15 + LITHIUM- ION LEAD- ACID FY30F Start-stop adoption to accelerate growth lead acid has a very long tail Sources: IHS, Headline Automotive, Auto OEMs, Johnson Controls Power Solutions analysis. 0 100 200 300 400 500 600
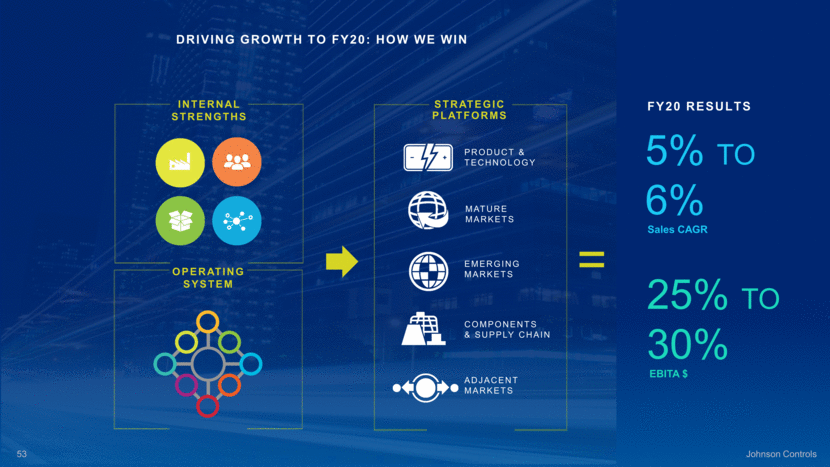
= FY20 results Driving growth to FY20: how we win MATURE MARKETS STRATEGIC PLATFORMS ADJACENT MARKETS PRODUCT & TECHNOLOGY EMERGING MARKETS COMPONENTS & SUPPLY CHAIN 5% TO 6% Sales CAGR 25% TO 30% EBITA $ INTERNAL STRENGTHS OPERATING SYSTEM
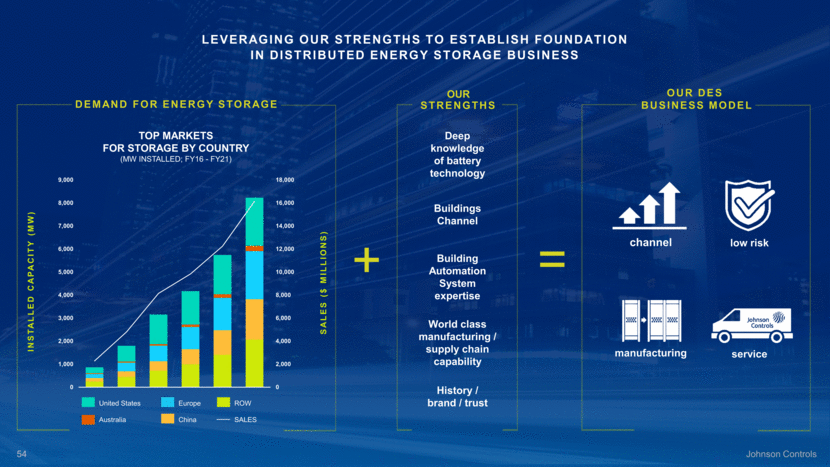
+ = China Europe SALES Australia United States ROW OUR STRENGTHS Deep knowledge of battery technology Buildings Channel Building Automation System expertise World class manufacturing / supply chain capability History / brand / trust DEMAND FOR ENERGY STORAGE TOP MARKETS FOR STORAGE BY COUNTRY (MW INSTALLED; FY16 - FY21) SALES ($ MILLIONS) INSTALLED CAPACITY (MW) Leveraging our strengths to establish foundation in distributed energy storage business OUR DES BUSINESS MODEL low risk manufacturing service channel
Building Technologies & Solutions Johnson Controls

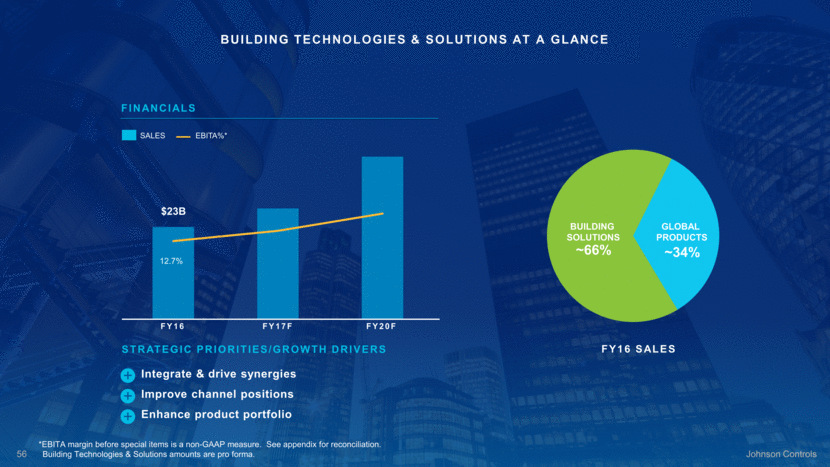
FINANCIALS $23B BUILDING TECHNOLOGIES & SOLUTIONS AT A GLANCE SALES EBITA%* Integrate & drive synergies Improve channel positions Enhance product portfolio STRATEGIC PRIORITIES/GROWTH DRIVERS + + + FY16 FY17F FY20F 12.7% GLOBAL PRODUCTS BUILDING SOLUTIONS FY16 SALES *EBITA margin before special items is a non-GAAP measure. See appendix for reconciliation. Building Technologies & Solutions amounts are pro forma. ~66% ~34%
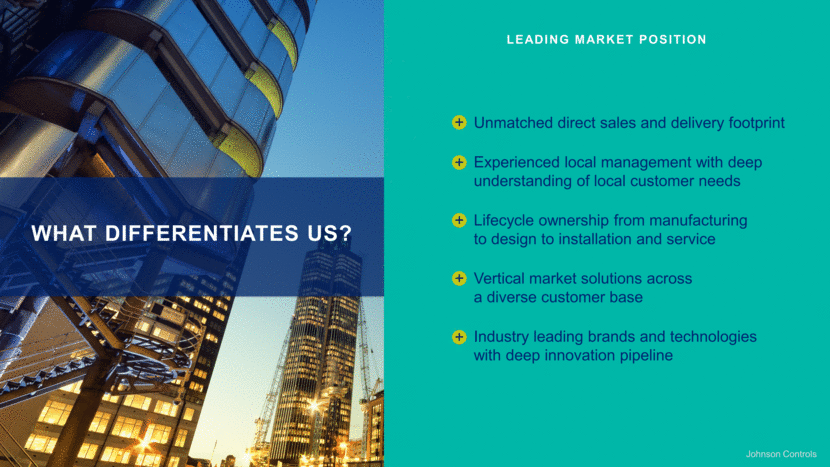
LEADING MARKET POSITION WHAT DIFFERENTIATES US? Unmatched direct sales and delivery footprint Experienced local management with deep understanding of local customer needs Lifecycle ownership from manufacturing to design to installation and service Vertical market solutions across a diverse customer base Industry leading brands and technologies with deep innovation pipeline + + + + + Johnson Controls
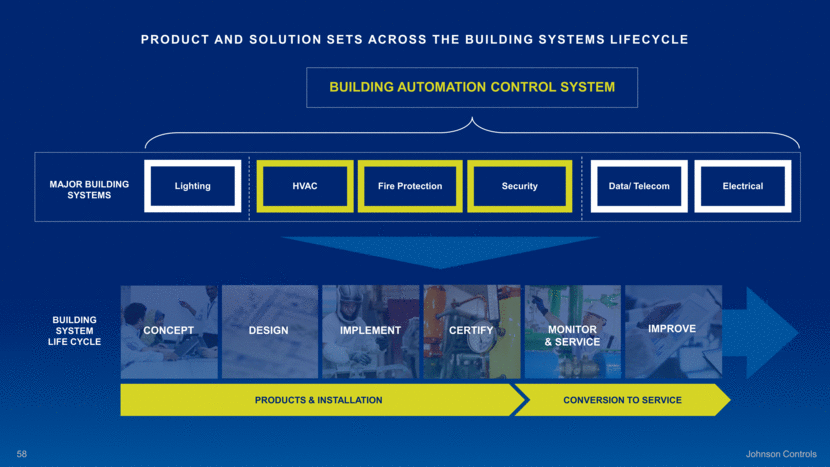
BUILDING AUTOMATION CONTROL SYSTEM BUILDING SYSTEM LIFE CYCLE CONCEPT DESIGN IMPLEMENT CERTIFY MONITOR & SERVICE IMPROVE PRODUCT AND SOLUTION SETS ACROSS THE BUILDING SYSTEMS LIFECYCLE PRODUCTS & INSTALLATION CONVERSION TO SERVICE HVAC Lighting Fire Protection Security Data/ Telecom Electrical MAJOR BUILDING SYSTEMS
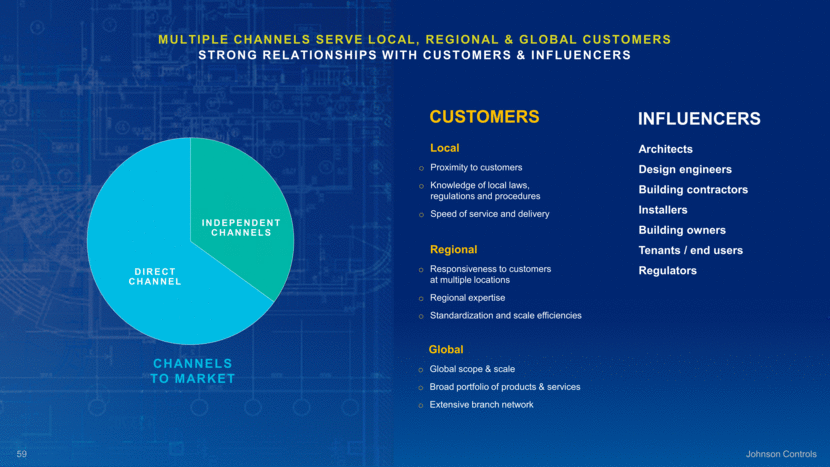
MULTIPLE CHANNELS SERVE LOCAL, REGIONAL & GLOBAL CUSTOMERS STRONG RELATIONSHIPS WITH CUSTOMERS & INFLUENCERS INDEPENDENT CHANNELS DIRECT CHANNEL INFLUENCERS Architects Design engineers Building contractors Installers Building owners Tenants / end users Regulators CUSTOMERS Proximity to customers Knowledge of local laws, regulations and procedures Speed of service and delivery Responsiveness to customers at multiple locations Regional expertise Standardization and scale efficiencies Global scope & scale Broad portfolio of products & services Extensive branch network Local Regional Global CHANNELS TO MARKET
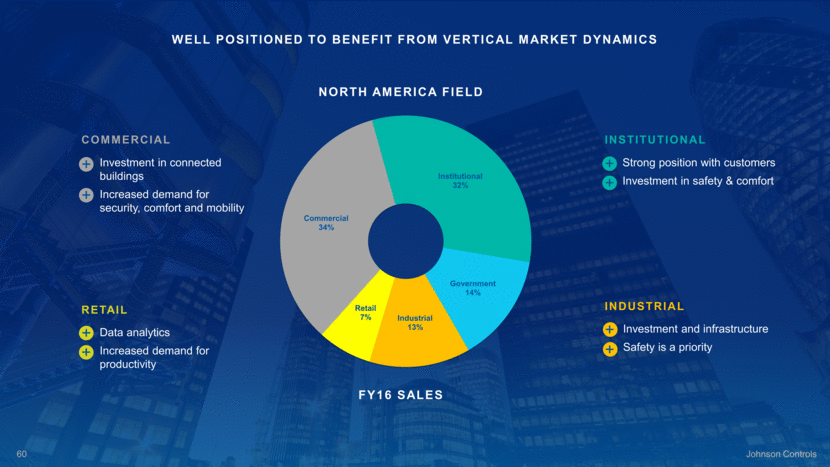
WELL POSITIONED TO BENEFIT FROM VERTICAL MARKET DYNAMICS INDUSTRIAL Investment and infrastructure Safety is a priority + + INSTITUTIONAL Strong position with customers Investment in safety & comfort + + FY16 SALES NORTH AMERICA FIELD COMMERCIAL Investment in connected buildings Increased demand for security, comfort and mobility + + RETAIL Data analytics Increased demand for productivity + + Commercial 34% Institutional 32% Government 14% Industrial 13% Retail 7%
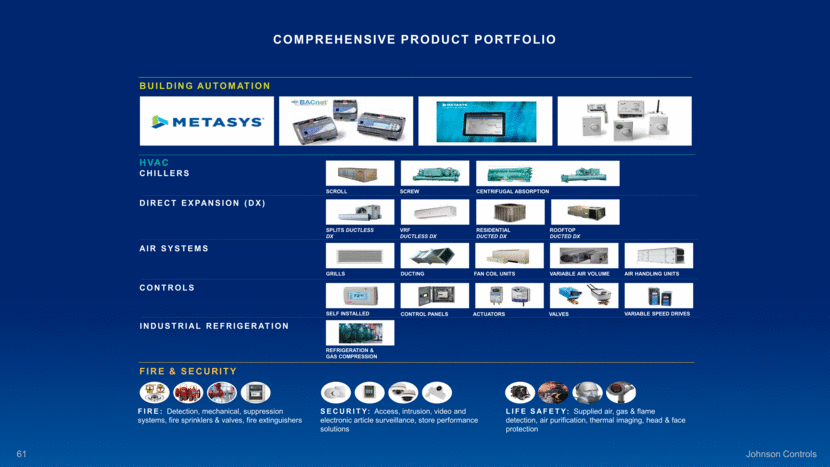
FIRE & SECURITY FIRE: Detection, mechanical, suppression systems, fire sprinklers & valves, fire extinguishers SECURITY: Access, intrusion, video and electronic article surveillance, store performance solutions LIFE SAFETY: Supplied air, gas & flame detection, air purification, thermal imaging, head & face protection CHILLERS DIRECT EXPANSION (DX) AIR SYSTEMS CONTROLS HVAC SCROLL SCREW CENTRIFUGAL ABSORPTION SPLITS DUCTLESS DX VRF DUCTLESS DX RESIDENTIAL DUCTED DX ROOFTOP DUCTED DX GRILLS DUCTING FAN COIL UNITS VARIABLE AIR VOLUME AIR HANDLING UNITS SELF INSTALLED CONTROL PANELS ACTUATORS VALVES VARIABLE SPEED DRIVES INDUSTRIAL REFRIGERATION REFRIGERATION & GAS COMPRESSION BUILDING AUTOMATION Comprehensive product portfolio
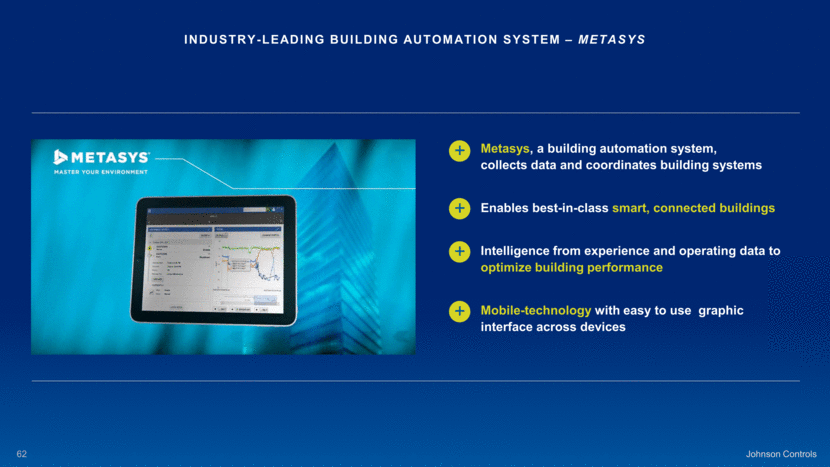
Johnson Controls Industry-leading building automation system – metasys Metasys, a building automation system, collects data and coordinates building systems Enables best-in-class smart, connected buildings Intelligence from experience and operating data to optimize building performance Mobile-technology with easy to use graphic interface across devices + + + +
integrated solutions COMBINED, CONNECTED PLATFORM HELPS CUSTOMERS MANAGE WHAT MATTERS Johnson Controls CONTROLS HVAC/EQUIP SECURITY FIRE AND HAZARD PROTECTION BUILDING SERVICES & PARTS LIGHTING, CONTROL & RETROFIT OPERATIONAL INTELLIGENCE AND LOSS PREVENTION ENERGY STORAGE RETAIL SYSTEMS TOTAL BUILDING MANAGEMENT SYSTEMS Combine technology with advanced analytics Building systems throughout a facility work together Customers gain actionable building and security intelligence + + +

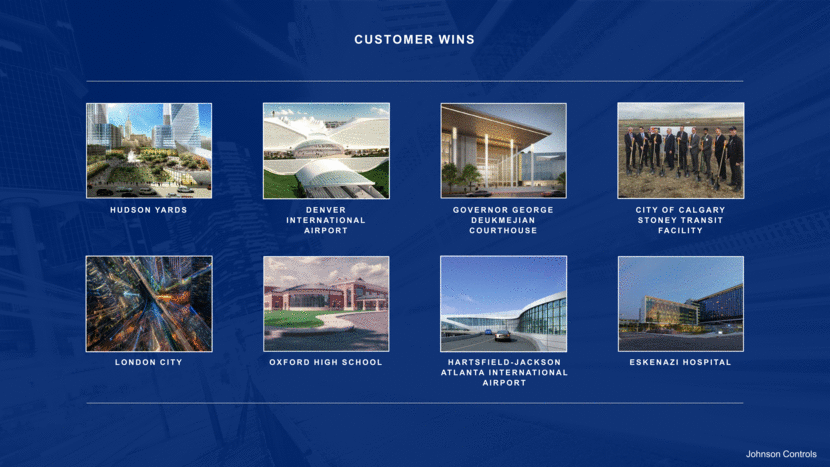
Johnson Controls Customer wins HUDSON YARDS DENVER INTERNATIONAL AIRPORT GOVERNOR GEORGE DEUKMEJIAN COURTHOUSE OXFORD HIGH SCHOOL HARTSFIELD-JACKSON ATLANTA INTERNATIONAL AIRPORT ESKENAZI HOSPITAL LONDON CITY CITY OF CALGARY STONEY TRANSIT FACILITY
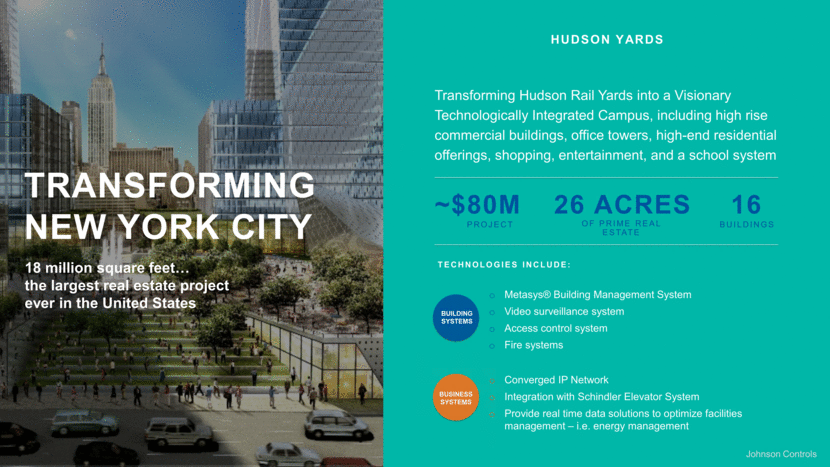
TECHNOLOGIES INCLUDE: BUILDING SYSTEMS BUSINESS SYSTEMS Metasys® Building Management System Video surveillance system Access control system Fire systems Converged IP Network Integration with Schindler Elevator System Provide real time data solutions to optimize facilities management – i.e. energy management Hudson yards Transforming Hudson Rail Yards into a Visionary Technologically Integrated Campus, including high rise commercial buildings, office towers, high-end residential offerings, shopping, entertainment, and a school system 16 26 ACRES OF PRIME REAL ESTATE BUILDINGS ~$80M PROJECT TRANSFORMING NEW YORK CITY 18 million square feet the largest real estate project ever in the United States Johnson Controls
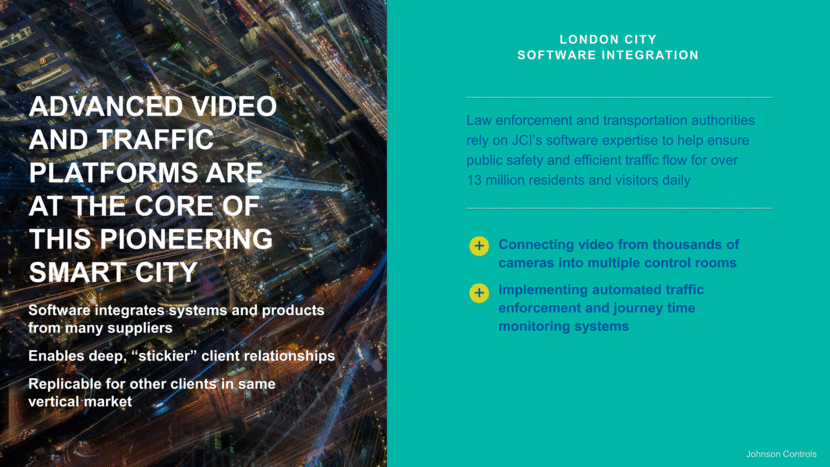
ADVANCED VIDEO AND TRAFFIC PLATFORMS ARE AT THE CORE OF THIS PIONEERING SMART CITY Software integrates systems and products from many suppliers Enables deep, “stickier” client relationships Replicable for other clients in same vertical market Johnson Controls London city software integration Law enforcement and transportation authorities rely on JCI’s software expertise to help ensure public safety and efficient traffic flow for over 13 million residents and visitors daily Connecting video from thousands of cameras into multiple control rooms Implementing automated traffic enforcement and journey time monitoring systems + +
Integration: Off to a Strong Start

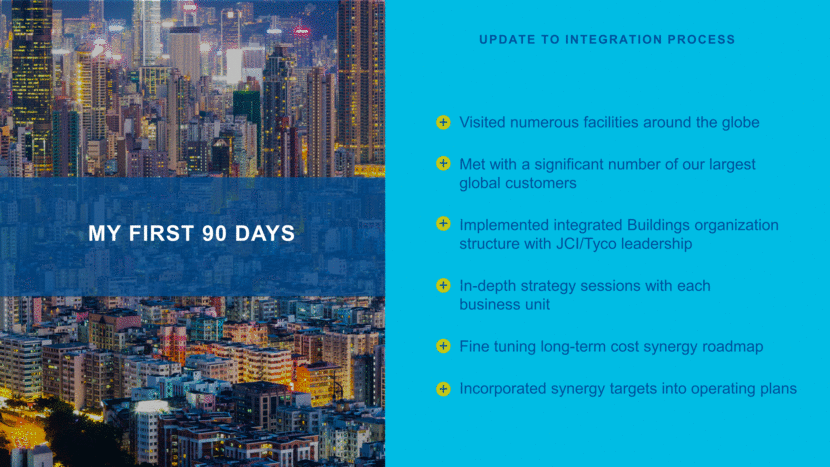
MY FIRST 90 DAYS Visited numerous facilities around the globe Met with a significant number of our largest global customers Implemented integrated Buildings organization structure with JCI/Tyco leadership In-depth strategy sessions with each business unit Fine tuning long-term cost synergy roadmap Incorporated synergy targets into operating plans + + + + + + Update to integration process
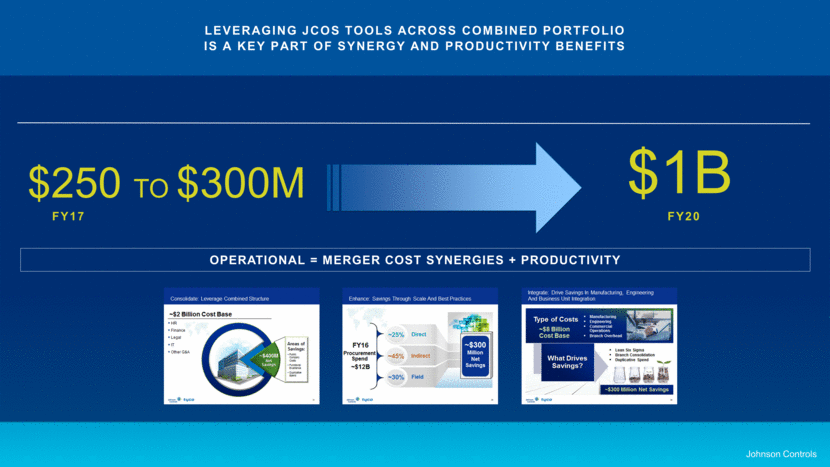
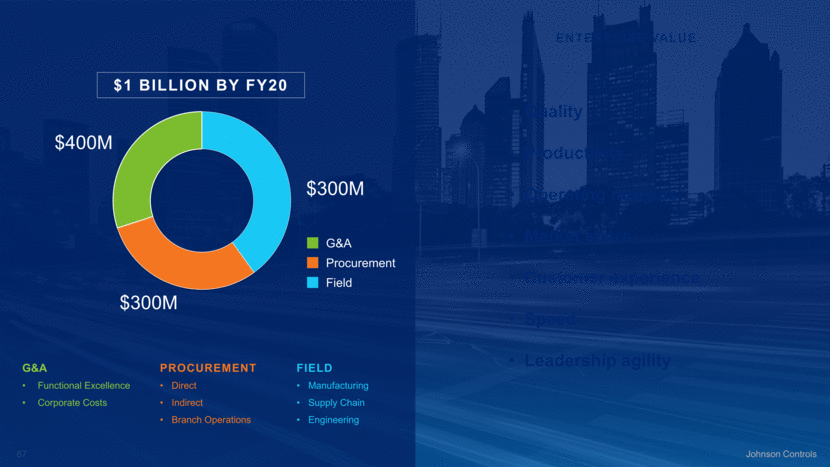
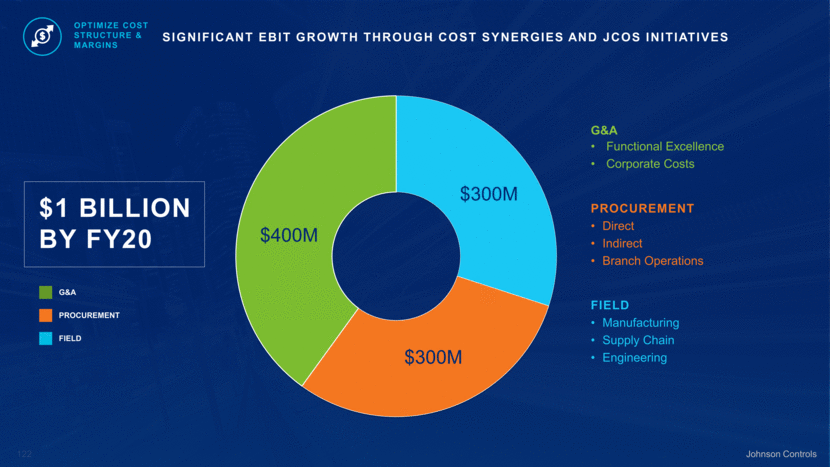
~$400M (40% of Total Net Savings) CONSOLIDATE ~$300M (30% of Total Net Savings) ENHANCE SAVINGS AREA PROCUREMENT ~$300M (30% of Total Net Savings) INTEGRATE FIELD G&A + + SAVINGS $ Manufacturing Supply Chain Engineering Direct: ~25% Indirect: ~45% Branch Operations: ~30% Functional Excellence Corporate Costs Johnson Controls GENERATING ~$1 BILLION NET OPERATIONAL SAVINGS Cost synergies come from 3 primary areas

FY17 $250 TO $300M FY20 $1B Leveraging JCOS tools ACROSS combined portfolio is a key part of synergy and productivity benefits Johnson Controls OPERATIONAL = MERGER COST SYNERGIES + PRODUCTIVITY
Branch Network Optimization Creates Significant Synergy Opportunities In Both The Short-Term and Long-Term Johnson Controls SQUARE FEET LOGISTICS & DISTRIBUTION WAREHOUSES BACK OFFICES DESIGN ~20M square feet Siloed logistics and distribution structure Branch warehouses Individual back offices Distributed design teams Double digit reduction over next 4 years Integrated networks Hub and spoke network Centralized services Centers of Excellence CONTRIBUTING TO $300M OF FIELD SAVINGS + FY16 FY20 + + + +

Accelerated Growth from Combination

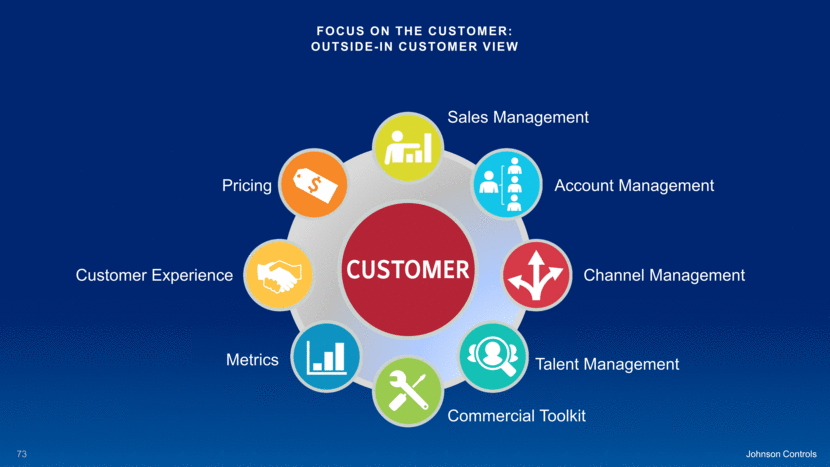
Account Management Channel Management Talent Management Commercial Toolkit Metrics Customer Experience Pricing Sales Management Focus on the customer: outside-in customer view Johnson Controls
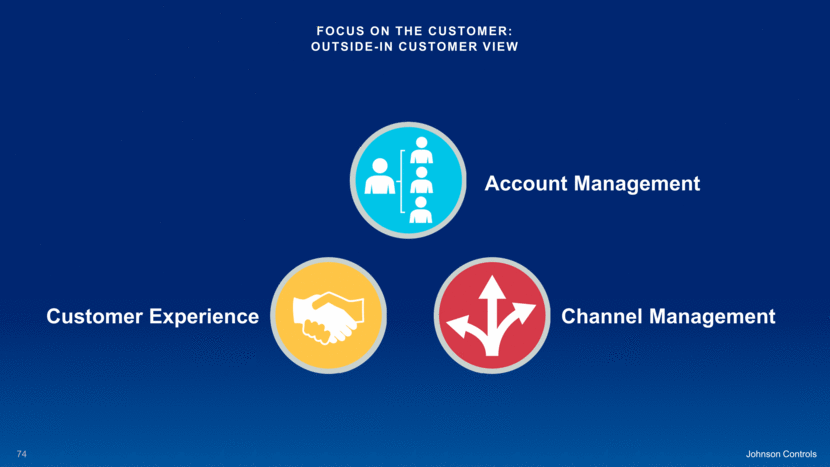
Account Management Channel Management Customer Experience Focus on the customer: outside-in customer view Johnson Controls
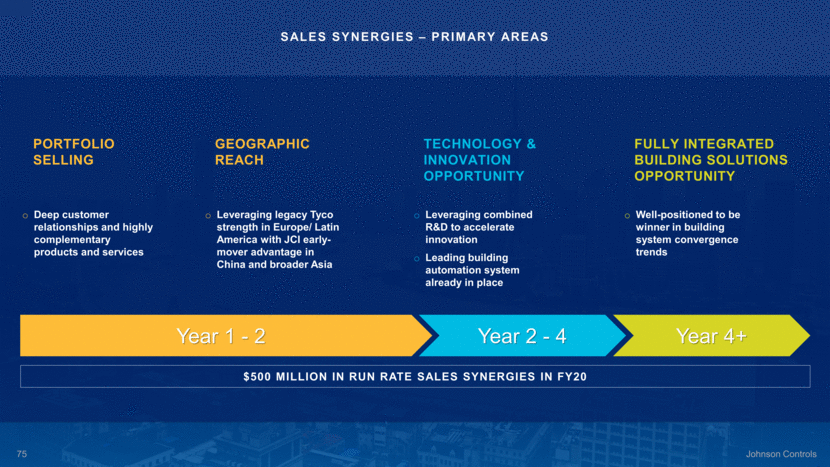
Well-positioned to be winner in building system convergence trends Year 1 - 2 Year 2 - 4 Year 4+ Sales synergies – primary areas fully integrated building solutions opportunity Leveraging combined R&D to accelerate innovation Leading building automation system already in place Technology & innovation opportunity Leveraging legacy Tyco strength in Europe/ Latin America with JCI early-mover advantage in China and broader Asia Geographic REACH Deep customer relationships and highly complementary products and services Portfolio selling $500 MILLION IN RUN RATE SALES SYNERGIES IN FY20
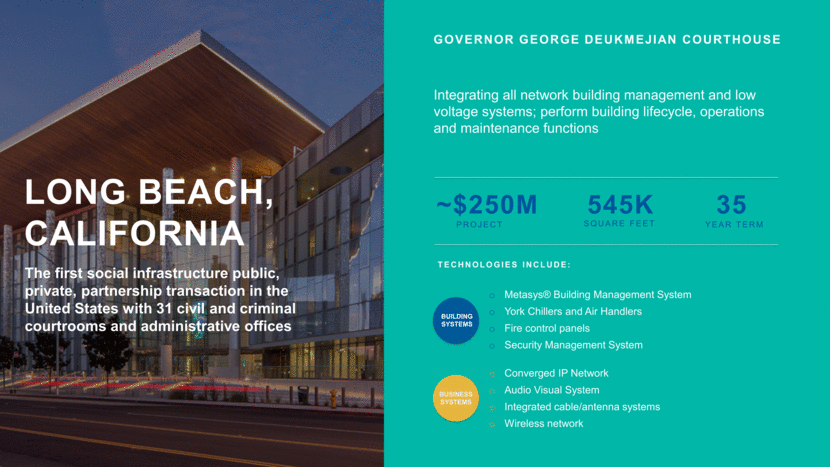
TECHNOLOGIES INCLUDE: BUILDING SYSTEMS BUSINESS SYSTEMS Metasys® Building Management System York Chillers and Air Handlers Fire control panels Security Management System Converged IP Network Audio Visual System Integrated cable/antenna systems Wireless network Governor George Deukmejian Courthouse Integrating all network building management and low voltage systems; perform building lifecycle, operations and maintenance functions ~$250M PROJECT LONG BEACH, CALIFORNIA The first social infrastructure public, private, partnership transaction in the United States with 31 civil and criminal courtrooms and administrative offices 35 545K SQUARE FEET YEAR TERM
SIGNIFICANT VALUE CREATION Johnson Controls $1.2B+ Add’l Cost / Productivity Opportunities $100M Sales Synergies $500M (EBIT Contribution ~$85M to $100M) + WHAT WE SAID AT EPG WHAT IS NEW EXPECTED TO CONTRIBUTE ~$1.10 OF EPS BY FY20 +
Conclusion and Recap

Positioned to win — two complementary strategic platforms 1 Cost savings & synergies to expand margins 2 Accelerated Growth 3 Strategic focus
[LOGO]

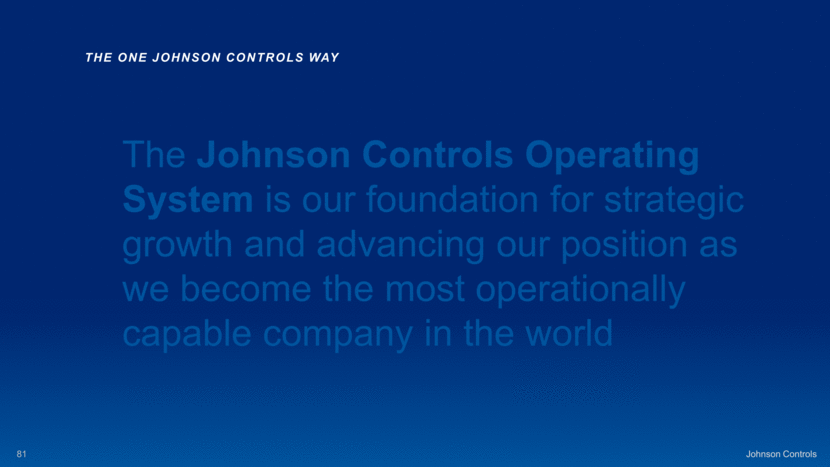
The Johnson Controls Operating System is our foundation for strategic growth and advancing our position as we become the most operationally capable company in the world The ONE Johnson Controls Way
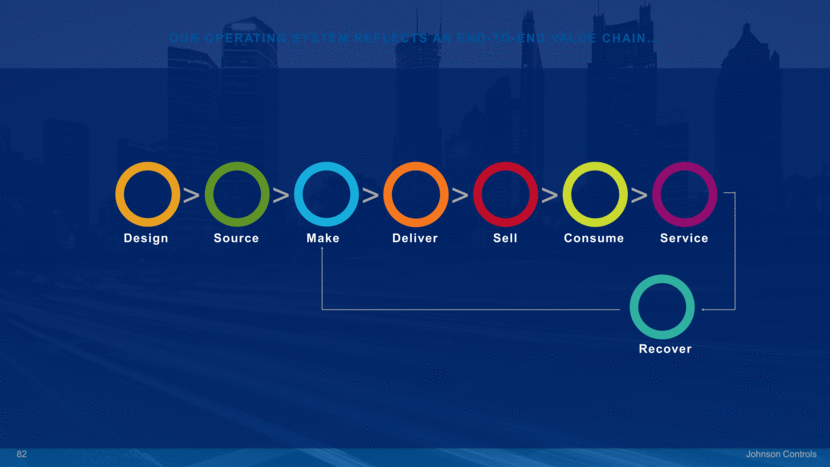
Design Source Make Deliver Sell Consume Service Recover > > > > > > For the chart that builds first, change Consume to Yellow/Functional Excellence, Service to Instal/Service which is Purple, and Recover to Environmental Health&Safety, Teal Our Operating System Reflects an End-to-End Value Chain
Johnson Controls Operating System Engineering Marketing & Sales Manufacturing Environmental Health & Safety Functional Excellence Installation & Services Procurement Supply Chain
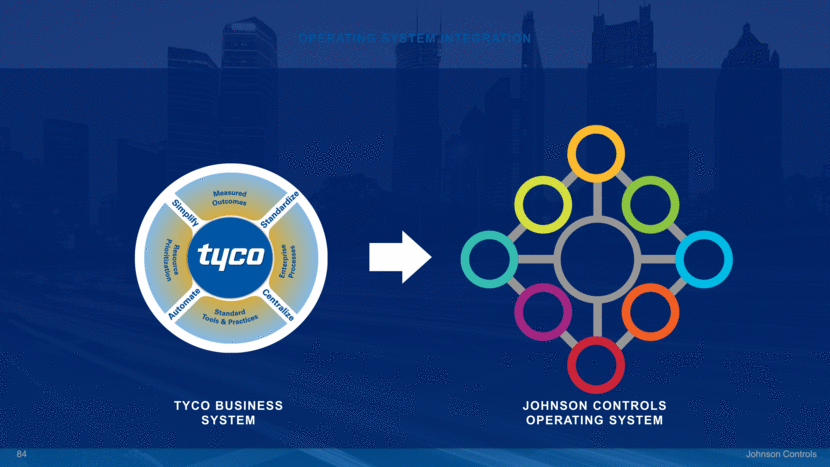
Operating System Integration TYCO BUSINESS SYSTEM JOHNSON CONTROLS OPERATING SYSTEM
Marketing & Sales Manufacturing Environmental Health & Safety Functional Excellence Installation & Services Procurement Supply Chain Engineering CREATING THE ONE WAY

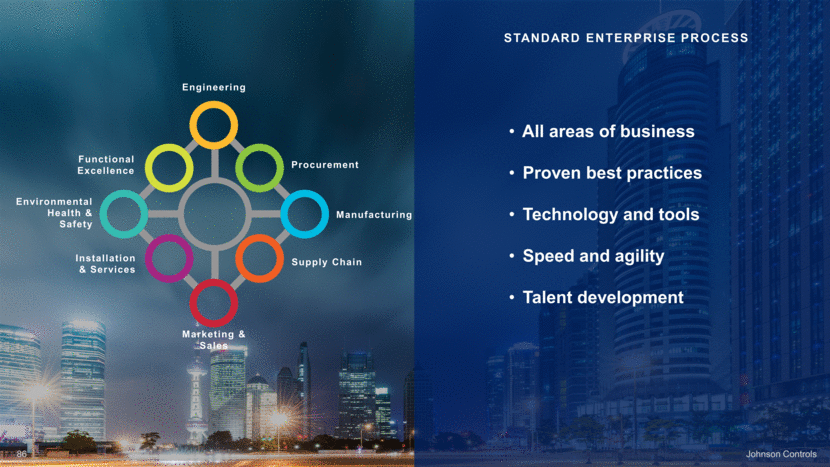
STANDARD ENTERPRISE PROCESS Engineering Marketing & Sales Manufacturing Environmental Health & Safety Functional Excellence Installation & Services Procurement Supply Chain All areas of business Proven best practices Technology and tools Speed and agility Talent development 86 Johnson Controls
Quality Productivity Operating margins Market share Customer experience Speed Leadership agility G&A Procurement Field $300M $400M $300M $1 BILLION by FY20 ENTERPRISE VALUE G&A Functional Excellence Corporate Costs FIELD Manufacturing Supply Chain Engineering PROCUREMENT Direct Indirect Branch Operations
Accretive financials Bridging platforms Enriching capabilities Improved metrics Customer recognition PROGRESS OVER PAST 12 MONTHS Operationalized process Operationalized process 88

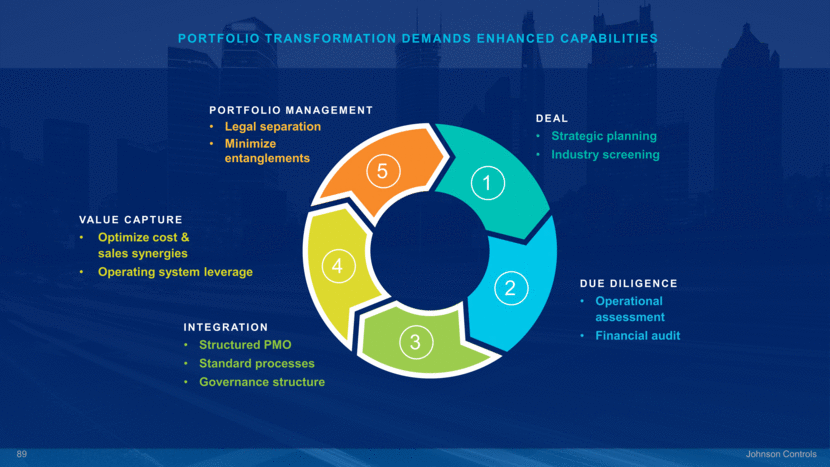
PORTFOLIO TRANSFORMATION DEMANDS ENHANCED CAPABILITIES PORTFOLIO MANAGEMENT Legal separation Minimize entanglements 1 2 3 5 DUE DILIGENCE Operational assessment Financial audit INTEGRATION Structured PMO Standard processes Governance structure VALUE CAPTURE Optimize cost & sales synergies Operating system leverage 4 DEAL Strategic planning Industry screening
GUIDING PRINCIPLES - + MERGER / ACQUISITION DEPLOYMENT: OUR EXPERIENCE IS CURRENTLY BEING leveraged Aggressive synergy targets Business plan commitments Best from both Talent retention Dedicated resources Executive sponsorship Speed Johnson Controls

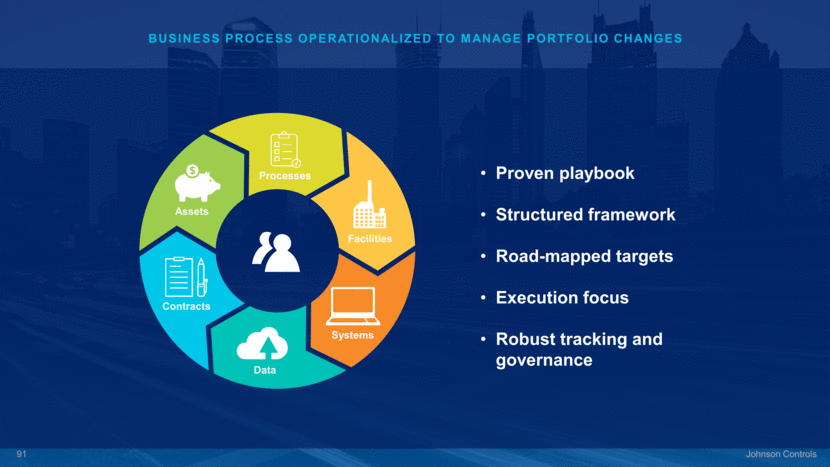
BUSINESS PROCESS OPERATIONALIZED TO MANAGE PORTFOLIO CHANGES Processes Facilities Systems Data Contracts Assets Proven playbook Structured framework Road-mapped targets Execution focus Robust tracking and governance
MATURITY OF KEY VALUE DRIVERS TO $1B GOAL LEVEL ACHIEVED FUNCTIONAL EXCELLENCE PROCUREMENT MANUFACTURING MARKETING & SALES Capabilities Johnson Controls

$400M G&A Functional Excellence Corporate Costs FY20 TARGET Johnson Controls

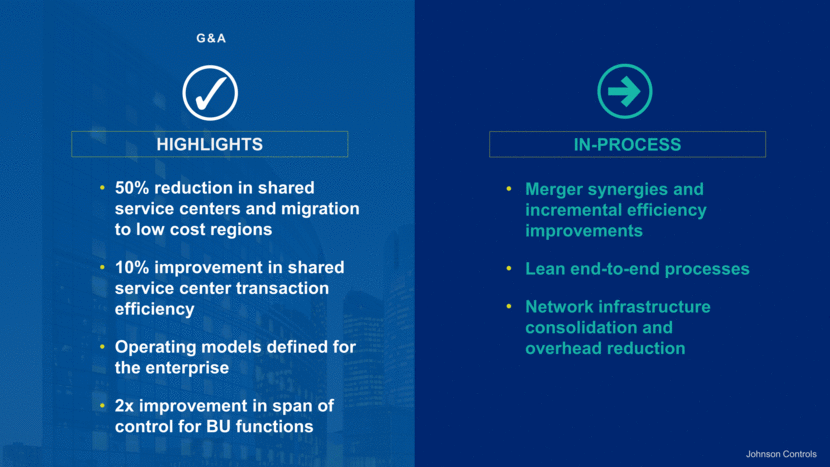
Johnson Controls G&A Merger synergies and incremental efficiency improvements Lean end-to-end processes Network infrastructure consolidation and overhead reduction IN-PROCESS 50% reduction in shared service centers and migration to low cost regions 10% improvement in shared service center transaction efficiency Operating models defined for the enterprise 2x improvement in span of control for BU functions HIGHLIGHTS
Direct Indirect Branch Operations $300M Johnson Controls PROCUREMENT FY20 TARGET

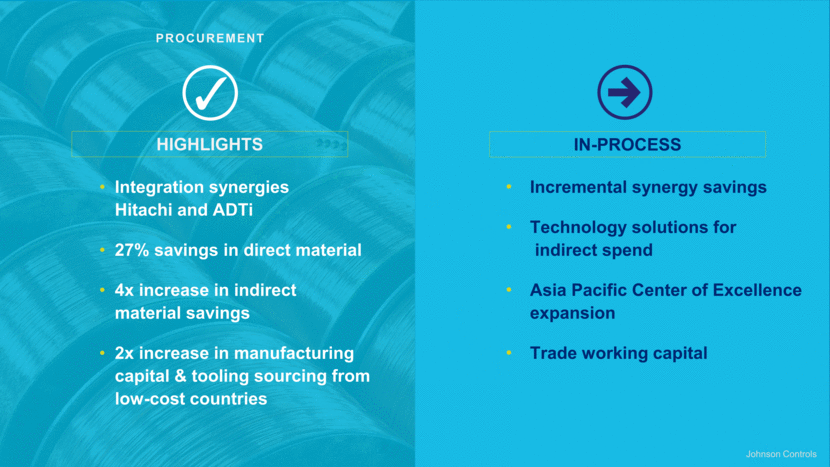
Johnson Controls Procurement Incremental synergy savings Technology solutions for indirect spend Asia Pacific Center of Excellence expansion Trade working capital IN-PROCESS Integration synergies Hitachi and ADTi 27% savings in direct material 4x increase in indirect material savings 2x increase in manufacturing capital & tooling sourcing from low-cost countries HIGHLIGHTS
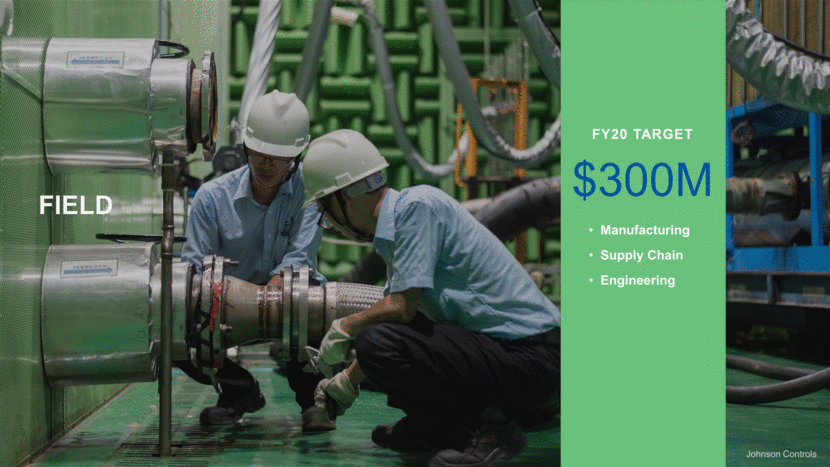
Manufacturing Supply Chain Engineering $300M Johnson Controls FIELD FY20 TARGET
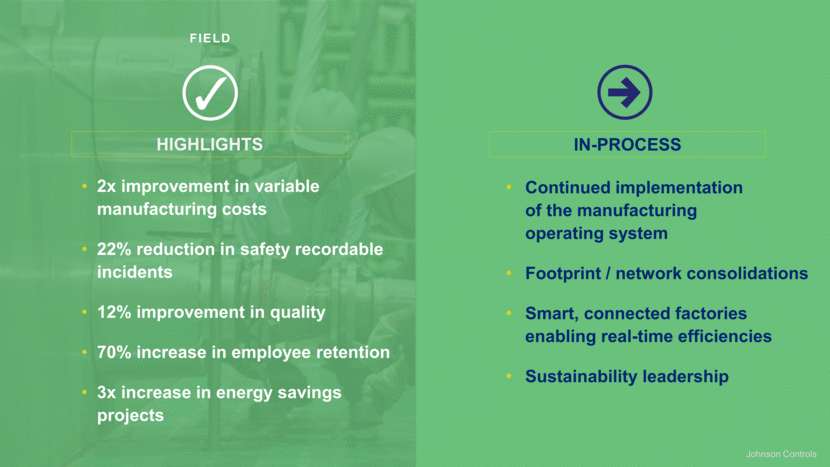
FIELD 2x improvement in variable manufacturing costs 22% reduction in safety recordable incidents 12% improvement in quality 70% increase in employee retention 3x increase in energy savings projects HIGHLIGHTS Continued implementation of the manufacturing operating system Footprint / network consolidations Smart, connected factories enabling real-time efficiencies Sustainability leadership IN-PROCESS Johnson Controls
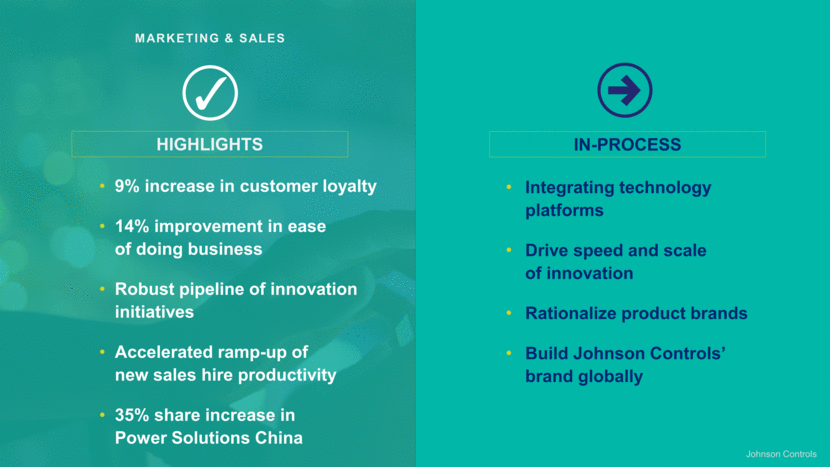
Growth Commercial $500M Johnson Controls MARKETING & SALES FY20 TARGET

Johnson Controls MARKETING & SALES Integrating technology platforms Drive speed and scale of innovation Rationalize product brands Build Johnson Controls’ brand globally IN-PROCESS 9% increase in customer loyalty 14% improvement in ease of doing business Robust pipeline of innovation initiatives Accelerated ramp-up of new sales hire productivity 35% share increase in Power Solutions China HIGHLIGHTS
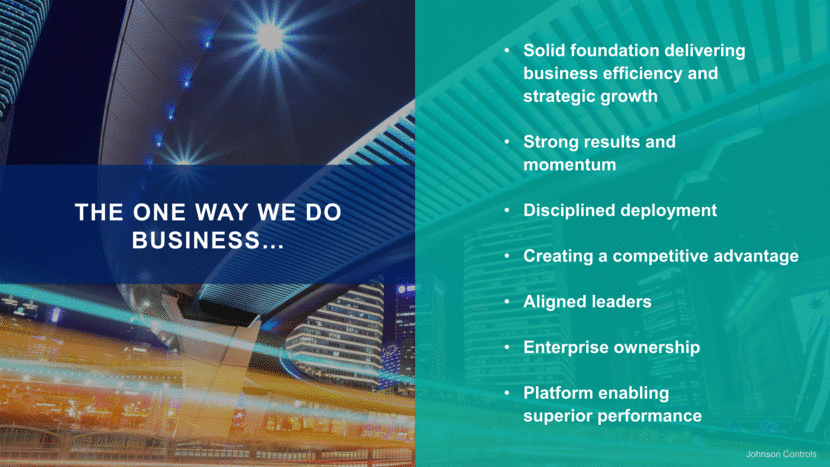
THE ONE WAY WE DO BUSINESS Solid foundation delivering business efficiency and strategic growth Strong results and momentum Disciplined deployment Creating a competitive advantage Aligned leaders Enterprise ownership Platform enabling superior performance Johnson Controls
[LOGO]

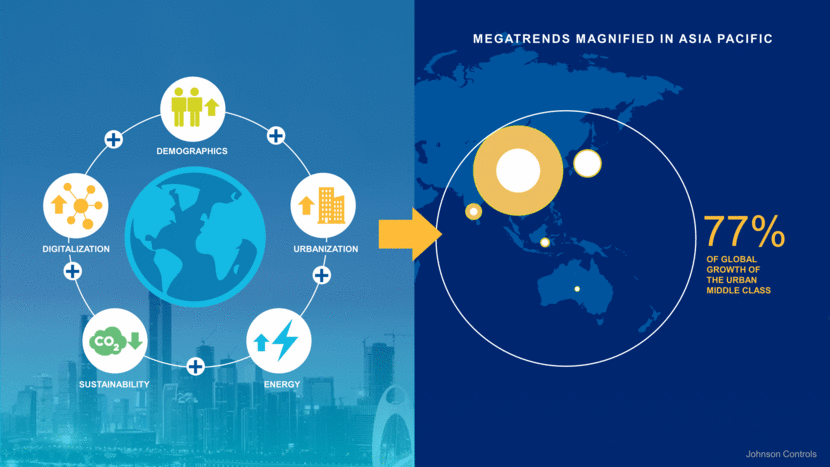
Johnson Controls Megatrends MAGNIFIED in asia pacific 77% OF GLOBAL GROWTH OF THE URBAN MIDDLE CLASS DEMOGRAPHICS URBANIZATION ENERGY DIGITALIZATION SUSTAINABILITY
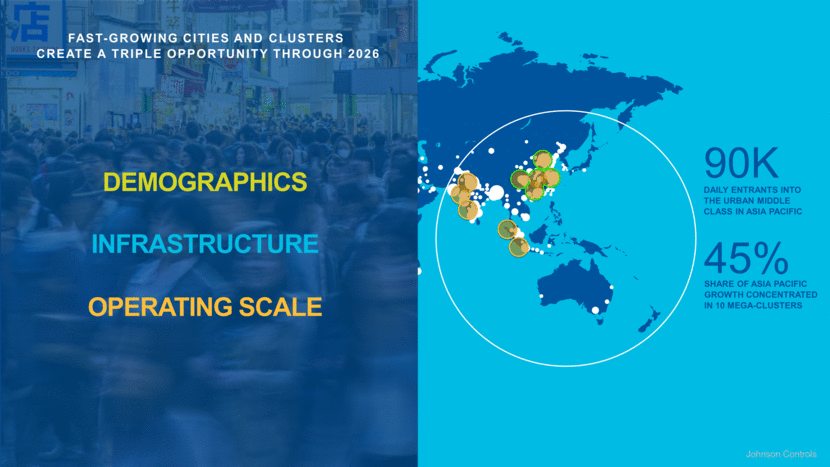
DAILY ENTRANTS INTO THE URBAN MIDDLE CLASS IN ASIA PACIFIC 90K SHARE OF ASIA PACIFIC GROWTH CONCENTRATED IN 10 MEGA-CLUSTERS 45% Fast-Growing cities and clusters CREATE A TRIPLE Opportunity THROUGH 2026 DEMOGRAPHICS INFRASTRUCTURE OPERATING SCALE Johnson Controls
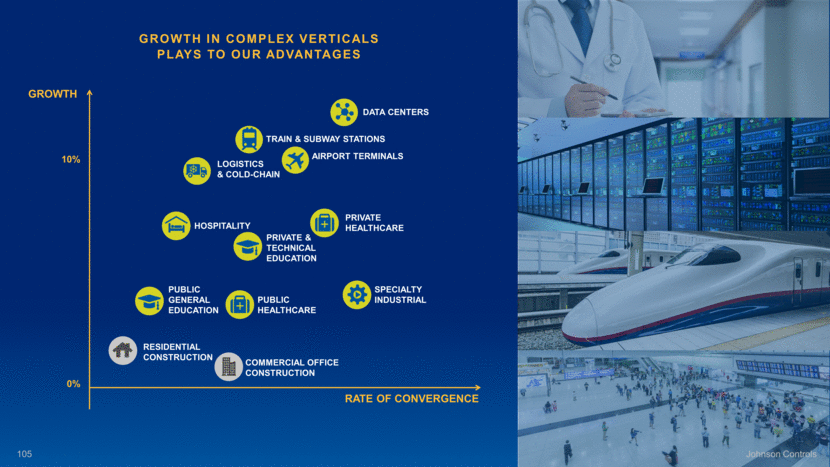
GROWTH RATE OF CONVERGENCE 0% 10% Growth in complex verticals plays to our advantages Commercial OFFICE construction Residential construction Public general education Public healthcare Specialty industrial Private & technical education Hospitality Private healthcare Logistics & cold-chain Train & subway Stations Data centers Airport terminals Johnson Controls
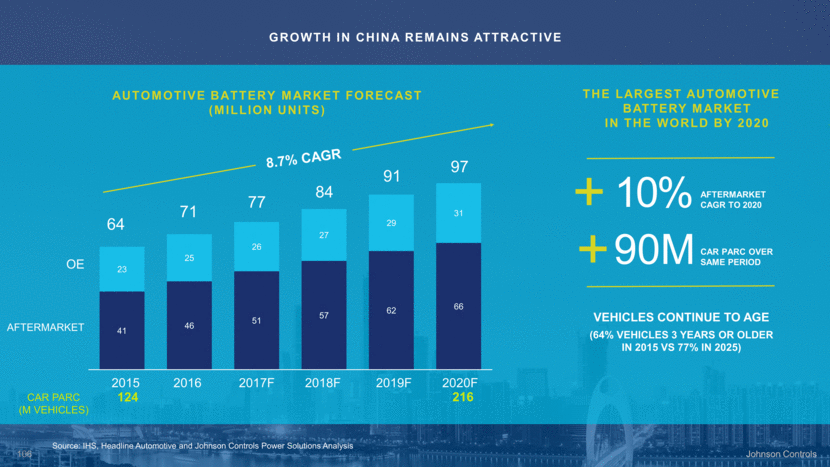
Growth IN CHINA REMAINS ATTRACTIVE 84 77 71 64 97 91 8.7% CAGR 2018F 2017F 2016 2015 Aftermarket OE 2020F 2019F CAR PARC (M VEHICLES) 124 216 Automotive Battery Market Forecast (million units) THE LARGEST AUTOMOTIVE BATTERY MARKET IN THE WORLD BY 2020 Vehicles continue to age (64% VEHICLES 3 YEARS OR OLDER IN 2015 VS 77% IN 2025) + AFTERMARKET CAGR TO 2020 10% + CAR PARC OVER SAME PERIOD 90M Johnson Controls Source: IHS, Headline Automotive and Johnson Controls Power Solutions Analysis 41 46 51 57 62 66 23 25 26 27 29 31
We are where our customers are 400+ BRANCHES 48 PRODUCTION & MAIN LOGISTICS SITES 5 MAJOR TECH CENTERS $6.4B REVENUE IN FY16 107 Johnson Controls 2,000+ POINTS OF DISTRIBUTION

Leveraging the strengths of our people and partners + Organization for success HQ team Business co-location Functional regionalization MAJOR PARTNERSHIPS
Employer of Choice Commercial Capabilities Our plan to win PEOPLE Verticals Asia Relevance Digitalization Products & Services Regionalization Commercial Processes Manufacturing OPERATIONAL EXCELLENCE Acquisition Capacity Strategic Relationships Channel Expansion BUSINESS DEVELOPMENT
China India Indonesia Malaysia Thailand Japan Australia 110 POWER SOLUTIONS 90% of global growth in the auto battery market will come from emerging markets 55% of that growth will come from china 110 110 110 Johnson Controls South korea

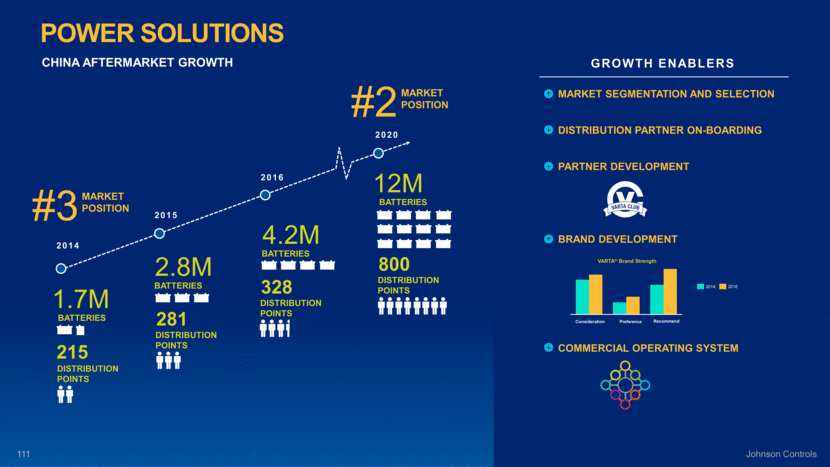
MARKET SEGMENTATION AND SELECTION DISTRIBUTION PARTNER ON-BOARDING PARTNER DEVELOPMENT BRAND DEVELOPMENT COMMERCIAL OPERATING SYSTEM VARTA® Brand Strength Consideration Preference Recommend 2014 2016 #3 MARKET POSITION Johnson Controls POWER SOLUTIONS CHINA AFTERMARKET GROWTH #2 MARKET POSITION 281 Distribution points 2.8M Batteries 2015 + + + + + 328 Distribution points 4.2M Batteries 2016 800 DISTRIBUTION POINTS 12M Batteries 2020 1.7M Batteries 215 Distribution POINTS 2014 GROWTH ENABLERS
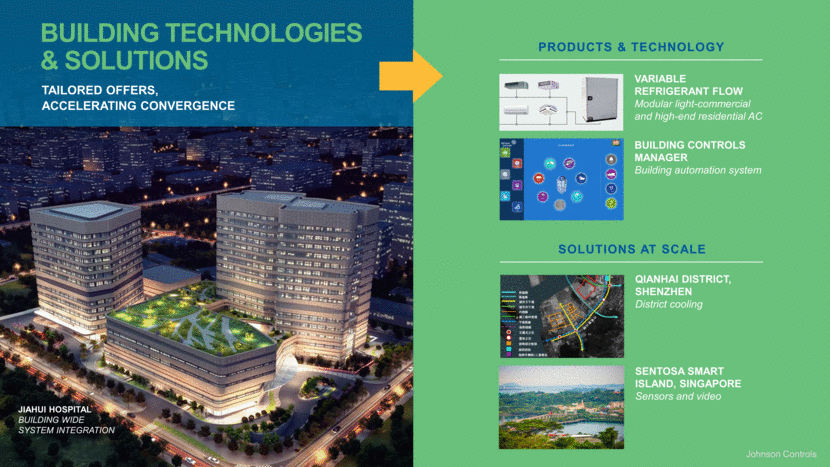
BUILDING TECHNOLOGIES & SOLUTIONS Jiahui Hospital Building Wide System Integration Johnson Controls TAILORED OFFERS, ACCELERATING CONVERGENCE PRODUCTS & TECHNOLOGY Variable Refrigerant Flow Modular light-commercial and high-end residential AC Building Controls Manager Building automation system SOLUTIONS AT SCALE Qianhai District, Shenzhen District cooling Sentosa Smart Island, SINGAPORE Sensors and video
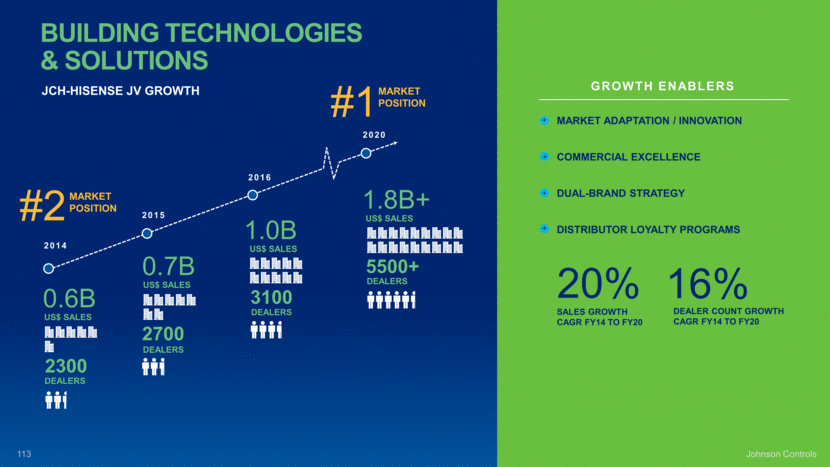
MARKET ADAPTATION / INNOVATION COMMERCIAL EXCELLENCE DUAL-BRAND STRATEGY DISTRIBUTOR LOYALTY PROGRAMS Johnson Controls + + + + #2 MARKET POSITION #1 MARKET POSITION 20% SALES GROWTH CAGR FY14 to FY20 16% DEALER COUNT GROWTH CAGR FY14 to FY20 BUILDING TECHNOLOGIES & SOLUTIONS JCH-HISENSE JV GROWTH GROWTH ENABLERS 1.8B+ US$ SALES 5500+ DEALERS 2020 1.0B US$ SALES 3100 DEALERS 2016 0.7B US$ SALES 2700 DEALERS 2015 0.6B US$ SALES 2300 DEALERS 2014
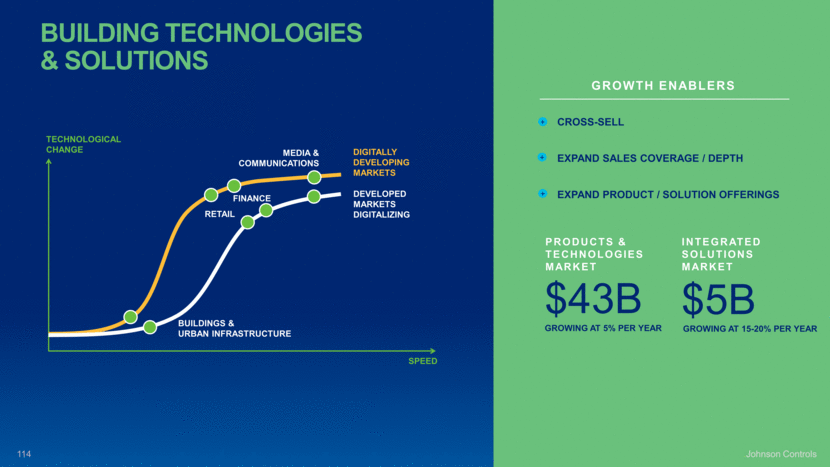
Johnson Controls $43B GROWING AT 5% PER YEAR PRODUCTS & TECHNOLOGIES MARKET $5B INTEGRATED SOLUTIONS MARKET GROWING AT 15-20% PER YEAR Developed Markets DIGITALIZING Digitally developing markets SPEED TECHNOLOGICAL CHANGE RETAIL BUILDINGS & URBAN INFRASTRUCTURE FINANCE MEDIA & COMMUNICATIONS CROSS-SELL EXPAND SALES COVERAGE / DEPTH EXPAND PRODUCT / SOLUTION OFFERINGS + + + BUILDING TECHNOLOGIES & SOLUTIONS GROWTH ENABLERS
GRAND OPENING JUNE 22, 2017 A SYMBOL OF OUR COMMITMENT AND FUTURE IN ASIA Johnson Controls

[LOGO]

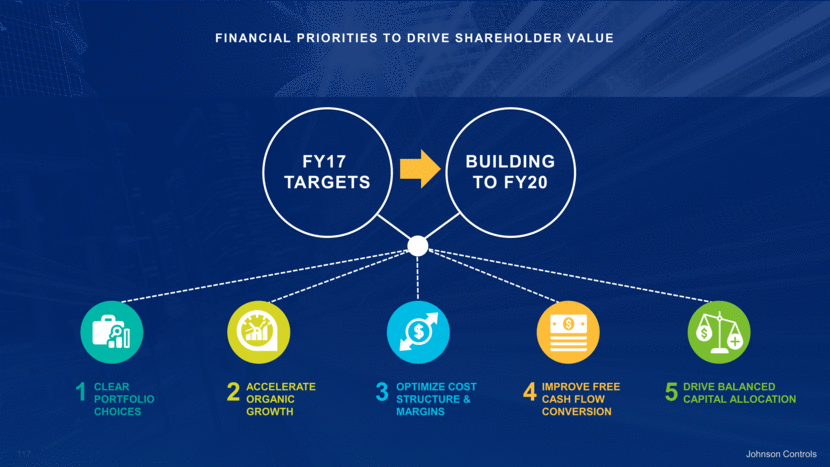
Financial Priorities To Drive Shareholder Value FY17 TARGETS BUILDING TO FY20 1 Clear Portfolio Choices 2 Accelerate Organic Growth 3 Optimize Cost Structure & Margins 4 Improve Free Cash Flow Conversion 5 Drive Balanced Capital Allocation Johnson Controls
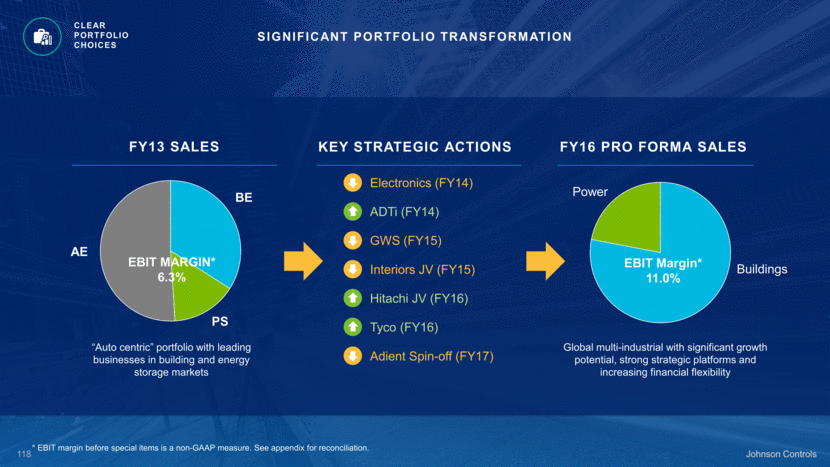
FY13 SALES EBIT MARGIN* 6.3% AE BE PS “Auto centric” portfolio with leading businesses in building and energy storage markets Johnson Controls SIGNIFICANT PORTFOLIO TRANSFORMATION Clear Portfolio Choices KEY STRATEGIC ACTIONS Electronics (FY14) ADTi (FY14) GWS (FY15) Interiors JV (FY15) Hitachi JV (FY16) Tyco (FY16) Adient Spin-off (FY17) FY16 PRO FORMA SALES EBIT Margin* 11.0% Buildings Power Global multi-industrial with significant growth potential, strong strategic platforms and increasing financial flexibility * EBIT margin before special items is a non-GAAP measure. See appendix for reconciliation.
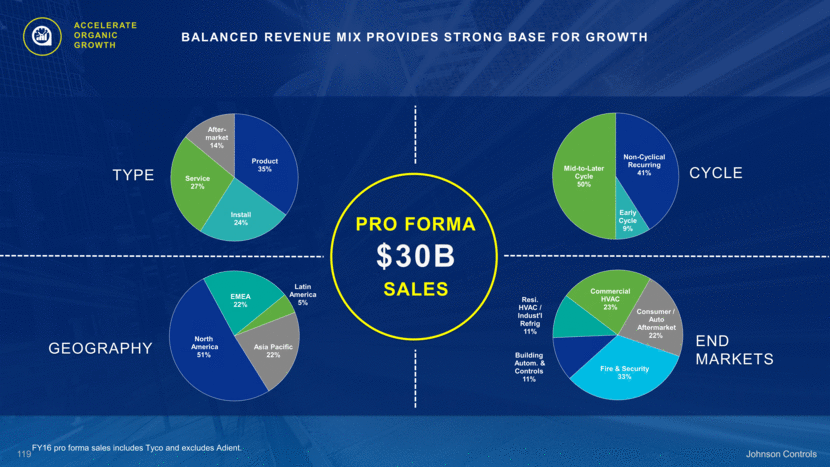
$30B Johnson Controls Accelerate Organic Growth BALANCED REVENUE MIX PROVIDES STRONG BASE FOR GROWTH PRO FORMA SALES CYCLE GEOGRAPHY TYPE END MARKETS FY16 pro forma sales includes Tyco and excludes Adient.
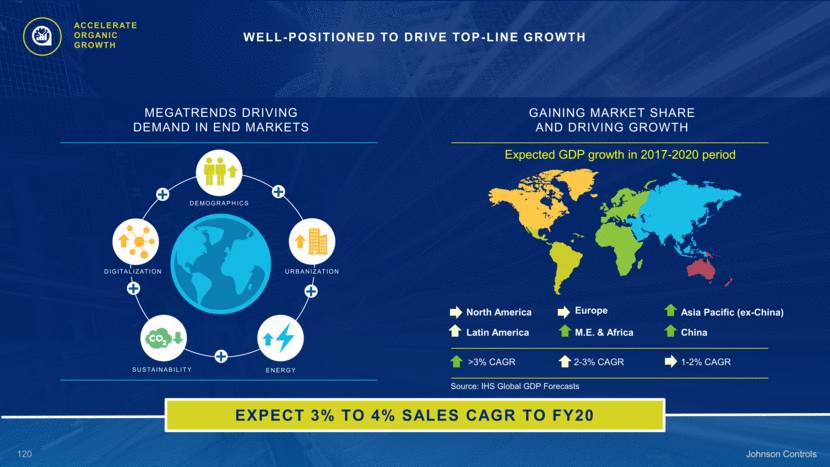
Johnson Controls Accelerate Organic Growth WELL-POSITIONED TO DRIVE TOP-LINE GROWTH >3% CAGR 2-3% CAGR 1-2% CAGR North America Europe Latin America Asia Pacific (ex-China) China M.E. & Africa Expected GDP growth in 2017-2020 period Source: IHS Global GDP Forecasts GAINING MARKET SHARE AND DRIVING GROWTH MEGATRENDS DRIVING DEMAND IN END MARKETS DEMOGRAPHICS URBANIZATION ENERGY DIGITALIZATION SUSTAINABILITY EXPECT 3% TO 4% SALES CAGR TO FY20
ADDITIONAL RUNWAY AHEAD * EBIT margin before special items is a non-GAAP measure. See appendix for reconciliation. PROVEN HISTORY OF OPERATIONAL EXECUTION 7.2% 11.0% EBIT Margin* Optimize Cost Structure & Margins Restructuring and cost reduction initiatives across our businesses Strong execution across procurement, manufacturing, field, commercial and functional excellence Divested lower margin, non-core businesses Continued investments in core businesses + + + + +380bps FY13 HISTORICAL JCI & TYCO FY16 PRO FORMA
Optimize Cost Structure & Margins SIGNIFICANT EBIT GROWTH THROUGH COST SYNERGIES AND JCOS INITIATIVES $300M $400M $300M $1 BILLION by FY20 G&A Functional Excellence Corporate Costs FIELD Manufacturing Supply Chain Engineering PROCUREMENT Direct Indirect Branch Operations G&A PROCUREMENT FIELD Johnson Controls
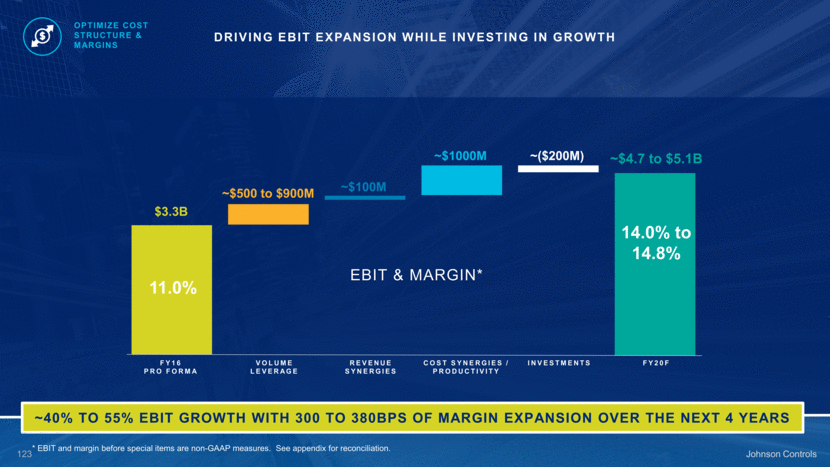
* EBIT and margin before special items are non-GAAP measures. See appendix for reconciliation. Johnson Controls FY20F FY16 PRO FORMA $3.3B ~$4.7 to $5.1B EBIT & MARGIN* 11.0% 14.0% to 14.8% VOLUME LEVERAGE COST SYNERGIES / PRODUCTIVITY INVESTMENTS ~$500 to $900M ~$1000M ~($200M) Optimize Cost Structure & Margins DRIVING EBIT EXPANSION WHILE INVESTING IN GROWTH REVENUE SYNERGIES ~$100M ~40% TO 55% EBIT GROWTH WITH 300 TO 380BPS OF MARGIN EXPANSION OVER THE NEXT 4 YEARS
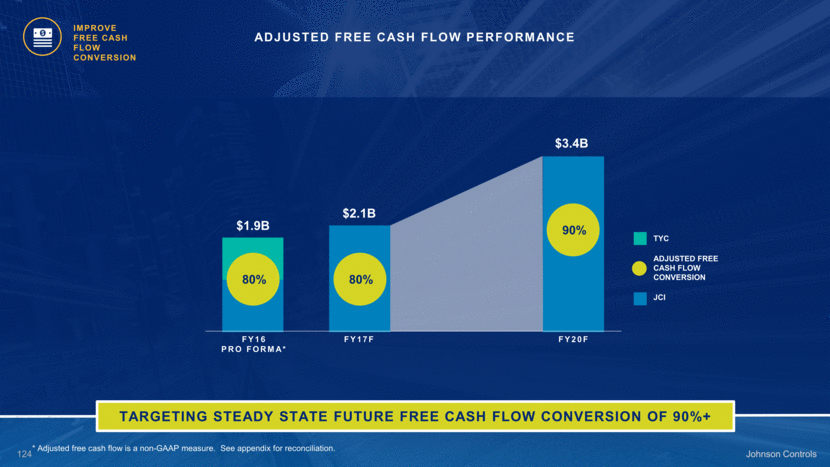
Johnson Controls ADJUSTED FREE CASH FLOW PERFORMANCE $1.9B $2.1B $3.4B 80% 80% 90% TARGETING STEADY STATE FUTURE FREE CASH FLOW CONVERSION OF 90%+ Improve Free Cash Flow Conversion FY16 PRO FORMA* FY17F FY20F ADJUSTED FREE CASH FLOW CONVERSION TYC JCI * Adjusted free cash flow is a non-GAAP measure. See appendix for reconciliation.
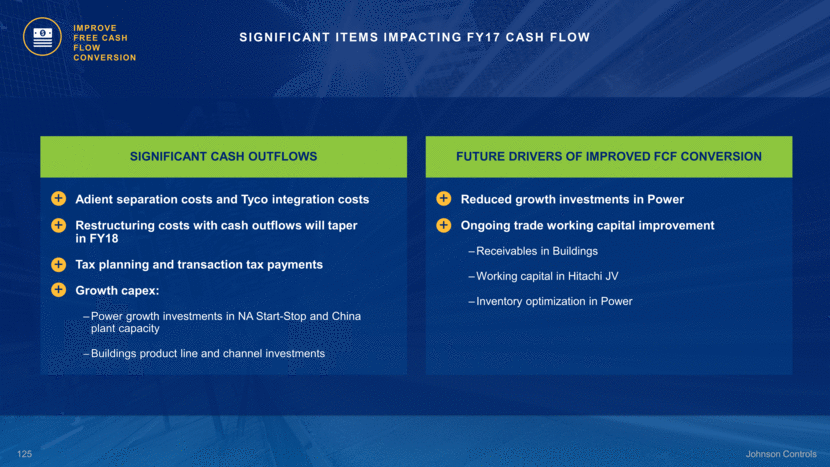
SIGNIFICANT ITEMS IMPACTING FY17 CASH FLOW Improve Free Cash Flow Conversion SIGNIFICANT CASH OUTFLOWS Adient separation costs and Tyco integration costs Restructuring costs with cash outflows will taper in FY18 Tax planning and transaction tax payments Growth capex: Power growth investments in NA Start-Stop and China plant capacity Buildings product line and channel investments + + + + FUTURE DRIVERS OF IMPROVED FCF CONVERSION Reduced growth investments in Power Ongoing trade working capital improvement Receivables in Buildings Working capital in Hitachi JV Inventory optimization in Power + +
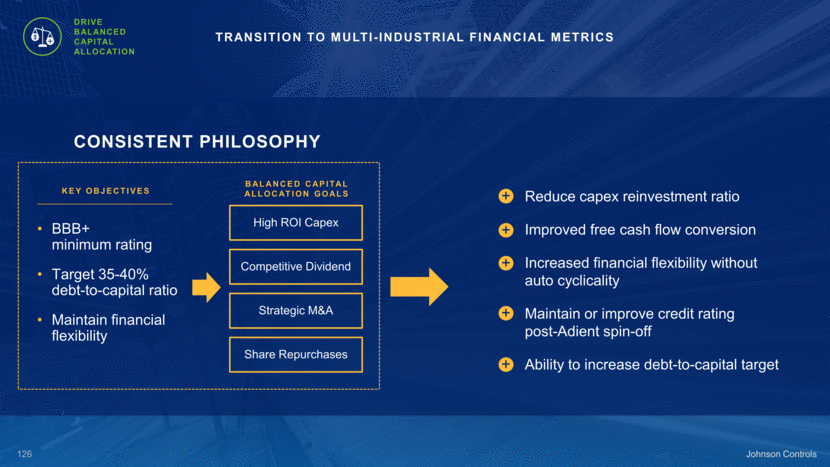
CONSISTENT PHILOSOPHY BBB+ minimum rating Target 35-40% debt-to-capital ratio Maintain financial flexibility High ROI Capex Competitive Dividend Strategic M&A Share Repurchases KEY OBJECTIVES BALANCED CAPITAL ALLOCATION GOALS Johnson Controls TRANSITION TO MULTI-INDUSTRIAL FINANCIAL METRICS Drive Balanced Capital Allocation Reduce capex reinvestment ratio Improved free cash flow conversion Increased financial flexibility without auto cyclicality Maintain or improve credit rating post-Adient spin-off Ability to increase debt-to-capital target + + + + +
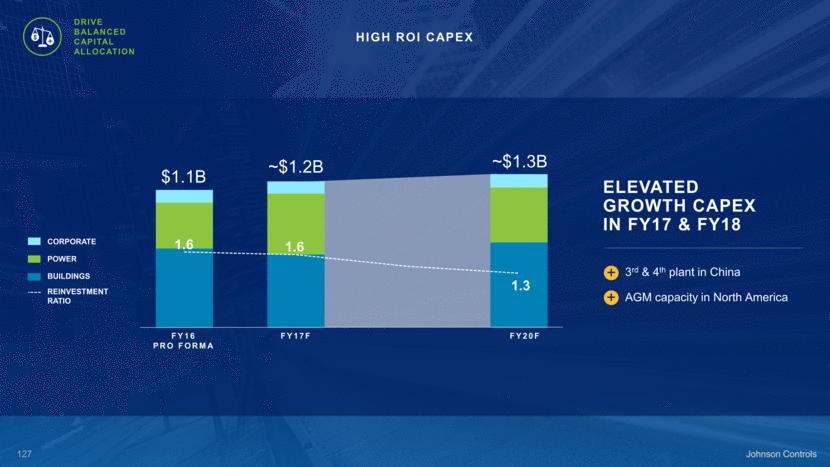
$1.1B Johnson Controls HIGH ROI CAPEX Drive Balanced Capital Allocation ELEVATED GROWTH CAPEX IN FY17 & FY18 3rd & 4th plant in China AGM capacity in North America + + CORPORATE POWER BUILDINGS REINVESTMENT RATIO FY16 PRO FORMA FY17F FY20F 1.6 1.6 1.3 ~$1.2B ~$1.3B
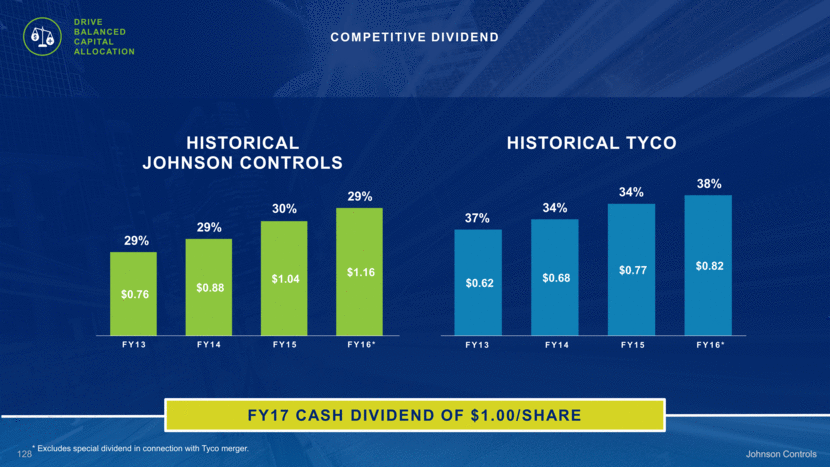
* Excludes special dividend in connection with Tyco merger. 29% 29% 30% 29% 38% 34% 34% 37% Johnson Controls COMPETITIVE DIVIDEND Drive Balanced Capital Allocation FY13 FY14 FY15 FY16* FY13 FY14 FY15 FY16* FY17 CASH DIVIDEND OF $1.00/SHARE $0.62 $0.68 $0.77 $0.82 HISTORICAL TYCO
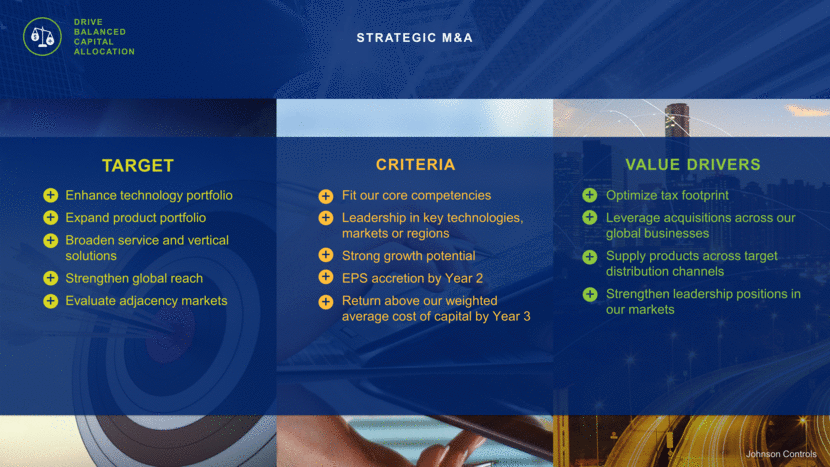
Johnson Controls STRATEGIC M&A Fit our core competencies Leadership in key technologies, markets or regions Strong growth potential EPS accretion by Year 2 Return above our weighted average cost of capital by Year 3 Criteria + + + + + Drive Balanced Capital Allocation Optimize tax footprint Leverage acquisitions across our global businesses Supply products across target distribution channels Strengthen leadership positions in our markets VALUE DRIVERS + + + + Enhance technology portfolio Expand product portfolio Broaden service and vertical solutions Strengthen global reach Evaluate adjacency markets TARGET + + + + +
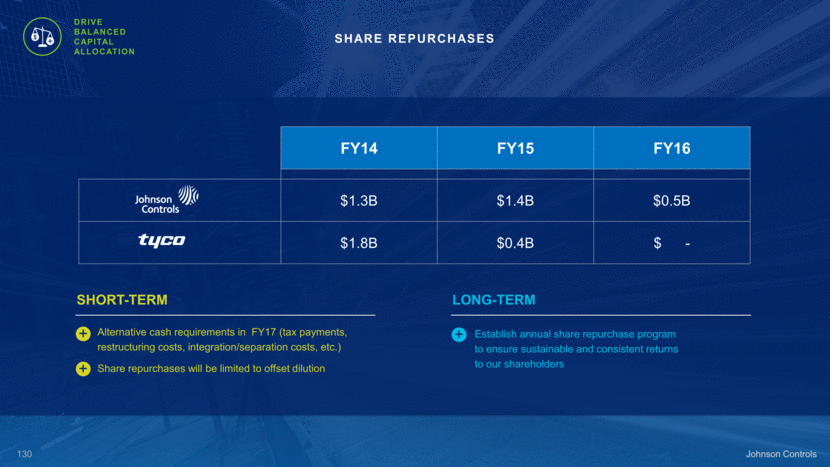
Johnson Controls SHARE REPURCHASES FY14 FY15 FY16 $1.3B $1.4B $0.5B $1.8B $0.4B $ - Establish annual share repurchase program to ensure sustainable and consistent returns to our shareholders LONG-TERM + Alternative cash requirements in FY17 (tax payments, restructuring costs, integration/separation costs, etc.) Share repurchases will be limited to offset dilution SHORT-TERM + + Drive Balanced Capital Allocation
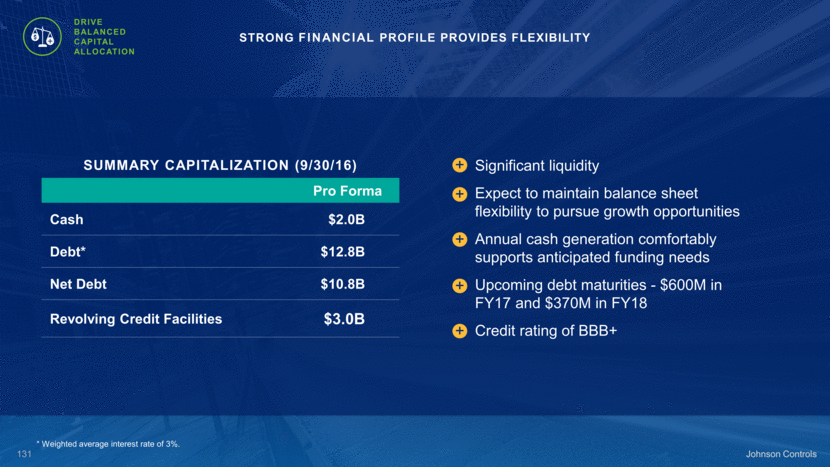
SUMMARY CAPITALIZATION (9/30/16) Pro Forma Cash $2.0B Debt* $12.8B Net Debt $10.8B Revolving Credit Facilities $3.0B Johnson Controls STRONG FINANCIAL PROFILE PROVIDES FLEXIBILITY Significant liquidity Expect to maintain balance sheet flexibility to pursue growth opportunities Annual cash generation comfortably supports anticipated funding needs Upcoming debt maturities - $600M in FY17 and $370M in FY18 Credit rating of BBB+ + + + + + Drive Balanced Capital Allocation * Weighted average interest rate of 3%.
FY17 & Mid-Term Outlook

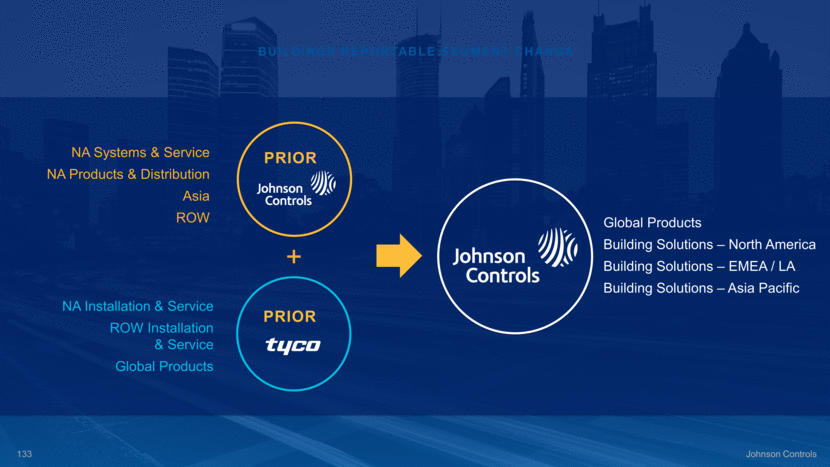
BUILDINGS REPORTABLE SEGMENT CHANGE PRIOR NA Systems & Service NA Products & Distribution Asia ROW PRIOR NA Installation & Service ROW Installation & Service Global Products + Global Products Building Solutions – North America Building Solutions – EMEA / LA Building Solutions – Asia Pacific
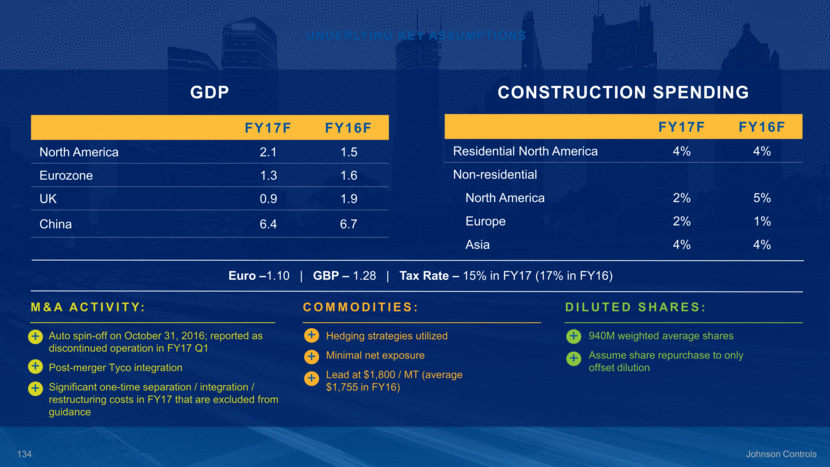
UNDERLYING KEY ASSUMPTIONS GDP FY17F FY16F North America 2.1 1.5 Eurozone 1.3 1.6 UK 0.9 1.9 China 6.4 6.7 Construction Spending FY17F FY16F Residential North America 4% 4% Non-residential North America 2% 5% Europe 2% 1% Asia 4% 4% Euro –1.10 GBP – 1.28 Tax Rate – 15% in FY17 (17% in FY16) Diluted Shares: 940M weighted average shares Assume share repurchase to only offset dilution + + M&A Activity: Auto spin-off on October 31, 2016; reported as discontinued operation in FY17 Q1 Post-merger Tyco integration Significant one-time separation / integration / restructuring costs in FY17 that are excluded from guidance + + + Commodities: Hedging strategies utilized Minimal net exposure Lead at $1,800 / MT (average $1,755 in FY16) + + +
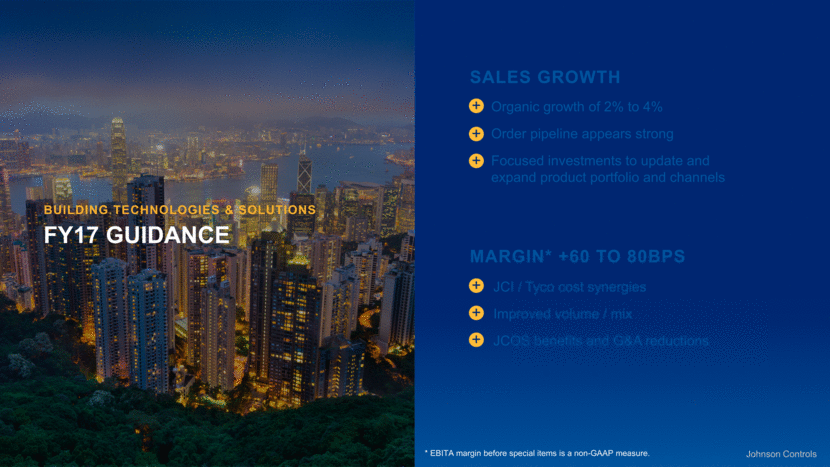
BUILDING TECHNOLOGIES & SOLUTIONS SALES GROWTH FY17 GUIDANCE Organic growth of 2% to 4% Order pipeline appears strong Focused investments to update and expand product portfolio and channels + + + + + + MARGIN* +60 TO 80BPS * EBITA margin before special items is a non-GAAP measure. JCI / Tyco cost synergies Improved volume / mix JCOS benefits and G&A reductions
SALES GROWTH Organic growth of 4% to 6% Continued market share gains in all regions Start-Stop volumes up 25% China volumes up 35% + + + + + + MARGIN* FLAT POWER SOLUTIONS FY17 GUIDANCE + + * EBITA margin before special items is a non-GAAP measure. JCOS benefits and G&A reductions Improved volume / mix China launch costs and other investments Lead prices

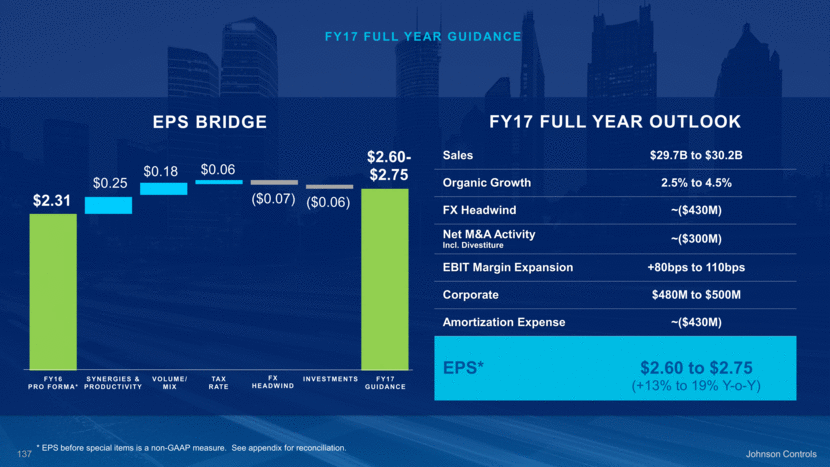
FY17 FULL YEAR OUTLOOK Sales $29.7B to $30.2B Organic Growth 2.5% to 4.5% FX Headwind ~($430M) Net M&A Activity Incl. Divestiture ~($300M) EBIT Margin Expansion +80bps to 110bps Corporate $480M to $500M Amortization Expense ~($430M) EPS* $2.60 to $2.75 EPS BRIDGE FY17 Full year Guidance Johnson Controls (+13% to 19% Y-o-Y) * EPS before special items is a non-GAAP measure. See appendix for reconciliation. FY16 PRO FORMA* SYNERGIES & PRODUCTIVITY VOLUME/ MIX FX HEADWIND FY17 GUIDANCE TAX RATE INVESTMENTS $2.60 - $2.75 ($0.07) ($0.06) $0.25 $0.18 $0.06 $2.31
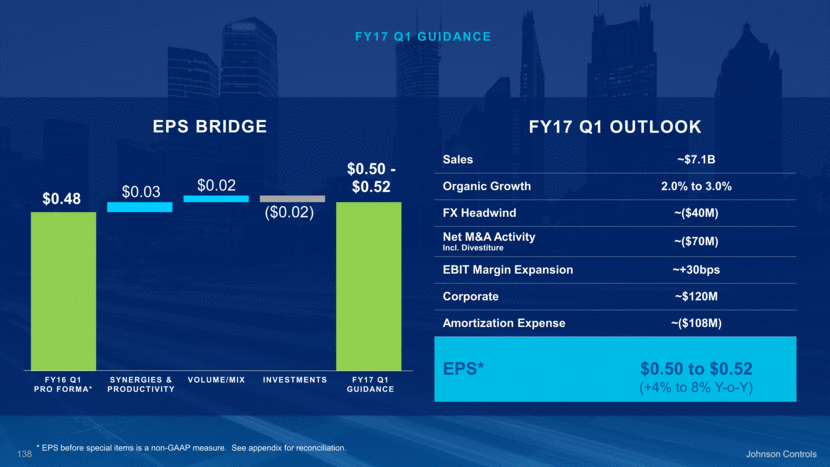
FY17 Q1 OUTLOOK Sales ~$7.1B Organic Growth 2.0% to 3.0% FX Headwind ~($40M) Net M&A Activity Incl. Divestiture ~($70M) EBIT Margin Expansion ~+30bps Corporate ~$120M Amortization Expense ~($108M) EPS* $0.50 to $0.52 EPS BRIDGE FY17 Q1 Guidance Johnson Controls (+4% to 8% Y-o-Y) * EPS before special items is a non-GAAP measure. See appendix for reconciliation. FY16 Q1 PRO FORMA* SYNERGIES & PRODUCTIVITY VOLUME/MIX INVESTMENTS FY17 Q1 GUIDANCE $0.50 - $0.52 ($0.02) $0.03 $0.02 $0.48
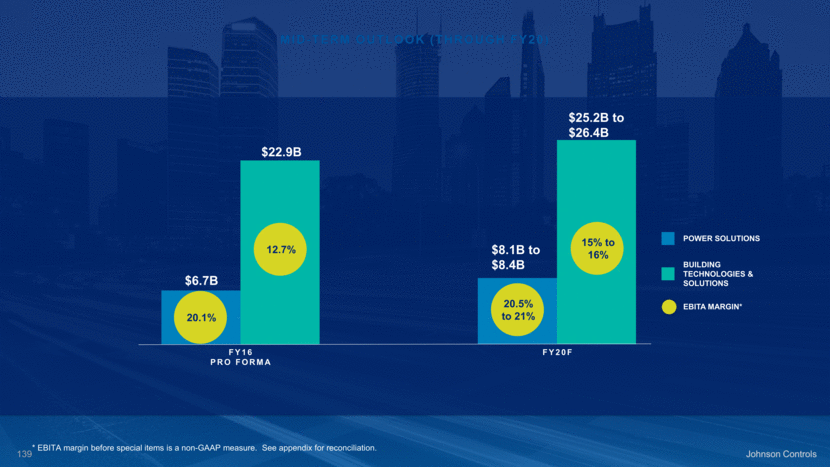
MID-TERM OUTLOOK (THROUGH FY20) Johnson Controls $6.7B $22.9B $8.1B to $8.4B $25.2B to $26.4B * EBITA margin before special items is a non-GAAP measure. See appendix for reconciliation. FY16 PRO FORMA FY20F EBITA MARGIN* POWER SOLUTIONS BUILDING TECHNOLOGIES & SOLUTIONS 12.7% 20.1% 20.5% to 21% 15% to 16%
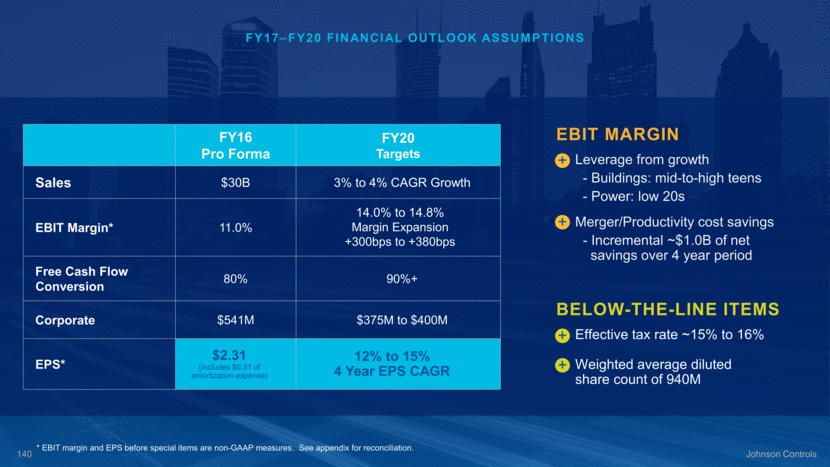
BELOW-THE-LINE ITEMS EBIT MARGIN FY17–FY20 FINANCIAL OUTLOOK ASSUMPTIONS FY16 Pro Forma FY20 Targets Sales $30B 3% to 4% CAGR Growth EBIT Margin* 11.0% 14.0% to 14.8% Margin Expansion +300bps to +380bps Free Cash Flow Conversion 80% 90%+ Corporate $541M $375M to $400M EPS* $2.31 (includes $0.31 of amortization expense) 12% to 15% 4 Year EPS CAGR Leverage from growth - Buildings: mid-to-high teens - Power: low 20s Merger/Productivity cost savings - Incremental ~$1.0B of net savings over 4 year period + + Effective tax rate ~15% to 16% Weighted average diluted share count of 940M + + * EBIT margin and EPS before special items are non-GAAP measures. See appendix for reconciliation.
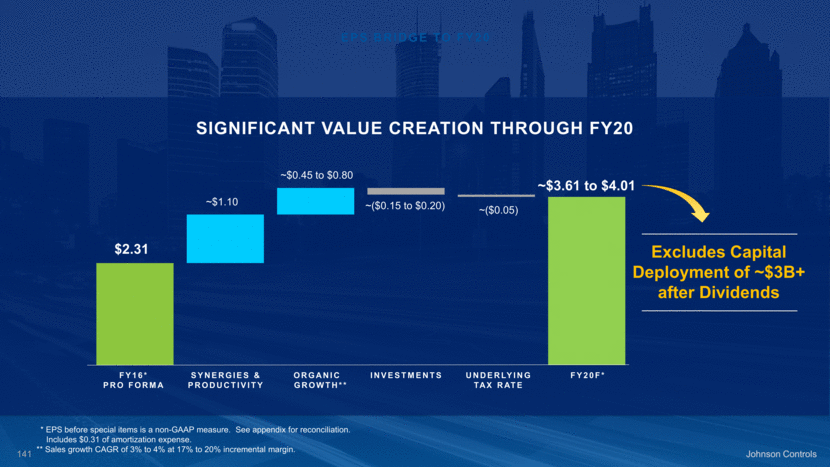
SIGNIFICANT VALUE CREATION THROUGH FY20 EPS Bridge To FY20 Johnson Controls Excludes Capital Deployment of ~$3B+ after Dividends * EPS before special items is a non-GAAP measure. See appendix for reconciliation. Includes $0.31 of amortization expense. ** Sales growth CAGR of 3% to 4% at 17% to 20% incremental margin. FY16* PRO FORMA SYNERGIES & PRODUCTIVITY ORGANIC GROWTH** INVESTMENTS UNDERLYING TAX RATE FY20F* ~$3.61 to $4.01 ~($0.15 to $0.20) ~($0.05) ~$ 1.10 ~$0.45 to $0.80 $2.31
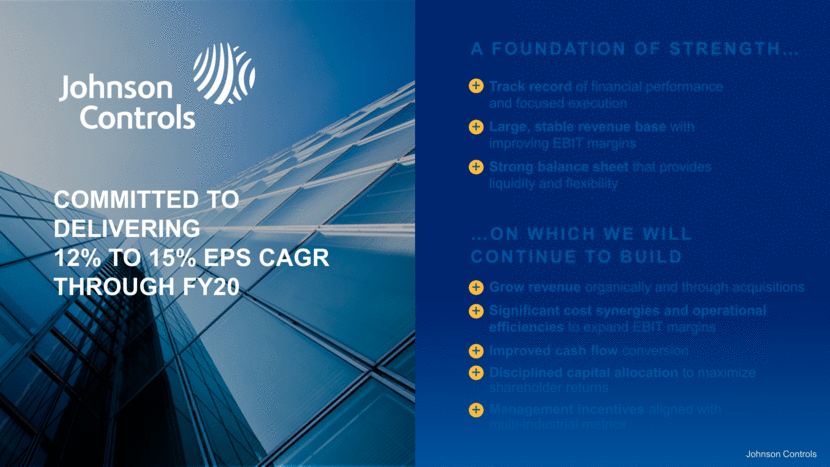
Track record of financial performance and focused execution Large, stable revenue base with improving EBIT margins Strong balance sheet that provides liquidity and flexibility A Foundation of Strength Johnson Controls On Which We Will Continue To Build Grow revenue organically and through acquisitions Significant cost synergies and operational efficiencies to expand EBIT margins Improved cash flow conversion Disciplined capital allocation to maximize shareholder returns Management incentives aligned with multi-industrial metrics COMMITTED TO DELIVERING 12% TO 15% EPS CAGR THROUGH FY20 + + + + + + + +
Appendix

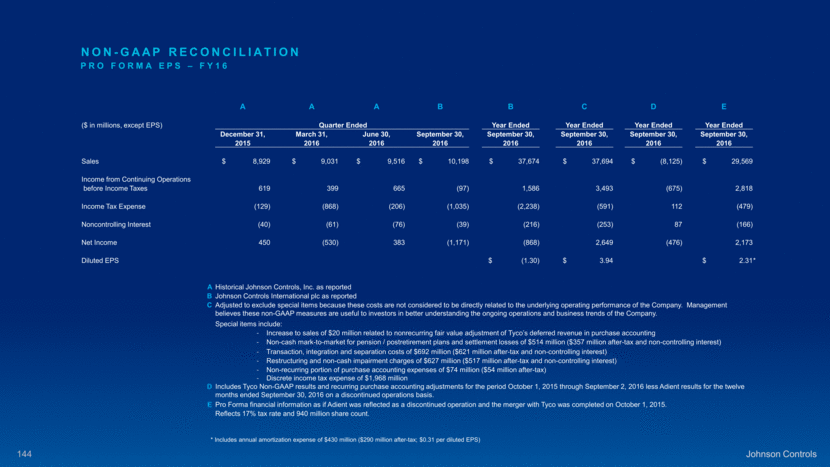
Non-GAAP Reconciliation A A A B B C D E ($ in millions, except EPS) Quarter Ended Year Ended Year Ended Year Ended Year Ended December 31, March 31, June 30, September 30, September 30, September 30, September 30, September 30, 2015 2016 2016 2016 2016 2016 2016 2016 Sales $ 8,929 $ 9,031 $ 9,516 $ 10,198 $ 37,674 $ 37,694 $ (8,125) $ 29,569 Income from Continuing Operations before Income Taxes 619 399 665 (97) 1,586 3,493 (675) 2,818 Income Tax Expense (129) (868) (206) (1,035) (2,238) (591) 112 (479) Noncontrolling Interest (40) (61) (76) (39) (216) (253) 87 (166) Net Income 450 (530) 383 (1,171) (868) 2,649 (476) 2,173 Diluted EPS $ (1.30) $ 3.94 $ 2.31 * A Historical Johnson Controls, Inc. as reported B Johnson Controls International plc as reported C Adjusted to exclude special items because these costs are not considered to be directly related to the underlying operating performance of the Company. Management believes these non-GAAP measures are useful to investors in better understanding the ongoing operations and business trends of the Company. Special items include: Increase to sales of $20 million related to nonrecurring fair value adjustment of Tyco’s deferred revenue in purchase accounting Non-cash mark-to-market for pension / postretirement plans and settlement losses of $514 million ($357 million after-tax and non-controlling interest) Transaction, integration and separation costs of $692 million ($621 million after-tax and non-controlling interest) Restructuring and non-cash impairment charges of $627 million ($517 million after-tax and non-controlling interest) Non-recurring portion of purchase accounting expenses of $74 million ($54 million after-tax) Discrete income tax expense of $1,968 million D Includes Tyco Non-GAAP results and recurring purchase accounting adjustments for the period October 1, 2015 through September 2, 2016 less Adient results for the twelve months ended September 30, 2016 on a discontinued operations basis. E Pro Forma financial information as if Adient was reflected as a discontinued operation and the merger with Tyco was completed on October 1, 2015. Reflects 17% tax rate and 940 million share count. PRO FORMA EPS – FY16 * Includes annual amortization expense of $430 million ($290 million after-tax; $0.31 per diluted EPS)
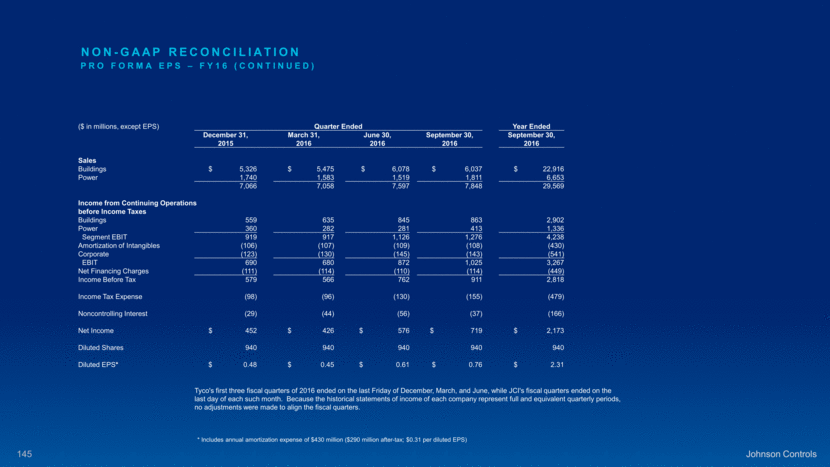
($ in millions, except EPS) Quarter Ended Year Ended December 31, March 31, June 30, September 30, September 30, 2015 2016 2016 2016 2016 Sales Buildings $ 5,326 $ 5,475 $ 6,078 $ 6,037 $ 22,916 Power 1,740 1,583 1,519 1,811 6,653 7,066 7,058 7,597 7,848 29,569 Income from Continuing Operations before Income Taxes Buildings 559 635 845 863 2,902 Power 360 282 281 413 1,336 Segment EBIT 919 917 1,126 1,276 4,238 Amortization of Intangibles (106) (107) (109) (108) (430) Corporate (123) (130) (145) (143) (541) EBIT 690 680 872 1,025 3,267 Net Financing Charges (111) (114) (110) (114) (449) Income Before Tax 579 566 762 911 2,818 Income Tax Expense (98) (96) (130) (155) (479) Noncontrolling Interest (29) (44) (56) (37) (166) Net Income $ 452 $ 426 $ 576 $ 719 $ 2,173 Diluted Shares 940 940 940 940 940 Diluted EPS* $ 0.48 $ 0.45 $ 0.61 $ 0.76 $ 2.31 Tyco's first three fiscal quarters of 2016 ended on the last Friday of December, March, and June, while JCI's fiscal quarters ended on the last day of each such month. Because the historical statements of income of each company represent full and equivalent quarterly periods, no adjustments were made to align the fiscal quarters. * Includes annual amortization expense of $430 million ($290 million after-tax; $0.31 per diluted EPS) Non-GAAP Reconciliation PRO FORMA EPS – FY16 (continued)
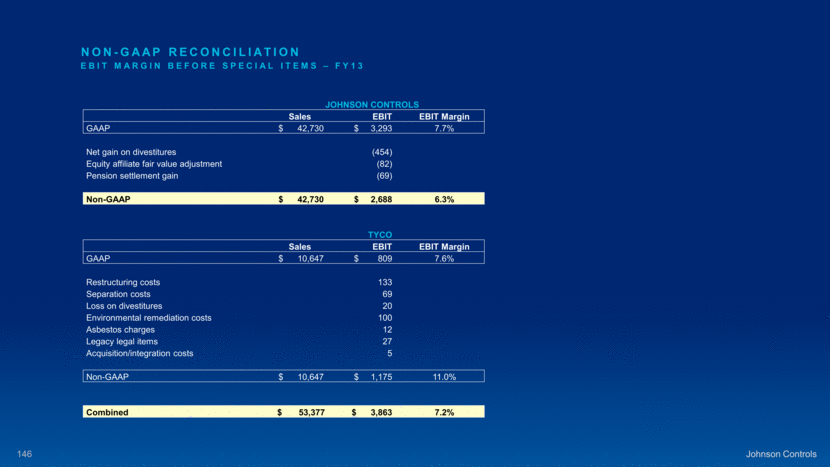
Non-GAAP Reconciliation EBIT Margin BEFORE SPECIAL ITEMS – FY13 JOHNSON CONTROLS Sales EBIT EBIT Margin GAAP $ 42,730 $ 3,293 7.7% Net gain on divestitures (454) Equity affiliate fair value adjustment (82) Pension settlement gain (69) Non-GAAP $ 42,730 $ 2,688 6.3% TYCO Sales EBIT EBIT Margin GAAP $ 10,647 $ 809 7.6% Restructuring costs 133 Separation costs 69 Loss on divestitures 20 Environmental remediation costs 100 Asbestos charges 12 Legacy legal items 27 Acquisition/integration costs 5 Non-GAAP $ 10,647 $ 1,175 11.0% Combined $ 53,377 $ 3,863 7.2%
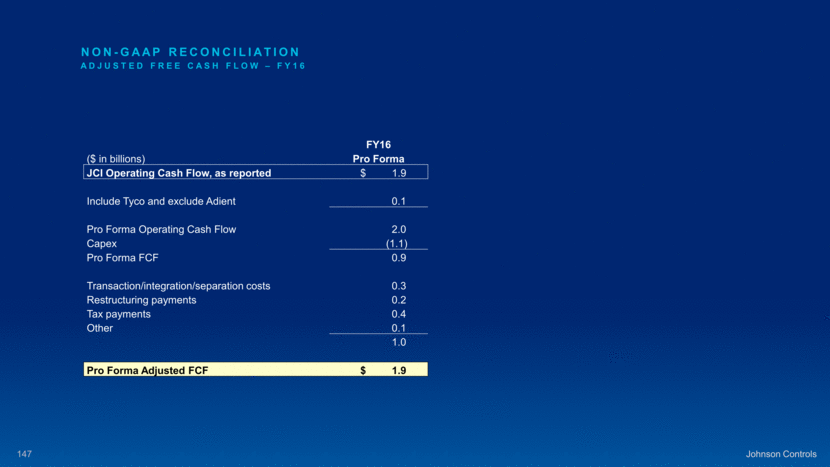
FY16 ($ in billions) Pro Forma JCI Operating Cash Flow, as reported $ 1.9 Include Tyco and exclude Adient 0.1 Pro Forma Operating Cash Flow 2.0 Capex (1.1) Pro Forma FCF 0.9 Transaction/integration/separation costs 0.3 Restructuring payments 0.2 Tax payments 0.4 Other 0.1 1.0 Pro Forma Adjusted FCF $ 1.9 Non-GAAP Reconciliation ADJUSTED FREE CASH FLOW – FY16
Serious News for Serious Traders! Try StreetInsider.com Premium Free!
You May Also Be Interested In
- Sensormatic Solutions Showcases New, Sustainable SPX AM Label Designed to Protect Merchandise and the Environment
- Stockholm Exergi Selects Hansen to Automate and Optimise Power Trading Operations
- Decarbonization Partners Exceeds Fundraising Target With US$1.40 Billion Final Close for Inaugural Fund
Create E-mail Alert Related Categories
SEC FilingsSign up for StreetInsider Free!
Receive full access to all new and archived articles, unlimited portfolio tracking, e-mail alerts, custom newswires and RSS feeds - and more!
