Form 8-K JETBLUE AIRWAYS CORP For: Dec 13
UNITED STATES
SECURITIES AND EXCHANGE COMMISSION
Washington, D.C. 20549
FORM 8-K
CURRENT REPORT
PURSUANT TO SECTION 13 OR 15(d) OF THE
SECURITIES EXCHANGE ACT OF 1934
Date of Report (Date of earliest event reported): December 13, 2016
JETBLUE AIRWAYS CORPORATION
(Exact name of registrant as specified in its charter)
Delaware | 000-49728 | 87-0617894 |
(State or Other Jurisdiction of Incorporation) | (Commission File Number) | (I.R.S. Employer Identification No.) |
27-01 Queens Plaza North, Long Island City, New York (Address of principal executive offices) | 11101 (Zip Code) | |
(718) 286-7900 (Registrant’s telephone number, including area code) | ||
Check the appropriate box below if the Form 8-K filing is intended to simultaneously satisfy the filing obligation of the registrant under any of the following provisions (see General Instruction A.2. below):
o | Written communications pursuant to Rule 425 under the Securities Act (17 CFR 230.425) | |
o | Soliciting material pursuant to Rule 14a-12 under the Exchange Act (17 CFR 240.14a-12) | |
o | Pre-commencement communications pursuant to Rule 14d-2(b) under the Exchange Act (17 CFR 240.14d-2(b)) | |
o | Pre-commencement communications pursuant to Rule 13e-4(c) under the Exchange Act (17 CFR 240.13e-4(c)) | |
Item 7.01. Regulation FD Disclosure.
Executives of JetBlue Airways Corporation ("JetBlue" or the "Company") will present today at the Company's previously announced Investor Day. Materials to be used in conjunction with the presentation are furnished as Exhibit 99.1 to this Form 8-K.
The information in this report (including the exhibits) that is being furnished pursuant to Item 7.01 of Form 8−K shall not be deemed to be "filed" for the purposes of Section 18 of the Securities Exchange Act of 1934, as amended (the "Exchange Act"), or otherwise subject to liabilities of that section, nor shall it be deemed incorporated by reference in any filing under the Securities Act of 1933, as amended (the "Securities Act"), except as expressly set forth in such filing. This report will not be deemed an admission as to the materiality of any information in the report that is required to be disclosed solely by Regulation FD.
Statements in this Form 8-K and the attached exhibits that are not historical facts, including statements regarding our estimates, expectations, beliefs, intentions, projections or strategies for the future, may be “forward-looking statements” within the meaning of the Private Securities Litigation Reform Act of 1995, Section 27A of the Securities Act and Section 21E of the Exchange Act. All forward-looking statements involve a number of risks and uncertainties that could cause actual results to differ materially from the estimates, expectations, beliefs, intentions, projections and strategies reflected in or suggested by the forward-looking statements. When used in this document and in documents incorporated herein by reference, the words “expects,” “plans,” “anticipates,” “indicates,” “believes,” “forecast,” “guidance,” “outlook,” “may,” “will,” “should,” “seeks,” “targets” and similar expressions are intended to identify forward-looking statements. Actual results may differ materially from those expressed in the forward-looking statements due to many factors, including, without limitation, our extremely competitive industry; volatility in financial and credit markets which could affect our ability to obtain debt and/or lease financing or to raise funds through debt or equity issuances; volatility in fuel prices, maintenance costs and interest rates; our ability to implement our growth strategy; our significant fixed obligations and substantial indebtedness; our ability to attract and retain qualified personnel and maintain our culture as we grow; our reliance on high daily aircraft utilization; our dependence on the New York and Boston metropolitan markets and the effect of increased congestion in these markets; our reliance on automated systems and technology; our being subject to potential unionization, work stoppages, slowdowns or increased labor costs; our reliance on a limited number of suppliers; our presence in some international emerging markets that may experience political or economic instability or may subject us to legal risk; reputational and business risk from information security breaches or cyber-attacks; changes in or additional government regulation; changes in our industry due to other airlines' financial condition; acts of war or terrorist attacks; global economic conditions or an economic downturn leading to a continuing or accelerated decrease in demand for domestic and business air travel; the spread of infectious diseases; adverse weather conditions or natural disasters; and external geopolitical events and conditions. It is routine for our internal projections and expectations to change as the year or each quarter in the year progresses, and therefore it should be clearly understood that the internal projections, beliefs and assumptions upon which we base our expectations may change prior to the end of each quarter or year and you should not place undue reliance on these statements. Further information concerning these and other factors is contained in the Company's Securities and Exchange Commission filings, including but not limited to, the Company's 2015 Annual Report on Form 10-K and Quarterly Reports on Form 10-Q. In light of these risks and uncertainties, the forward-looking events discussed in this presentation might not occur. We undertake no obligation to update any forward-looking statements to reflect events or circumstances that may arise after the date of this presentation.
The following presentation also includes certain “non-GAAP financial measures” as defined in Regulation G under the Securities Exchange Act of 1934. We refer you to the reconciliations made available in our Quarterly Report on Form 10-Q for the third quarter of 2016 (available on our website at jetblue.com and at sec.gov), which reconcile the non-GAAP financial measures included in the following presentation to the most directly comparable financial measures calculated and presented in accordance with U.S. GAAP.
Item 9.01. Financial Statements and Exhibits.
(d) Exhibits.
Exhibit 99.1 Investor Day Presentation*
*Furnished herewith.
SIGNATURES
Pursuant to the requirements of the Securities Exchange Act of 1934, the registrant has duly caused this report to be signed on its behalf by the undersigned hereunto duly authorized.
JETBLUE AIRWAYS CORPORATION | |
By: /s/ Alexander Chatkewitz | |
Alexander Chatkewitz | |
Vice President, Controller and Chief Accounting Officer (principal accounting officer) | |
Date: December 13, 2016
EXHIBIT INDEX
Exhibit Number | Description |
99.1 | Investor Day Presentation* |
*Furnished herewith.

JETBLUE INVESTOR DAY
DECEMBER 13, 2016

SAFE HARBOR
2

ROBIN HAYES | PRESIDENT
WHY INVEST IN JETBLUE?
ROBIN HAYES
PRESIDENT & CEO
3

WHY INVEST IN JETBLUE?
4

IMPROVE THE JETBLUE
EXPERIENCE
5

FOCUS ON EXECUTION
6
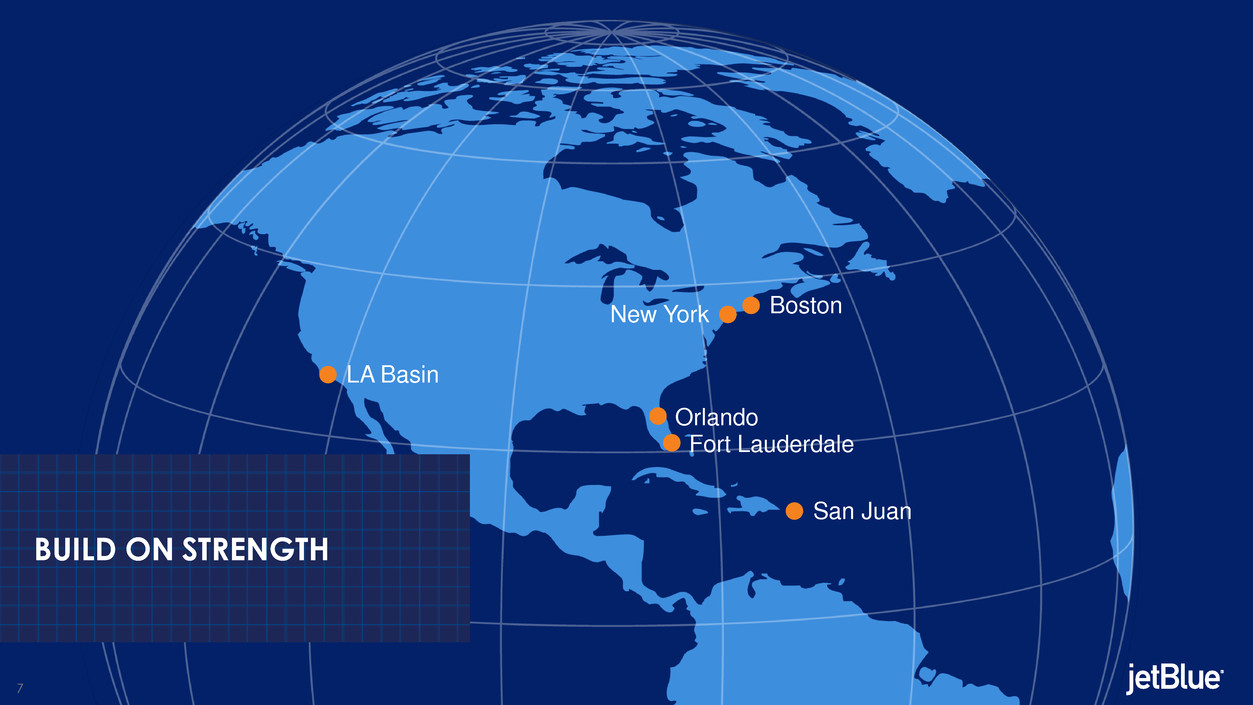
BUILD ON STRENGTH
LA Basin
San Juan
Boston New York
Fort Lauderdale
Orlando
7

DEVELOPING OUR TOOLKIT
MARTY ST. GEORGE
EVP COMMERCIAL AND PLANNING
8
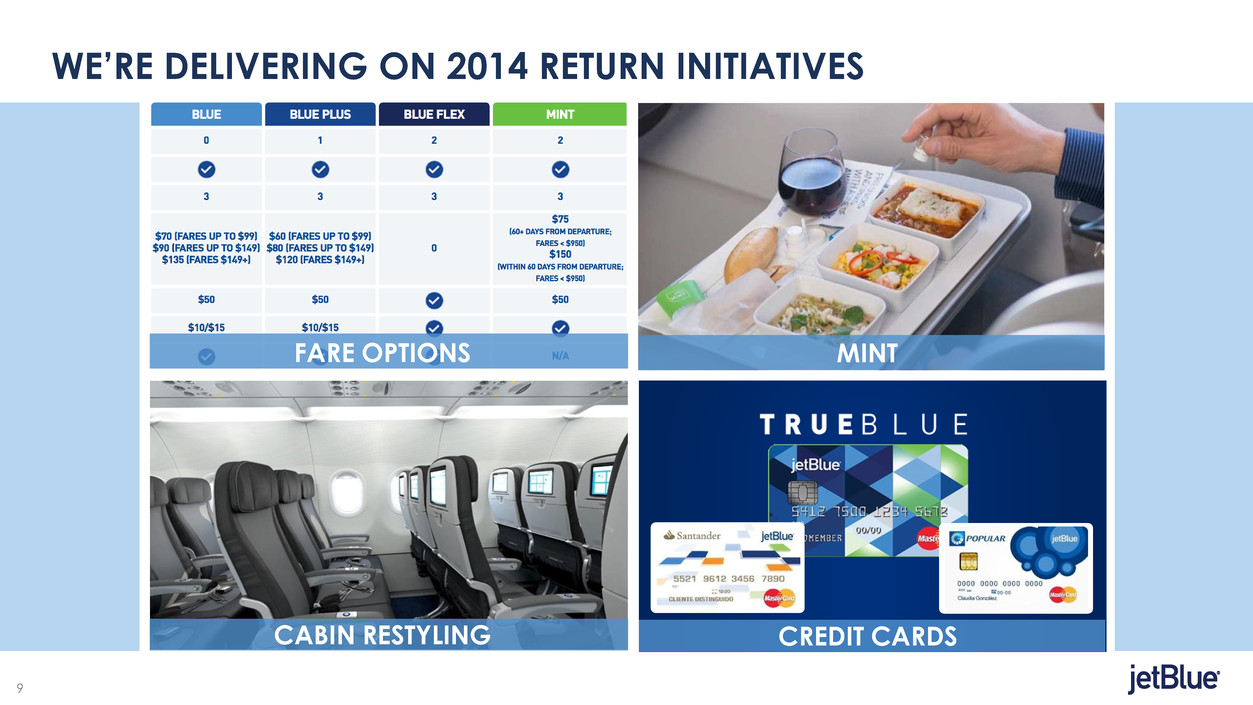
WE’RE DELIVERING ON 2014 RETURN INITIATIVES
CABIN RESTYLING
FARE OPTIONS MINT
CREDIT CARDS
9

FARE OPTIONS EXCEEDING ORIGINAL EXPECTATIONS
[VALUE]m
[VALUE]m
[VALUE]m
[VALUE]m
2015 2016E 2017E
2014 Expectations ($m) Actual (2015) & Current Expectations ($m)
$280m+
FARE OPTIONS EARNINGS BENEFIT
Opportunity to evolve Fare
Options further through pricing
and bundled offerings
10
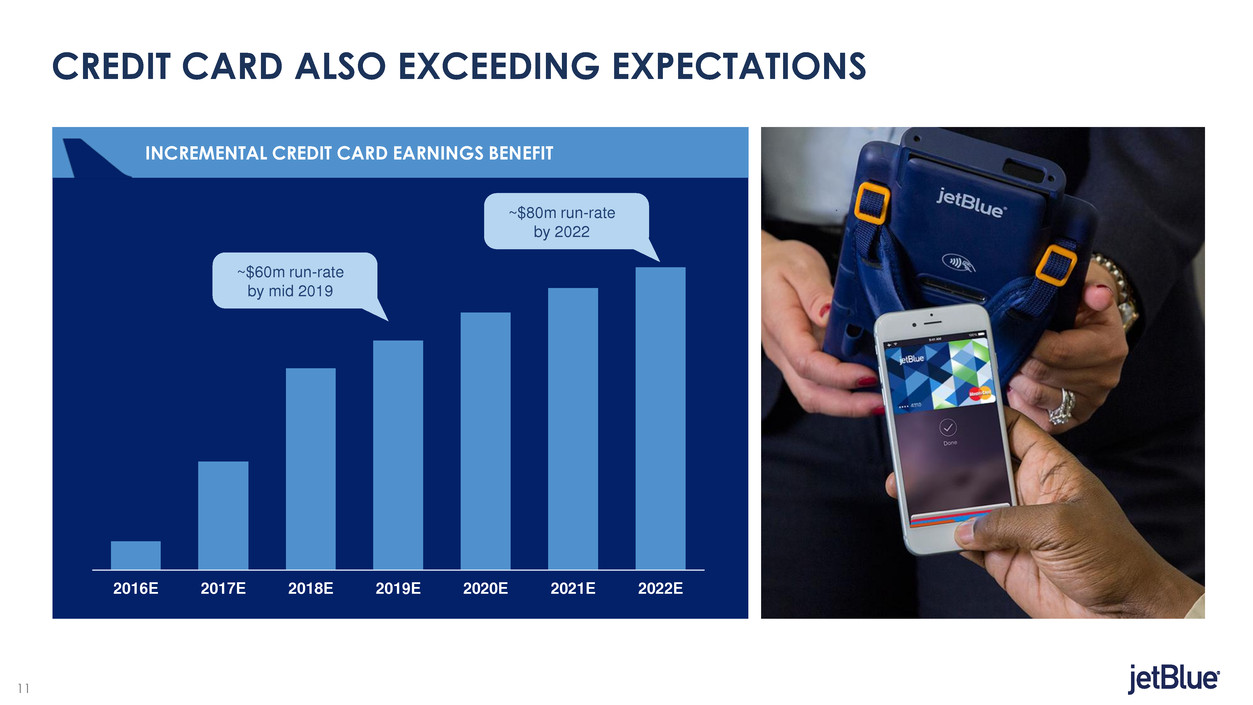
CREDIT CARD ALSO EXCEEDING EXPECTATIONS
INCREMENTAL CREDIT CARD EARNINGS BENEFIT
2016E 2017E 2018E 2019E 2020E 2021E 2022E
~$60m run-rate
by mid 2019
~$80m run-rate
by 2022
11

GROWING TRUEBLUE PARTNERSHIPS
12
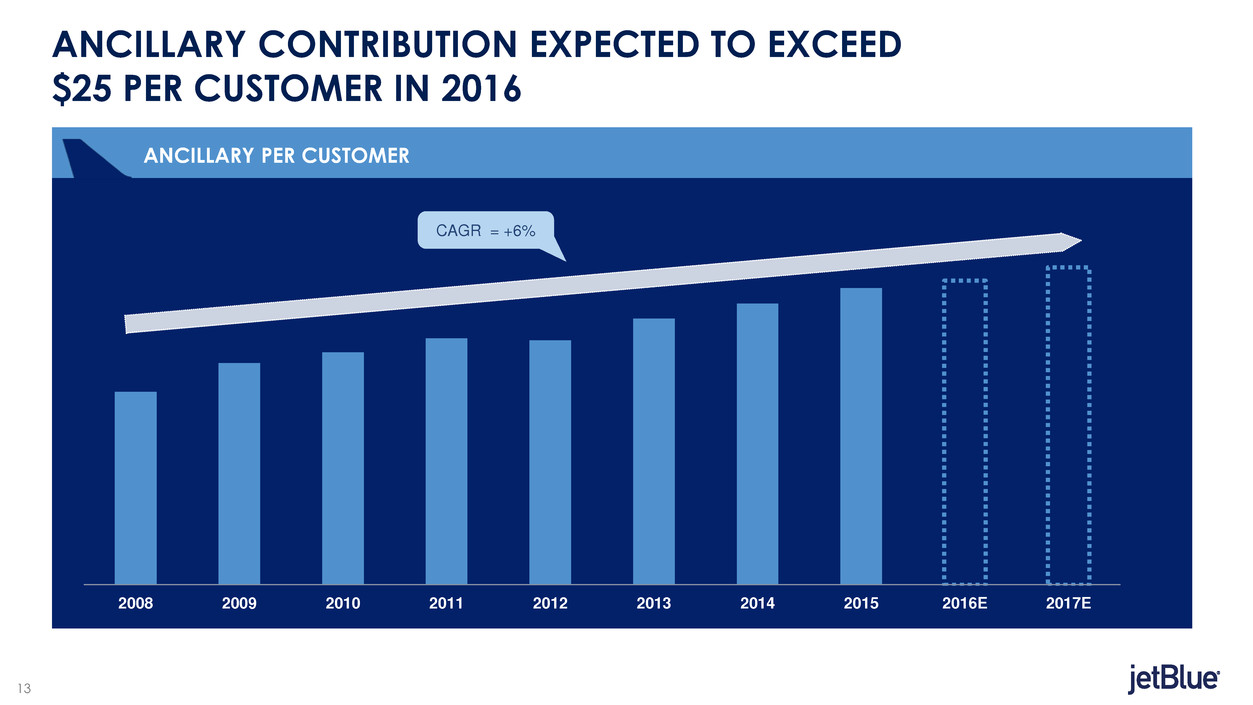
2008 2009 2010 2011 2012 2013 2014 2015 2016E 2017E
ANCILLARY CONTRIBUTION EXPECTED TO EXCEED
$25 PER CUSTOMER IN 2016
ANCILLARY PER CUSTOMER
CAGR = +6%
13

CABIN RESTYLING: EXPANDING NEW CORE PRODUCT TO THE A320
14a

CABIN RESTYLING: EXPANDING NEW CORE PRODUCT TO THE A320
14b

0%
20%
40%
60%
80%
100%
Year 1 Year 2 Year 3 Year 4
CABIN RESTYLING: $100M EARNINGS BENEFIT
A320 PROGRAM ADDS TO 2017 A321 BENEFIT
PERCENT OF A320 FLEET CONVERTED ILLUSTRATIVE A320 ASM IMPACT - Y/Y GROWTH*
Expected start
to ‘Year 1’ is
Fall 2017
* Assumes capacity growth, reflecting only A320 fleet modifications and does not include any typical adjustments to fleet utilization or network.
Conversions currently
expected to take ~36 months
-2%
-1%
0%
1%
2%
3%
4%
5%
Year 1 Year 2 Year 3 Year 4
15

MINT: SURPRISING & DELIGHTING
16

+17
June 2014 TTM June 2015 TTM June 2016 TTM
+18
October 2014 TTM October 2015 TTM October 2016 TTM
MINT: ORIGINALLY DESIGNED TO SOLVE A SPECIFIC NETWORK PROBLEM
Mint Launch Mint Launch
JFK-LAX MARGIN VS. SYSTEM (pre and post Mint Launch) JFK-SFO MARGIN VS. SYSTEM (pre and post Mint Launch)
17

JFK-LAX FREQUENCY AND MARGIN
5 5
7
10
Q3 2013 Q3 2014 Q3 2015 Q3 2016
Core Daily Margin (gap to system)
MINT: MARGIN BENEFITS EXTEND BEYOND MINT SEATS
JFK-LAX
Mint Launch
18

Q2-14 Q1-15 Q4-15 Q3-16
BOS MINT ROUTES PERFORMANCE: TTM MARGIN GAP TO SYSTEM
MINT: BOSTON MARKETS FOLLOWING NYC SUCCESS
BOS-SFO Mint Launch
BOS-LAX Mint Launch
Margin vs. System
improved 11 points
19

BOS
JFK
LAX
SFO
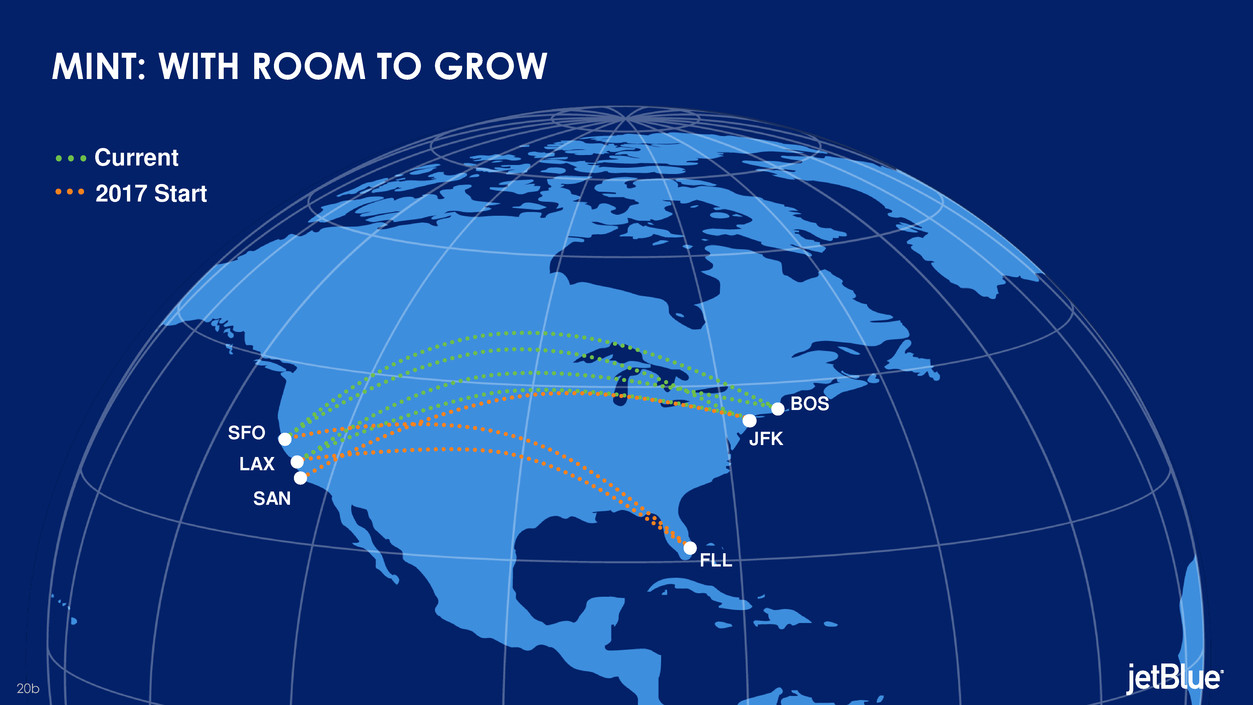
MINT: WITH ROOM TO GROW
Current
20a
BOS
JFK
LAX
SFO
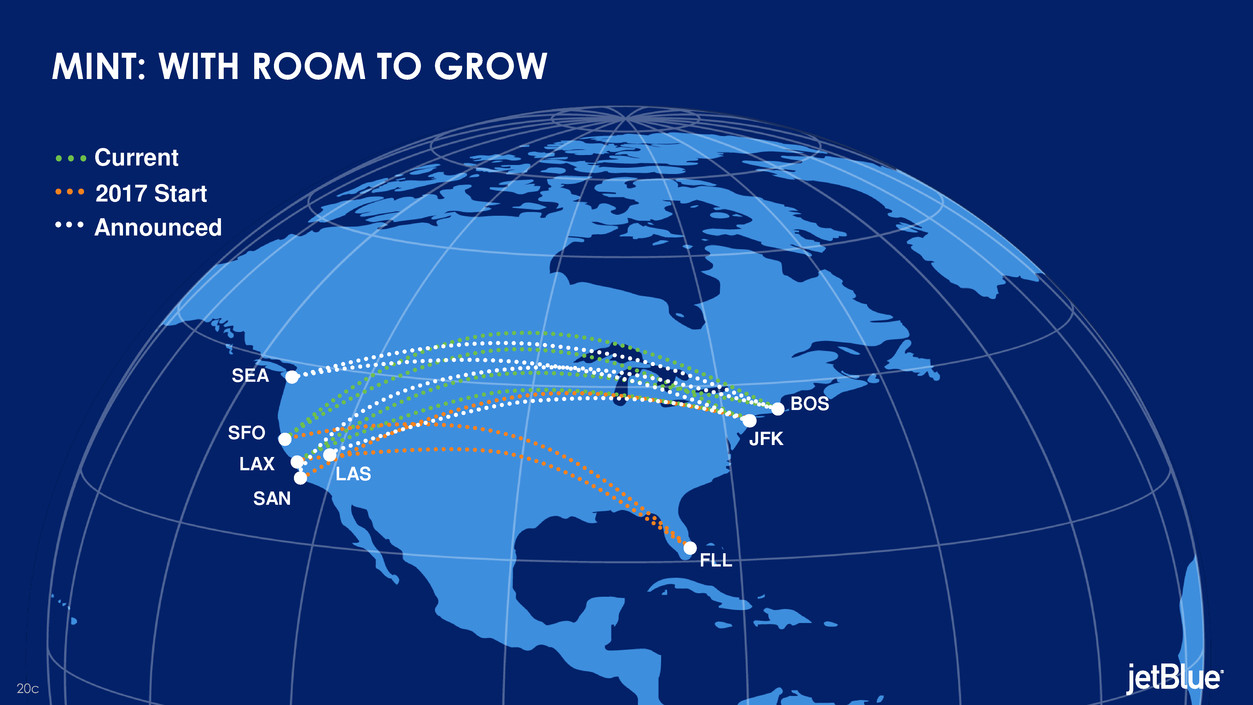
MINT: WITH ROOM TO GROW
Current
2017 Start
SAN
FLL
20b
BOS
JFK
LAX
SFO
MINT: WITH ROOM TO GROW
Current
2017 Start
Announced
SAN
LAS
SEA
FLL
20c

WE’RE DELIVERING ON 2014 RETURN INITIATIVES
CABIN RESTYLING
FARE OPTIONS MINT
CREDIT CARDS
21

GROWING OUR NETWORK
SCOTT LAURENCE
SVP AIRLINE PLANNING
22

APPLYING OUR TOOLKIT
23

WE’VE DEVELOPED A STRONG, DEFENSIBLE NETWORK…
Fort Lauderdale
LA Basin
Orlando
San Juan
2007
7%
6%
8%
2% 4
11
Source: Diio
Note: ASMs as a percent of total JetBlue network
24a
56%
New York
14% Boston
WE’VE DEVELOPED A STRONG, DEFENSIBLE NETWORK…
Fort Lauderdale
LA Basin
Orlando
San Juan
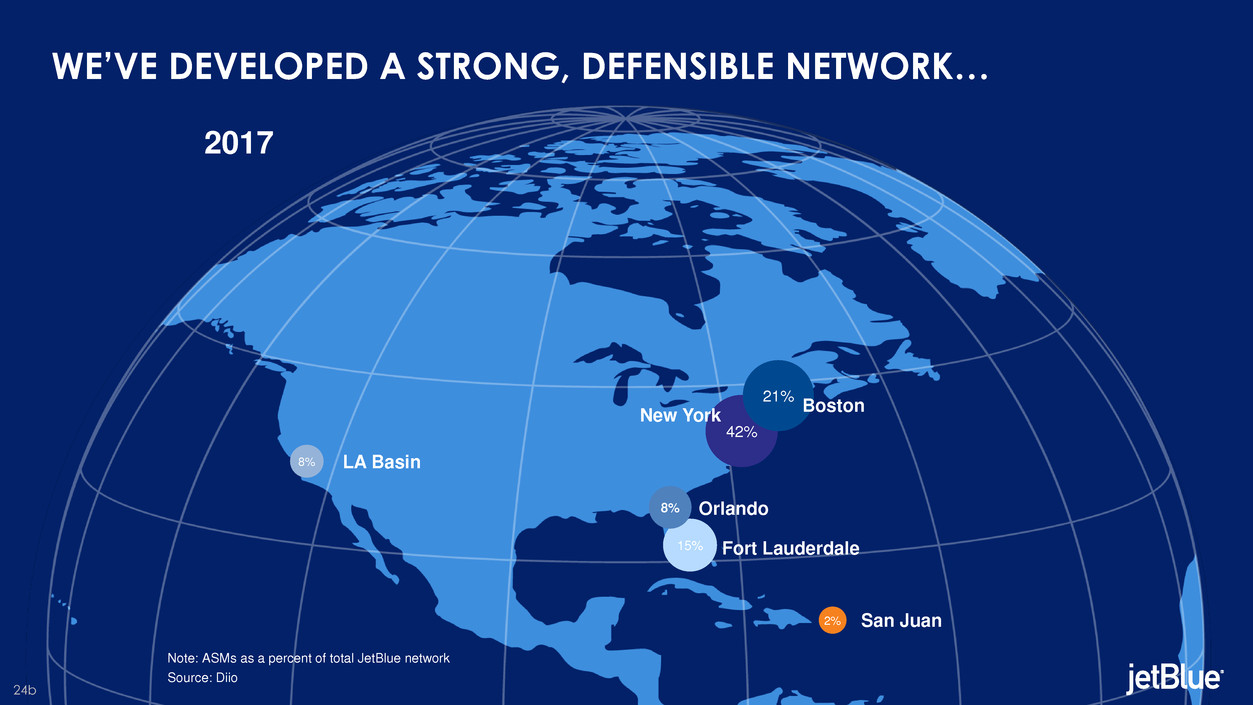
2017
42%
New York
14% 21% Boston
7% 15%
6% 8
8%
2%
Source: Diio
Note: ASMs as a percent of total JetBlue network
24b

+ 24 pts + 34 pts
+ 10 pts
+ 15 pts + 24 pts + 28pts
NYC BOS FLL MCO SJU LA Basin
MARGIN BY FOCUS CITY: THEN AND NOW
…THAT GENERATES STRONG MARGINS IN EACH FOCUS CITY
Q3 2006 TTM Q3 2016 TTM
Boston Fort Lauderdale Orlando San Juan New York
25

DIFFERENTIATED BY OUR FOCUS ON LARGE ‘LOCAL’ MARKETS
0%
10%
20%
30%
40%
50%
60%
70%
System Domestic International
PERCENT CONNECTING TRAFFIC
JBLU “Big 3” LUV
Source: US DOT OD1B, T100
26

JFK-FLL JFK-MCO
5
10
500
1,000
1,500
2013 2014 2015 2016
5
10
500
1,000
1,500
2013 2014 2015 2016
TOOLKIT ALSO INCLUDES 200-SEAT A321
Frees up 1 JFK
slot pair
Frees up 2 JFK
slot pairs
Seats/Day JFK Slots Seats/Day JFK Slots
27

0%
20%
40%
60%
80%
100%
¹ Based on 2015 seat share by carrier
BOSTON: AMPLE OPPORTUNITY REMAINS
SEAT SHARE IN TOP 20 US METRO AREAS
#1 seat share carrier #2 seat share carrier #3 seat share carrier
Source: Diio
28

(9.0)
(6.0)
(3.0)
0.0
3.0
6.0
9.0
12.0
15.0
($300)
($200)
($100)
$100
$200
$300
$400
$500
Q2 08 Q2 09 Q2 10 Q2 11 Q2 12 Q2 13 Q2 14 Q2 15 Q2 16
Gap to System P&L (M)
31 32 35 42 45 48 51 58 61
BOSTON: MARGINS HAVE IMPROVED AS WE’VE GROWN RELEVANCE
Nonstop Markets:
TTM Profit BOS vs System (ex-BOS)
BOSTON OPERATING MARGIN VS. SYSTEM
29
JFK
SAN
LAS
SEA
SFO
DEN
FLL RSW
MCO
TPA
PBI
RDU
CLT
PHX
PIT
RIC
SJU
AUS
IAD
BUF
CUN
AUA
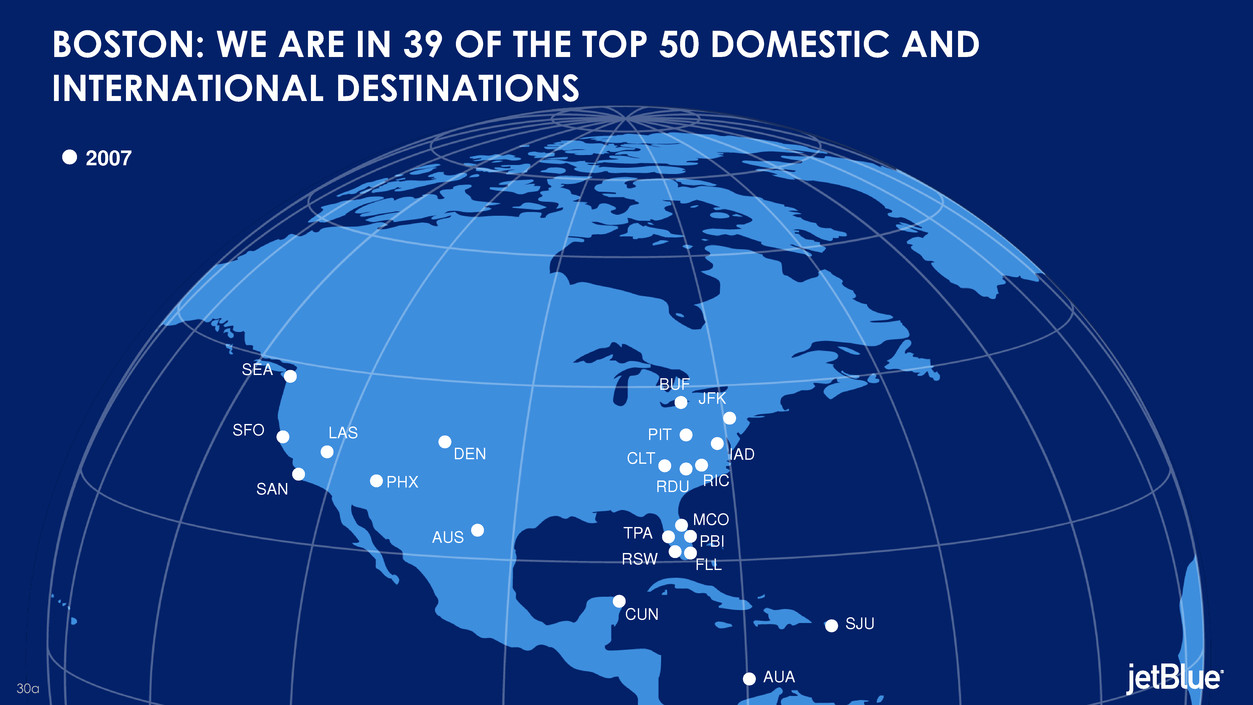
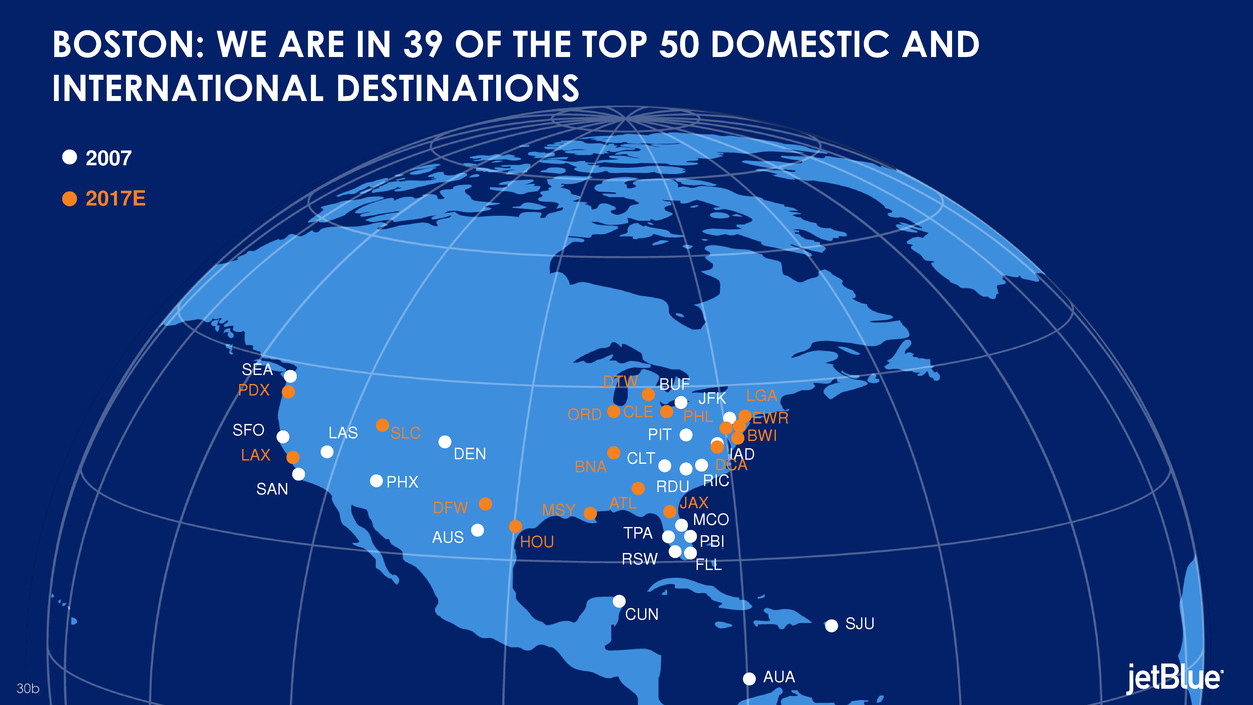
BOSTON: WE ARE IN 39 OF THE TOP 50 DOMESTIC AND
INTERNATIONAL DESTINATIONS
2007
30a
JFK
SAN
LAS
SEA
SFO
DEN
FLL RSW
MCO
TPA
PBI
RDU
CLT
PHX
PIT
RIC
SJU
AUS
IAD
BUF
CUN
AUA
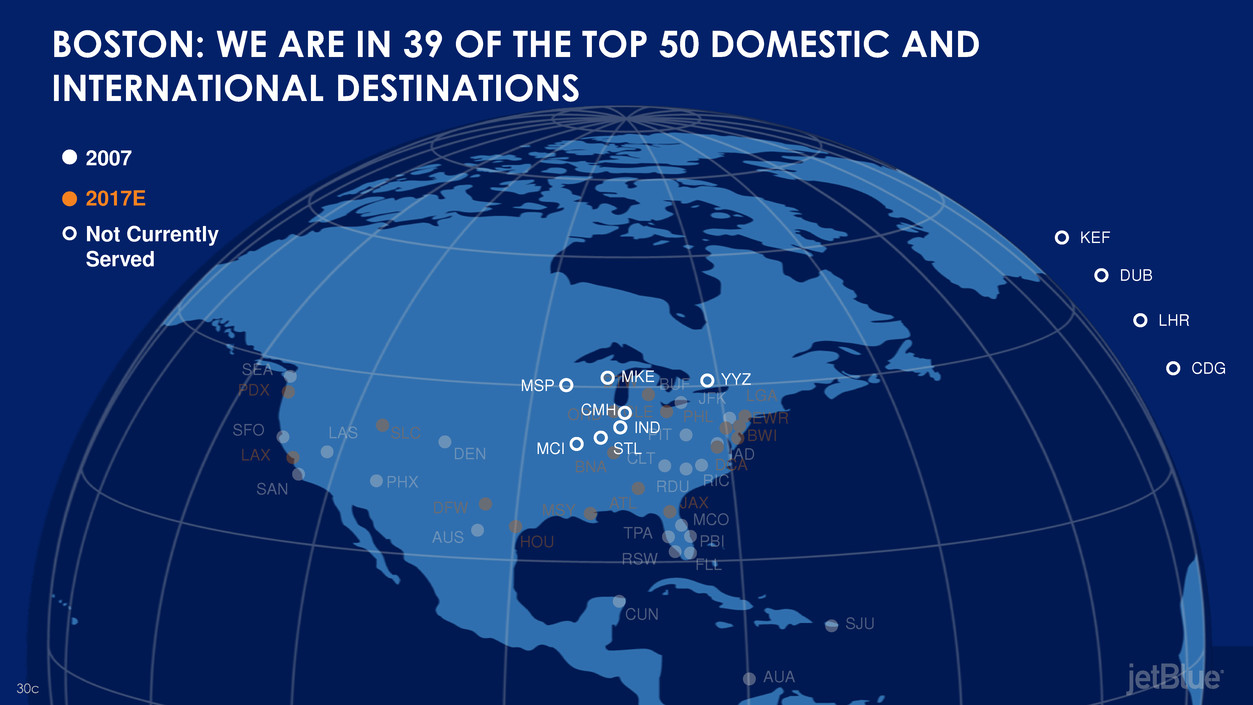
BOSTON: WE ARE IN 39 OF THE TOP 50 DOMESTIC AND
INTERNATIONAL DESTINATIONS
2007
EWR CLE
MSY
LAX
ATL
ORD
SLC
DFW
DTW
BWI
DCA
PHL
LGA
BNA
PDX
HOU
JAX
2017E
30b
JFK
SAN
LAS
SEA
SFO
DEN
FLL RSW
MCO
TPA
PBI
RDU
CLT
PHX
PIT
RIC
SJU
AUS
IAD
BUF
CUN
AUA
BOSTON: WE ARE IN 39 OF THE TOP 50 DOMESTIC AND
INTERNATIONAL DESTINATIONS
2007
EWR CLE
MSY
LAX
ATL
ORD
SLC
DFW
DTW
BWI
DCA
PHL
LGA
BNA
PDX
HOU
JAX
2017E
Not Currently
Served
DUB
CDG
LHR
CMH
MSP
KEF
STL
IND
MCI
MKE YYZ
30c

¹ Based on 2015 seat share by carrier
SOUTH FLORIDA: AN UNDERSERVED MARKET
SEAT SHARE IN TOP 20 US METRO AREAS
Source: Diio
0%
20%
40%
60%
80%
100%
#1 seat share carrier #2 seat share carrier #3 seat share carrier
31

82%
75% 74%
39%
0%
20%
40%
60%
80%
100%
B6 WN NK AA (MIA)
RASM (top 3 carriers)
Source: US DOT OD1B, T100, Form 41 for YE2Q16
FORT LAUDERDALE: WE GENERATE A STRONG REVENUE PREMIUM
WITH A LOCAL FOCUS
PERCENT LOCAL TRAFFIC (top 3 carriers)
5.00
7.00
9.00
11.00
13.00
B6 WN NKJBLU LUV SAVE JBLU LUV SAVE AAL (MIA)
Note: Stage adjusted. Unshaded area reflects estimated ancillary revenue.
32

-10
-5
0
5
10
1 4 7 10 13 16 19 22 25 28 31 34
M
a
rgin
P
ts
v
s
Indu
s
tr
y
Growth Program Age (Quarters)
FORT LAUDERDALE: MARGINS AS EXPECTED FOR
THIS STAGE OF DEVELOPMENT
Boston Margins vs. Industry
Ft. Lauderdale Margins vs. Industry
FT. LAUDERDALE VS. BOSTON MARGINS BY QUARTER
Source: Company reports
33
EWR
JFK
HPN
LGA
BUF
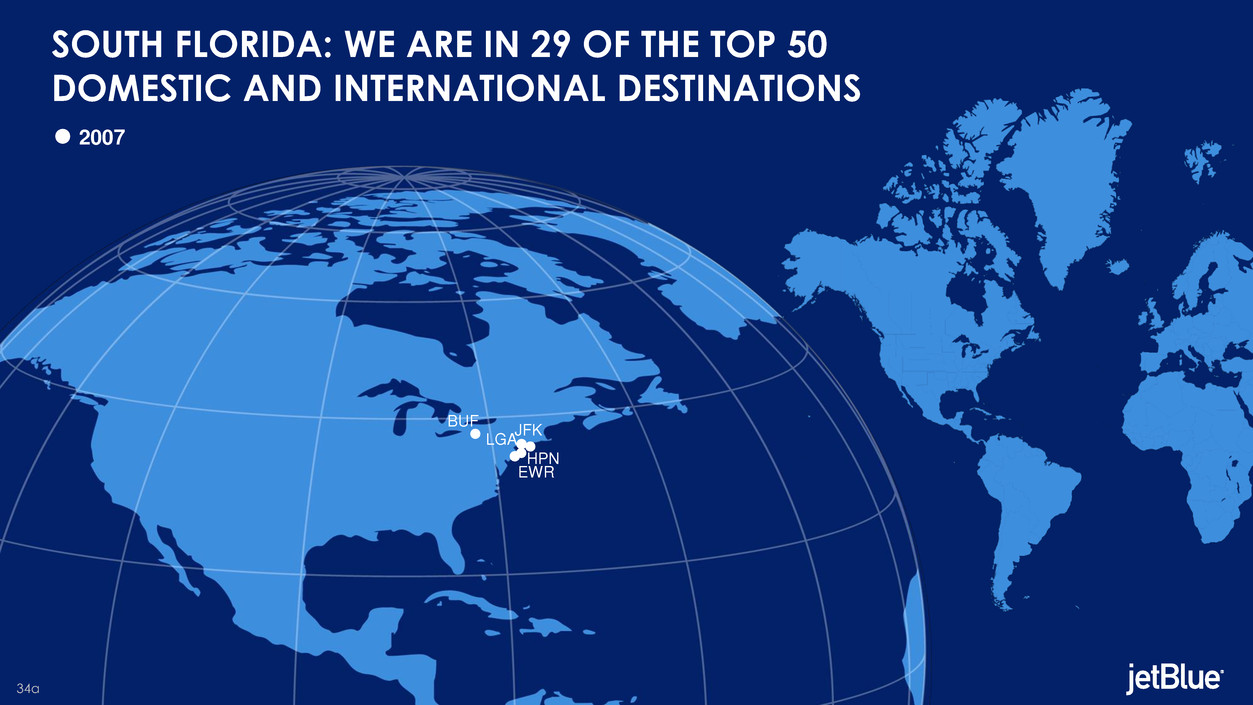
2007
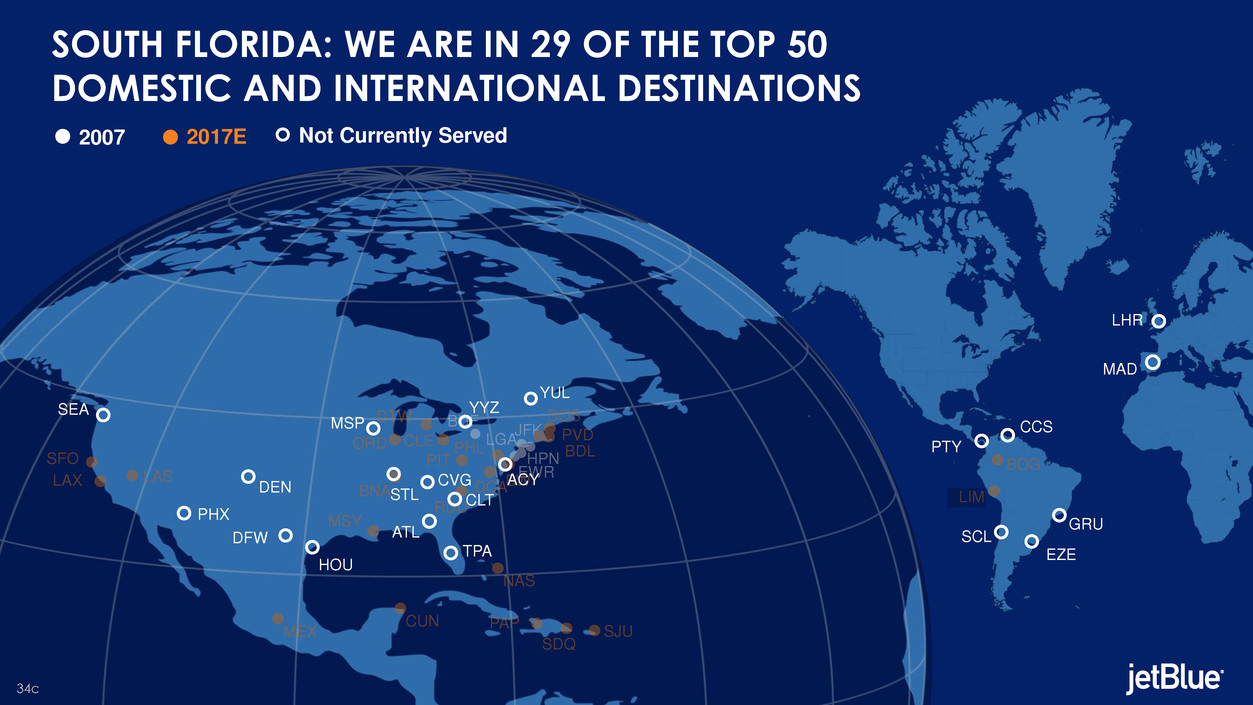
SOUTH FLORIDA: WE ARE IN 29 OF THE TOP 50
DOMESTIC AND INTERNATIONAL DESTINATIONS
34a
EWR
JFK
HPN
LGA
BUF
LIM
ORD
BOS
RDU
PIT
CLE
MSY
DTW
BWI DCA
PHL
BNA
LAS
SFO
LAX
BDL
PVD
BOG
MEX SJU
CUN PAP
SDQ
NAS
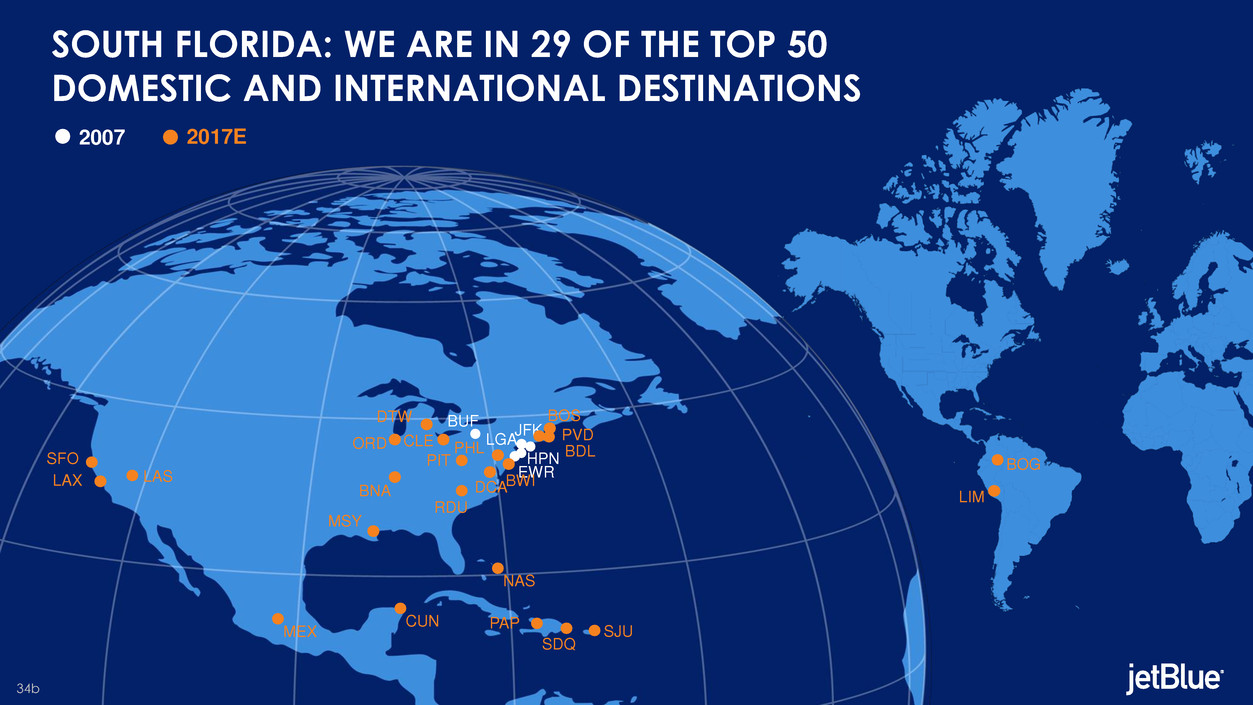
2007 2017E
SOUTH FLORIDA: WE ARE IN 29 OF THE TOP 50
DOMESTIC AND INTERNATIONAL DESTINATIONS
34b
EWR
JFK
HPN
LGA
BUF
LIM
ORD
BOS
RDU
PIT
CLE
MSY
DTW
BWI DCA
PHL
BNA
LAS
SFO
LAX
BDL
PVD
BOG
MEX SJU
CUN PAP
SDQ
NAS
2007 2017E Not Currently Served
SOUTH FLORIDA: WE ARE IN 29 OF THE TOP 50
DOMESTIC AND INTERNATIONAL DESTINATIONS
SEA
DEN
TPA
CLT
PHX
ATL DFW
MSP
STL
CVG ACY
HOU
GRU
EZE
LHR
YYZ
YUL
PTY
CCS
SCL
MAD
34c

2017 CAPACITY GUIDANCE
Region % of Total Capacity
ASMs
Low High
Transcon 30% 11.5% 13.5%
Latin 29% 4.5% 6.5%
Florida 28% 4.5% 6.5%
East 6% 17.5% 19.5%
Central 4% 4.5% 6.5%
West 3% 15.5% 17.5%
System 6.5% 8.5%
35

APPLYING OUR TOOLKIT
36

QUESTIONS
37

BREAK
38

ROBIN HAYES | PRESIDENT
IMPROVING THE JETBLUE EXPERIENCE
JOANNA GERAGHTY
EVP CUSTOMER EXPERIENCE
JEFF MARTIN
EVP OPERATIONS
39

PRODUCT & SERVICE MATTER
Source: DOT OD1B, T100
REVENUE PREMIUM
40
NPS VS. RELATIVE REVENUE PERFORMANCE

INVESTMENTS ALLOW US TO FOCUS ON CUSTOMER EXPERIENCE
41

IMPROVING OPERATIONAL PROCESS TO MATCH
PRODUCT AND FLEET EVOLUTION
JBLU
JBLU
42

ENHANCING RELIABILITY IN A HIGH UTILIZATION MODEL
Aircraft
Utilization
Technical
Dispatch
Reliability
*A321 YE aircraft totals: 2014 – 13; 2015 – 25; 2016 – 37
1 2016 YTD Aircraft Utilization data as of 10/31/2016
2 2016 YTD TDR data as of 11/14/2016
Note: “Aircraft Utilization” as publicly reported is calculated as Completed Block Hours divided by the daily number of aircraft in fleet, regardless of availability to operations.
E190
60 Aircraft
A320
130 Aircraft
A321
37 Aircraft*
9.7 9.9 9.7
7
8
9
10
2014 2015 2016 (YTD)1
12.7 12.7 12.8
11
12
13
14
2014 2015 2016 (YTD)1
12.1
12.9
13.5
11
12
13
14
2014 2015 2016 (YTD)1
97.645
98.205 98.344
96
97
98
99
100
2014 2015 2016 (YTD)2
97.664 97.639 97.654
96
97
98
99
100
2014 2015 2016 (YTD)2
97.862 97.947 97.946
96
97
98
99
100
2014 2015 2016 (YTD)2
*
*
43

WE OPERATE IN THE MOST COMPLEX U.S. AIRSPACE
0
5
10
0%
50%
100%
Ice Storm (Feb
'07)
Ice Storm (Dec
'10)
Sandy (Oct '12) Hercules (Jan '14) Matthew (Oct '16)
Major Storm Comparison
Completion Factor (lhs) # of Days impacting operations (rhs)
0%
10%
20%
30%
40%
50%
60%
70%
80%
90%
JBLU UAL AAL DAL ALK LUV
% of Departures Scheduled in/out of SFO,
ORD, DCA, PHL, NYC Metro, BOS
Pct Flights Pct ASMs
Source: Diio
44

SAFETY: OUR NUMBER ONE VALUE
OJI "TOTAL RECORDABLE" CASE RATE PER
200,000 HOURS WORKED – YTD 3Q16
0
1
2
3
4
5
6
7
8
A4A-1 A4A-2 A4A-3 JBLU A4A-7
Total Recordable Case Rate Industry Average
OJI, on the job injury
Source: A4A. NOTE: Industry data provided by A4A, current through September 2016; A4A carriers: JetBlue, American Airlines, Atlas Air Worldwide,
United Airlines, UPS, Alaska Airlines, Southwest, Fedex, Hawaiian, Air Canada (Associate Member)
0.0 1.0 2.0 3.0 4.0 5.0
A4A-1
A4A-2
A4A-3
A4A-4
A4A-5
A4A-6
A4A-7
A4A-8
A4A-10
GROUND DAMAGE EVENT RATE PER 10,000
DEPARTURES – YTD 3Q16
JBLU
45

ROBIN HAYES | PRESIDENT
FINANCIAL SUMMARY & OUTLOOK
JIM LEDDY
SVP TREASURER & CHIEF FINANCIAL OFFICER (INTERIM)
46

JETBLUE APPROACH FINDING TRACTION, FOCUS ON
SUSTAINING RELATIVE MARGIN GAINS
RASM GROWTH VS. PEERS COST GROWTH VS. PEERS
Seat Miles (CAGR) RASM (CAGR) CASM ex-Fuel, P/S (CAGR)
0.4%
-2.4%
0.0%
[VALUE
]
2011-2016E 2014-2016E
7.5%
9.1%
1.9%
3.3%
2011-2016E 2014-2016E
2.4%
0.7%
1.7%
1.4%
2011-2016E 2014-2016E
CAPACITY GROWTH VS. PEERS
JBLU PEERS
Peers include AAL, ALK, DAL, LUV, SAVE, UAL and VA.
Source: Company Financial Reports
JBLU PEERS JBLU PEERS
47
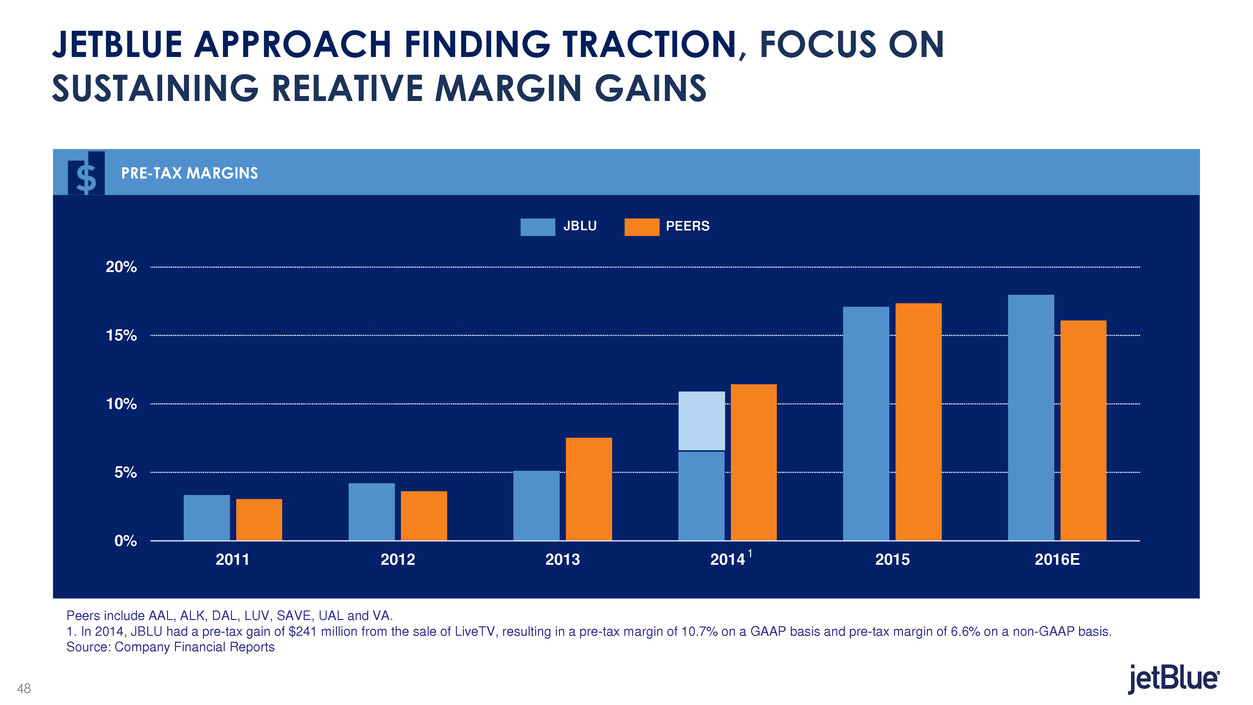
JETBLUE APPROACH FINDING TRACTION, FOCUS ON
SUSTAINING RELATIVE MARGIN GAINS
* Peers include: AAL, ALK, DAL, LUV, SAVE, UAL
0%
5%
10%
15%
20%
2011 2012 2013 2014 2015 2016E
PRE-TAX MARGINS
JBLU PEERS
Peers include AAL, ALK, DAL, LUV, SAVE, UAL and VA.
1. In 2014, JBLU had a pre-tax gain of $241 million from the sale of LiveTV, resulting in a pre-tax margin of 10.7% on a GAAP basis and pre-tax margin of 6.6% on a non-GAAP basis.
Source: Company Financial Reports
1
48

2017 GUIDANCE
Metric Guidance Range
Capacity 6.5 – 8.5%
CASM excluding fuel 1 – 3%
Capex (aircraft) $1.05bn - $1.2bn
Capex (non-aircraft) $150m – $200m
Other Income/(Expense) ($95m) – ($105m)
* Scheduled vs scheduled ASMs
Note: Detailed 2015 guidance will be provided in January 2015 on JetBlue’s fourth quarter and full year earnings call
49

STAGE LENGTH, LABOR AND MAINTENANCE ARE
PRIMARY CASM EX-FUEL PRESSURES
2017 CASM EX-FUEL HEADWINDS AND TAILWINDS
~1.5pts
~0.5pts
~0.0pts
2.0%
0.0%
0.5%
1.0%
1.5%
2.0%
2.5%
Stage Length Salaries, Wages & Benefits,
MM&R and Profit Sharing
All Other 2017 (Midpoint of Guidance)
2
0
1
7
C
A
S
M
e
x
-Fue
l
Y
o
Y
%
50

MEDIUM TERM FINANCIAL GOALS
Metric 2017-2020
Capacity High Single Digit CAGR
CASM excluding fuel
1-3% in 2017
Flat to 1% CAGR 2018-2020
Capex Average of ~$1.3bn
51

ROBIN HAYES | PRESIDENT
STRUCTURAL COST INITIATIVES
STEVE PRIEST
VP STRUCTURAL PROGRAMS
52
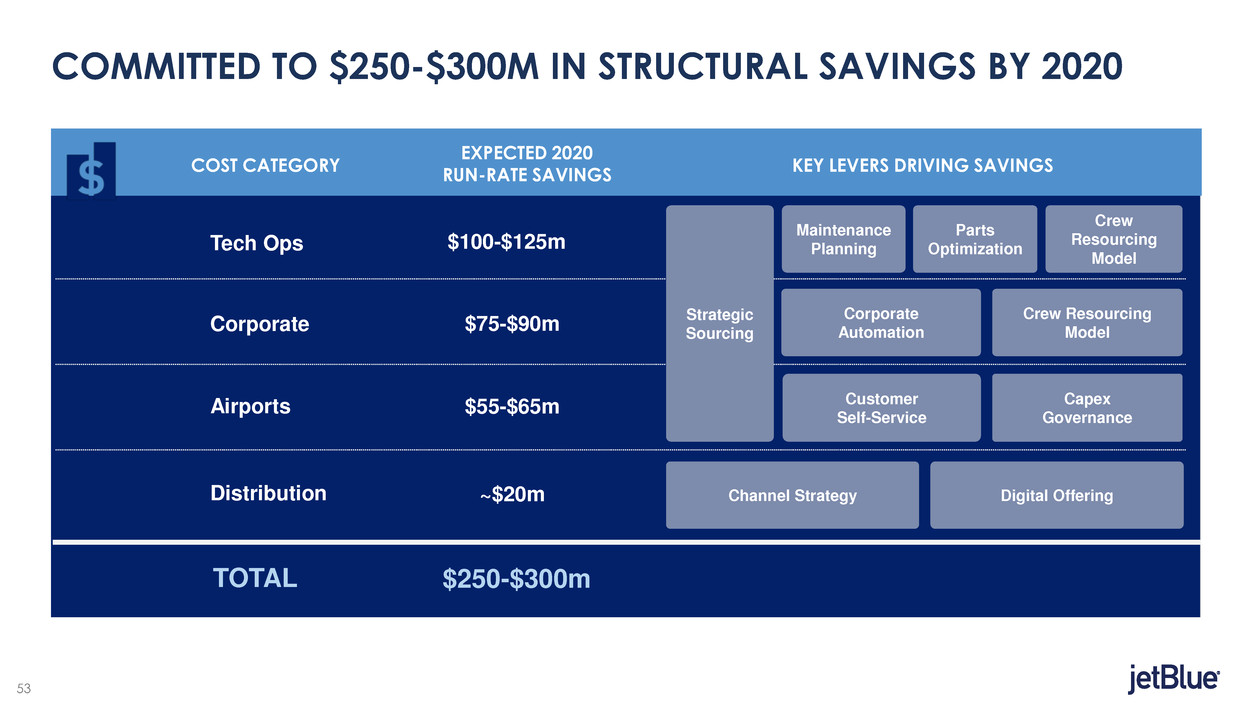
COMMITTED TO $250-$300M IN STRUCTURAL SAVINGS BY 2020
Maintenance
Planning
Crew
Resourcing
Model
Parts
Optimization
Crew Resourcing
Model
Corporate
Automation
Customer
Self-Service
Capex
Governance
Tech Ops
Airports
Corporate
TOTAL
Distribution Channel Strategy Digital Offering
COST CATEGORY
EXPECTED 2020
RUN-RATE SAVINGS
KEY LEVERS DRIVING SAVINGS
$100-$125m
$55-$65m
$75-$90m
~$20m
$250-$300m
Strategic
Sourcing
53

TECH OPS: $100-$125M OPPORTUNITY
54

CORPORATE: $75-$90M OPPORTUNITY
Source: XXXXX
55

AIRPORTS: $55-$65M OPPORTUNITY
56

DISTRIBUTION: ~$20M OPPORTUNITY
JBLU
57

COMMITTED TO $250-$300M IN STRUCTURAL SAVINGS BY 2020
AIRPORTS
TECH OPS CORPORATE
DISTRIBUTION
58
ROBIN HAYES | PRESIDENT
CAPITAL ALLOCATION
JIM LEDDY
SVP TREASURER & CHIEF FINANCIAL OFFICER (INTERIM)
59
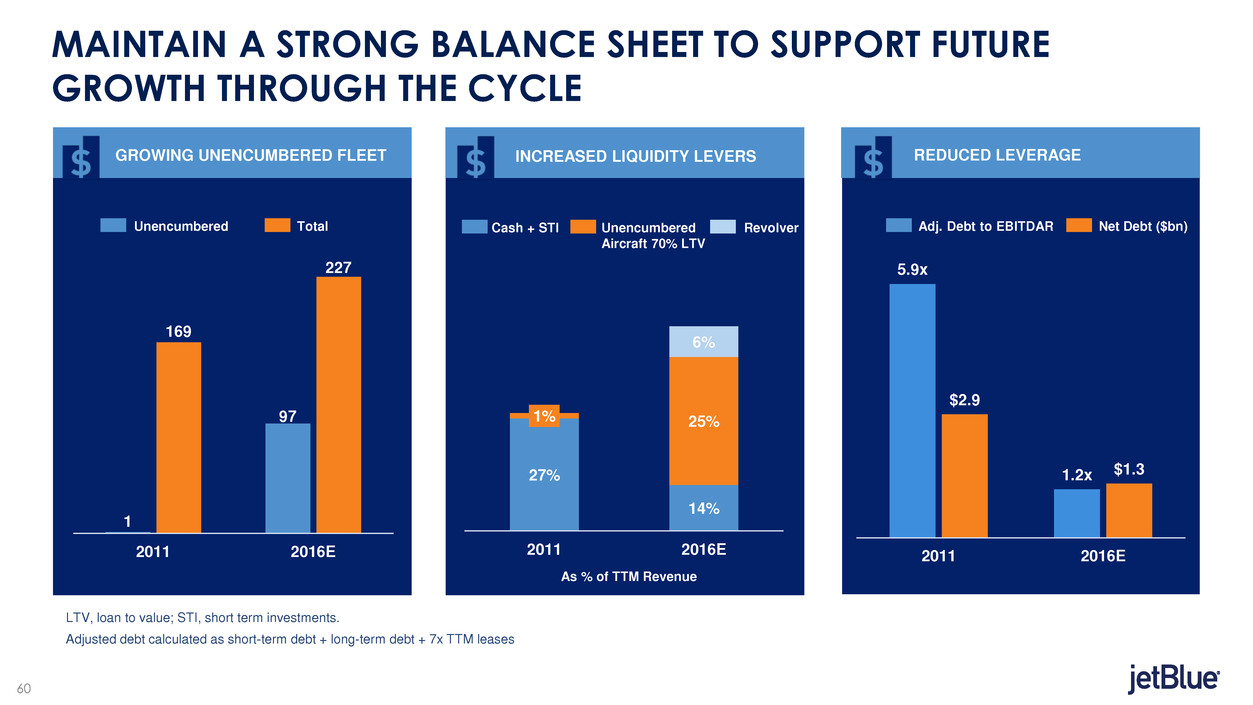
MAINTAIN A STRONG BALANCE SHEET TO SUPPORT FUTURE
GROWTH THROUGH THE CYCLE
1
97
169
227
2011 2016E
GROWING UNENCUMBERED FLEET
INCREASED LIQUIDITY LEVERS
REDUCED LEVERAGE
Unencumbered Total
27%
14%
1% 25%
6%
2011 2016E
Cash + STI Unencumbered
Aircraft 70% LTV
Revolver
As % of TTM Revenue
5.9x
1.2x
$2.9
$1.3
2011 2016E
Adj. Debt to EBITDAR Net Debt ($bn)
LTV, loan to value; STI, short term investments.
Adjusted debt calculated as short-term debt + long-term debt + 7x TTM leases
60

INVESTING IN NETWORK GROWTH WHILE SUPPLEMENTING WITH
‘ACCELERATOR CAPITAL’
CAPITAL EXPENDITURE
Aircraft Non-Aircraft
2017E
$1.2bn - $1.4bn
2018E
$1.1bn - $1.2bn Non-Aircraft Capital Efficiency
Focused Network Growth,
Mint & Aircraft Capital
Efficiency
IT Infrastructure
Tech Ops Planning
Customer Facing Tech
Self-Service
Cabin Restyling
NextGen
61

MATURING APPROACH TO CAPITAL ALLOCATION
AS LEVERAGE REACHES TARGET
Substantial progress in de-risking
balance sheet
• Targeting lower end of 30-40% range
Continuing to invest in the medium and
long term JetBlue vision and growth
Measured capital return to shareholders:
Increased authorization to $500M
deployment 2016-2019
• Commenced with 2016 $120M ASR YE17+
30-40%
3Q16
39%
YE15
46%
YE13
62%
YE11
70%
ADJUSTED DEBT TO CAPITALIZATION
62

QUESTIONS
63

ROBIN HAYES | PRESIDENT
BUILDING ON SUCCESS
ROBIN HAYES
PRESIDENT & CEO
64

HOW WE COMPETE
65

QUESTIONS
66

THANK YOU
67
Serious News for Serious Traders! Try StreetInsider.com Premium Free!
You May Also Be Interested In
- Midday movers: PepsiCo, JetBlue fall; GM, Danaher and UPS rise
- JetBlue Airways (JBLU) options active 93K contracts as share price up 3.7%
- Turtle Creek Asset Management Responds to Gildan Board’s Governance Charade
Create E-mail Alert Related Categories
SEC FilingsSign up for StreetInsider Free!
Receive full access to all new and archived articles, unlimited portfolio tracking, e-mail alerts, custom newswires and RSS feeds - and more!


 Tweet
Tweet Share
Share