Form 8-K JACOBS ENGINEERING GROUP For: Nov 24
UNITED STATES
SECURITIES AND EXCHANGE COMMISSION
Washington, DC 20549
Form 8-K
Current Report
Pursuant to Section 13 or 15(d)
of The Securities Exchange Act of 1934
Date of Report (date of earliest event reported): November 24, 2015
Jacobs Engineering Group Inc.
(Exact name of Registrant as specified in its charter)
| Delaware | 1-7463 | 95-4081636 | ||
| (State of incorporation) | (SEC File No.) | (IRS Employer identification number) |
| 155 North Lake Avenue, Pasadena, California | 91101 | |
| (Address of principal executive offices) | (Zip code) |
Registrant’s telephone number (including area code): (626) 578-3500
Check the appropriate box below if the Form 8-K filing is intended to simultaneously satisfy the filing obligation of the registrant under any of the following provisions:
| ¨ | Written communications pursuant to Rule 425 under the Securities Act (17 CFR 230.425) |
| ¨ | Soliciting material pursuant to Rule 14a-12 under the Exchange Act (17 CFR 240.14a-12) |
| ¨ | Pre-commencement communications pursuant to Rule 14d-2(b) under the Exchange Act (17 CFR 240.14d-2(b)) |
| ¨ | Pre-commencement communications pursuant to Rule 13e-4(c) under the Exchange Act (17 CFR 240.13e-4(c)) |
Item 2.02 Results of Operations and Financial Condition.
A copy of a slide presentation that Jacobs Engineering Group Inc. (the “Company”) will use at investor conferences and presentations is attached to this Current Report on Form 8-K (“Current Report”) as Exhibit 99.1 and is incorporated herein solely for purposes of this Item 2.02 and Item 7.01 below.
The information in this Current Report, including the exhibit, shall not be deemed “filed” for the purposes of Section 18 of the Securities Exchange Act of 1934, as amended, or otherwise subject to the liabilities of that section. Furthermore, this Current Report, including the exhibit, shall not be deemed incorporated by reference in any filing under the Securities Act of 1933, as amended, or the Securities Exchange Act of 1934.
Item 7.01 Regulation FD Disclosure.
The information set forth in Item 2.02 above is incorporated herein by reference.
Item 9.01 Financial Statements and Exhibits.
| (d) | Exhibits |
| 99.1 | Power Point Slide Presentation |
SIGNATURES
Pursuant to the requirements of the Securities Exchange Act of 1934, the Registrant has duly caused this report to be signed on its behalf by the undersigned hereunto duly authorized.
Dated: November 24, 2015
| JACOBS ENGINEERING GROUP INC. | ||
| By: | /s/ Kevin C. Berryman | |
| Kevin C. Berryman | ||
| Executive Vice President | ||
| and Chief Financial Officer | ||
3
New York and Boston Financial Community Presentation November 24, 2015 Exhibit 99.1
Statements included in this presentation that are not based on historical fact are forward-looking statements. Although such statements are based on management’s current estimates and expectations, and currently available competitive, financial and economic data, forward-looking statements are inherently uncertain and you should not place undue reliance on such statements as actual results may differ materially. We caution the reader that there are a variety of risks, uncertainties and other factors that could cause actual results to differ materially from what is contained, projected or implied by our forward-looking statements. For a description of some of the risks, uncertainties and other factors that may occur that could cause actual results to differ from our forward-looking statements see our Annual Report on Form 10-K for the period ended October 2, 2015, and in particular the discussions contained in Item 1 - Business, Item 1A - Risk Factors, Item 3 - Legal Proceedings, and Item 7 - Management’s Discussion and Analysis of Financial Condition and Results of Operations, as well as the Company’s other filings with the Securities and Exchange Commission. We also caution the readers of this presentation that we do not undertake to update any forward-looking statements made herein. Forward-Looking Statement Disclaimer

Outline Financial Highlights New CEO Impressions Reorganization Summary & Closing Comments
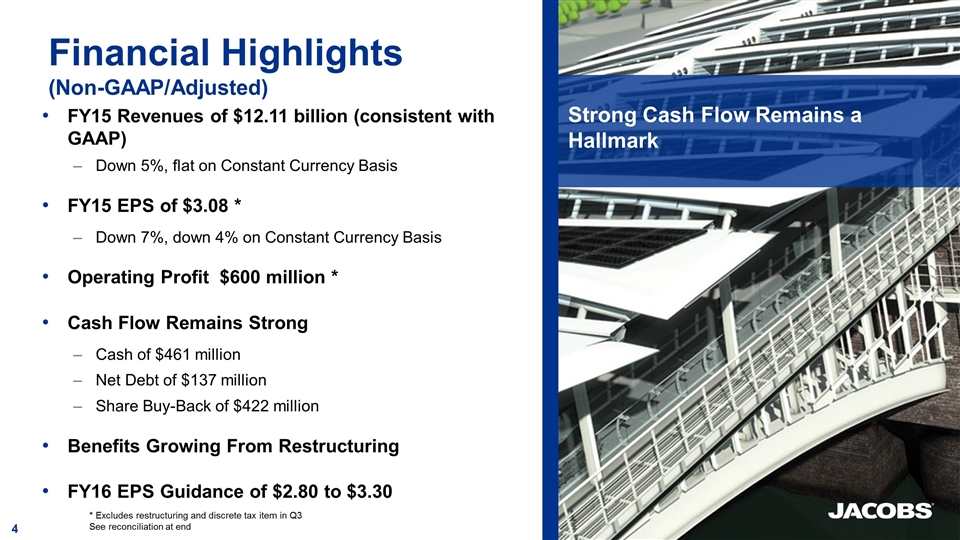
FY15 Revenues of $12.11 billion (consistent with GAAP) Down 5%, flat on Constant Currency Basis FY15 EPS of $3.08 * Down 7%, down 4% on Constant Currency Basis Operating Profit $600 million * Cash Flow Remains Strong Cash of $461 million Net Debt of $137 million Share Buy-Back of $422 million Benefits Growing From Restructuring FY16 EPS Guidance of $2.80 to $3.30 Financial Highlights (Non-GAAP/Adjusted) Strong Cash Flow Remains a Hallmark * Excludes restructuring and discrete tax item in Q3 See reconciliation at end
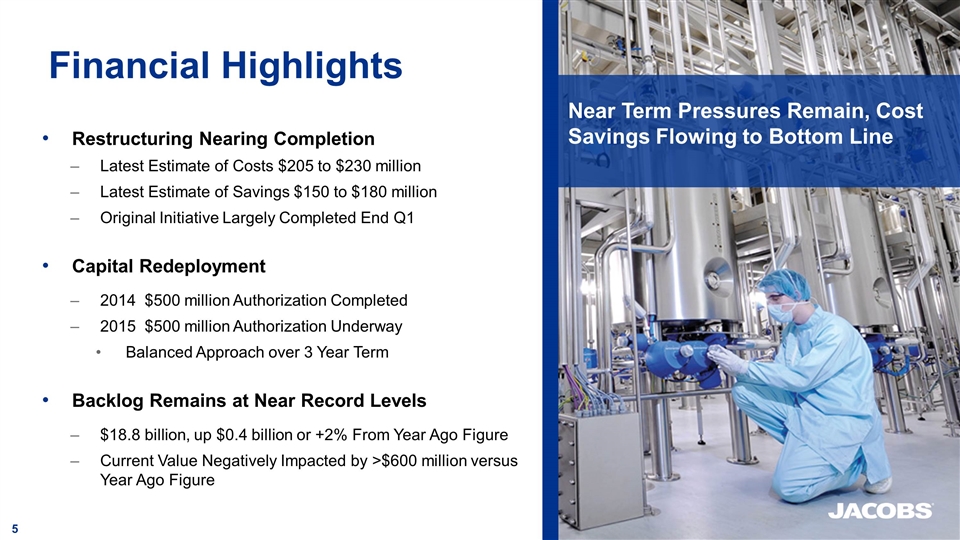
Restructuring Nearing Completion Latest Estimate of Costs $205 to $230 million Latest Estimate of Savings $150 to $180 million Original Initiative Largely Completed End Q1 Capital Redeployment 2014 $500 million Authorization Completed 2015 $500 million Authorization Underway Balanced Approach over 3 Year Term Backlog Remains at Near Record Levels $18.8 billion, up $0.4 billion or +2% From Year Ago Figure Current Value Negatively Impacted by >$600 million versus Year Ago Figure Financial Highlights Near Term Pressures Remain, Cost Savings Flowing to Bottom Line

Distinguishable Strengths Safety – BeyondZero & Culture of Caring Work Ethic & Employee Pride in Jacobs Technical Expertise & Engineering Skillset Diversity of End-markets and Client Portfolio Reimbursable projects remain at 83% New CEO Impressions Re-energizing our Passion for Excellence
Strong Foundation to Grow Value-Based Solutions Record Client Satisfaction at >92% Repeat Business >95% Nearly 10 B$ in Client Savings from Innovative Value-Based Solutions 21 million mt of CO2 Savings from Sustainability Ideas
Global Focus & Simplification Accountability & Transparency Pro-actively Optimizing Cost Structure Adapting to Changing Global Markets Improving Quality & Performance Developing Strategic Clarity Targeted Strategic Growth Opportunities
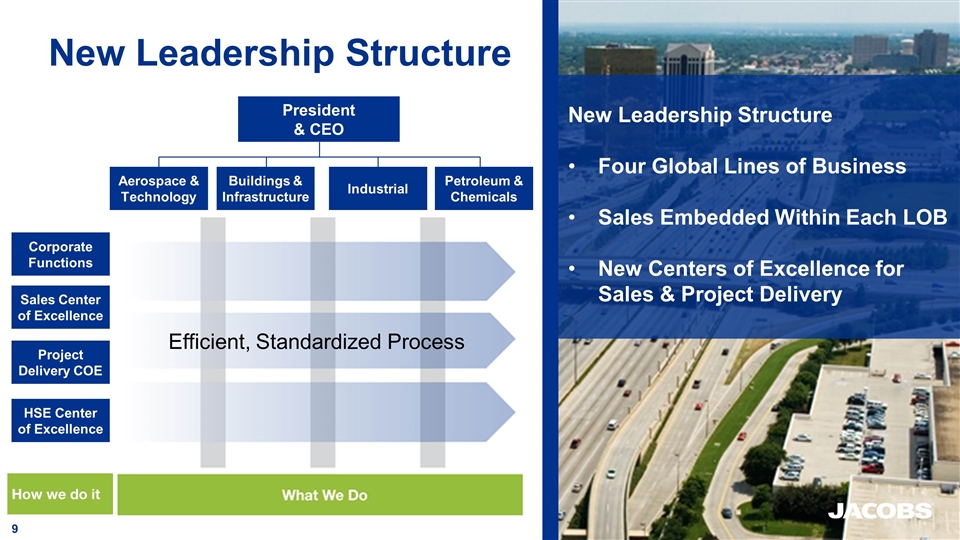
New Leadership Structure New Leadership Structure Four Global Lines of Business Sales Embedded Within Each LOB New Centers of Excellence for Sales & Project Delivery Buildings & Infrastructure President & CEO Aerospace & Technology Industrial Petroleum & Chemicals Project Delivery COE Sales Center of Excellence HSE Center of Excellence Corporate Functions Efficient, Standardized Process
Launching Transformation Benefits of New Structure Seamlessly Serve Global Customers Greater Accountability & Clarity Strengthen “One Jacobs” Enhance Competitive Position Drive Profitable, Long-term Growth
Performance-Based, with Greater Accountability Driving Accountability New Management Incentive Program Corporate Performance 50% LOB Performance 50% Metrics Include P&L and B/S Operating Profit Working Capital Enhance Employee Engagement & Accountability
Improved Quality and Performance Will Drive Growth Project Delivery Excellence Strengthen Global Tools & Standards Increase Productivity Reduce Write-Offs Improve Project Performance Increase Market Share
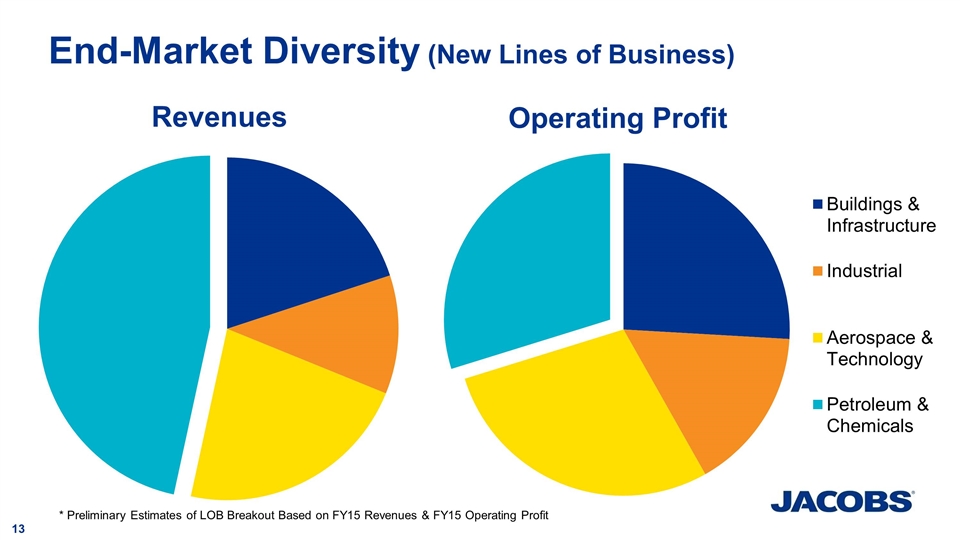
End-Market Diversity (New Lines of Business) * Preliminary Estimates of LOB Breakout Based on FY15 Revenues & FY15 Operating Profit ABC
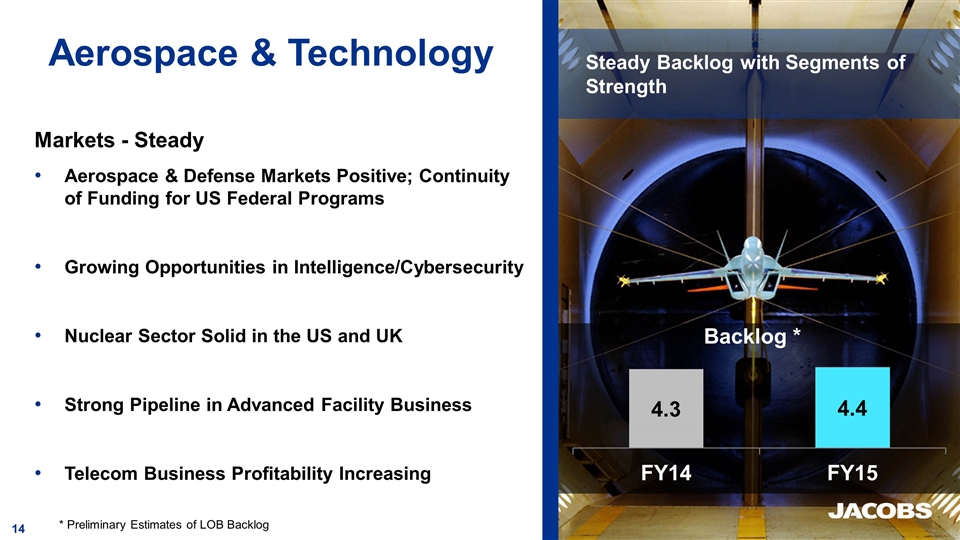
Aerospace & Technology Backlog * Steady Backlog with Segments of Strength Markets - Steady Aerospace & Defense Markets Positive; Continuity of Funding for US Federal Programs Growing Opportunities in Intelligence/Cybersecurity Nuclear Sector Solid in the US and UK Strong Pipeline in Advanced Facility Business Telecom Business Profitability Increasing * Preliminary Estimates of LOB Backlog
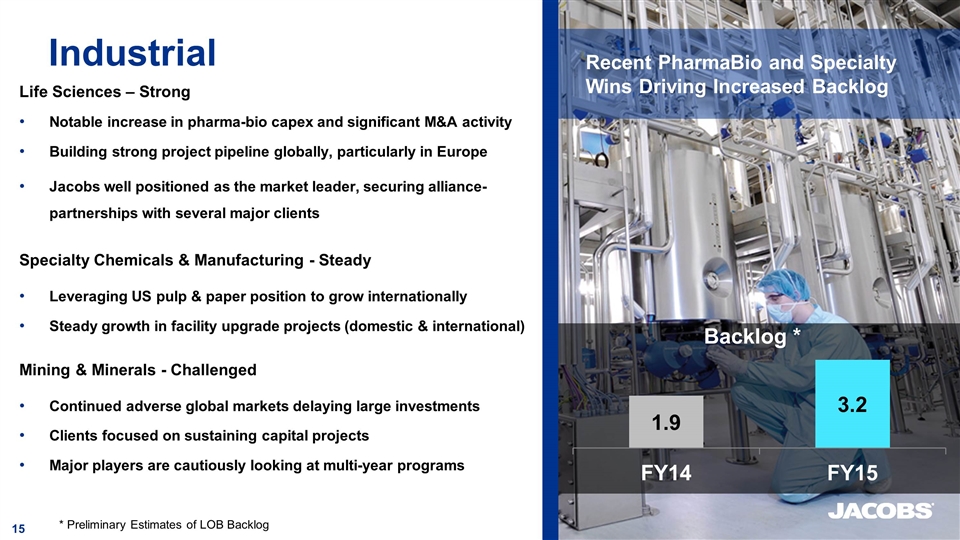
Industrial Recent PharmaBio and Specialty Wins Driving Increased Backlog Life Sciences – Strong Notable increase in pharma-bio capex and significant M&A activity Building strong project pipeline globally, particularly in Europe Jacobs well positioned as the market leader, securing alliance-partnerships with several major clients Specialty Chemicals & Manufacturing - Steady Leveraging US pulp & paper position to grow internationally Steady growth in facility upgrade projects (domestic & international) Mining & Minerals - Challenged Continued adverse global markets delaying large investments Clients focused on sustaining capital projects Major players are cautiously looking at multi-year programs * Preliminary Estimates of LOB Backlog Backlog *
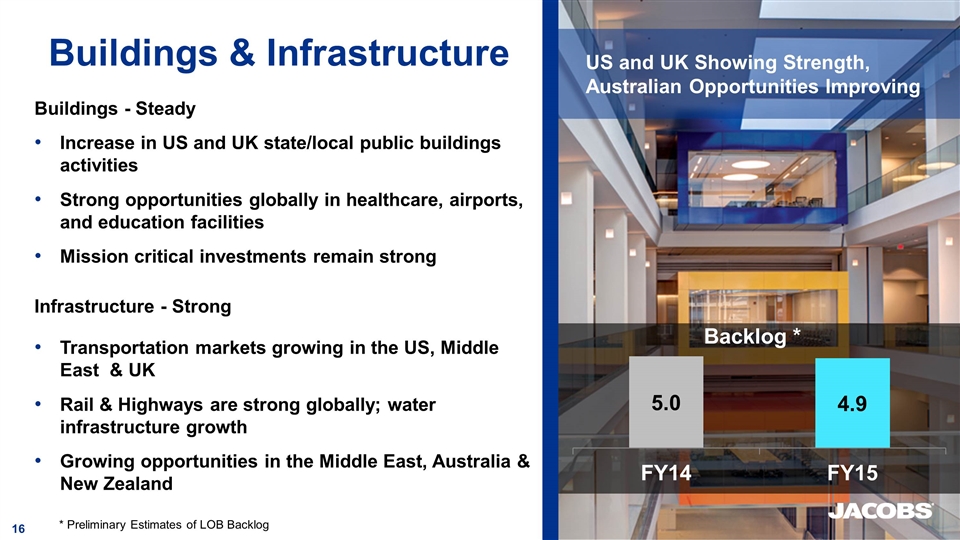
Buildings & Infrastructure US and UK Showing Strength, Australian Opportunities Improving Buildings - Steady Increase in US and UK state/local public buildings activities Strong opportunities globally in healthcare, airports, and education facilities Mission critical investments remain strong Infrastructure - Strong Transportation markets growing in the US, Middle East & UK Rail & Highways are strong globally; water infrastructure growth Growing opportunities in the Middle East, Australia & New Zealand * Preliminary Estimates of LOB Backlog Backlog *
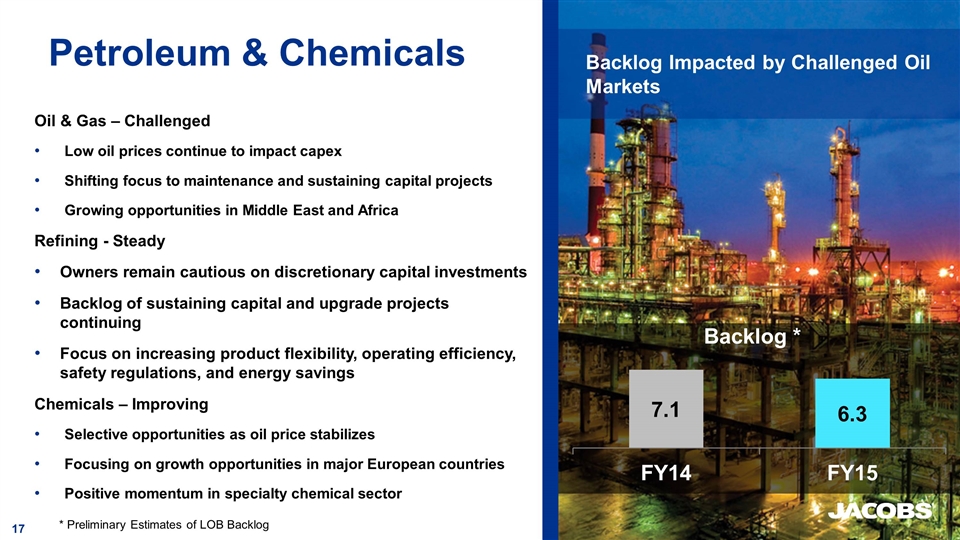
Petroleum & Chemicals Backlog Impacted by Challenged Oil Markets Oil & Gas – Challenged Low oil prices continue to impact capex Shifting focus to maintenance and sustaining capital projects Growing opportunities in Middle East and Africa Refining - Steady Owners remain cautious on discretionary capital investments Backlog of sustaining capital and upgrade projects continuing Focus on increasing product flexibility, operating efficiency, safety regulations, and energy savings Chemicals – Improving Selective opportunities as oil price stabilizes Focusing on growth opportunities in major European countries Positive momentum in specialty chemical sector * Preliminary Estimates of LOB Backlog Backlog *
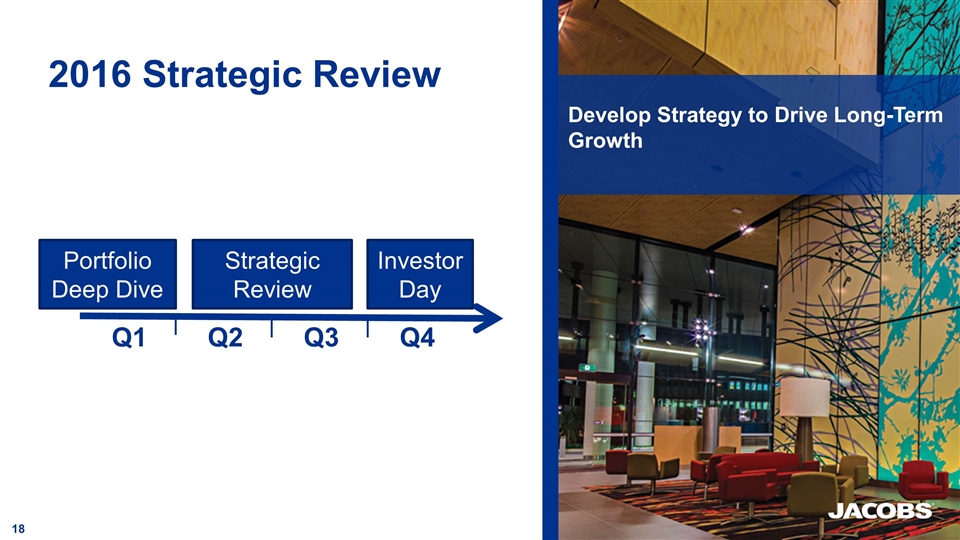
Develop Strategy to Drive Long-Term Growth 2016 Strategic Review Q1Q2Q3Q4 Portfolio Deep Dive Investor Day Strategic Review
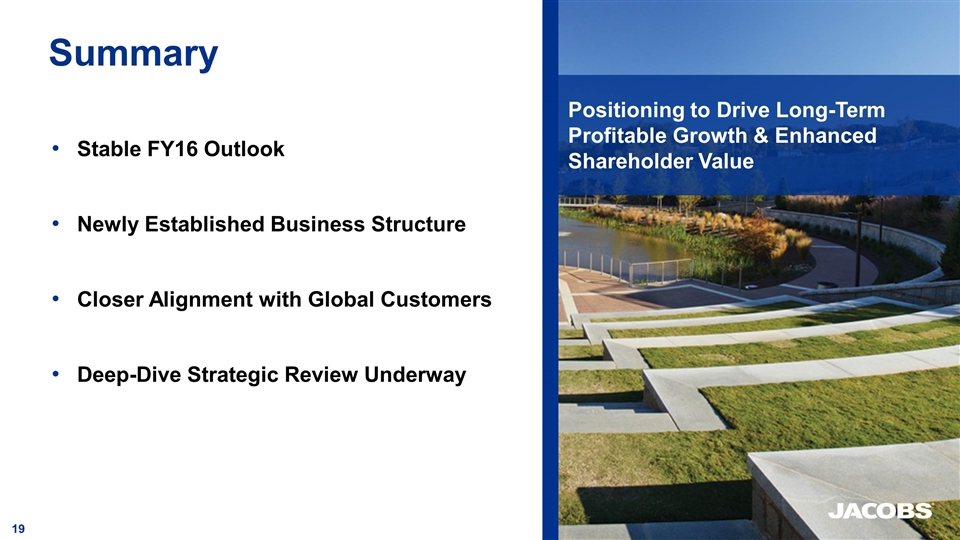
Positioning to Drive Long-Term Profitable Growth & Enhanced Shareholder Value Summary Stable FY16 Outlook Newly Established Business Structure Closer Alignment with Global Customers Deep-Dive Strategic Review Underway

Buildings National Government Infrastructure Mining & Minerals Pharma Bio Power High Tech Food & Consumer Products Pulp & Paper Oil & Gas Upstream Chemicals Refining Downstream

Thank You! www.jacobs.com
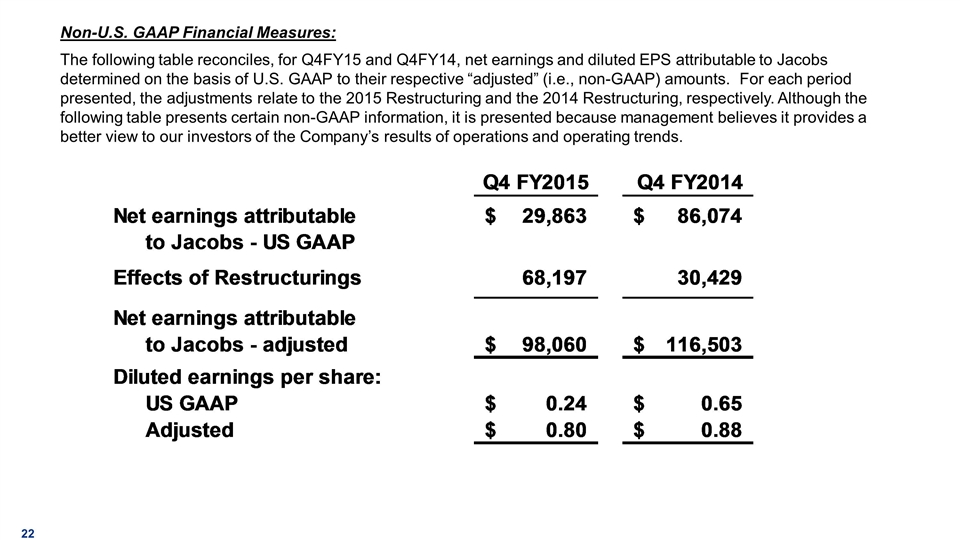
Non-U.S. GAAP Financial Measures: The following table reconciles, for Q4FY15 and Q4FY14, net earnings and diluted EPS attributable to Jacobs determined on the basis of U.S. GAAP to their respective “adjusted” (i.e., non-GAAP) amounts. For each period presented, the adjustments relate to the 2015 Restructuring and the 2014 Restructuring, respectively. Although the following table presents certain non-GAAP information, it is presented because management believes it provides a better view to our investors of the Company’s results of operations and operating trends. Q4 FY2015 Q4 FY2014 Net earnings attributable $29,863 $86,074 to Jacobs - US GAAP Effects of Restructurings 68,197 30,429 Net earnings attributable to Jacobs - adjusted $98,060 $,116,503 Diluted earnings per share: US GAAP $0.24 $0.65 Adjusted $0.8 $0.88 Q4 FY2015 Q4 FY2014 Net earnings attributable $29,863 $86,074 to Jacobs - US GAAP Effects of Restructurings 68,197 30,429 Net earnings attributable to Jacobs - adjusted $98,060 $,116,503 Diluted earnings per share: US GAAP $0.24 $0.65 Adjusted $0.8 $0.88
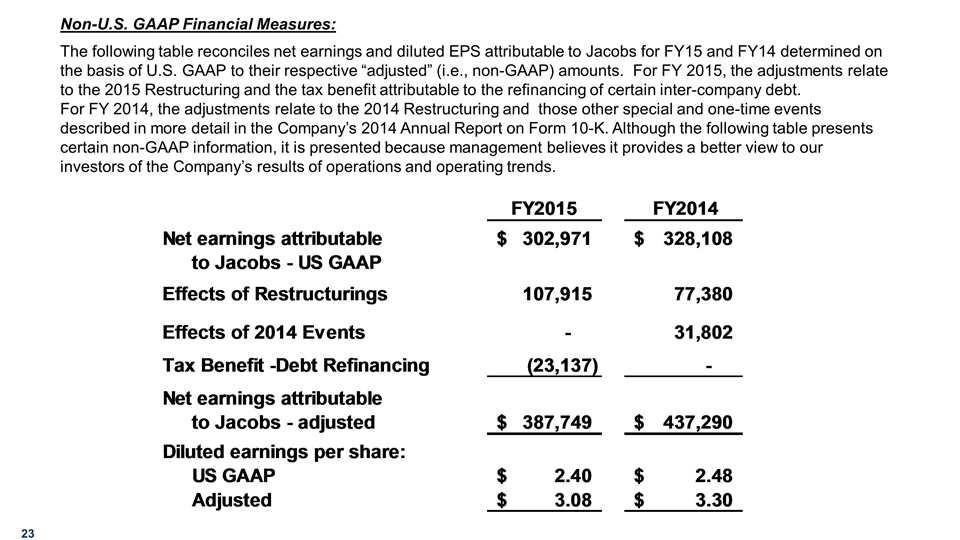
Non-U.S. GAAP Financial Measures: The following table reconciles net earnings and diluted EPS attributable to Jacobs for FY15 and FY14 determined on the basis of U.S. GAAP to their respective “adjusted” (i.e., non-GAAP) amounts. For FY 2015, the adjustments relate to the 2015 Restructuring and the tax benefit attributable to the refinancing of certain inter-company debt. For FY 2014, the adjustments relate to the 2014 Restructuring and those other special and one-time events described in more detail in the Company’s 2014 Annual Report on Form 10-K. Although the following table presents certain non-GAAP information, it is presented because management believes it provides a better view to our investors of the Company’s results of operations and operating trends. FY2015 FY2014 Net earnings attributable $,302,971 $,328,108 to Jacobs - US GAAP Effects of Restructurings ,107,915 77,380 Effects of 2014 Events 0 31,802 Tax Benefit -Debt Refinancing ,-23,137 0 Net earnings attributable to Jacobs - adjusted $,387,749 $,437,290 Diluted earnings per share: US GAAP $2.4 $2.48 Adjusted $3.08 $3.3 FY2015 FY2014 Net earnings attributable $,302,971 $,328,108 to Jacobs - US GAAP Effects of Restructurings ,107,915 77,380 Effects of 2014 Events 0 31,802 Tax Benefit -Debt Refinancing ,-23,137 0 Net earnings attributable to Jacobs - adjusted $,387,749 $,437,290 Diluted earnings per share: US GAAP $2.4 $2.48 Adjusted $3.08 $3.3
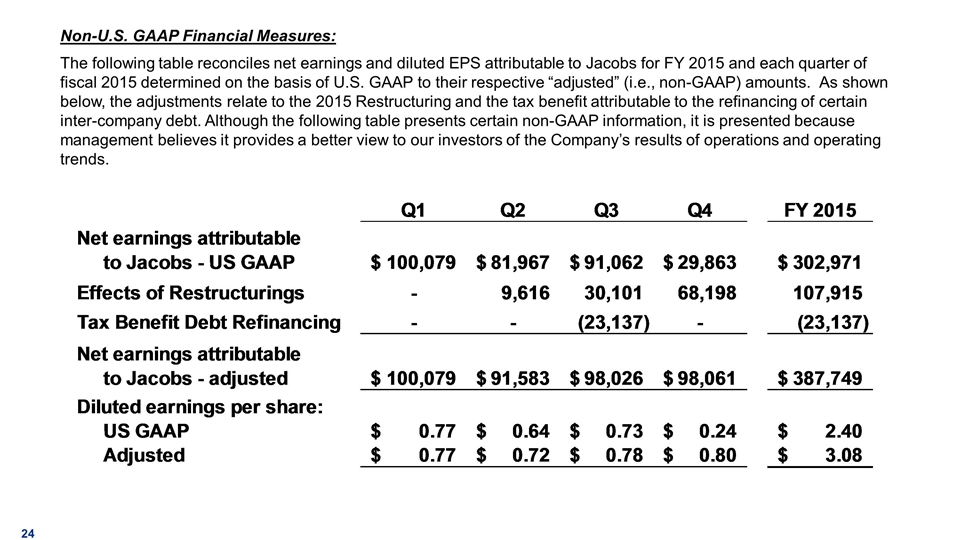
Non-U.S. GAAP Financial Measures: The following table reconciles net earnings and diluted EPS attributable to Jacobs for FY 2015 and each quarter of fiscal 2015 determined on the basis of U.S. GAAP to their respective “adjusted” (i.e., non-GAAP) amounts. As shown below, the adjustments relate to the 2015 Restructuring and the tax benefit attributable to the refinancing of certain inter-company debt. Although the following table presents certain non-GAAP information, it is presented because management believes it provides a better view to our investors of the Company’s results of operations and operating trends. Q1 Q2 Q3 Q4 FY 2015 Net earnings attributable to Jacobs - US GAAP $,100,079 $81,967 $91,062 $29,863 $,302,971 Effects of Restructurings - 9,616 30,101 68,198 ,107,915 Tax Benefit Debt Refinancing - - ,-23,137 - ,-23,137 Net earnings attributable to Jacobs - adjusted $,100,079 $91,583 $98,026 $98,061 $,387,749 Diluted earnings per share: US GAAP $0.77 $0.64 $0.73 $0.24 $2.4 Adjusted $0.77 $0.72 $0.78 $0.8 $3.08 Q1 Q2 Q3 Q4 FY 2015 Net earnings attributable to Jacobs - US GAAP $,100,079 $81,967 $91,062 $29,863 $,302,971 Effects of Restructurings - 9,616 30,101 68,198 ,107,915 Tax Benefit Debt Refinancing - - ,-23,137 - ,-23,137 Net earnings attributable to Jacobs - adjusted $,100,079 $91,583 $98,026 $98,061 $,387,749 Diluted earnings per share: US GAAP $0.77 $0.64 $0.73 $0.24 $2.4 Adjusted $0.77 $0.72 $0.78 $0.8 $3.08
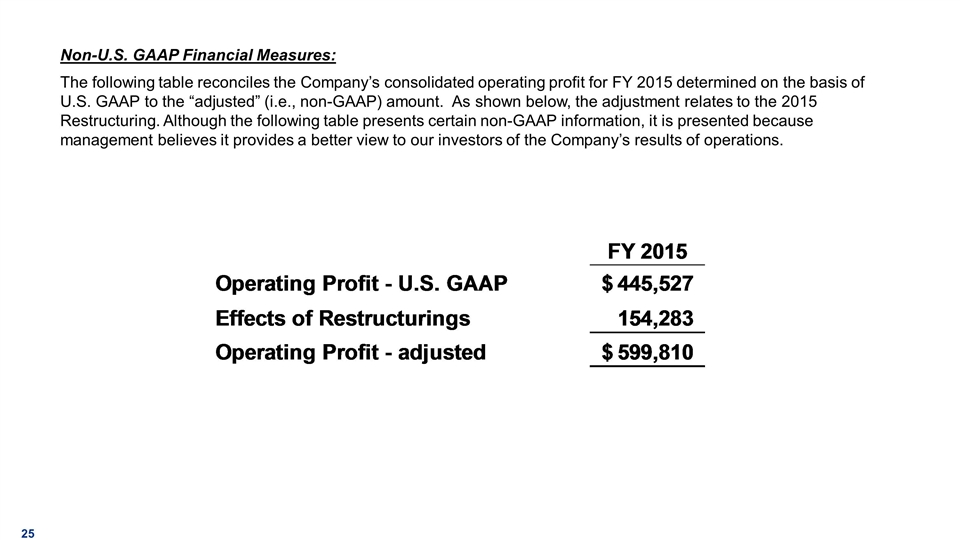
Non-U.S. GAAP Financial Measures: The following table reconciles the Company’s consolidated operating profit for FY 2015 determined on the basis of U.S. GAAP to the “adjusted” (i.e., non-GAAP) amount. As shown below, the adjustment relates to the 2015 Restructuring. Although the following table presents certain non-GAAP information, it is presented because management believes it provides a better view to our investors of the Company’s results of operations. FY 2015 Operating Profit - U.S. GAAP $,445,527 Effects of Restructurings ,154,283 Operating Profit - adjusted $,599,810 FY 2015 Operating Profit - U.S. GAAP $,445,527 Effects of Restructurings ,154,283 Operating Profit - adjusted $,599,810
Serious News for Serious Traders! Try StreetInsider.com Premium Free!
You May Also Be Interested In
- New Report Documents Lower Suicidal Ideation, Suicidal Planning, and Attempts on College Campuses Implementing The Jed Foundation’s Comprehensive Mental Health Approach
- OPTIZMO™ Releases 2023 Email Opt-Out Infographic
- 22nd Century Group Regains Compliance with NASDAQ Minimum Bid Price Rule
Create E-mail Alert Related Categories
SEC FilingsSign up for StreetInsider Free!
Receive full access to all new and archived articles, unlimited portfolio tracking, e-mail alerts, custom newswires and RSS feeds - and more!


 Tweet
Tweet Share
Share