Form 8-K Invesco Mortgage Capital For: Nov 18
UNITED STATES
SECURITIES AND EXCHANGE COMMISSION
Washington, D.C. 20549
�
FORM 8-K
�
CURRENT REPORT
Pursuant to Section�13 OR 15(d) of The Securities Exchange Act of 1934
Date of Report (Date of earliest event reported):�November�18, 2014
�

(Exact name of registrant as specified in its charter)
�
�
Maryland | 001-34385 | �26-2749336 | ||
(State�or�other�jurisdiction of�incorporation) | (Commission�File�Number) | (IRS�Employer Identification�No.) | ||
�
1555 Peachtree Street, NE, Atlanta, Georgia | 30309 | |
(Address�of�principal�executive�offices) | (Zip�Code) | |
Registrants telephone number, including area code: (404)�892-0896
n/a
(Former name or former address, if changed since last report.)
�
Check the appropriate box below if the Form 8-K filing is intended to simultaneously satisfy the filing obligation of the registrant under any of the following provisions (see General Instruction A.2. below):
�
o | Written�communications pursuant to Rule 425 under the Securities Act (17 CFR 230.425) |
�
o | Soliciting�material pursuant to Rule 14a-12 under the Exchange Act (17 CFR 240.14a-12) |
�
o | Pre-commencement�communications pursuant to Rule 14d-2(b) under the Exchange Act (17 CFR 240.14d-2(b)) |
�
o | Pre-commencement�communications pursuant to Rule 13e-4(c) under the Exchange Act (17 CFR 240.13e-4(c)) |
�
Item�7.01 | Regulation FD Disclosure. |
A presentation that will be given at the Credit Suisse Mortgage REIT and Specialty Finance Conference providing a business overview of Invesco Mortgage Capital Inc. is attached hereto as Exhibit 99.1 and is incorporated herein by reference.
The information in this Current Report, including Exhibit 99.1 attached hereto, is furnished pursuant to Item 7.01 of Form 8-K and shall not be deemed to be
filed
for any other purpose, including for purposes of Section 18 of the Securities Exchange Act of 1934, as amended, or otherwise subject to the liabilities of that Section. The information in Item 7.01 of this Current Report, including Exhibit 99.1, shall not be deemed incorporated by reference into any filing of the registrant under the Securities Act of 1933 or the Exchange Act, whether made before or after the date hereof, regardless of any general incorporation language in such filings (unless the registrant specifically states that the information or exhibit in this Item 7.01 is incorporated by reference).
Item�9.01 | Financial Statements and Exhibits. |
�
(d) | Exhibits. | |
�
Exhibit�No. | Description | |
99.1 | Presentation for Credit Suisse Mortgage REIT and Specialty Finance Conference | |
SIGNATURES
�
Pursuant to the requirements of the Securities Exchange Act of 1934, the registrant has duly caused this report to be signed on its behalf by the undersigned hereunto duly authorized.
�
Invesco Mortgage Capital Inc.
By: /s/ Richard Lee Phegley, Jr.
Richard Lee Phegley, Jr.
Chief Financial Officer
Date: November�18, 2014
�
Exhibit Index
�
Exhibit�No. | Description | |
99.1 | Presentation for Credit Suisse Mortgage REIT and Specialty Finance Conference | |

Invesco Mortgage Capital Inc. Credit Suisse Mortgage REIT and Specialty Finance Conference November 19, 2014 Richard King President & Chief Executive Officer John Anzalone Chief Investment Officer
�
Forward-looking statements This presentation, and comments made in the associated conference call today, may include
forward-looking statements
within the meaning of the U.S. securities laws as defined in the Private Securities Litigation Reform Act of 1995, and such statements are intended to be covered by the safe harbor provided by the same. Forward-looking statements include our views on the risk positioning of our portfolio, domestic and global market conditions (including the residential and commercial real estate market), the market for our target assets, mortgage reform programs, the positioning of our portfolio to meet current or future economic conditions, our core earnings, our views on the change in our book value and our views on comprehensive income, economic return, our ability to continue performance trends, the stability of portfolio yields, our views on interest rates, credit spreads, prepayment trends, financing sources , cost of funds, our views on leverage and equity allocation. In addition, words such as
believes,
expects,
anticipates,
intends,
plans,
estimates,
projects,
forecasts,
and future or conditional verbs such as
will,
may,
could,
should,
and
would
as well as any other statement that necessarily depends on future events, are intended to identify forward-looking statements. Forward-looking statements are not guarantees, and they involve risks, uncertainties and assumptions. There can be no assurance that actual results will not differ materially from our expectations. We caution investors not to rely unduly on any forward-looking statements and urge you to carefully consider the risks identified under the captions
Risk Factors,
Forward-Looking Statements
and
Managements Discussion and Analysis of Financial Condition and Results of Operations
in our annual report on Form 10-K and quarterly reports on Form 10-Q, which are available on the Securities and Exchange Commissions website at www.sec.gov. All written or oral forward-looking statements that we make, or that are attributable to us, are expressly qualified by this cautionary notice. We expressly disclaim any obligation to update the information in any public disclosure if any forward-looking statement later turns out to be inaccurate. All charts and tables sourced from Invesco Mortgage Capital as of 9/30/14 unless otherwise stated. This presentation is for informational purposes only and is not an offer to buy or sell any financial instrument. 2
�

Overview 3 Financial Metrics � Q3 YTD Dividend $1.50 � Q3 YTD Core Earnings $1.41 2014 Quarterly Average $0.47 � Book Value $19.16 2014 YTD Change $1.19 � Comprehensive Income Q3: ($0.11) Q3 YTD: $2.68 � Economic Return Q3: (0.71%) Q3 YTD: 14.97% (1) Core EPS is a non-GAAP financial measure. See slide 11 for non-GAAP reconciliation (2) Comprehensive income attributable to common shareholders (3) Economic return is defined as the change in book value per diluted share, as of the applicable period end, plus dividends declared per share in the period, divided by the book value per diluted share at the beginning of the period. (4) Includes residential loans, CRE loans, mezzanine certificates and GSE CRT (2) (3) Results � Our portfolio has generated attractive economic return on book value 14.97% Q3 YTD 20.0% over the last year 59.1% over 3 years � IVR is well positioned and differentiated Book value has shown low correlation with interest rates through active asset allocation Reduced reliance on short term repo financing Credit quality of assets is robust Positioned to benefit from expected spread tightening Selected Balance Sheet Data % of Total Porfolio Mar-13 Jun-13 Sep-13 Dec-13 Mar-14 Jun-14 Sep-14 30 Year MBS 56.1% 49.3% 44.2% 34.8% 32.8% 30.2% 23.8% Agency Hybrids/ARMs 2.6% 2.4% 5.8% 10.5% 12.4% 15.4% 15.5% Initiatives(4) 1.9% 7.3% 7.6% 9.7% 12.8% 14.1% 18.7% (1) (3) Past Performance is not a guarantee of future results
�
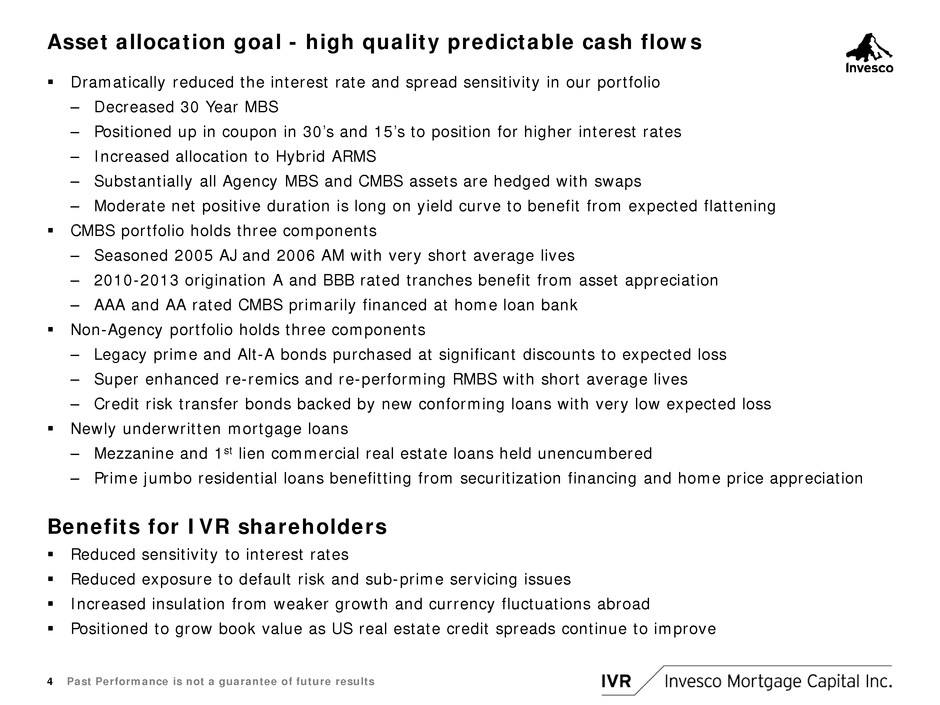
Asset allocation goal - high quality predictable cash flows 4 � Dramatically reduced the interest rate and spread sensitivity in our portfolio Decreased 30 Year MBS Positioned up in coupon in 30s and 15s to position for higher interest rates Increased allocation to Hybrid ARMS Substantially all Agency MBS and CMBS assets are hedged with swaps Moderate net positive duration is long on yield curve to benefit from expected flattening � CMBS portfolio holds three components Seasoned 2005 AJ and 2006 AM with very short average lives 2010-2013 origination A and BBB rated tranches benefit from asset appreciation AAA and AA rated CMBS primarily financed at home loan bank � Non-Agency portfolio holds three components Legacy prime and Alt-A bonds purchased at significant discounts to expected loss Super enhanced re-remics and re-performing RMBS with short average lives Credit risk transfer bonds backed by new conforming loans with very low expected loss � Newly underwritten mortgage loans Mezzanine and 1st lien commercial real estate loans held unencumbered Prime jumbo residential loans benefitting from securitization financing and home price appreciation Benefits for IVR shareholders � Reduced sensitivity to interest rates � Reduced exposure to default risk and sub-prime servicing issues � Increased insulation from weaker growth and currency fluctuations abroad � Positioned to grow book value as US real estate credit spreads continue to improve Past Performance is not a guarantee of future results
�
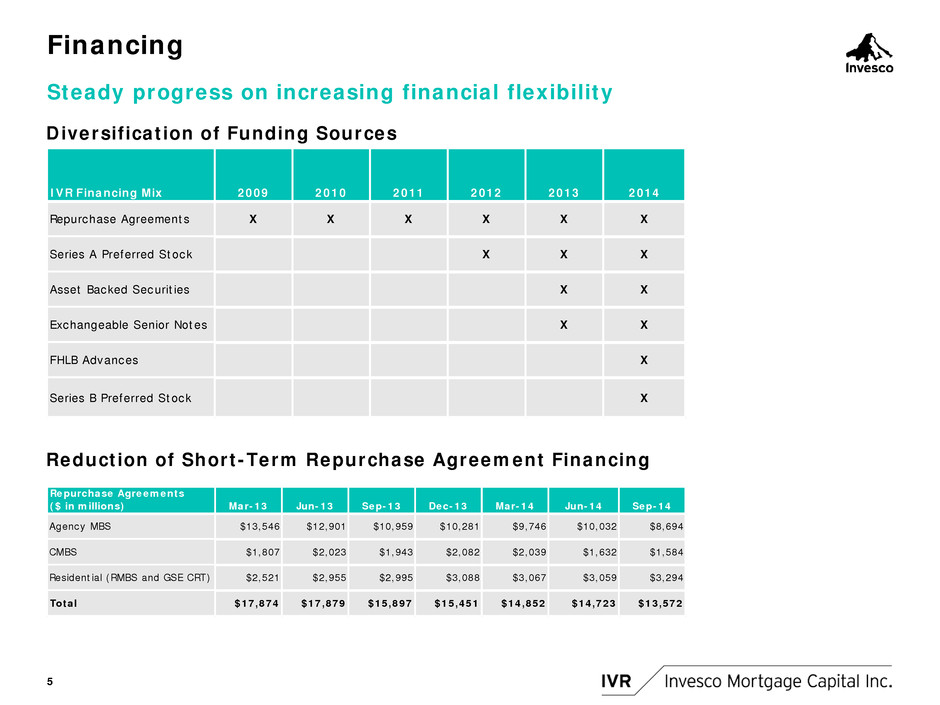
Financing 5 Steady progress on increasing financial flexibility � Diversification Diversification of Funding Sources Reduction of Short-Term Repurchase Agreement Financing IVR Financing Mix 2009 2010 2011 2012 2013 2014 Repurchase Agreements X X X X X X Series A Preferred Stock X X X Asset Backed Securities X X Exchangeable Senior Notes X X FHLB Advances X Series B Preferred Stock X Repurchase Agreements ($ in millions) Mar-13 Jun-13 Sep-13 Dec-13 Mar-14 Jun-14 Sep-14 Agency MBS $13,546 $12,901 $10,959 $10,281 $9,746 $10,032 $8,694 CMBS $1,807 $2,023 $1,943 $2,082 $2,039 $1,632 $1,584 Residential (RMBS and GSE CRT) $2,521 $2,955 $2,995 $3,088 $3,067 $3,059 $3,294 Total $17,874 $17,879 $15,897 $15,451 $14,852 $14,723 $13,572
�

Performance and Value 6 � IVR portfolio has consistently provided high economic returns in 2014 and over the past 3 years � Performance was driven by a competitive dividend and growth in book value � Book value growth was generated through strong asset selection and prudent interest rate hedging 0.00% 10.00% 20.00% 30.00% 40.00% 50.00% 60.00% 70.00% YTD 1 Year 3 Years IVR Economic Return on Book Value (*) Value in IVR " 12.3% Current Dividend Yield(1) " Portfolio performance has been favorable as shown on left " Diversified portfolio, equity allocation: " ~1/3rd Agency MBS " ~1/3rd Residential credit " ~1/3rd Commercial credit " Diversified liability / funding mix " ~74% Repurchase agreements " ~15% Securitization " ~ 7% Secured loans " ~ 2% Exchangeable notes " ~ 2% Other " We believe asset quality is high with very low expected losses, and as evidenced by no OTTI " Shares trading at ~85%(2) of book relative to industry at ~92% (3) (1) Annualized dividend of $2.00 divided by IVR closing share price on 11/13/14 of $16.26 (2) Calculated using IVR closing share price on 11/13/14 of $16.26 divided by our Q3 2014 book value of $19.16 (3) Source: Bloomberg, using closing share price on 11/13/14 and last reported book value. Past Performance is not a guarantee of future results *Economic return is defined as the change in book value per diluted share, as of applicable period-end, plus dividends declared per share in the period, divided by the book value per diluted share at the beginning of the period.
�

Portfolio Update 7 In the third quarter, we continued to migrate the portfolio away from interest rate risk and toward credit exposure � Reduced interest rate exposure Lower coupon Agency 30 Year MBS are now a small part of our portfolio The rest of our assets are either much shorter duration or have predictable cash flows which are much easier to hedge We continue to add residential loans with matched funding and they are now 15% of assets � Increased exposure to credit Higher volatility created opportunity Consolidated two additional jumbo prime securitizations in Q3 and expects to add at least two more in Q4 Notable increase in senior classes of CMBS Closed two CRE loan investments and expect to make additional CRE loan and/or joint venture investments in Q4 Past Performance is not a guarantee of future results
�
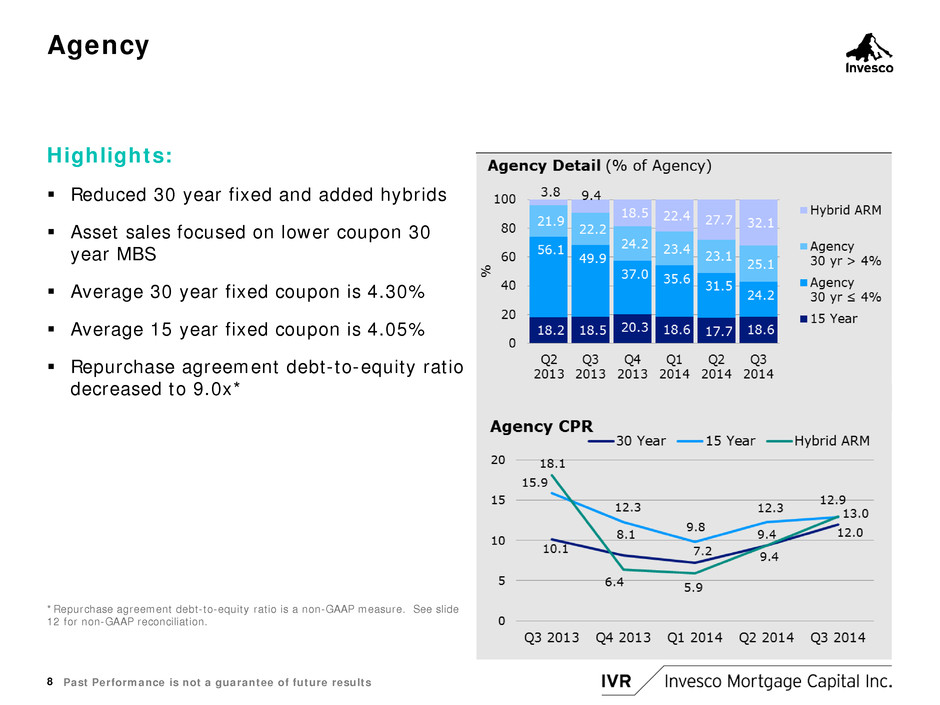
Agency 8 Highlights: � Reduced 30 year fixed and added hybrids � Asset sales focused on lower coupon 30 year MBS � Average 30 year fixed coupon is 4.30% � Average 15 year fixed coupon is 4.05% � Repurchase agreement debt-to-equity ratio decreased to 9.0x* *Repurchase agreement debt-to-equity ratio is a non-GAAP measure. See slide 12 for non-GAAP reconciliation. Past Performance is not a guarantee of future results
�

Residential Mortgage Credit 9 Developments: � Purchased additional Non-Agency RMBS, including recently issued securities collateralized by seasoned subprime and re-performing loans � Added exposure to $847M of recently originated jumbo prime loans, with two additional securitizations expected in the fourth quarter � Jumbo prime loan performance remains exceptional, with no loans 60 or more days delinquent � GSE Credit Risk Transfer investments increased by $104M, though prices declined during the quarter with new issuance coming at wider spreads Residential Loans Past Performance is not a guarantee of future results
�

Commercial Mortgage Credit Highlights: � CMBS fair value increased by $419M largely due to purchases of triple and double-A rated classes � Closed two CRE loan investments totaling $48M, including IVRs first cross-border transaction � Commercial mortgage credit (1) now comprises 39% of equity � CRE loans, mezzanine certificates and JV interests total approximately $235.4M � Commercial real estate fundamentals remain favorable � Expect moderate and opportunistic growth in CRE (1) Includes CMBS, commercial real estate loans, mezzanine certificates and commercial real estate joint ventures (2) Includes commercial real estate loans, mezzanine certificates and commercial real estate joint ventures 10
�
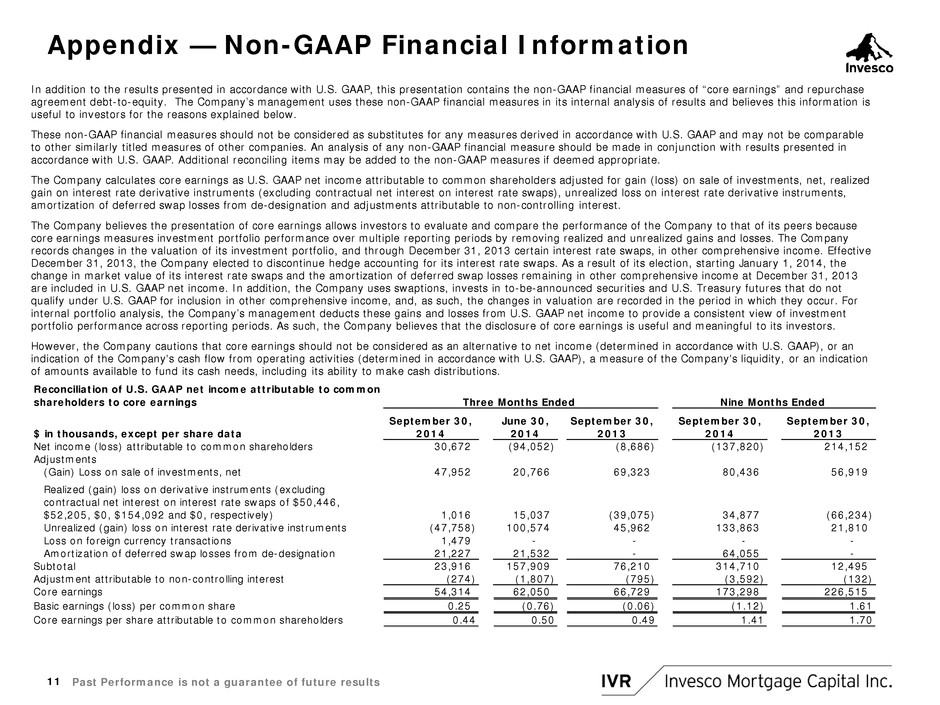
Appendix Non-GAAP Financial Information In addition to the results presented in accordance with U.S. GAAP, this presentation contains the non-GAAP financial measures of
core earnings
and repurchase agreement debt-to-equity. The Companys management uses these non-GAAP financial measures in its internal analysis of results and believes this information is useful to investors for the reasons explained below. These non-GAAP financial measures should not be considered as substitutes for any measures derived in accordance with U.S. GAAP and may not be comparable to other similarly titled measures of other companies. An analysis of any non-GAAP financial measure should be made in conjunction with results presented in accordance with U.S. GAAP. Additional reconciling items may be added to the non-GAAP measures if deemed appropriate. The Company calculates core earnings as U.S. GAAP net income attributable to common shareholders adjusted for gain (loss) on sale of investments, net, realized gain on interest rate derivative instruments (excluding contractual net interest on interest rate swaps), unrealized loss on interest rate derivative instruments, amortization of deferred swap losses from de-designation and adjustments attributable to non-controlling interest. The Company believes the presentation of core earnings allows investors to evaluate and compare the performance of the Company to that of its peers because core earnings measures investment portfolio performance over multiple reporting periods by removing realized and unrealized gains and losses. The Company records changes in the valuation of its investment portfolio, and through December 31, 2013 certain interest rate swaps, in other comprehensive income. Effective December 31, 2013, the Company elected to discontinue hedge accounting for its interest rate swaps. As a result of its election, starting January 1, 2014, the change in market value of its interest rate swaps and the amortization of deferred swap losses remaining in other comprehensive income at December 31, 2013 are included in U.S. GAAP net income. In addition, the Company uses swaptions, invests in to-be-announced securities and U.S. Treasury futures that do not qualify under U.S. GAAP for inclusion in other comprehensive income, and, as such, the changes in valuation are recorded in the period in which they occur. For internal portfolio analysis, the Companys management deducts these gains and losses from U.S. GAAP net income to provide a consistent view of investment portfolio performance across reporting periods. As such, the Company believes that the disclosure of core earnings is useful and meaningful to its investors. However, the Company cautions that core earnings should not be considered as an alternative to net income (determined in accordance with U.S. GAAP), or an indication of the Company's cash flow from operating activities (determined in accordance with U.S. GAAP), a measure of the Company's liquidity, or an indication of amounts available to fund its cash needs, including its ability to make cash distributions. 11 Reconciliation of U.S. GAAP net income attributable to common shareholders to core earnings $ in thousands, except per share data September 30, 2014 June 30, 2014 September 30, 2013 September 30, 2014 September 30, 2013 Net income (loss) attributable to common shareholders 30,672 (94,052) (8,686) (137,820) 214,152 Adjustments (Gain) Loss on sale of investments, net 47,952 20,766 69,323 80,436 56,919 Realized (gain) loss on derivative instruments (excluding contractual net interest on interest rate swaps of $50,446, $52,205, $0, $154,092 and $0, respectively) 1,016 15,037 (39,075) 34,877 (66,234) Unrealized (gain) loss on interest rate derivative instruments (47,758) 100,574 45,962 133,863 21,810 Loss on foreign currency transactions 1,479 - - - - Amortization of deferred swap losses from de-designation 21,227 21,532 - 64,055 - Subtotal 23,916 157,909 76,210 314,710 12,495 Adjustment attributable to non-controlling interest (274) (1,807) (795) (3,592) (132) Core earnings 54,314 62,050 66,729 173,298 226,515 Basic earnings (loss) per common share 0.25 (0.76) (0.06) (1.12) 1.61 Core earnings per share attributable to common shareholders 0.44 0.50 0.49 1.41 1.70 Three Months Ended Nine Months Ended Past Performance is not a guarantee of future results
�

Appendix Non-GAAP Financial Information Reconciliation of Total Debt-to Equity to Repurchase Agreement Debt-to-Equity Ratio 12 Past Performance is not a guarantee of future results Equity Allocation As of September 30, 2014 $ in thousands Agency GSE CRT Non-Agency CMBS CRE Consolidated VIE (4) Other Elimination (5) Total Investments 9,928,017 610,326 3,658,398 3,456,610 144,707 3,103,434 42,281 (356,317) 20,587,456 Cash and cash equivalents (1) 50,950 6,676 33,632 37,686 - - - - 128,944 Derivative instruments, at fair value (2) 72,872 - 469 - 1,080 - - - 74,421 Other assets 105,282 507 30,285 68,036 837 14,788 10,251 (1,744) 228,242 Total Assets 10,157,121 617,509 3,722,784 3,562,332 146,624 3,118,222 52,532 (358,061) 21,019,063 Repurchase agreements 8,693,555 463,828 2,830,368 1,584,138 - - - - 13,571,889 Secured loan (3) 149,526 - - 1,100,474 - - - - 1,250,000 Asset-backed securities issued - - - - - 3,102,257 - (356,317) 2,745,940 Exchangeable Senior Note - - - - - - 400,000 - 400,000 Derivative liability, at fair value 222,559 - - - - - - - 222,559 Other liabilities 86,747 4,629 24,599 23,365 - 9,973 705 (1,744) 148,274 Total liabilities 9,152,387 468,457 2,854,967 2,707,977 - 3,112,230 400,705 (358,061) 18,338,662 Allocated Equity 1,004,734 149,052 867,817 854,355 146,624 5,992 (348,173) - 2,680,401 Less equity associated with secured loans: Collateral pledged (184,197) - - (1,355,651) - - - - (1,539,848) Secured loans 149,526 - - 1,100,474 - - - - 1,250,000 Net Equity (excluding secured loans) 970,063 149,052 867,817 599,178 N/A N/A N/A - 2,586,110 Total Debt-to-Equity 8.8 3.1 3.3 3.1 - N/A N/A N/A 6.7 Repurchase Agreement Debt-to-Equity Ratio 9.0 3.1 3.3 2.6 N/A N/A N/A N/A 5.2 (1) Cash and cash equivalents is allocated based on a percentage of equity for Agency, GSE CRT, Non-Agency and CMBS. (2) Derivative instruments are allocated based on the hedging strategy for each asset class (3) Secured loans are allocated based on amount of collateral pledged (4) Represents VIE assets and liabilities before intercompany eliminations. VIEs are securitized entities with no substantive equity at risk. (5) Represents company's ownership of asset-backed securities and accrued interest eliminated upon consolidation
�
Serious News for Serious Traders! Try StreetInsider.com Premium Free!
You May Also Be Interested In
- ContextLogic Completes Sale of Substantially All Operating Assets and Liabilities Associated with Wish to Qoo10
- ROSEN, TRUSTED INVESTOR COUNSEL, Encourages Autodesk, Inc. Investors to Inquire About Securities Class Action Investigation – ADSK
- FluroTech and GS Heli Announce Execution of Definitive Agreement
Create E-mail Alert Related Categories
SEC FilingsSign up for StreetInsider Free!
Receive full access to all new and archived articles, unlimited portfolio tracking, e-mail alerts, custom newswires and RSS feeds - and more!


 Tweet
Tweet Share
Share