

Form 8-K Hillenbrand, Inc. For: Sep 13
 Tweet
Tweet Share
Share
UNITED STATES
SECURITIES AND EXCHANGE COMMISSION
Washington, D.C. 20549
FORM 8-K
CURRENT REPORT
Pursuant to Section 13 or 15(d) of the Securities Exchange Act of 1934
Date of Report (Date of earliest event reported): September 13, 2016
HILLENBRAND, INC.
(Exact Name of Registrant as Specified in Charter)
|
Indiana |
|
1-33794 |
|
26-1342272 |
|
(State or Other Jurisdiction of |
|
(Commission File Number) |
|
(IRS Employer Identification No.) |
|
One Batesville Boulevard |
|
47006 |
|
(Address of Principal Executive Office) |
|
(Zip Code) |
Registrant’s telephone number, including area code: (812) 934-7500
Not Applicable
(Former Name or Former Address, if Changed Since Last Report)
Check the appropriate box below if the Form 8-K filing is intended to simultaneously satisfy the filing obligation of the registrant under any of the following provisions:
o Written communications pursuant to Rule 425 under the Securities Act (17 CFR 230.425)
o Soliciting material pursuant to Rule 14a-12 under the Exchange Act (17 CFR 240.14a-12)
o Pre-commencement communications pursuant to Rule 14d-2(b) under the Exchange Act (17 CFR 240.14d-2(b))
o Pre-commencement communications pursuant to Rule 13e-4(c) under the Exchange Act (17 CFR 240.13e-4(c))
Item 7.01 Regulation FD Disclosure
A copy of presentation slides to be used by Hillenbrand, Inc. (the “Company”) in investor presentations beginning September 13, 2016, is attached as Exhibit 99.1 to this Current Report on Form 8-K. These presentation slides are also available on the Company’s website under “Investor Relations” at www.hillenbrand.com.
The information furnished pursuant to this Item 7.01, including Exhibit 99.1, shall not be deemed “filed” for purposes of Section 18 of the Securities Exchange Act of 1934 (“Exchange Act”) or otherwise subject to the liabilities under that Section and shall not be deemed to be incorporated by reference into any filing of the Company under the Securities Act of 1933 or the Exchange Act, except as shall be expressly set forth by specific reference in such filing.
Non-GAAP Financial Measures
In addition to financial measures prepared in accordance with accounting principles generally accepted in the U.S. (GAAP), we also provide non-GAAP operating performance measures. These non-GAAP measures are referred to as “adjusted” and exclude expenses associated with backlog amortization, inventory step-up, business acquisition and integration, restructuring, and antitrust litigation. The related income tax for all of these items is also excluded. This non-GAAP information is provided as a supplement, not as a substitute for, or as superior to, measures of financial performance prepared in accordance with GAAP.
One important non-GAAP measure that we use is Adjusted Earnings Before Interest, Income Tax, Depreciation, and Amortization (“Adjusted EBITDA”). As previously discussed, a part of our strategy is to selectively acquire companies that we believe can benefit from our core competencies to spur faster and more profitable growth. Given that strategy, it is a natural consequence to incur related expenses, such as amortization from acquired intangible assets and additional interest expense from debt-funded acquisitions. Accordingly, we use Adjusted EBITDA, among other measures, to monitor our business performance.
Another important non-GAAP measure that we use is backlog. Backlog is not a term recognized under GAAP; however, it is a common measurement used in the Process Equipment Group industry. Our backlog represents the amount of consolidated revenue that we expect to realize on contracts awarded related to the Process Equipment Group. Backlog includes expected revenue from large systems, equipment, and to a lesser extent, replacement parts, components, and service.
We use this non-GAAP information internally to make operating decisions and believe it is helpful to investors because it allows more meaningful period-to-period comparisons of our ongoing operating results. The information can also be used to perform trend analysis and to better identify operating trends that may otherwise be masked or distorted by these types of items. Finally, the Company believes such information provides a higher degree of transparency.
Item 9.01 Financial Statements and Exhibits.
(d) Exhibits
|
Exhibit |
|
|
|
Number |
|
Description |
|
99.1 |
|
Presentation Slides |
Disclosure Regarding Forward-Looking Statements
Throughout this presentation, we make a number of “forward-looking statements” within the meaning of the Private Securities Litigation Reform Act of 1995. As the words imply, these are statements about future plans, objectives, beliefs, and expectations that might or might not happen in the future, as contrasted with historical information. Forward-looking statements are based on assumptions that we believe are reasonable, but by their very nature are subject to a wide range of risks.
Accordingly, in this presentation, we may say something like,
“We expect that future revenue associated with the Process Equipment Group will be influenced by order backlog.”
That is a forward-looking statement, as indicated by the word “expect” and by the clear meaning of the sentence.
Words that could indicate we are making forward-looking statements include:
|
expect |
believe |
plan |
expect |
may |
goal |
would |
|
|
|
|
|
|
|
|
|
intend |
pursue |
estimate |
will |
forecast |
continue |
could |
|
|
|
|
|
|
|
|
|
become |
encourage |
promise |
improve |
progress |
potential |
should |
|
|
|
|
|
|
|
|
|
targeted |
|
|
|
|
|
|
This is not an exhaustive list, but is intended to give you an idea of how we try to identify forward-looking statements. The absence of any of these words, however, does not mean that the statement is not forward-looking.
Here is the key point: Forward-looking statements are not guarantees of future performance, and actual results could differ materially from those set forth in any forward-looking statements.
Any number of factors, many of which are beyond our control, could cause results to differ significantly from what is described in the forward-looking statements. For a discussion of factors that could cause actual results to differ from those contained in forward-looking statements, see the discussions under the heading “Risk Factors” in Item 1A of Part I of the Company’s Form 10-K filed with the SEC on November 18, 2015. We assume no obligation to update or revise any forward-looking statements.
SIGNATURES
Pursuant to the requirements of the Securities Exchange Act of 1934, the registrant has duly caused this report to be signed on its behalf by the undersigned hereunto duly authorized.
|
|
HILLENBRAND, INC. | |
|
|
|
|
|
|
|
|
|
DATE: September 13, 2016 |
BY: |
/S/ Nicholas R. Farrell |
|
|
|
Nicholas R. Farrell |
|
|
|
Vice President, |
|
|
|
General Counsel and Secretary |
Exhibit 99.1
CL King Best Ideas Conference September 13, 2016

Forward-Looking Statements and Factors That May Affect Future Results: Throughout this presentation, we make a number of “forward-looking statements” within the meaning of the Private Securities Litigation Reform Act of 1995. As the words imply, these are statements about future plans, objectives, beliefs, and expectations that might or might not happen in the future, as contrasted with historical information. Forward-looking statements are based on assumptions that we believe are reasonable, but by their very nature are subject to a wide range of risks. Accordingly, in this presentation, we may say something like, “We expect that future revenue associated with the Process Equipment Group will be influenced by order backlog.” That is a forward-looking statement, as indicated by the word “expect” and by the clear meaning of the sentence. Other words that could indicate we are making forward-looking statements include: This is not an exhaustive list, but is intended to give you an idea of how we try to identify forward-looking statements. The absence of any of these words, however, does not mean that the statement is not forward-looking. Here is the key point: Forward-looking statements are not guarantees of future performance, and our actual results could differ materially from those set forth in any forward-looking statements. Any number of factors, many of which are beyond our control, could cause our performance to differ significantly from what is described in the forward-looking statements. For a discussion of factors that could cause actual results to differ from those contained in forward-looking statements, see the discussions under the heading “Risk Factors” in Item 1A of Part I of our Form 10-K for the period ended September 30, 2015, located on our website and filed with the SEC. We assume no obligation to update or revise any forward-looking statements. Safe Harbor Disclosure regarding forward-looking statements intend believe plan expect may goal would become pursue estimate will forecast continue could targeted encourage promise improve progress potential should 2
Joe Raver President and CEO Company & Strategy Overview
Hillenbrand Began As A Death Care Company And Has Diversified Through Acquisitions PEG businesses design, develop, manufacture and service highly engineered industrial equipment around the world PEG is a leading global provider of compounding and extrusion equipment, flow control, bulk solids material handling equipment and systems for a wide variety of manufacturing and other industrial processes. PEG serves customers through its operating companies. Founded in 1906 and dedicated for more than 100 years to helping families honor the lives of those they love® North American leader in death care with a history of manufacturing excellence, product innovation, superior customer service, and reliable delivery 2007 2008 2010 Hillenbrand, Inc. (parent of Batesville Casket Company) begins operation April 1, 2008 K-Tron Acquisition (includes TerraSource) April 1, 2010 Batesville Process Equipment Group (PEG) 2011 Rotex acquisition September 1, 2011 2012 2013 2015 K-Tron merges with Coperion 2016 Red Valve acquisition February 1, 2016 ABEL Pumps acquisition October 2, 2015 Hillenbrand Industries approves the separation of Hill-Rom and Batesville Casket into two independent publicly traded companies Coperion acquisition December 1, 2012 4
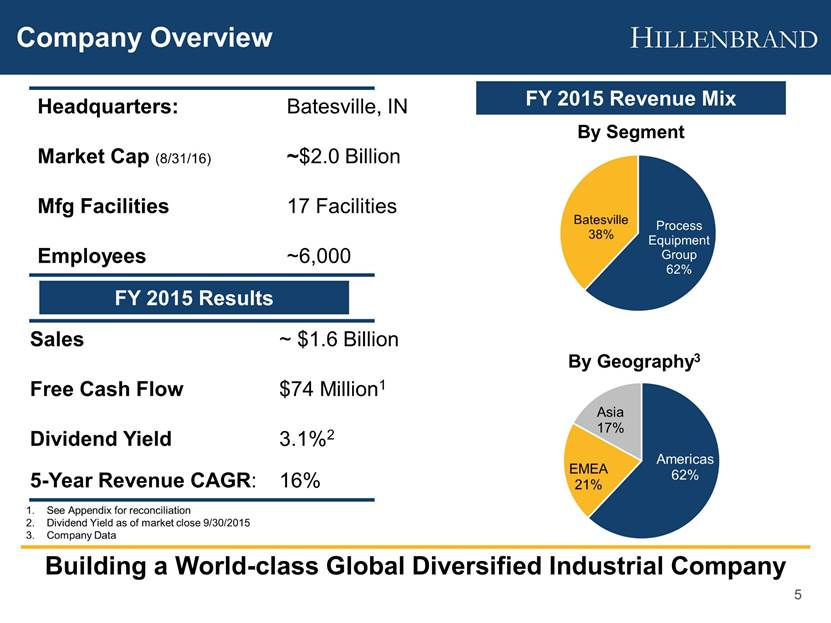
Sales ~ $1.6 Billion Free Cash Flow $74 Million1 Dividend Yield 3.1%2 5-Year Revenue CAGR: 16% Headquarters: Batesville, IN Market Cap (8/31/16) ~$2.0 Billion Mfg Facilities 17 Facilities Employees ~6,000 Building a World-class Global Diversified Industrial Company FY 2015 Revenue Mix See Appendix for reconciliation Dividend Yield as of market close 9/30/2015 Company Data Company Overview 5 FY 2015 Results Process Equipment Group 62% Batesville 38% By Segment Americas 62% EMEA 21% Asia 17% By Geography 3
1 Develop Hillenbrand into a world-class global diversified industrial company Become a recognized market leader in the diversified industrial space Accelerate transformation through M&A 2 Leverage our strong financial foundation and the Hillenbrand Operating Model Deliver sustainable profit growth and FCF Drive operational efficiencies 3 Reinvest our cash in new growth initiatives, both organic and inorganic that create shareholder value Leverage strength of existing businesses to expand in attractive end markets Acquire market leading brands with strong recurring revenue Clear Trajectory and Path to Achieve Vision Strategic Vision 6
7 Transformation Strategy Is Founded On Commitment To Profitable Growth Growth Adj. EBITDA Margin Process Equipment Group: Grow via implementation of HOM and disciplined M&A Batesville: Maintain market leadership position and use strong free cash flow to grow PEG 10% Mid-twenties Mid-teens Batesville PEG
Hillenbrand Operating Model Consistent and repeatable framework designed to produce sustainable and predictable results Defines how Hillenbrand runs the business and focuses on three key steps: Understand the business Focus on the critical few Grow to get bigger and better Driving profitable growth and superior value The Hillenbrand Operating Model Drives Our Transformation 8
Process Equipment Group (PEG)
Highly-engineered, mission critical, niche products that are differentiated through applications expertise and drive value for customers Stable recurring revenue and attractive margins from parts & service Balanced geographic diversification Highly diversified customer base with a strong history of long-term relationships with blue-chip customers Favorable long-term mega trends Rapidly expanding middle class Growing global population Rising demand for plastics, food, and energy PEG Overview 10 1. FY 2015 Company Data Americas 39% EMEA 34% Asia 27% Revenue by Geography 1 Machines 65% Parts & Service 35% Revenue by Product Mix 1
Expect mid-single digit organic revenue growth Adj. EBITDA1 expected to grow an average rate of 100 bps per year Financial Track Record Expected To Continue Initiatives to expand margins resulted in adj. EBITDA1 growth of 370 bps from FY13 to FY15 Product mix improvement Parts & service business growth Strategic pricing initiatives Continued implementation of Lean 1. See Appendix for reconciliation 11 $1.2 - $1.3 $246 $376 $933 $1,075 $993 0% 5% 10% 15% 20% 25% $0 $200 $400 $600 $800 $1,000 $1,200 FY 11 FY 12 FY 13 FY 14 FY 15 Revenue & Adj EBITDA 1 Margin ( Millions ) Revenue Adj. EBITDA Margin $1.0 FY15 FY20 PEG Revenue (Billions)
12 Focus on niche, high-growth markets Leverage scope and scale to accelerate global growth Expand recurring revenue in our operating companies Achieve margin expansion through the implementation of the Hillenbrand Operating Model PEG Strategic Focus Focused On Organic and Inorganic Growth Other: Forest Products, Grains, Oil Seed, Pharma 1. FY 2015 Company Data PEG Strategy 13% 3% 5% 9% 13% 57% Other Water/Wastewater Processed Food Chemicals Minerals and Mining Plastics End Market Diversification 1
World-Class Industrial Brands Pumping solutions Service and parts Compounders and extruders Materials handling equipment Feeders and components System solutions Service and parts Highly engineered valves Recurring revenue 13 Crushers Materials handling equipment Service and parts Separating equipment Sizing equipment Service and parts
14 Most Recent Acquisitions – Expected To Be Accretive In 2016 Purchase price: €95 million Revenue: €32 million1 EBITDA: €8 million1 Purchase price: $132 million Revenue: $39 million2 EBITDA: $12 million2 Financials All-cash transactions funded under Hillenbrand’s $700 million credit revolver Funding Highly profitable businesses with a low asset base that generate significant cash Both are expected to be accretive to earnings in 2016, net of transition costs Financial Impact 1. TTM ended 9/30/15 2. TTM ended 11/30/15; EBITDA adjusted to exclude $1.9m of non-recurring expense ABEL – 10/2/15 Red Valve – 2/1/16 Strategic Fit ABEL and Red Valve are part of the Process Equipment Group Provide highly engineered equipment for niche markets Robust parts & service and aftermarket recurring revenue Provide entry into the flow control space Integration Update Integration going well and businesses are performing as expected To date: Have fully integrated back offices and made significant strides to implement HOM, including operational integration Consolidated one manufacturing facility in the US
15 Flow control is a sizable market with attractive long-term growth potential and high profit margins Expansion In Flow Control Advances Our Transformation Sizable market with a long-term growth rate greater than global GDP and our other current markets Fragmented niche spaces with opportunity to achieve EBITDA margins greater than 20% Highly engineered/differentiated products that serve critical applications such as viscous, abrasive and corrosive fluids in the Water & Wastewater, Energy, Chemical, and General Industrial markets Opportunity to build on strong product, end market and geographic core Installed base that supports a strong aftermarket program
Batesville

Iconic brand with 100+ years of history Superior mix of products Industry leader in volume, revenue and profitability1 FY 2015 Revenue: $604M Batesville Is The Market Leader Of The North American Burial Casket Market 17 1. Source: Internal estimates, industry reports and public filings for FY 2015 * Cremation Options®, Technology Solutions and Northstar Caskets 87% Other* 13% Batesville Revenue Mix by Product Caskets 48% Markers 22% Vaults 20% Cremation 10% $2.6 Billion North American Death Care Industry 1
18 Batesville Strategy Build and deliver value propositions aligned to customer needs Provide merchandising and consultative selling Develop new products Cremation Options® products: caskets, containers and urns Technology solutions: websites and business management software Operational excellence through Hillenbrand Operating Model Lean manufacturing and distribution Continuous improvement in all business processes Optimize the profitable casket business Capitalize on growth opportunities Maintain attractive margins
North American cremation rate is estimated at ~49% and increasing ~120-140 bps per year2 Increase in future deaths driven by aging baby boomers expected to be offset by cremation, resulting in flat to slightly declining burial market Attractive Financial Fundamentals Expected To Continue Historically high Return On Invested Capital (ROIC) Historically strong Adj. EBITDA margins Relentless focus on Lean to maintain attractive margins See Appendix for reconciliation Source: CDC, Cremation Assn. North America, Company estimates Cremation Association of North America data 19 Death Trends3 $638 $607 $621 $592 $604 0% 5% 10% 15% 20% 25% 30% 35% $200 $300 $400 $500 $600 $700 FY 11 FY 12 FY 13 FY 14 FY 15 Revenue & Adj EBITDA 1 Margin (Millions) Revenue Adj. EBITDA Margin 0 1,000 2,000 3,000 '10 '15 '20 '25 '30 Thousands # Burials # Cremations Total Deaths
Financial Results

Consolidated Financial Performance Q3 2016 Key Points Revenue declined 7% to $371 million driven primarily by lower volume in the Process Equipment Group GAAP net income was relatively flat, adjusted EBITDA of $67 million increased 1% or 150 basis points on the strength of gross profit The balance sheet remains healthy, and we delivered another strong cash flow performance in the third quarter 21 Net income attributable to Hillenbrand See appendix for reconciliation Revenue Adj. EBITDA2 PEG 62% 55% Batesville 38% 45% $0.50 GAAP EPS $0.48 GAAP EPS $32 $31 Q3 2015 Q3 2016 Net Income 1 (Millions) Adj. EPS $0.52 Adj. EPS $0.53 Q3 2015 Q3 2016 GAAP & Adj . EPS 2 $65 $103 Q3 2015 Q3 2016 Operating Cash Flow (Millions)
Segment Performance – Q3 2016 22 Process Equipment Group Batesville Revenue down 9% compared to prior year, primarily due to decreased demand for capital equipment, partially offset by revenue from the acquisitions of ABEL and Red Valve Adjusted EBITDA margin1 improved 90 bps driven by pricing, productivity improvements, product and business mix, and impact of acquisitions Revenue of $140 million was down 3% due to a decrease in burial unit volume associated with an estimated increase in the cremation rate Adjusted EBITDA margin1 improved 250 bps due to supply chain productivity improvements, lower commodities prices, and restructuring initiatives 1. See appendix for reconciliation
Consolidated Financial Performance Q3 YTD 2016 – Nine Months Ended 6/30/16 Key Points Revenue of $1,110 million decreased 8% GAAP Net Income1 of $77 million decreased 17% compared to prior year Adjusted EPS2 of $1.43 per diluted share was down 5% compared to prior year Operating cash flow increased $114 million compared to prior year 23 FY 2016 Revenue Adj. EBITDA2 PEG 61% 50% Batesville 39% 50% 1. Net income attributable to Hillenbrand 2. See appendix for reconciliation $1.44 GAAP EPS $1.21 GAAP EPS Adj. EPS $1.50 Adj. EPS $1.43 YTD 2015 YTD 2016 GAAP & Adj . EPS 2 $76 $190 YTD 2015 YTD 2016 Operating Cash Flow (Millions) $92 $77 YTD 2015 YTD 2016 Net Income 1 (Millions)
Segment Performance Q3 YTD 2016 – Nine Months Ended 6/30/16 24 Process Equipment Group Batesville Revenue was down 9% due to lower volume of large systems for the plastics industry and ongoing weakness in demand for proppants processing and power & mining; currency headwinds accounted for 2% of the decrease. Inorganic growth partially offset the decline. Adjusted EBITDA margin1 improved 60 bps driven by pricing, productivity improvements, improved product and business mix, and the acquisition of ABEL and Red Valve Revenue of $429 million declined 5% compared to prior year due to lower volume associated with fewer deaths and an increase in the rate at which families chose cremation Adjusted EBITDA margin1 increased 150 bps compared to prior year due to improved efficiencies across the supply chain, and lower commodities and fuel costs 1. See appendix for reconciliation
History of Strong Financial Performance 25 Net income attributable to Hillenbrand Net Debt is Total Debt less Cash $0.9 $1.0 $1.6 $1.7 $1.6 FY 11 FY 12 FY 13 FY 14 FY 15 Revenue (Billions) $106 $105 $63 $110 $111 FY 11 FY 12 FY 13 FY 14 FY 15 Net Income 1 (Millions) $316 $251 $622 $501 $480 FY 11 FY 12 FY 13 FY 14 FY 15 Net Debt 2 (Millions) $130 $138 $127 $180 $105 $60 FY 11 FY 12 FY 13 FY 14 FY 15 Operating Cash Flow (Millions) Base Operating CF Forethought
26 Through Growth And Returning Cash To Shareholders Hillenbrand’s Capital Allocation Strategy Focuses On Creating Shareholder Value Capital Allocation Strategy Reinvestment in our organic businesses – CAPEX <2% of revenue Return cash to shareholders – Share repurchases and dividends - ~50% of FCF Remaining ~50% to be deployed towards acquisitions and maintaining leverage targets Annual $0.01 increase per share per year (7 consecutive years) $0.80 per share in 2015 (39% payout ratio) Attractive dividend yield: 2.5% (8/31/16) Drive Long-Term Growth Pay A Meaningful Dividend
Add-on Adjacency New Platform Same Product, Technologies, End Markets Size of Opportunities1 Magnitude of Synergies Likely Deal Source Similar Different Small (<$75M) Medium ($50-200M) Large (>$200M) Minimal Medium High Internal Internal/External External Acquisition Focus 27 1. Size indications are general estimates only and actual deal size in any category could differ based on circumstances
28 Strong cash generation allows Hillenbrand to continue our acquisition strategy while paying down debt Cash Generation Strengthens Financial Flexibility Includes $10M reserved for outstanding Letters of Credit As of 6/30/16 Total Debt $637M Net Debt1 $589M Net Debt/TTM Adj EBITDA2 2.2x Net Debt is Total Debt less Cash See Appendix for reconciliation As of 6/30/16 $700 $249 $164 $233 $467 Senior Unsecured Notes Term Loan Revolving Credit Facility Financing Agreements 3 (Millions) Drawn Maximum Available Capacity
Attractive Investment Opportunity Growth Opportunity We expect Process Equipment Group to represent more than 2/3 of Hillenbrand revenue with organic mid-single-digit growth Bottom-line growth enhanced by leveraging core competencies Strong Financial Profile Market leading platforms with robust cash generation Strong balance sheet and cash flow Proven Track Record Demonstrated acquisition success Proven, results-oriented management teams Hillenbrand Operating Model drives sustainable and predictable results Compelling Dividend Meaningful return of cash to shareholders, including an attractive dividend yield Annual dividend increases since HI inception (2008) 29
Appendix

Disclosure Regarding non-GAAP Measures While we report financial results in accordance with accounting principles generally accepted in the United States (GAAP), we also provide certain non-GAAP operating performance measures. These non-GAAP measures are referred to as “adjusted” and exclude expenses associated with backlog amortization, inventory step-up, business acquisition and integration, restructuring, and antitrust litigation. The related income tax for all of these items is also excluded. This non-GAAP information is provided as a supplement, not as a substitute for, or as superior to, measures of financial performance prepared in accordance with GAAP. One important non-GAAP measure that we use is Adjusted Earnings Before Interest, Income Tax, Depreciation, and Amortization (“Adjusted EBITDA”). As previously discussed, a part of our strategy is to selectively acquire companies that we believe can benefit from our core competencies to spur faster and more profitable growth. Given that strategy, it is a natural consequence to incur related expenses, such as amortization from acquired intangible assets and additional interest expense from debt-funded acquisitions. Accordingly, we use Adjusted EBITDA, among other measures, to monitor our business performance. Another important non-GAAP measure that we use is backlog. Backlog is not a term recognized under GAAP; however, it is a common measurement used in the Process Equipment Group industry. Our backlog represents the amount of consolidated revenue that we expect to realize on contracts awarded related to the Process Equipment Group. Backlog includes expected revenue from large systems, equipment, and to a lesser extent, replacement parts, components, and service. We use this non-GAAP information internally to make operating decisions and believe it is helpful to investors because it allows more meaningful period-to-period comparisons of our ongoing operating results. The information can also be used to perform trend analysis and to better identify operating trends that may otherwise be masked or distorted by these types of items. Finally, the Company believes such information provides a higher degree of transparency. 31
Adj. EBITDA to Consolidated Net Income Reconciliation ($ in millions) 32 2016 2015 2016 2015 EBITDA - adjusted Process Equipment Group 41.8 $ 43.7 $ 109.8 $ 116.3 $ Batesville 34.6 32.2 109.5 108.9 Corporate (9.3) (9.7) (26.6) (30.1) Less: Interest income (0.3) - (0.8) (0.7) Interest expense 6.6 5.7 18.9 17.8 Income tax expense 10.9 13.8 31.9 39.9 Depreciation and amortization 14.3 12.7 46.2 41.1 Litigation - - - 0.5 Restructuring and restructuring related 1.5 1.0 8.9 2.4 Inventory step-up (0.1) - 2.4 - Trade name impairment 2.2 - 2.2 - Business acquisition and intergration 0.7 0.5 3.5 0.7 Consolidated Net Income 31.3 $ 32.5 $ 79.5 $ 93.4 $ Three Months Ended June 30, Nine Months Ended June 30,
33 Adj. EBITDA to Consolidated Net Income Reconciliation ($ in millions) Years Ended September 30 2015 2014 2013 2012 2011 Adjusted EBITDA: Process Equipment Group $ 160.5 $ 150.4 $ 116.4 $ 79.7 $ 53.3 Batesville 145.5 150.8 161.0 152.8 179.9 Corporate (37.3) (25.7) (29.9) (25.1) (24.8) Less: Interest Income (1.0) (0.8) (0.6) (0.5) (7.4) Interest Expense 23.8 23.3 24.0 12.4 11.0 Income Tax Expense 49.1 48.7 28.3 30.1 51.7 Depreciation and Amortization 54.3 58.4 89.4 40.4 36.1 Business Acquisition and Integration 3.6 8.4 16.0 4.2 6.3 Inventory Step-Up - - 21.8 - 2.8 Restructuring 7.5 5.5 2.8 8.3 1.3 Litigation 0.5 20.8 0.2 5.5 1.3 Pension Settlement 17.7 - - - - Other - - 0.2 - (0.8) Long-Term Incentive Compensation Related to the International Integration - - - 2.2 - Consolidated Net Income $ 113.2 $ 111.2 $ 65.4 $ 104.8 $ 106.1
Q3 FY16, Q3 FY15 & YTD FY16, YTD FY 15 Reconciliation of Non-GAAP Measures 34 1 Net income attributable to Hillenbrand 2016 2015 2016 2015 Net Income (1) 30.7 $ 32.1 $ 76.8 $ 92.3 $ Restructuring and restructuring related 1.7 1.2 9.1 3.8 Business acquisition and integration 0.7 0.5 3.5 0.7 Litigation - - - 0.5 Inventory step-up (0.1) - 2.4 - Backlog amortization (0.1) - 4.5 - Trade name impairment 2.2 - 2.2 - Tax effect of adjustments (1.5) (0.8) (7.5) (1.8) Adjusted Net Income (1) 33.6 $ 33.0 $ 91.0 $ 95.5 $ 2016 2015 2016 2015 Diluted EPS 0.48 $ 0.50 $ 1.21 $ 1.44 $ Restructuring and restructuring related 0.03 0.02 0.14 0.06 Business acquisition and integration 0.01 0.01 0.06 0.01 Litigation - - - 0.01 Inventory step-up - - 0.04 - Backlog amortization - - 0.07 - Trade name impairment 0.03 - 0.03 - Tax effect of adjustments (0.02) (0.01) (0.12) (0.02) Adjusted Diluted EPS 0.53 $ 0.52 $ 1.43 $ 1.50 $ Three Months Ended June 30, Nine Months Ended June 30, Three Months Ended June 30, Nine Months Ended June 30,
Cash Flow Information ($ in millions) Twelve Months Ended September 30 Operating Activities 2015 2014 2013 2012 2011 Consolidated Net Income $ 113.2 $ 111.2 $ 65.4 $ 104.8 $ 106.1 Depreciation and Amortization 54.3 58.4 89.4 40.4 36.1 Interest Income on Forethought Note - - - - (6.4) Forethought Note Interest Payment - - - - 59.7 Change in Working Capital (86.8) 22.6 (12.3) (19.8) (16.4) Pension Settlement Charge 17.7 - - - - Other, Net 6.6 (12.6) (15.3) 12.8 10.4 Net Cash Provided by Operating Activities (A) $ 105.0 $ 179.6 $ 127.2 $ 138.2 $ 189.5 Capital Expenditures (B) (31.0) (23.6) (29.9) (20.9) (21.9) Forethought Note Principal Repayment - - - - 91.5 Acquisition of Business, Net of Cash Acquired - - (415.7) (4.4) (240.9) Debt Activity (26.2) (104.1) 385.6 (162.3) 28.1 Dividends (50.4) (49.7) (48.7) (47.6) (46.9) Other (7.1) 13.1 4.0 1.7 17.7 Net Change in Cash $ (9.7) $ 15.3 $ 22.5 $ (95.3) $ 17.1 Free Cash Flow (A-B) $ 74.0 $ 156.0 $ 97.3 $ 117.3 $ 167.6 35
Serious News for Serious Traders! Try StreetInsider.com Premium Free!
You May Also Be Interested In
- Hillenbrand to Showcase Plastics Processing and Recycling Solutions at NPE2024, the Largest Plastics Industry Trade Show in the Americas
- Sherritt Corrects Misleading Information Announced by SC2 Inc. an Affiliate of Seablinc Canada Inc., a Significant Supplier to Sherritt’s Moa Joint Venture
- Kartoon Studios Inc. Completes First Tranche of Registered Direct Offering of Common Stock and Pre-Funded Warrants for up to $7.0 Million; Closes Initial Purchase of $4.0 Million of Common Stock and P
Create E-mail Alert Related Categories
SEC FilingsSign up for StreetInsider Free!
Receive full access to all new and archived articles, unlimited portfolio tracking, e-mail alerts, custom newswires and RSS feeds - and more!
