

Form 8-K HYSTER-YALE MATERIALS For: Mar 23
 Tweet
Tweet Share
Share
UNITED STATES
SECURITIES AND EXCHANGE COMMISSION
WASHINGTON, DC 20549
FORM 8-K
CURRENT REPORT
Pursuant to Section 13 OR 15(d)
of The Securities Exchange Act of 1934
Date of Report (Date of earliest event reported): March 23, 2015
HYSTER-YALE MATERIALS HANDLING, INC.
(Exact name of registrant as specified in its charter)
| DELAWARE | 000-54799 | 31-1637659 | ||
| (State or other jurisdiction of incorporation) |
(Commission File Number) |
(IRS Employer Identification No.) |
| 5875 LANDERBROOK DRIVE, SUITE 300, CLEVELAND, OHIO | 44124-4069 | |
| (Address of principal executive offices) | (Zip code) |
(440) 449-9600
(Registrant’s telephone number, including area code)
N/A
(Former name or former address, if changed since last report)
Check the appropriate box below if the Form 8-K filing is intended to simultaneously satisfy the filing obligation of the registrant under any of the following provisions:
| ¨ | Written communications pursuant to Rule 425 under the Securities Act (17 CFR 230.425) |
| ¨ | Soliciting material pursuant to Rule 14a-12 under the Exchange Act (17 CFR 240.14a-12) |
| ¨ | Pre-commencement communications pursuant to Rule 14d-2(b) under the Exchange Act (17 CFR 240.14d-2(b)) |
| ¨ | Pre-commencement communications pursuant to Rule 13e-4(c) under the Exchange Act (17 CFR 240.13e-4(c)) |
| Item 2.02 | Results of Operations and Financial Condition. |
On March 23, 2015, Hyster-Yale Materials Handling, Inc. (the “Company”) posted on its website, www.hyster-yale.com, an updated investor presentation for its Investor Day. A copy is attached as Exhibit 99 hereto.
| Item 7.01 | Regulation FD Disclosure. |
The information disclosed above under Item 2.02 with respect to the investor presentation and background information is incorporated herein by reference.
The information contained in this Current Report on Form 8-K, including Exhibit 99, is furnished pursuant to Item 2.02 and Item 7.01 of Form 8-K and shall not be deemed to be “filed” for purposes of Section 18 of the Securities Exchange Act of 1934, as amended, or otherwise subject to the liability of that section, nor shall it be deemed incorporated by reference in any filing under the Securities Act of 1933, as amended, except as shall be expressly stated by specific reference in such filing.
| Item 9.01 | Financial Statements and Exhibits. |
(d) Exhibits.
| Exhibit Number |
Description | |
| 99 | Hyster-Yale Materials Handling, Inc. Investor Presentation, dated March 23, 2015 | |
SIGNATURES
Pursuant to the requirements of the Securities Exchange Act of 1934, the registrant has duly caused this report to be signed on its behalf by the undersigned hereunto duly authorized.
| Date: March 23, 2015 | HYSTER-YALE MATERIALS HANDLING, INC. | |||||
| By: | /s/ Kenneth C. Schilling | |||||
| Name: | Kenneth C. Schilling | |||||
| Title: | Senior Vice President and Chief Financial Officer | |||||
EXHIBIT INDEX
| Exhibit |
Description | |
| 99 | Hyster-Yale Materials Handling, Inc. Investor Presentation, dated March 23, 2015 | |
 Exhibit
99 |
 Christina
Kmetko
Investor Relations |
 Safe
Harbor Statement The following information includes forward-looking
statements within the meaning of Section 27A of the Securities Act of 1933, as amended, and Section
21E of the Securities Exchange Act of 1934, as amended. Any and all statements
regarding the Company’s expected future financial position, results of
operations, cash flows, business strategy, budgets, projected costs, capital
expenditures, products, competitive positions, growth opportunities, plans,
goals
and
objectives
of
management
for
future
operations,
as
well
as
statements
that
include
words
such
as
“anticipate,”
“if,”
“believe,”
“plan,”
“estimate,”
“expect,”
“intend,”
“may,”
“could,”
“should,”
“will,”
and other similar expressions are forward-looking statements. Such
forward-looking statements are inherently uncertain, and readers must
recognize that actual results may differ materially from the expectations of the Company’s management. The
Company does not undertake a duty to update such forward-looking statements.
Among the factors that could cause plans, actions and results to differ
materially from current expectations include, without limitation, reduction in
demand for lift trucks and related aftermarket parts and service on a global
basis, the ability of dealers, suppliers and end-users to obtain financing at
reasonable rates, or at all, as a result of current economic and market
conditions, the political and economic uncertainties in Eastern Europe and Brazil,
customer acceptance of pricing, delays in delivery or increases in costs,
including transportation costs, of raw materials or sourced products and labor or
changes in or unavailability of quality suppliers, exchange rate
fluctuations, changes in non-U.S. import tariffs and monetary policies and
other changes in the regulatory climate in the non-U.S. countries in which the
Company operates and/or sells products, delays in manufacturing and delivery
schedules, bankruptcy of or loss of major dealers, retail customers or
suppliers, customer acceptance of, changes in the costs of, or delays in the
development of new products, introduction of new products by, or more
favorable product pricing offered by, competitors, product liability or other
litigation, warranty claims or returns of products, the effectiveness of the cost
reduction programs implemented globally, including the successful implementation of
procurement and sourcing initiatives, changes mandated by federal, state and
other regulation, including health, safety or environmental legislation, delays in or increased costs associated with the Brazil plant construction
and relocation, the successful commercialization of Nuvera Fuel Cells' technology
and integration of the acquisition, the introduction of a more accepted
product to the market by a competitor, making the Nuvera technology less marketable
and other risks identified in the Company’s Annual Report on Form
10-K
and
other
filings
with
the
Securities
and
Exchange
Commission.
Many
of
these
factors
are
outside
of
the
Company’s
control. |
 Today’s Presenters
Christina Kmetko
Investor Relations
Al Rankin
Chairman, President and Chief Executive Officer of Hyster-Yale
Colin Wilson
President and Chief Executive Officer of NACCO Materials Handling Group
Vickie Rickey
Senior Vice President, Asia-Pacific and Brazil
Chuck Pascarelli
Senior Vice President, President, Americas
Ralf Mock
Senior Vice President, Managing Director, Europe, Middle East and Africa
Rajiv Prasad
Senior Vice President, Global Product Development, Manufacturing and Supply Chain Strategy
Scott Blanchet
Vice President of Product Management, Nuvera
Jon Taylor
Vice President, Business Development and CEO of Nuvera
Ken Schilling
Senior Vice President and Chief Financial Officer |
 Agenda
11:30
11:35
Welcome and Introductions
11:35
12:05
Overview - Our Business
12:05
12:35
Our Brands, Markets and Growth Strategies
12:35
01:00
Growth in our JAPIC and Brazil Business Operations
01:00
01:20
Growth in our Americas Operations
01:20
01:35
Break
01:35
01:55
Growth in our EMEA Operations
01:55
02:15
The Products and Technology to Help Us Grow
02:15
02:25
Nuvera Products
02:25
02:35
Commercialization of our Nuvera Business
02:35
02:50
Financial Overview and the Importance of Volume Growth
02:50
02:55
Our Commitment to Growth: Our Products
02:55
03:00
Our Commitment to Growth: 7% Target and Substantial Cash Generation
03:00
03:45
Questions
03:45
05:00
Booth Walk-Throughs
Hyster-Yale Investor Day |
 Overview:
Our
Business
Alfred M.
Rankin, Jr.
Chairman, President and
Chief Executive Officer
Hyster-Yale Materials Handling
Chairman
NACCO Materials Handling Group |
 Our
Business is Materials Handling 7 |
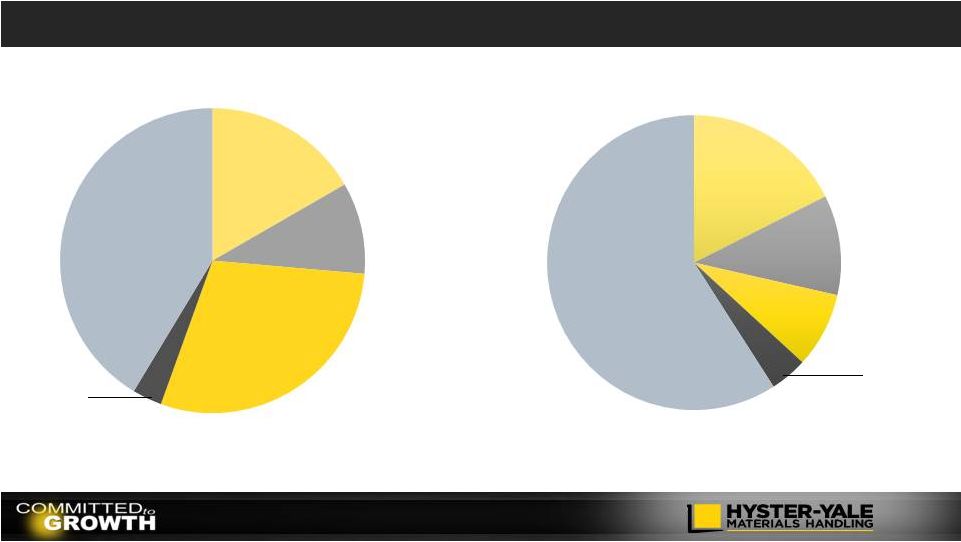 Lift
Truck Industry Total Industry = 1,088k Units
Market
Size
-
Units
Market Size -
$
8
_____________________
Source: WITS. 2014 Orders Reports.
_____________________
Source: Internal Company estimates
Estimated Industry Revenue Mix
Class 1
17%
Class 2
10%
Class 3
29%
Class 4
3%
Class 5
41%
Class 1
18%
Class 2
11%
Class 3
8%
Class 4
4%
Class 5
59% |
 Industry Overview
(units in thousands)
Global Lift Truck Industry Size
_____________________
Trend line represents 4.5% CAGR from 2006-2008 Average Industry Size. Source:
WITS. Represents order intake. Global Lift Truck Industry Breakdown
(Units) Long-term
CAGR
(2004
–
2014)
=
4.5%
In last 5 years, global market lift
truck growth significantly outpaced
GDP growth at 2.4x
(1)
GDP
Global Lift Truck Industry Size
Global Industry Growth
_____________________
Source: WITS. FY 12/31/14 and 12/31/13 order intake.
9
_____________________
Source: WITS. 2014 Orders Reports.
_____________________
(1) Calculated based on CAGRs for new truck sales and GDP for 2009-2014
Europe
31%
China
25%
Americas
25%
Asia Pacific 7%
Middle East &
Africa
5%
Change over Prior Year
Total
Americas
Brazil
EMEA
JAPIC
+8%
+8%
-13%
+8%
+8%
951
872
547
794
975
944
1,009
1,088
0
300
600
900
1,200
2007
2008
2009
2010
2011
2012
2013
2014
Japan 7% |
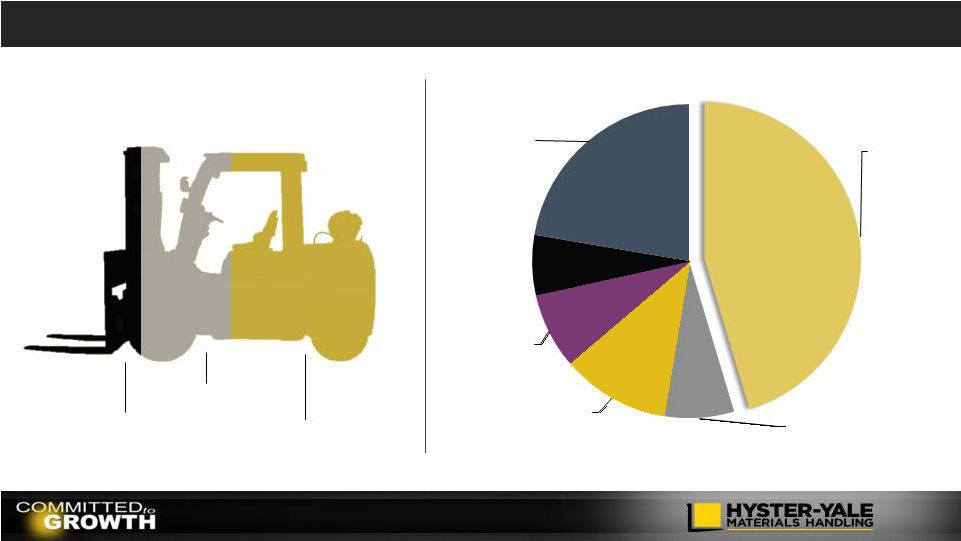
 Sources of Revenue
2014
Worldwide
Sales
by
Product
2014
Retail
Shipments
by
End
Market
(1)
_____________________
(1)
Represents Hyster-Yale North American unit shipments by industry.
(2)
Includes Big Truck sales that represent 11.3% of total sales.
10
Americas
67%
Europe, Africa
& Middle East
25%
Asia-Pacific
8%
Manufacturing
27%
Wholesale Distribution
14%
Food & Beverage
13%
Rental
10%
Home Centers/ Retail
11%
Freight & Logistics
10%
Paper
6%
Other
9%
Internal
Combustion
Engine
Units
(2)
55%
Electric
Units
28%
Parts
13%
Other
4%
2014 Sales by Geography |
 Hyster-Yale Business Structure
Public Company
Governance
Small Corporate Staff
Geographic
11
Platform to Integrate
Other Brands
Operating Company
Execution of Strategy
Public entity
Guides Strategic Vision
Hyster-Yale (HY)
NACCO Materials Handling Group
(NMHG
)
Hyster
®
Brand
Yale
®
Brand
UTILEV
®
Nuvera
®
Future?
Hyster-Yale
The Public
Company
11 Directors
(7 independent)
NACCO Materials
Handling Group
The Operating
Company
HY Board plus Operating
Company CEO and one
additional independent
director
Over 5,400
Employees
•
Hyster-Yale
Executives
•
Legal
•
Finance
•
Internal Audit
•
Tax |
 Our
Long-Term Philosophy Long-term
growth
Long-term
shareholders
Shareholder
protection
Senior
management
incentivized as
long-term
shareholders
Increase
shareholder
value
Return on Capital
Employed and
Market Share
Increase focus
12 |
 Key
Events Since 1989 Wednesfield(UK)/
Brunswick (USA)
Danville (USA)
Lenoir (USA)
Irvine (UK)
Modena (Italy)
Elimination of Retiree
Medical
Freezing Defined
Benefit Plans
Engineering
Manufacturing
Supply Chain
Information
Technology
Moved from 2 Brand
companies to
1 company
managing several
brands
Co-located
Area Leadership
Restructured
Distribution network
Plants Rationalized
Benefits
Restructured
Functions
Consolidated
Marketing Structure
Evolved
13 |
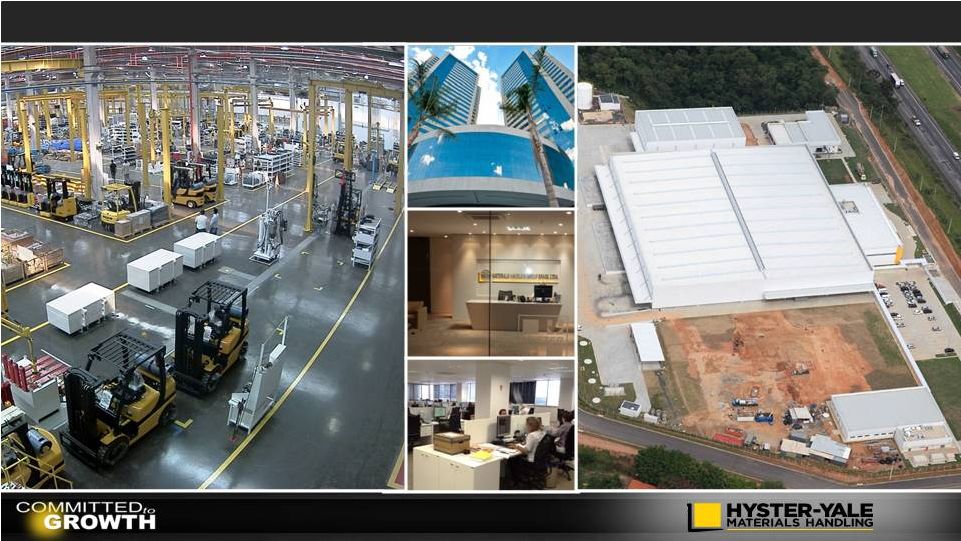
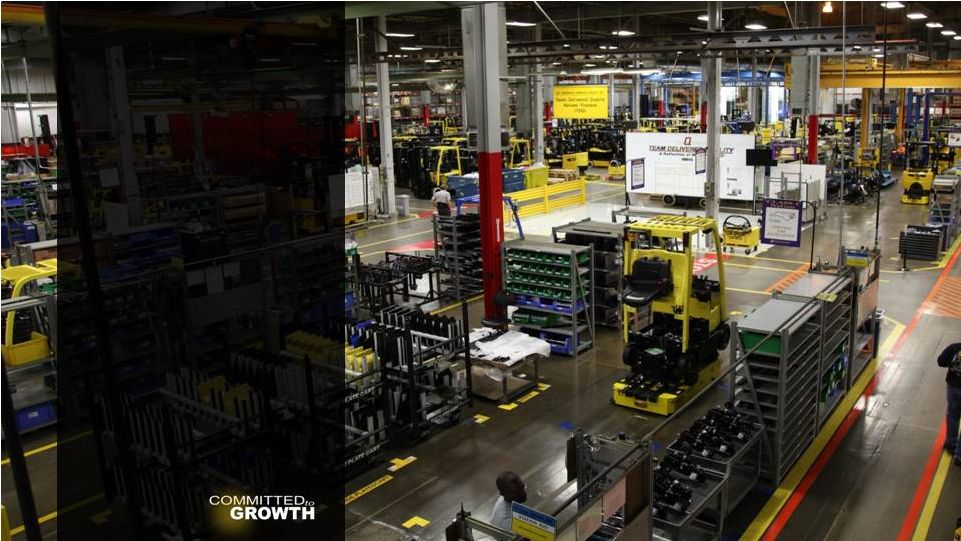
 Hyster-Yale Today: An Efficient and Productive Organization
14 |
 The
Transition 15
Maturity of key programs designed to put
us in the position of having the right
products at the right cost and right
quality
Commitment to the marketing and
support programs which can enable a
period of share gain
Hyster-Yale spin-off from
NACCO Industries
Two years
ago the
company
reached
a key
transition
point |
 Hyster-Yale Snapshot
Hyster-Yale Materials Handling, Inc. (NYSE: HY)
Leading global designer, manufacturer and marketer of
lift trucks and provider of aftermarket parts and support
Headquartered in Cleveland, Ohio
Over 5,400 employees globally
FY 12/31/14 Revenue –
$2.8 billion
FY 12/31/14 Net income
(1)
-
$109.8 million
FY 12/31/14 EBITDA
(1)(2)
–
$182.6 million
12/31/14 Net cash –
$79.9 million
FY 12/31/14 ROTCE
(1)(2)
of 28.3% (Net cash basis)
16
(1)
Net income, EBITDA and ROTCE for the FY 12/31/14 include a $17.7 million pre-tax
gain on the sale of the Brazil land and facility.
(2)
EBITDA and ROTCE are non-GAAP measures and should not be considered in isolation or
as a substitute for GAAP measures. For discussion of non-GAAP items and the
related reconciliations to GAAP measures, see information in the Appendix at the end of
this presentation. |
 Over
the next three years…. A period of
share growth
Get to
115,000
trucks irrespective of industry size
Use of cash to support
technology accelerators
Fuel Cells
Automation
Telemetry
Use of cash to
support strategic
alliances
17 |
 Operating
Profit at the
mid-point of
the next cycle
Operating
Profit at the
peak of this
cycle
18
7%
7%
With adequate
volume
growth we
can meet our
public
operating
profit
commitments |
 $30
million fixed cost absorption by moving from 75%
capacity utilization to full utilization of our
manufacturing capacity
$40 million
by meeting target economics in standard
margin net of increased SG&A spread
over more units
25,000
units of additional
volume
$70 million
of operating profit
19 |
 Mission Statement Redefined
Be a leading globally integrated designer, manufacturer
and marketer of a complete range of high quality,
application-tailored lift trucks, offering the lowest cost of
ownership, outstanding parts and service support and
the best overall value.
Our transition had its roots in our initiation of the Good to Great strategic
thinking process in 2010 which began with a redefinition of NMHG’s
mission statement 20 |
 The
Basic Philosophies That Guide Our Actions Global supplier of lift
trucks and related
services
Best at understanding and
addressing the needs of
customers
Brands focused on unique
segments of the market
Market share growth
Market through exclusive,
independent, certified
distribution
Sell direct to large
customers
Capture full aftermarket
potential
Customer
Internal
Distribution
Full line product supplier to meet the
needs of major customer segments
Modular/scalable components to create
the right product at right cost
Supply chain organization to deliver high
quality / low cost components
Assemble in market of sale to meet
customer needs quickly
Product quality to deliver the best uptime
in the industry
An environment that motivates and retains
high quality employees
21 |
 The
“Hedgehog” Concept
22
An ECONOMIC ENGINE driven
by market share leadership
which generates greater relative
economies of scale, parts volume
and ancillary services
PASSIONATE ABOUT
market share leadership
gained by understanding
customer
needs
and
delivering the product
performance, quality and
cost to meet those needs
BEST AT independent
distribution and direct
selling
to deliver the
right truck and services
for each customer
application at the lowest
cost of ownership
What drives
our economic
engine?
What can we
be Best in
World at?
What are we
passionate
about? |
 Hyster-Yale’s Economic Engine
23
Hyster-Yale’s
economic
engine
is
driven
by
increasing
unit
volume
as
our
“hedgehog”
approach
gets
embedded in all our activities and our flywheels increase momentum…
Geographic
and Product
Balance
Worldwide Distribution
Strength to Drive
Market Share
Parts and Service
Volume
Large Lift Truck
Population in Service
Volume
Economies
of Scale
A large lift truck population base drives parts and service volume resulting in enhanced
profitability for dealers and Hyster-Yale Design
Component
Commonality
Supply Chain
Manufacturing
Quality
Marketing
Parts
Infrastructure
Capital Requirements |
 Core
Strategic Initiatives Basic Business Areas
Our strategies are designed to drive increased share,
which in turn increases the lift truck population, which
drives parts and service volumes.
Geographic
and Product
Balance
Worldwide
Distribution
Strength
to Drive
Market Share
Parts and Service
Volume
Large Lift Truck
Population in Service
Volume
Economies
of Scale
Design
Component Commonality
Supply Chain
Manufacturing
Quality
Marketing
Parts
Infrastructure
Capital Requirements
Improve
Warehouse
Position
Enhance
Independent
Distribution
Succeed in
Asia
Enhance Big
Truck Market
Position
Strengthen the Sales and
Marketing Organization
Low Cost of
Ownership
Understand
Customer Needs
And core strategic initiatives were designed to drive the economic engine by
increasing share… 24
Commercialize
Nuvera’s
Technology |
 Early
Stage Mid Stage
Achieved
Breakthrough
Understand Customer Needs
Low Cost of Ownership
Enhance Independent Distribution
Improve Warehouse Position
Succeed in Asia
Enhance Big Truck Market Position
Strengthen Sales and Marketing Organization
Commercialize Nuvera’s Fuel Cell Technology
We believe our core strategic initiative flywheels
are in various stages of momentum…
Core
Strategic
Initiatives
–
Stages
of
Momentum
25 |
 Early
Stage Mid Stage
Achieved
Breakthrough
Product Improvement
Supply Chain
Manufacturing
Quality
Pricing
Dealer Structure and Excellence
Area Sales Management
Account Identification and Coverage
Solutions Groups
Aftermarket
Fleet
We believe momentum is gaining in all key
areas of the business…
Key
Business
Areas
–
Stages
of
Momentum
26 |
 27
The HY “hedgehog”
can
lead to a thicket of activities which
can generate a leadership share and
profitability position in our industry.
requires the
creation of a unique, valuable and sustainable
position involving a different set of
activities from our competitors…
Deliver greater value to customers or create
comparable value at lower prices, or both.
Long-term competitive advantage |
 People Philosophy
Drive P&L’s
closer to the
customer
Base incentive
compensation
on corporate
and individual
targets
Promote
from
within
Inject
expertise
through
external
hires
Ensure
shareholder
protection
28
Develop a
culture of
accountability |
 Our
Brands, Markets, and
Growth
Strategies
Colin Wilson
President and Chief Executive
Officer
NACCO Materials Handling Group |
 NACCO
Materials Handling Group and Hyster-Yale Materials Handling are Formed
Hyster founded
in Portland
Oregon as the
Willamette
Ersted
Company
1929
1944
1959
Company name
officially
changed to
Hyster
Company
First Hyster
container
handling
trucks
1875
1920
Yale Lock
Mfg. broadens
its scope into
materials
handling
Yale and Towne
launched a new
battery powered low-
lift platform truck
1963
Yale forklift
truck business
merges with
Eaton Mfg.
Industrial Truck
Division
1950
Yale added gas,
LP gas and
diesel-powered
fork lift trucks to
its range
1964
Hyster introduces
the famous
Monotrol®
pedal
1971
Yale forges a
partnership
with
Sumitomo
Ltd
1989
1989
Hyster and
Yale merge to
form NACCO
Materials
Handling
Group
30
2012
2012
1985
Yale acquired
by NACCO
Industries
1989
Hyster
acquired by
NACCO
Industries
Hyster-Yale
formed as
independent
public company
following spin-off
by NACCO |
 Brand
Management 31
NMHG Major Accounts
Dealer
Dealer
NMHG Dealer Oversight
Dealer |
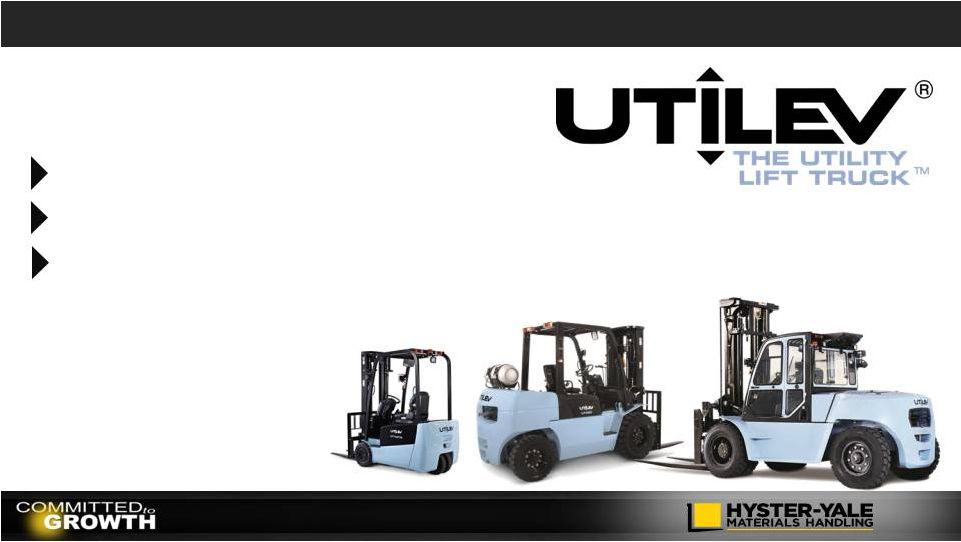 UTILEV
Introduced in 2011
Addresses the utility segment of the market
Contract manufactured in China
32 |
 Our
Business Has Been Transformed Comprehensive, updated product line
Average product age since last
upgrade –
less than 4 years
Designed to meet customer needs
and provide low overall cost of
ownership
Multiple power solutions to meet
performance, cost, and environmental
needs
Product Range
Manufacturing
Globally integrated, lean operations
with economies of scale
Assembled in market of sale
Continuous efficiency improvements
DFT implementation globally
33 |
 Our
Business Has Been Transformed Centralized supply chain
management
Highly flexible low cost
supply chain
30%+ low cost country
sourcing
Concentrated supplier base
Intense focus on supplier
quality
Supply Chain
Aftermarket
Quality
Customer driven
programs
North America’s warranty
rates reduced by 50%+
Model Year upgrades
High first time fill %
Comprehensive all
makes parts program
Strong Fleet
management program
Telematics solutions
across product line
34 |
 Our
Competitive Advantages 35
•
Able to meet customers needs globally
•
Global economies of scale
•
New investment in alternative energy solutions
•
Young/ fresh product line
•
Source of aftermarket profitability
•
Barrier to entry
Global
Full Product Line
Field Population
Dealer Relationships
•
Independent distribution model
•
Exclusive distribution
•
Combine OEM excellence with entrepreneurial
distribution focused on customer
•
Long relationships
•
Able to meet most needs
•
National Account programs
Customer Relationships
•
High performance metrics
•
Large fleet program
Aftermarket Support
Employee Relationships
•
Engaged workforce
•
Experienced leadership
•
Equal treatment
•
High return for our stockholders
•
Low capital employed structure
•
Partnership relationships to limit capital needs
Focus on Return on Capital |
 NMHG
Acquired Nuvera in December 2014 Participate in hydrogen generation and
compression opportunities
Enter fast growing hydrogen fuel cell market
Provide integrated solution for customers
Revenue and margin from sale of power source
36
We plan to: |
 Our
Core Strategies 37 |
 Global Structure
Corporate
Strategy
Product Development
Supply Chain
Global Finance
Information Technology
Geographic
Sales and Marketing
Manufacturing
Human Resources
Regional Finance
Aftermarket
38 |
 NMHG
Organized on a Geographic Basis The Americas
Population: 1 Billion
GDP : $25 Trillion (USD)
Lift Truck Industry : 267,600
Europe, Middle East,
and Africa
Population: 2.5 Billion
GDP: $29 Trillion (USD)
Lift Truck Industry: 388,800
39
_____________________
Source:
Industry: WITS. 2014 Orders Reports
GDP:
http://knoema.com/nwnfkne/world-gdp-ranking-2014-data-and-charts
Population:
http://www.worldometers.info/world-population/population-bycountry/
Asia-Pacific
Population: 3.8 Billion
GDP: $24 Trillion (USD)
Lift Truck Industry: 432,900 |
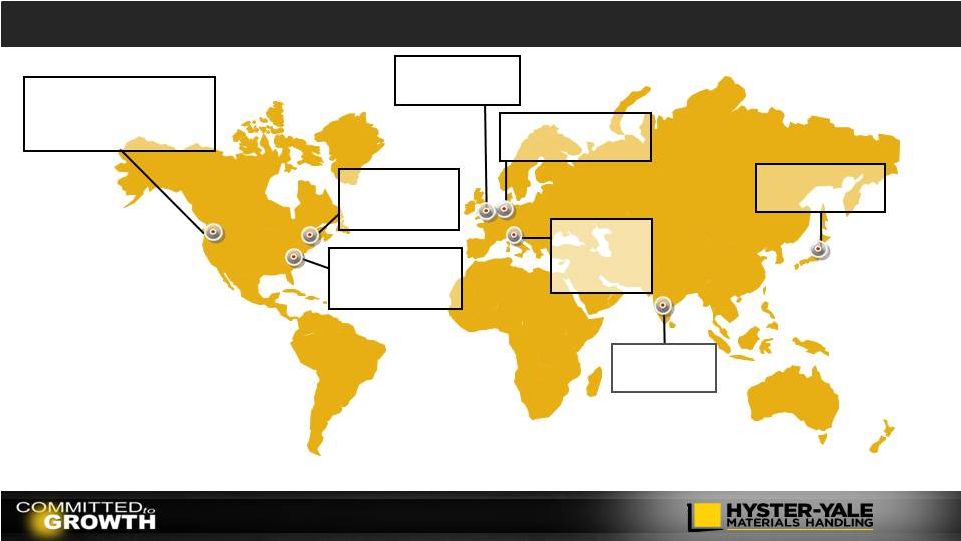
                Sao
Paulo, Brazil Marketing
operations for
Brazil
Cleveland, Ohio
Hyster-Yale
corporate
headquarters
Sydney, Australia
Divisional headquarters;
sales and marketing for
Asia-Pacific
Headquarters
Obu, Japan (JV)
Headquarters for
Sumitomo-NACCO JV
Our Global Footprint
40
Frimley, Surrey UK
Divisional
headquarters and
marketing and sales
operations for Hyster
®
and Yale
®
in Europe
Greenville, North
Carolina
Divisional
headquarters and
marketing and sales
operations for
Hyster®
and Yale®
in Americas |
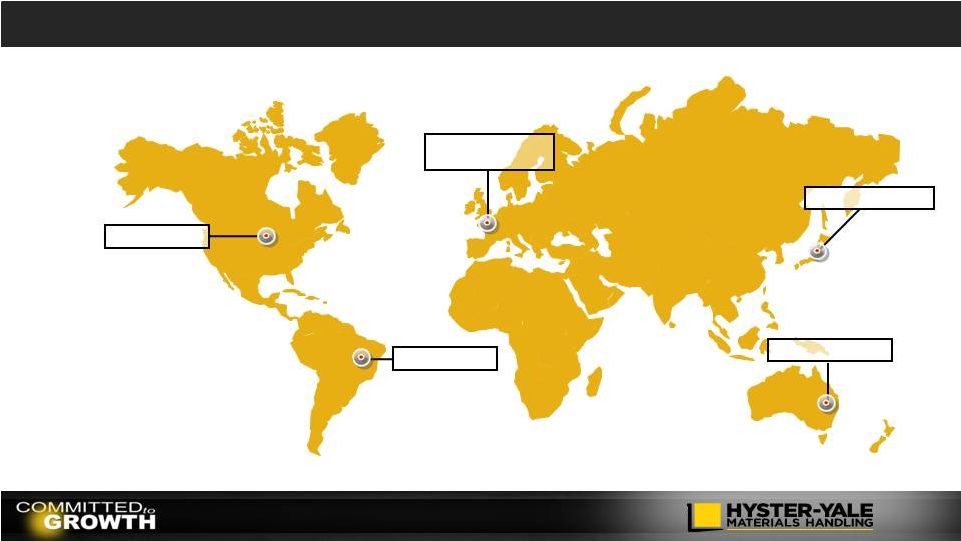
 Greenville, North
Carolina
Americas warehouse
development center
Fairview, Oregon
Counterbalanced development
center for design and testing of lift
trucks, prototype equipment and
component parts
Development
Centers
Nijmegen, Netherlands
Big trucks development
center
Masate, Italy
European
warehouse
development
center
Obu, Japan (JV)
Sumitomo-NACCO JV
development center
Billerica,
Massachusetts
Nuvera research and
development
Frimley, Surrey UK
Engineering Concept
Center
Our Global Footprint
41
Pune, India
Engineering
design services |
 Ramos
Arizpé, Mexico Manufacture of component
parts
Sulligent, Alabama
Manufacture of component
parts
Berea, Kentucky
Manufacture of lift
trucks and component
parts
Manufacturing
Nijmegen,
Netherlands
Manufacture of lift
trucks
Greenville, North
Carolina
Manufacture of lift
trucks and
component parts
Masate, Italy
Manufature
of lift trucks
Craigavon,
Northern Ireland
Manufacture of lift
trucks and
component parts
Cavite, Philippines
Manufacture of
components for
Sumitomo-NACCO JV
Hanoi, Vietnam
Manufacture of
components for
Sumitomo-NACCO JV
Obu, Japan (JV)
Manufacture of lift
trucks
Shanghai, China
(JV)
Manufacture of lift
trucks
Itu, Brazil
Manufacture of lift trucks
Our Global Footprint
42 |
 Parts
Distribution
Nijmegen,
Netherlands
Sydney, Australia
Danville, Illinois
Itu, Brazil
Obu, Japan (JV)
Our Global Footprint
43 |
 Pune,
India Supply chain
services
Irvine, Scotland
European Divisional
Support Centre
Charlotte, North Carolina
Customer experience and
training center
Customer
Experience and
Support Centers
Fairview, Oregon
Global administrative
center
Kuala Lumpur,
Malaysia
Asia support office
Our Global Footprint
44
Shanghai, China
Supply chain
procurement center
Hefei, China
Supply chain
procurement center |
 Country Economy Maturity Drives the Type of Lift Truck Used
Premium
Standard
Utility
Indicative Map Only
Company’s estimate of predominance of type of demand
45 |
 Our
Product
Range
–
Designed
to
Meet
Customer
Needs
Premium
46 |
 Standard
Our
Product
Range
–
Designed
to
Meet
Customer
Needs
47 |
 Utility
Our
Product
Range
–
Designed
to
Meet
Customer
Needs
48 |
 Types
of Trucks Used Vary by Market 49
_____________________
Source: WITS. 2014 Orders Reports
North
America
Class 1: 18%
Class 2/3: 45%
Class 4/5: 37%
Latin America
/Brazil
Class 1: 8%
Class 2/3: 36%
Class 4/5: 56%
Western
Europe
Class 1: 19%
Class 2/3: 64%
Class 4/5: 17
Middle East
& Africa
Class 1: 15%
Class 2/3: 25%
Class 4/5: 60%
Eastern
Europe
Class 1: 16%
Class 2/3: 54%
Class 4/5: 30%
Asia
Class 1: 17%
Class 2/3: 25%
Class 4/5: 58%
Pacific
Class 1: 14%
Class 2/3: 36%
Class 4/5: 50 |
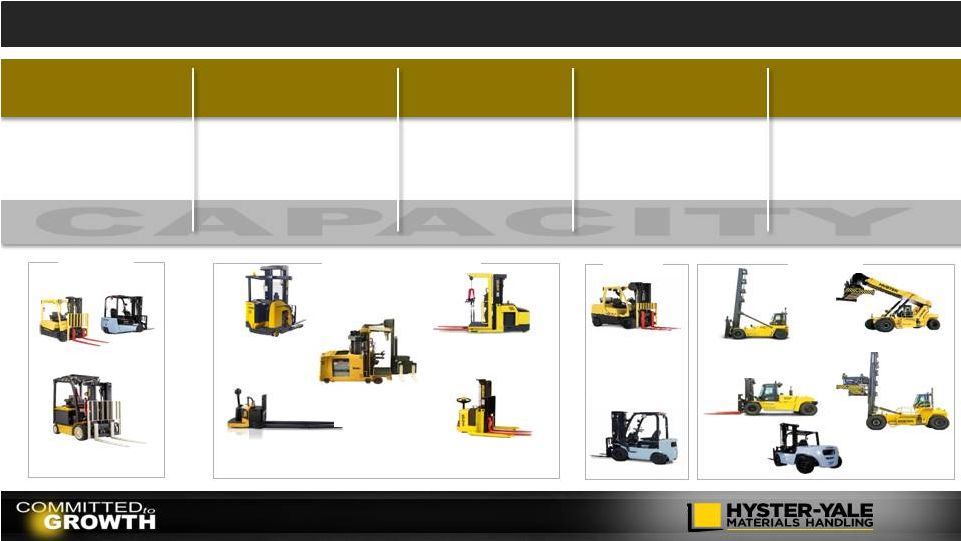 NMHG
Is a True Full Line Supplier Electric
Counterbalanced
Rider Trucks
Electric Narrow
Aisle Trucks
Electric Hand
Trucks
Internal
Combustion Engine
(cushion tire)
Internal
Combustion Engine
(pneumatic tire)
Electric
CB
3 wheel Electric
4 wheel Electric
Pallet Trucks
Stackers
Very Narrow
Aisle Trucks
Order Pickers
Reach Trucks
Internal
Combustion
Engine
ICE CB
Laden Container
Handlers
Big Trucks
Empty Container
Handlers
Forklifts
Reach Stackers
CLASS 1
CLASS 2
CLASS 3
CLASS 4
CLASS 5
1.0T to 5.5T
1.5T to 6.0T
1.5T to 8.0T
1.0T to 7.0T
1.0T to 52.0T
Warehouse Equipment
50 |
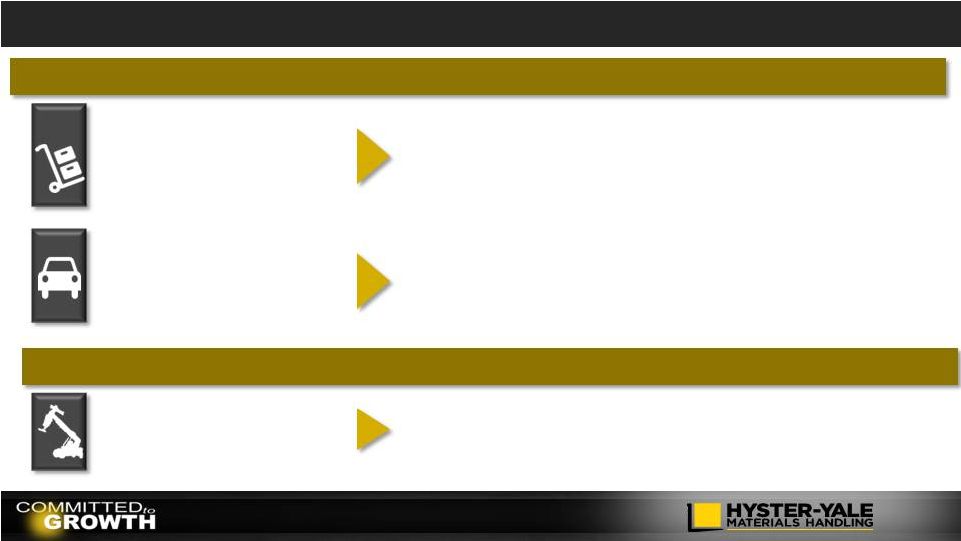
 Meeting the Needs of Customers
Understanding Customer
Needs
Improving Warehouse
Position
Big Truck Position
Counterbalanced product
Warehouse product
Big Truck product
51 |
 Aftermarket Support Is Critical to the Customer’s Purchase Decision
Dealer support and service
Parts availability
52
_____________________
Source: 2007 Deloitte Survey on Customer Purchase Decision-Making
3.4
3.5
3.8
3.9
4.1
4.2
4.4
4.4
4.6
4.7
5.0
5.2
5.2
5.2
5.3
5.4
5.5
Financing options / lease programs
Product customization
Fleet services programs
Green / environmentally friendly
Breadth of product features/options
Quick delivery / lead time
Manufacturer's reputation
Initial purchase price
Dealer relationship / reputation
Ergonomics / comfort
Warranty / backing of product
Total cost of ownership
Quality
Safety
Reliability
NOTE:
Based
on
6
points
scale
with
1=
“Not
Important”
and
6
=
“Critically
Important” |
 Shipment direct to vans
Aftermarket Support Is Critical to the Customer’s Purchase Decision
•
Distribution cost compression
through warehouse automation
•
Transaction cost compression
through greater use of technology
•
Pricing optimization
through structured analytics
powered by bespoke software
Global inventory visibility
Comprehensive
parts availability
At the right cost
At the point of
consumption
53 |
 Key
Relationships…Our People Success
Through
People
54
Performance
Management
Competencies
/ Behaviors
Accountability
Employee
Engagement
Equal
Opportunity
for All
Reward
Over
5,400
people
worldwide |
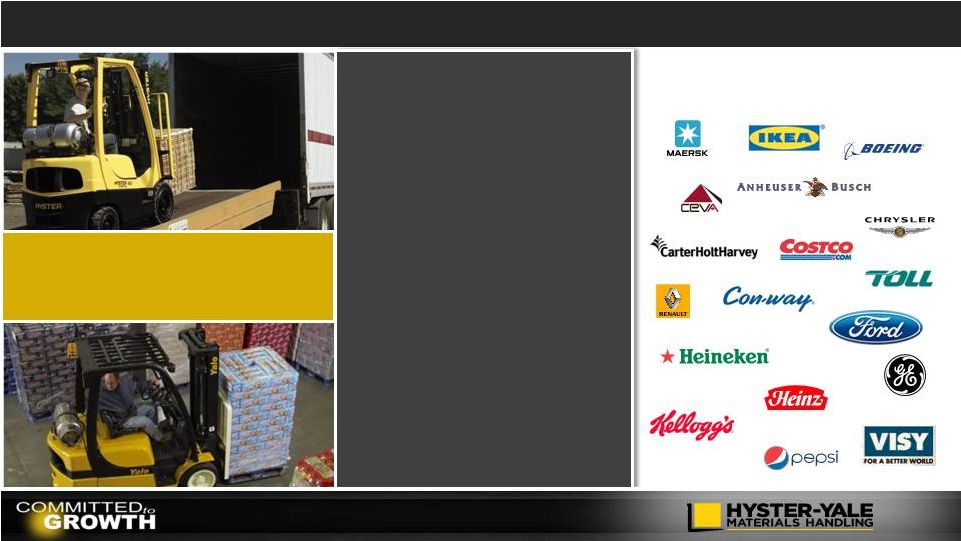 Key
Relationships…Our Customers The Customer
Direct to customer sales to
major accounts
Account Identification
Teams
Solutions Groups
Special Application teams
Global Account teams
Investment in global CRM
system
Understanding
Customer Needs
Blue Chip Customer Base
55 |
 Key
Relationships…Our Dealers The Dealer
Independent
Exclusive
Entrepreneurial
Committed
partner
Dual-line or
single
Over 1,000
global dealer
locations
Enhancing
performance
Dealer Excellence programs
Dealer incentives
Term-based contracts
Strengthening the
distribution footprint
Sales and Service territories
(SSTs)
Competitor conversions
In-territory acquisitions
More than
2,000
application
consultants
Over 11,000
service technicians
Strong
Independent
Distribution
56 |
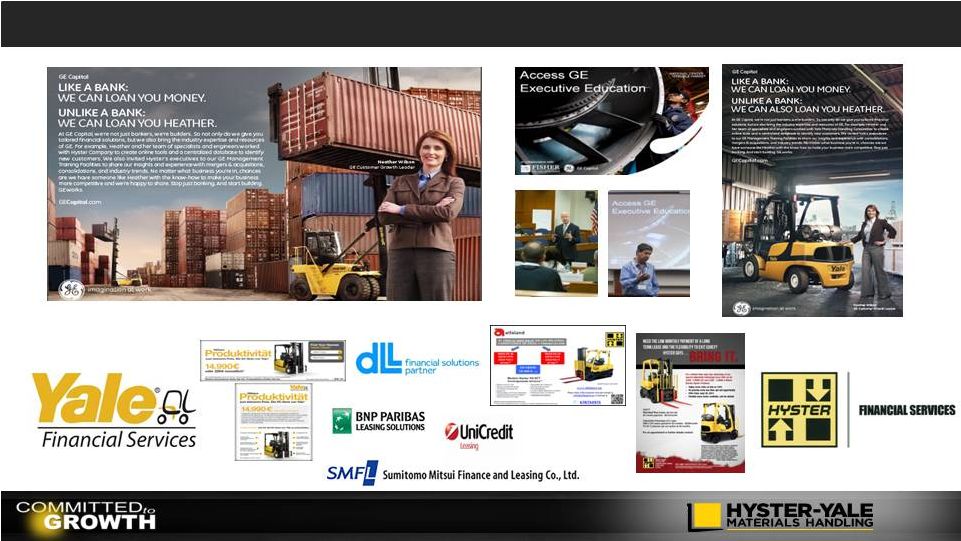 57
Key relationships…Our Financing Partners |
 Key
Relationships…Joint Ventures and Licensees Maini Materials
Movement
(Yale)
TIL Limited
(Hyster)
Hangcha
(UTILEV)
Sumitomo-
NACCO
Materials
Handling
Our Partners
Succeed in Asia
58 |
 Growth in Our
JAPIC and
Brazil
Operations
Victoria L.
Rickey
Senior Vice President, Asia-
Pacific and Brazil
NACCO Materials Handling Group |
 JAPIC
(Japan,
Asia
Pacific,
India,
China) |
 9%
Compound
Annual
Growth
–
China
16%
JAPIC Markets
Increasingly important region
Significant opportunity for growth
Domestic production in the market is critical
61
_____________________
Source: WITS. Orders Reports.
_____________________
Source: WITS Orders Reports.
_____________________
_____________________
Source: JIVA (Japan); CITA (China); KOCEMA (Korean); SIMEHM (India); WITS (Asia &
Pacific) 30%
38%
40%
39%
38%
40%
40%
-
200,000
400,000
600,000
800,000
1,000,000
1,200,000
JAPIC
Global
18,444
54,463
81,203
8,745
274,992
0
50,000
100,000
150,000
200,000
250,000
300,000
Pacific
Asia
Japan
Indian SC
China
2014 Industry Bookings
0
100,000
200,000
300,000
400,000
500,000
2008
2009
2010
2011
2012
2013
2014
Industry Bookings
Pacific
Asia
Japan
India
China
0.0%
20.0%
40.0%
60.0%
80.0%
100.0%
120.0%
Japan
Asia
Korea*
Pacific
India
China
2014 Domestic Production
Source: WITS. 2014 Orders Reports.; For Indian Subcontinent data is WITS plus SIMHEM
2008
2009
2010
2011
2012
2013
2014 |
 Lift
truck market per million population Very low lift truck usage…
62
_____________________
Lift truck market per million population
Population in millions
1447
1666
421
756
409
1402
39
358
127
418
India SC
MEA
Latin America
Asia
Eastern Europe
China
Pacific
North America
Japan
Western Europe
6
33
64
73
144
196
473
613
639
655
Source: WITS. 2014 Orders Reports.; For Indian Subcontinent data is WITS plus SIMHEM
Population – www.worldometers.info/world-populations by country |
 Japan
Sumitomo-NACCO (SN)
Sumitomo Heavy
Industries, Ltd.
NACCO Materials
Handling Group
50%
50%
Incorporated May 1, 1972
2014 -Approximately
700 employees
Sales and manufacture of
Class 1, 2, 4, and 5 product
NMHG exclusive
distribution rights outside
of Japan
Distribution Network
SN Materials Handling
Sales Company
(February 21,1981)
Cavite,
Philippines
1996
Hanoi,
Vietnam
2008
Obu,
Japan
1972
3 Manufacturing Locations
63
Growth Strategies
Implement Demand Flow Manufacturing
Reduce lead time and enhance quality
Re-engineer Service Operation
Grow Major Account Business
Introduce New Electric Product
Revise Dealer Management Structure
_____________________
Source: WITS. 2014 Orders Reports.
25%
24%
5%
46%
2014 Japan Market
Class 1
Class 2
Class 3
Class 4 & 5 |
 Asia
Advanced
•
Singapore
•
Taiwan
•
South Korea
Newly
Industrial
•
Thailand
•
Malaysia
•
Indonesia
•
Philippines
•
Vietnam
Emerging
•
Cambodia
•
Myanmar
•
Laos
Asian
Markets
Growth Strategies
Opportunities
•
Mixed markets
•
Largely Internal Combustion
•
Rental business developing
•
Large utility segment
Build Asian Infrastructure
Improve Dealer Performance
Grow Warehouse and Big Truck Business
Expand Major Account Team
Expand UTILEV Range
34%
of market*
South Korea is
64
_____________________
Source: WITS 2014 Orders Reports.
_____________________
*Source: WITS 2014 Orders Reports.
37 dealer locations and 154 salespeople
17%
13%
12%
58%
2014 Asia Market
Class 1
Class 2
Class 3
Class 4 & 5 |
 Succeed in Asia
Dealer Conversion
New Malaysian
dealer
Share of Hyster has
doubled in Malaysia
since signing
Converting large rental
fleet over the next 4
years
Major Account Victories
Nearly 100 Class 5 trucks
Sold on basis of previous strong service
satisfaction with Hyster Thai dealer
100+ trucks
won on Japanese account initiative
Global
$2B+
tire
manufacturer
operating
in a large facility in Thailand
Japanese
accounts
in
Asia
for temperature control,
manufacturing, and safety
systems
65
Conquest
sale
in
growing
Philippine market
Well-known,
multinational
beverage
corporation
with
extensive brand recognition |
 Pacific
•
Mature cyclical market
•
Large long term rental
•
Telemetry
•
Significant major account business
Close Distribution Gaps
Improve Dealer Performance
Grow Warehouse Market Business
Build Yale Major Account Business
Expand UTILEV Range
83%
of market
Growth
in the
Warehouse
Market
over last
8 years
Growth Strategies
Australia is
Opportunities
66
_____________________
Source: WITS. 2014 Orders Reports.
_____________________
Source: WITS. 2014 Orders Reports.
_____________________
Source: WITS Orders Reports.
31 dealers and 63 salespeople
14%
14%
21%
51%
2014 Pacific Market
Class 1
Class 2
Class 3
Class 4 & 5
13%
36%
51%
2014
10%
32%
58%
2006
Electric
Warehouse
ICE |
 Pacific Success
67
Converted 120+ trucks
Sold on basis of “greening their
environment”
from ICE to Electric CB
275+ trucks
won on expertise in Telemetry
Commercial
carrier
for
large Pacific country and
member of a major
international airline alliance
Well-known,
multinational
beverage corporation
with
extensive brand recognition
Substantial Big Truck deal
22 ReachStackers
9 laden handlers
3 18-ton trucks
One
of
Australia's
largest
rail
freight
businesses
with
significant regional intermodal
terminal capacity
Major Account Victories |
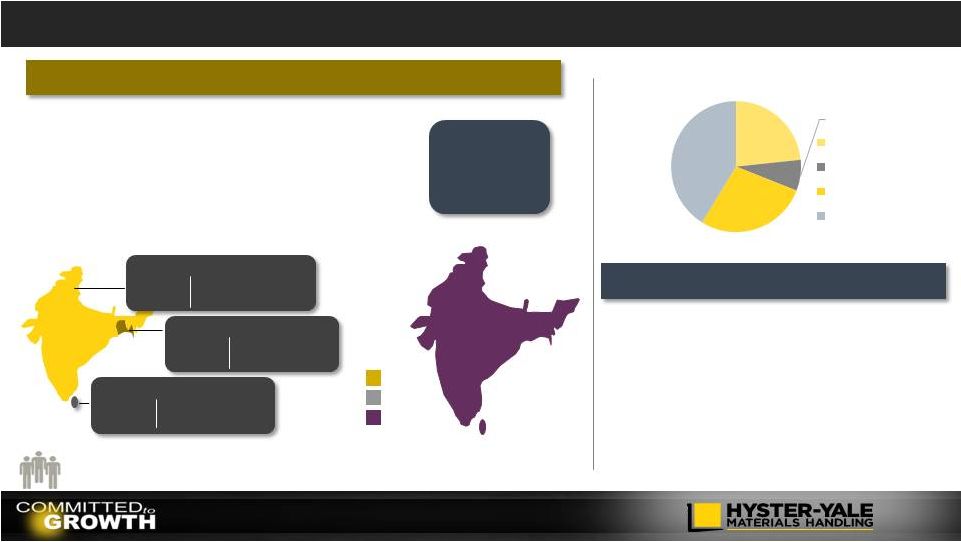 Indian Subcontinent Markets
Growth Strategies
Opportunities
•
Emerging
market
(below
Utility)
•
Significant local production = 64%
•
Large electric segment
•
Growing rental demand
•
Significant US/EMEA major account business
•
Strong local partners with technology licensing
Increase Market Coverage
Penetrate Major Accounts
Add Additional Utility Products
Leverage China Sourcing
Expand UTILEV Range
Launch Rental Business
93%
of market
India is
Pop.
1.27B
2014 GDP Growth
9.1%
INDIA
Pop.
0.158B
2014 GDP Growth
15.4%
BANGLADESH
Pop.
0.021B
2014 GDP Growth
7.3%
SRI LANKA
68
_____________________
Source:
http://knoema.com/nwnfkne/world-gdp-ranking-2014-data-and-charts; https://www.cia.gov
_____________________
Source: 2014 WITS plus SIMHEM
_____________________
Source: 2014 WITS plus SIMHEM
Premium
Standard
Utility
_____________________
Indicative Map Only. Company’s estimate of predominance of type of
demand 14 dealer locations; relationships with Maini (Yale) and TIL
(Hyster) 23%
8%
28%
41%
2014 India Market
Class 1
Class 2
Class 3
Class 4 & 5 |
 Leverage
Partnerships
–
India
Product and dealer relationship
TIL manufactures ReachStackers under
license in India
Delivered
100 ReachStacker
in
2014
Exporting to Hyster Pacific
TIL Limited
Maini
Product and dealer relationship
Maini manufactures electric trucks under
license in India
Distribute counterbalanced and warehouse
trucks in India
69
th |
 China
Shanghai Hyster Forklift, Ltd.
Approximately
200 total headcount
Build small internal combustion
and 4-wheel electric trucks
Formed
in
1997
–
Began
Production in
1999
Joint Venture with Sumitomo-NACCO
Factory 6,400 sq. mtrs
Land 12,000 sq. mtrs.
Distribution Network
Dealers = 29
70
Growth Strategies
Expand Dealer Network and Sales Coverage
Localize High Volume Products
Grow Major Account Business
Grow Warehouse Business
Mature Demand Flow Manufacturing
_____________________
Source: WITS 2014
13%
2%
12%
73%
2014 China Market
Class 1
Class 2
Class 3
Class 4 & 5
Hyster
28
Dual line 1 |
 Our
Partner
for
Utility
-
Hangcha
71
UTILEV production began in 2011
Class 1,3,4 and 5 UTILEV product
contract manufactured in China |
 Brazil |
 Brazil
Industry
–
3.9
%
CAGR
% of the global market
Market shifting to electric
FINAME financing on local content
73
_____________________
Source: WITS Orders Reports.
_____________________
Source: WITS.Orders Reports.
_____________________
Source: FEM, JIVA, KOCEMA, ITA, WITS as of 2014
_____________________
Source: WITS Orders Reports.
37%
48%
63%
52%
2008
2014
ICE
Electric
2%
2%
3%
2%
2%
2%
2%
-
200,000
400,000
600,000
800,000
1,000,000
1,200,000
2008
2009
2010
2011
2012
2013
2014
Brazil
Global
16,830
8,417
22,913
22,560
18,786
24,381
21,166
-
5,000
10,000
15,000
20,000
25,000
30,000
2008
2009
2010
2011
2012
2013
2014
Industry Bookings
65.4%
46.7%
0.0%
10.0%
20.0%
30.0%
40.0%
50.0%
60.0%
70.0%
NMHG Total Brazil Bookings Locally
Built
% of Total Industry Locally Built |
 Brazil
Growth Strategies
Opportunities
Begin Local Production of
Class 1, 2, and 3
Grow Warehouse and Big Truck
Business
Grow Major Account Business
Enhance Strong Dealer Network
Mature Demand Flow
Manufacturing
Grow Aftermarket
•
World’s
fifth
largest
country
(1)
•
Largest economy in Latin America and
7th
largest
world
economy
(1)
•
Industrial production recovery after
monetary and fiscal adjustments
expected in 2016
•
Fundamentals bring confidence to long
term growth
NMHG Brasil
founded in 1957
Sao Paulo and Itu, Brazil
Marketing Operations
Parts Distribution Center
Manufacturing Facility
74
_____________________
(1) Source:
http://knoema.com/nwnfkne/world-gdp-ranking-2014-data-and-charts; https://www.cia.gov |
 Brazil Success
75
Converted 200+ trucks
150+ trucks
Won on global account leverage
Large full service Brazilian
logistic company
purchasing to support
various industries
Well-known, US auto
manufacturer
with
extensive brand recognition
Penetrated 11 new Reach Stacker accounts
Three large customers > €
2M
Inroads made in Brazilian
Ports, Terminals, and Rental
Fleets
with
dedicated
team
Major
Account
Victories
–
2014
Growth
2.5
times
2013
Big
Truck
Victories
–
2014
Growth
3
times
2013 |
 New
Brazil Plant and Office 76 |
 Growth in Our
Americas
Operations
Chuck
Pascarelli
Senior Vice President,
President, Americas
NACCO Materials Handling Group |
 Latin America |
 Latin
America Key Countries Dominate the Market
Latin American Industry Size Stable
Diverse Customer Mix
Latin America as % of Global Market
79
_____________________
Source: WITS Orders Reports.
_____________________
Source: WITS Orders Reports.
_____________________
Source: WITS. 2014 Orders Reports.
_____________________
Source: Internal Company estimates.
24,201
12,135
22,029
32,457
29,698
27,720
27,032
5,000
10,000
15,000
20,000
25,000
30,000
35,000
2008
2009
2010
2011
2012
2013
2014
Manufacturing
& Automakers,
25%
Home Centers/
Retail, 16%
Food &
Beverage, 15%
Paper &
Forrestry, 12%
Port, 10%
Mining, 2%
Others, 19%
3%
2%
3%
3%
3%
3%
2%
-
200,000
400,000
600,000
800,000
1,000,000
1,200,000
2008
2009
2010
2011
2012
2013
2014
Latin America
Global
Mexico
34%
Argentina
23%
Chile
12%
Columbia
6%
Peru
4%
Rest of Latin
America
21% |
 Latin
America Utility Truck Industry Latin American Utility Truck Market
7,786 units
Electric Rider
5%
I.C.E.
79%
Warehouse
16%
80
_____________________
Source: 2014 CITA
_____________________
Source: 2014 CITA
Argentina
46%
Venezula
7%
Chile
11%
Mexico
8%
Uruguay
6%
Rest of
Latin
America
22% |
 Latin
America 81
•
Growing electric segment
•
Expanding ports business
•
Three-tier demand: premium, standard, utility
Opportunities
Growth Strategies
Execute dual brand distribution
Improve dealer performance
Grow UTILEV, warehouse, and
Big Truck business
Penetrate large Latin
American-based accounts
2014 Latin America Market
_____________________
Source: WITS 2014 Orders Reports.
Premium
Standard
Utility
_____________________
Indicative Map Only. Company’s estimate of predominance of type of
demand 10%
9%
21%
60%
Class 1
Class 2
Class 3
Class 4 & 5 |
 Success in Improving Warehouse Position
Largest retail company in Chile
and the third largest listed retail company in Latin America
with over 1000 stores.
•
Create a focus and
passion within our
dealer network to sell
our products and
solutions
•
Offer the strongest
warehouse product line
in the industry
Focus
Success
82
•
Competitor conversion
•
220
warehouse
trucks
[Class
1,
2,
&
3]
•
Telematics strategy supports conversion
•
Maintenance through dealer |
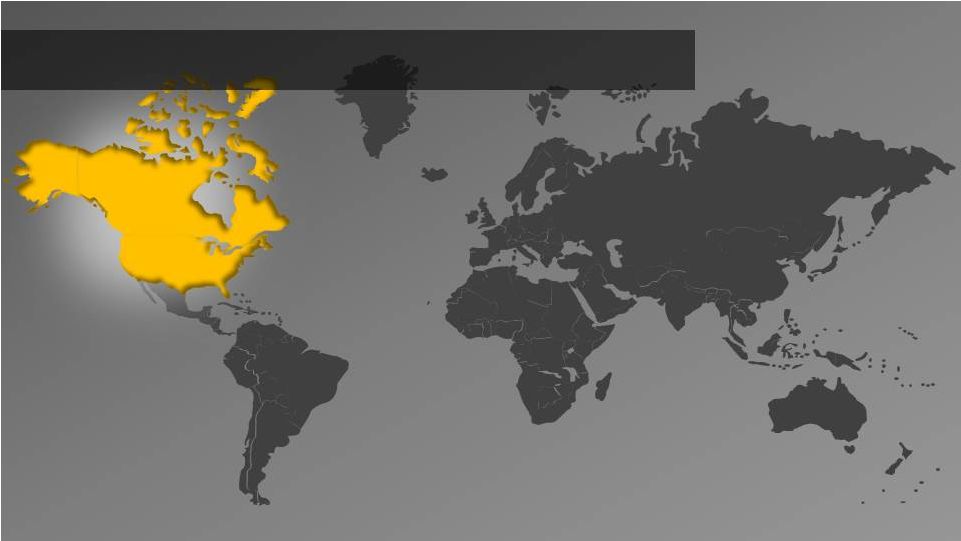 North America |
 North
American Market Business Unit Approach Drives Focus
North American Industry Steady Growth
Diverse Customer Industry Mix
North America as % of Global Market
Electric
60% of units
40% of revenue
ICE
40% of units
60% revenue
Big
Trucks
2% of ICE
units, but
9% of
overall
revenue
84
_____________________
Source: WITS.Orders Reports.
_____________________
Source: WITS.Orders Reports.
_____________________
Source: Internal Company estimates.
_____________________
Represents Hyster-Yale North American unit shipments by industry
Manufacturing
27%
Wholesale Distribution
14%
Food & Beverage
13%
Rental
10%
Home Centers/Retail
11%
Freight & Logistics
10%
Paper
6%
Other
9%
18%
18%
17%
17%
19%
20%
20%
-
200,000
400,000
600,000
800,000
1,000,000
1,200,000
2008
2009
2010
2011
2012
2013
2014
North America
Global
159,279
98,338
136,050
169,589
181,191
200,939
219,444
0
50,000
100,000
150,000
200,000
250,000
2008
2009
2010
2011
2012
2013
2014 |
 Opportunities and Growth Strategies
Developing
customer awareness through account identification
Developing
customer relationships
Developing
strong brand and company identity
Developing
dealer relationships
Developing
professional salespeople
Developing
highly-trained technicians
The NMHG Experience Center
in Charlotte, North Carolina
85 |
 Strong Independent Distribution
Exclusive sales and service coverage
coast to coast
52
Hyster and
Yale dealer
organizations
362
branch
locations
4,670
technicians
106
dealer
technical
trainers
86 |
 Dealer Conversion
Third-generation, 88-year old heavy equipment company based in
southeastern United States with 1200 employees across five states
Their
Expectations
A partner with
shared values
Their
Choice
NACCO Materials
Handling Group
The
Result
Purchased a larger, lower-performing
dealership and transformed it to profitability
within 6 months
Percentage of growth in key metrics
since conversion (2011 to 2014)
87
_____________________
Source: LiftOne LLC
High-quality equipment
Market-focused features
Product support
Employee support
Customer support
Integrity
Accountability
Adaptability
Positive and engaged people
Customer driven
Sales
194%
Employees
187%
Branches
143%
Units Shipped
498% |
 Sales
Transformation Framework Sales Messaging
Sales
Execution
Sales
Process
Talent
Sales
Messaging
Technology
88
Awareness
and Account
Identification
Focused on process and cadence
Focus on customer business
Leading, coaching, and mentoring
Selling across decision maker levels
Differentiated, consistent message
Solving customer business issues |
 Success in Understanding Customer Needs
Second-largest retailer in the United
States
With over 450 membership-only warehouse club
stores in the United States
•
Solutions Groups
•
Application Centers
Focus
Success
89
•
Custom-designed product
•
Enhanced customer productivity
•
Competitor account conversion
•
Entry into new market segment |
 Success in Low Cost of Ownership
Large regional home improvement
retailer
•
Solutions focused
•
Energy/fuel consumption
•
Alternative power
•
Fleet Management
•
Intelligent design
requiring less maintenance
Focus
Success
90
•
>3,000 unit order
•
Significant fleet replacement
•
Conversion to lease financing
•
Fleet management
•
Incremental service/parts revenue |
 Success in Big Trucks
Second-busiest container port in the
United States
•
Product/Application
Management
•
Marketing & Sales
Coordination
•
Industry Focused (Sales,
Applications, Marketing)
•
Structured to expand as
industry penetration occurs
•
World class service
support
Focus
Success
91
•
25 container handlers plus future orders
•
Hyster absent from port for over 10 years
•
Regained confidence of customer base
•
Collaborative effort between Hyster and local dealer
|
 Growth in Our
EMEA
Operations
Ralf A. Mock
Senior Vice President
Managing Director
Europe, Middle East and Africa
NACCO Materials Handling Group |
 Europe, Middle East, and Africa |
 EMEA
Market 94
Markets are recovering
Stable contributor to world markets
Continuous shift to electrics
Stable volumes throughout markets
_____________________
Source: WITS. Orders Reports.
_____________________
Source: WITS.Orders Reports.
_____________________
Source: WITS. Orders Reports.
_____________________
Source: WITS. Orders Reports.
296,080
179,812
220,119
264,003
247,043
245,719
273,624
70,911
20,538
39,881
55,252
54,398
58,794
58,775
43,984
39,298
48,926
49,890
52,829
55,410
50,000
100,000
150,000
200,000
250,000
300,000
350,000
400,000
450,000
2008
2009
2010
2011
2012
2013
2014
Total Bookings
Western Europe
Eastern Europe
Middle East & Africa
47%
41%
38%
38%
37%
35%
36%
200,000
400,000
600,000
800,000
1,000,000
1,200,000
2008
2009
2010
2011
2012
2013
2014
EMEA
Global
72%
17%
11%
2008
Western Europe
Eastern Europe
Middle East & Africa
69%
75%
31%
25%
0
100,000
200,000
300,000
400,000
500,000
2008
2014
ICE
Electric
71%
15%
14%
2014
22,4783
- |
 Transformation of the Dealer Network
95
25% of the EMEA market
restructured in 2014
EMEA Distribution
165
dealers
440
locations
871
salespeople
3,482
technicians
Significant restructuring
since 2009
Dual-Brand: 12% of industry
Single-Brand: 54% of industry
Competitor Conversion
Management Buy Out |
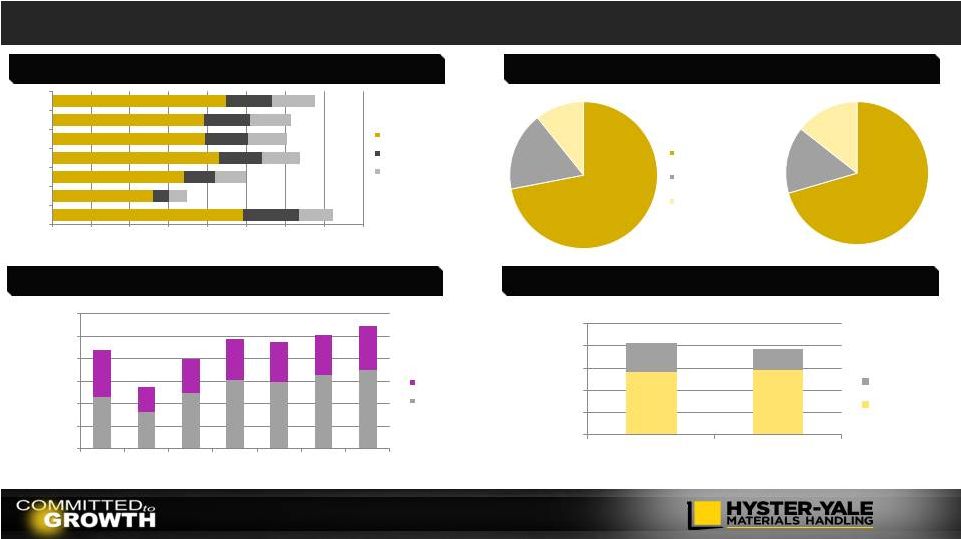
 Western Europe
96
Recovery has been steady
Slight declining contribution
Continual shift to electrics
_____________________
Source: WITS. Orders Reports.
_____________________
Source: WITS. Orders Reports.
_____________________
Source: WITS. Orders Reports.
_____________________
Indicative Map Only. Company’s estimate of predominance of type of demand
Applications drive need for premium product
34%
33%
28%
27%
26%
24%
25%
-
200,000
400,000
600,000
800,000
1,000,000
1,200,000
2008
2009
2010
2011
2012
2013
2014
Western Europe
Global
78%
83%
22%
17%
0
50,000
100,000
150,000
200,000
250,000
300,000
2008
2014
ICE
Electric
296,080
179,812
220,119
264,003
247,043
245,719
273,624
0
50,000
100,000
150,000
200,000
250,000
300,000
350,000
2008
2009
2010
2011
2012
2013
2014
Total Bookings
Premium
Standard
Utility |
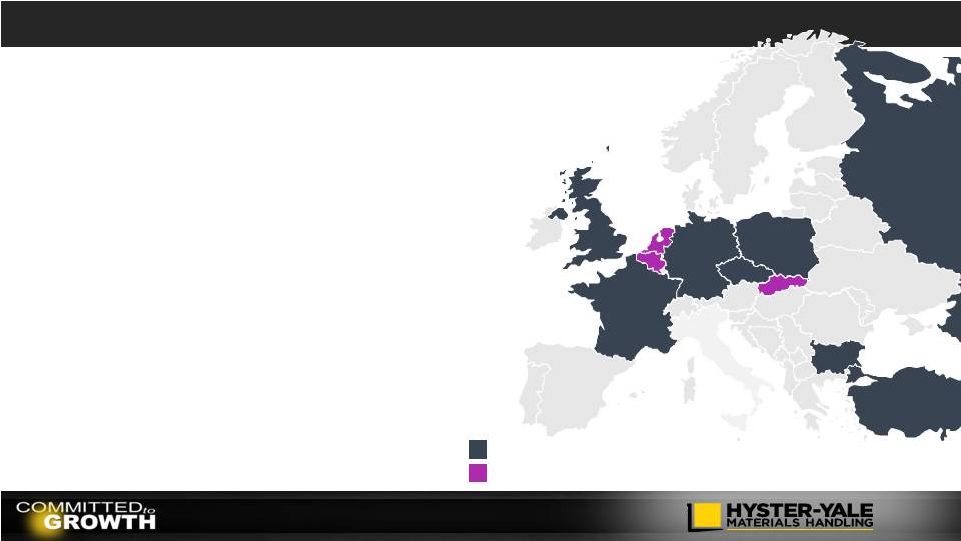
 UK
Ireland
France
Spain
Portugal
Germany
Neth.
Belgium
Italy
Switz.
Austria
Hungary
Slovakia
Poland
Ukraine
Russia
Slovenia.
Croatia
Bosnia
Serbia
Romania
Moldova
Belarus
Latvia
Estonia
Lithuania
Denm.
Norway
Sweden
Finland
Bulgaria
Macedo.
Albania
Greece
Malta
Turkey
Biggest Markets in Western Europe
97
27%
19%
12%
11%
7%
5%
_____________________
Source: WITS. 2014 Orders Reports.
Units and percentage of Western Europe market
Netherlands
Spain
Italy
UK
France
Germany |
 Enhance
Independent
Distribution
–
Western
Europe
98
Germany
France
United Kingdom
Italy
Spain
New Hyster
network of 16
dealers
Strengthened
support team
Enhanced
major accounts
Strong Hyster
dealer
Rental concept
with a solid
truck base
Strong dual line
dealer
Brand and
industry focus
Dedicated teams
Flexible fleet
Strong Hyster
dealer
Dual brand
dealer in Milan
& Bergamo
Long-term
established
Hyster dealer
Major account
presence
Established
Yale network
Strengthened
with 2 extra
dealers
Entrepreneurial
Yale network
New national
account focus
Strong dual line
dealer
Brand and
industry focus
Dedicated teams
Flexible fleet
Established
Yale network
Dual brand
dealer in Milan
& Bergamo
New national
account focus
Established
Yale network
Strong local
presence
OEM Support: Industry Strategy, Account Identification, Big Trucks, Major Account
Focus |
 Western Europe Successes
Successes
99
Customer conversions in automotive, packaging and food
Major Accounts
Gain conquest business with large logistics company and
major automotive manufacturer
Warehouse
Penetration
of
ports
and
metals
industry
–
application
solutions
Big Truck
111
dealers
–
17
new
in
2014
5 dealer conversions from competition in 2014
Coverage
Focus
Launch of new reach truck and power pallet truck range
Product |
 Eastern Europe
100
Steadily recovering market
Stable part of global market
Dramatic shift to electrics
Applications require standard and utility trucks
_____________________
Source: WITS. Orders Reports.
_____________________
Source: WITS. Orders Reports.
_____________________
Source: WITS. Orders Reports.
_____________________
Indicative Map Only. Company’s estimate of predominance of type of demand
70,911
20,538
39,881
55,252
54,398
58,794
58,775
10,000
20,000
30,000
40,000
50,000
60,000
70,000
80,000
2008
2009
2010
2011
2012
2013
2014
Total Bookings
8%
4%
5%
6%
6%
6%
5%
-
200,000
400,000
600,000
800,000
1,000,000
1,200,000
2008
2009
2010
2011
2012
2013
2014
Eastern Europe
Global
51%
70%
49%
30%
-
10,000
20,000
30,000
40,000
50,000
60,000
70,000
2008
2014
ICE
Electric
Premium
Standard
Utility |
 Eastern Europe Market
101
12%
6%
4%
4%
_____________________
Source: WITS. 2014 Orders Reports.
Units and percentage of Eastern Europe market
UK
Ireland
France
Spain
Portugal
Germany
Neth.
Belgium
Italy
Switz.
Austria
Hungary
Slovakia
Poland
Ukraine
Russia
Slovenia
Croatia
Bosnia
Serbia
Romania
Moldova
Belarus
Latvia
Estonia
Lithuania
Denm.
Norway
Sweden
Finland
Bulgaria
Macedo.
Albania
Greece
Malta
Turkey
33%
26%
Czech Rep.
Slovakia
Romania
Hungary
Cz Republic
Poland
Russia |
 Enhance
Independent
Distribution
–
Eastern
Europe
102
Russia
Poland
Czech & Slovak
Republic
Hungary
Romania
Strong Hyster
rental dealer
Big Truck
presence
Major account
successes food
industry
Reinforced
Hyster presence
Big Truck focus
Major Accounts
success in food
distribution
New dealer for
Hyster
Major Accounts
success in
automotive industry
Hyster long-
established
dealer
Hyster long-
established
Strong presence
in Major
Accounts
Entrepreneurial
Yale network
Successes with
standard and
utility product
Strong Yale
presence
Major Accounts
focus
Major Accounts
warehouse
success food
distribution
New ownership Yale
Slovak Republic
Strong dealers
Major Accounts
focus
New dealer
competitor
conversion
New Yale dealer
appointment in
2015
OEM Support: Industry Strategy, Account Identification, Big Trucks, Major Account
Focus |
 Eastern Europe Successes
Successes
103
Paper, automotive, food and wholesale customers
Major Accounts
New customers in logistics and established relationship
with major food distributor in Poland
Warehouse
Ports, metal and wood industry business as well as tire
handling solutions for mining industry
Big Truck
22 dealers/ 2 new dealers in 2014
1 dealer conversion from competitors in 2014
Coverage
Focus
Standard and utility product in Russia
Product |
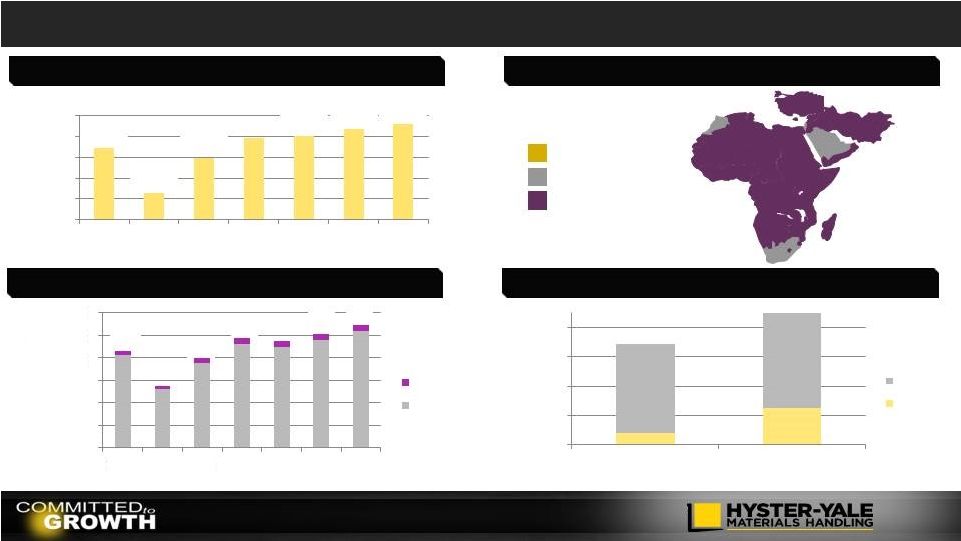 Middle East and Africa
104
Volumes surpass the previous peak
Stable contributions to global market
ICE focus but electric is growing
Wide variety of truck segments
_____________________
Source: WITS. Orders Reports.
_____________________
Source: WITS Orders Reports.
_____________________
Source: WITS. Orders Reports.
_____________________
Indicative Map Only. Company’s estimate of predominance of type of demand
Premium
Standard
Utility
32%
40%
68%
60%
10,000
20,000
30,000
40,000
50,000
2008
2014
ICE
Electric
5%
4%
5%
5%
5%
5%
5%
200,000
400,000
600,000
800,000
1,000,000
1,200,000
2008
2009
2010
2011
2012
2013
2014
MEA
Global
43,984
22,478
39,298
48,926
49,890
52,829
55,410
10,000
20,000
30,000
40,000
50,000
60,000
2008
2009
2010
2011
2012
2013
2014
Total Bookings
- |
 Niger
Mauritania
Algeria
Libya
Sudan
Tunisia
Chad
Mali
Egypt
West Sahara
Morocco
Eritrea
Sierra Leone
Liberia
Saudi Arabia
Yemen
Iran
Israel
Oman
Biggest Markets in MEA
105
24%
14%
13%
9%
8%
6%
_____________________
Source: WITS. 2014 Orders Reports.
Units and percentage of Middle East and Africa markets
Algeria
Israel
UAE
S Africa
S Arabia
Turkey
Senegal
Guinea
Nigeria
Burkina
Ivory
Coast
Togo
Ghana
UAE
Qatar
Turkey
Iraq
Jordan
Azerbaijan
Armenia
Georgia
Somalia
Ethiopia
Namibia
Angola
South Africa
Lesotho
Swaziland
Madagascar
Mozambique
Tanzania
Botswana
Zimbabwe
Zambia
D. R.
Congo
Kenya
Cent. Africa Rep
Uganda
Congo
Gabon
Cameroon |
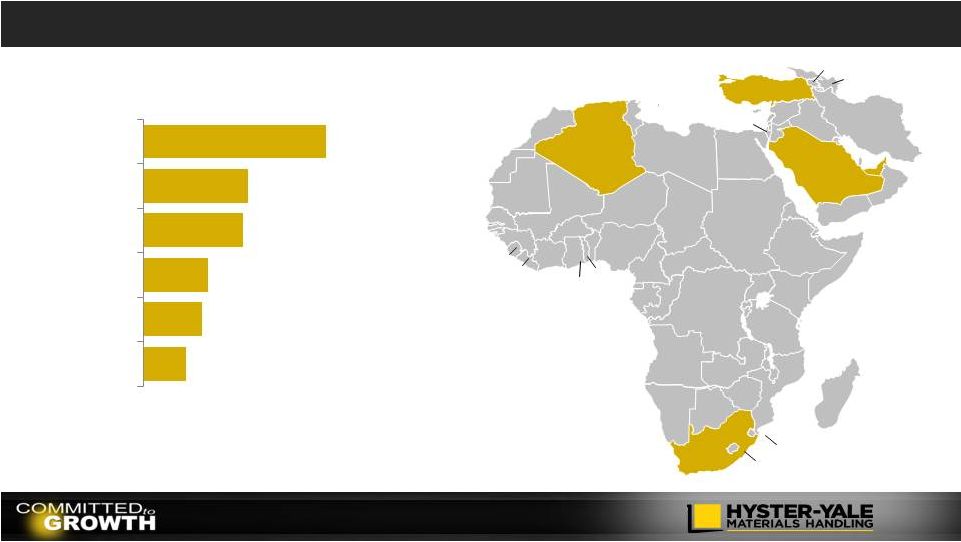
 Enhance
Independent
Distribution
–
Middle
East
&
Africa
106
Turkey
South Africa
Saudi Arabia
UAE
Israel
Reinforced
Hyster presence
Big Trucks focus
in ports and
terminals
Long-standing
presence
Long-
established
customer base
Warehouse
focus
Long-established
Hyster presence
Big Trucks focus
Strong dealer
performance
Logistics and
Warehouse
focus
Established
Hyster dealer
Big Truck
presence
Strong new Yale
dealer presence
with a strong
new partner
Special focus on
rental
Strong Yale dealer
growing rapidly
Success with
government
entities
Long-standing
Yale dealer
OEM Support: Industry Strategy, Account Identification, Big Trucks, Major Account
Focus |
 Middle East and Africa Successes
Successes
107
Food company in Saudi Arabia
Major Accounts
New reach truck for major automotive company and
targeting VNA consultative solutions
Warehouse
Container handlers for global major account in UAE,
further ports business
Big Truck
32 dealers/ 2 new dealers in 2014
Coverage
Focus
Standard and utility product introduced
Product |
 The
Products and the
Technology to
Help us Grow
Rajiv K.
Prasad
Senior Vice President,
Product Development,
Manufacturing and Supply
Chain Strategy
NACCO Materials Handling Group |
 Product Philosophy
Full product line
Segmented solutions
Scalable platforms
Leverage core assets
Technology partners
Fit for market and
application
Reliability and durability
Energy efficiency
Operator ergonomics
Fill the factories
Support growth
initiatives
Differentiation
Innovation
Guiding Product
Philosophy
Key Product Attributes
Product Portfolio Focus
109 |
 Strong Trucks
110 |
 Our
Product Range Class 1
Electric Counterbalanced Rider Trucks
Class 2
Electric Narrow Aisle Trucks
Class 3
Electric Pallet Trucks
Class 4
Internal Combustion Engine (cushion tire)
Class 5
Internal Combustion Engine (pneumatic tire)
111 |
 Manufacturing Strategy
Manufacturing
Centers of Excellence for
Key Systems
Process to Determine Core
Competencies
Globally Deployed NMHG
Production System
Supply Chain
Supplier Location
Flexibility
Low Cost Country
Sourcing
Quality <500 PPM
Truck Assembly
In Markets of Sale
Global Centers Where
Scale Has Leverage
Partners in Emerging
Markets
112 |
 Transformation of Supplier Quality
SQE
Resources
2001
(2)
2014
(32)
2010
(24)
2006
(14)
Global Quality PPM
Supplier Quality Organization
Global Resources Focused on Supplier
Quality and Supplier Development
ZERO
DEFECT
CULTURE
113
_____________________
Source: Company’s incoming parts quality data collected at each plant
3,028
2,536
1,685
1,558
1,037
600
397
2008
2009
2010
2011
2012
2013
2014 |
 SQDCME
Assembly
DFT
Demand Flow Technology (DFT)
Assembly Method
•
•
•
Process, Methods, and Measures
Measures
•
•
•
•
114
Customer Demand Driven
Mixed Model Flow Based on Lean Principles
Sequence of Events (SoE), Operation Methods Sheets
Order Configuration and Scheduling
Slotting -
6 weeks Frozen, Factory Build -
2 weeks Frozen
Line Staging and Sequencing 2-3 Days in Advance
31 total in SQDCME categories
Warranty: <10 Hrs. and <100 Hrs. Warranty
Faults per 100 Trucks
Effectivity, Productivity, Conversion Cost |
 Meeting Customer Needs with Special Engineering
115
Aux Hydraulic Cooler
Bigger/Faster Fan
Radiator Cleaning
Point
Solutions
Holistic
Solutions
VD Hydraulic Pump
Hydraulic Fan
Auto Reversing
Result
Cool truck
Issue
Overheating
Unmet
Needs
Customer Need
Met
NMHG Solutions |
 Segmentation –
Expanding Standard Range
116
Premium
Comprehensive Premium Truck Range
Application Fit, Strong Trucks and Productivity
High Intensity Usage and Load to Capacity
Standard
Analysis to Identify Standard Segment
Benchmark to Understand Requirements
Expanding Product Offerings
Utility
Low Acquisition Cost
Low Intensity/ Hour Usage
Partner to Offer Solutions
Price
Right Truck
at the
Right Price
for Right
Applications |
 Define truck and
non-truck solutions
Provide strategic
advantage for NMHG
Salespeople seen as
solutions providers
Understanding Customer Needs
Application Center Approach
117 |
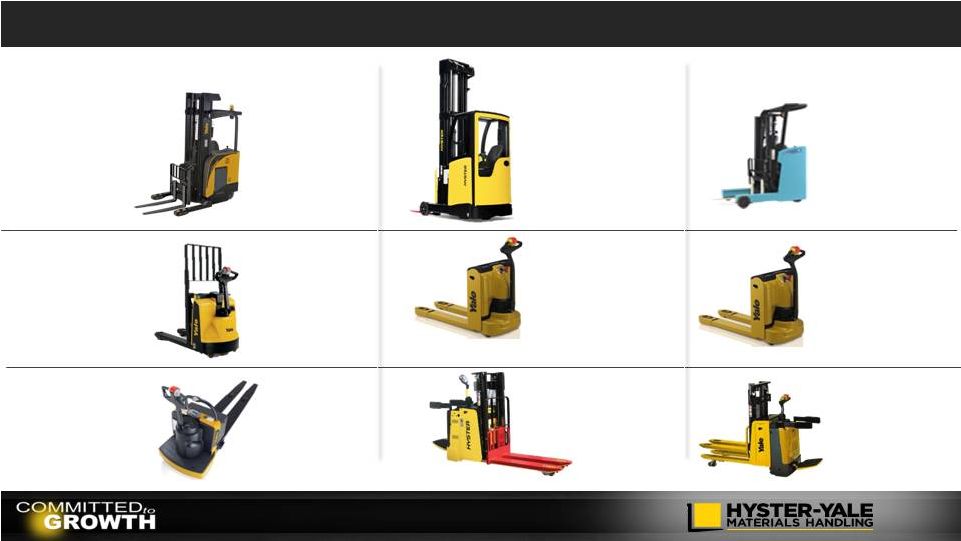 Warehouse Products
118
Sit with
Moving Mast
Open Skid
Pallets
Flip-down
Platforms
Stand with
Pantograph
Bottom Board
Pallets
Fixed
Platforms
Reach
Pallet
Riders
Japan –
Stand with
Moving Mast
Mainly
Open Skid
Pallets
Flip-down
Platforms
North America
EMEA
JAPIC |
 Counterbalanced Products
1.5T
to 9.0T
LP
Diesel Electric
Capacities
Tire Types
Power
119
Pneumatic
Cushion |
 Big
Truck Products Fork Lift
Trucks
8 to 48T
Tier IV Emission Engines
Heavy Duty Transmissions
Load Sensing Hydraulics
Types
Capacities
Features
8 High Empty
6 High Laden
120
Container
Handlers |
 Leverage Partnerships –
Technology Lithium-ion
Lithium-ion Based
Battery
Replacement
Modules
Class 1, 2 and 3
Fast Charge Capable
Energy Efficiency, Enhanced
Productivity
Each Module with Built-in
Protection
Partner with Leading
Automotive Supplier
Expected
Start of Production
Q4 2015
121 |
 Why
Invest in Hydrogen Fuel Cells? 122
Customer Drivers
Economic Fuel Sources
Operational Efficiencies
Environmental Impact
The Present
•
LP
•
Diesel
•
Lead Acid Batteries
Customers looking for energy
alternatives with:
Lead acid batteries:
•
Compressed
natural
gas
•
Lithium-ion
batteries
•
Hydrogen
fuel
cells
Fuel cells most promising solution for:
Fuel cell technology:
The Future
Higher
efficiencies
Improved
productivity
Reduced
emissions
Not
a
“zero
emission”
solution
Ineffective
charging
processes
Life
issues
if
not
maintained
High
intensity,
multi-shift
applications
Environmentally
sensitive
applications
Meets
zero
emission
mandate
Validates
technology
and
provides
scale
for
components |
 Nuvera Technology
Patents across hydrogen value chain
Fuel cell stack a strong fit for industrial mobility
Steam methane reformation based hydrogen generation
Future Electro chemical compressor using fuel cell concepts
123
Metallic cell structure for robustness
Open flow field for high power density
On-site appliance
Efficient and durable solution |
 Nuvera PowerEdge
Class 1, 2 and 3
Voltages 24, 36, 48 and 80
Stack sizes (KW)2, 8, 16 and 19
Lithium-ion or Super Capacitor
Liquid Cooled for Above 3KW
Air Cooled for Smaller Class 3
Hydrogen Storage (Kg) 0.7 to 3.4
Fuel Cell Based
Battery Replacement
Modules
124
Expected
Start of Production
Q4 2015 |
 Nuvera
Technology
Scott
Blanchet
Vice President of Product
Management
Nuvera |
 Why
Hydrogen and Fuel Cells? Hydrogen is
portable
electricity
electron
proton
Hydrogen is a clean
carrier that stores
energy
Hydrogen provides
the benefits
of
electricity…
…the convenience
of fuel
126 |
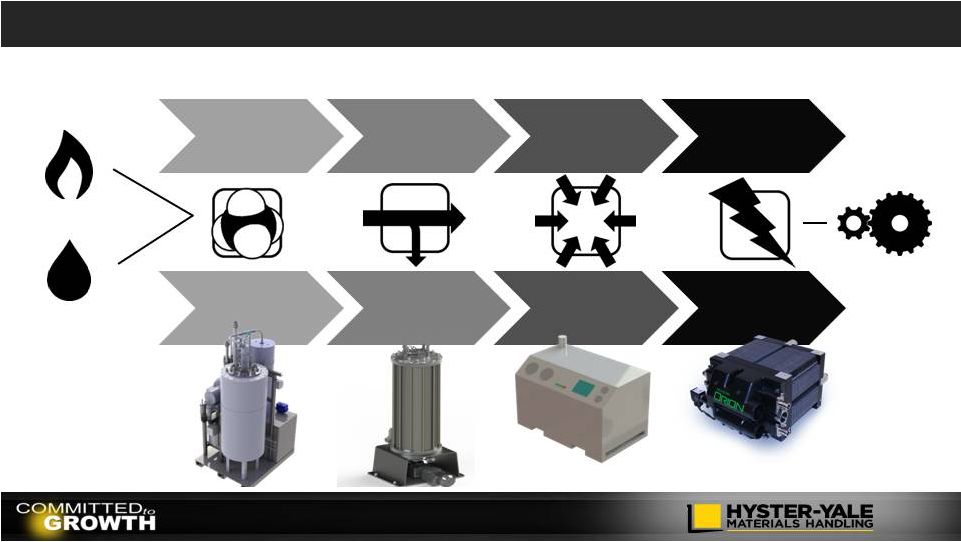 Why
Nuvera? Water
ENERGY
Methane
127
WORK
GENERATE
PURIFY
COMPRESS
USE
Reformer
Pressure-
Swing
Adsorber
Advanced
Compressor
Fuel Cell
Enabling Technologies Span Entire Hydrogen Value Chain |
 How
Does a Fuel Cell Work? 4
-
4
+
protons
Water
Hydrogen
Oxygen
Electricity
128 |
 How
Was Orion ®
Developed?
First Stack
(1993)
Andromeda
TM
(2003 –
2011)
•
Metallic construction since 1993
•
Patented open flow field architecture
•
High durability and low cost
XDS-900
(2004 -
2011)
(2010 and ongoing)
(2016+)
Gen2
129 |
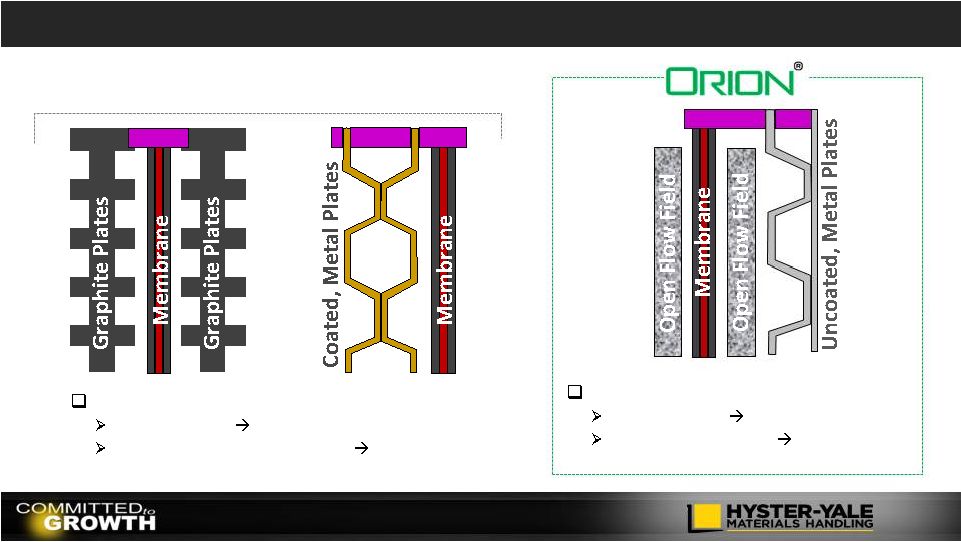 How
Is Orion ®
different?
Open flow fields:
Free-breathing
higher power density
Uniform MEA support
higher durability
Land-channel flow fields:
Oxygen-limited
lower
power density
Non-uniform membrane support
lower durability
Conventional Architectures
Seals
Seals
130
Seals |
 Where Is Orion
®
Going?
131
Battery Box
Replacement
Integrated Fuel
Cell Hybrid Truck |
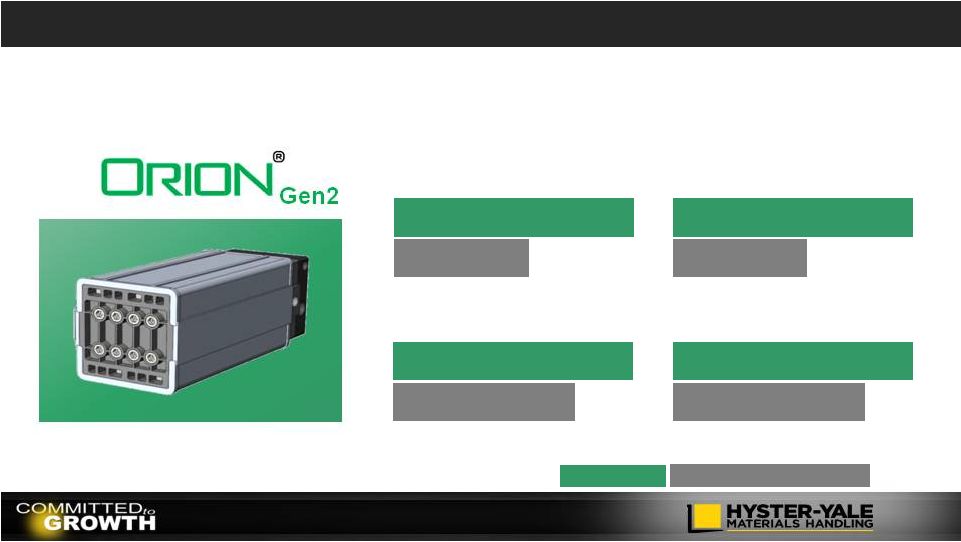 Performance
up to 1.8 W/cm
1.0 W/cm
Power Density
up to 4.5 kW/L
2.5 kW/L
Durability
up to 30% longer life
5000 hours
Specific Power
up to 2.5 kW/kg
2.0 kW/kg
Patented
technology
core
enables
a
low
cost,
compact
and
durable
stack
How Does Orion
®
Compare?
132
_____________________
2
Source: 2012 DOE Multi-Year, Research, Development and Demonstration Plan
2
_____________________
Source: Internal Company estimates |
 How
Does a Reformer Work? Water
Methane
Carbon Dioxide
Hydrogen
Heat
Heat
133 |
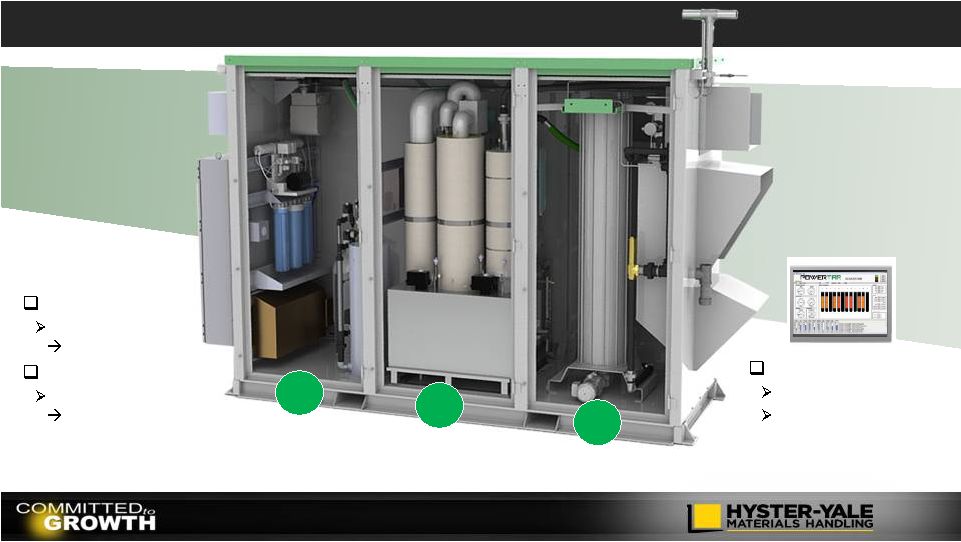 1
2
3
INPUT:
CH
4
+ H
2
0
+ electricity
OUTPUT:
H
2
Robust Reformer
Temperature cycling
durability
Compact Purifier
Small footprint
easy installation
134
What Does a PowerTap
®
Appliance Do?
Hydrogen
Purification
Steam
Reformer
Water and Gas
Purification
1
2
3
Remote Monitoring
Fleet management
100%
H
2
availability
at
the pump |
 How
Is PowerTap ®
Different?
135
Centralized Production,
Liquefaction & Delivery
Distributed Production |
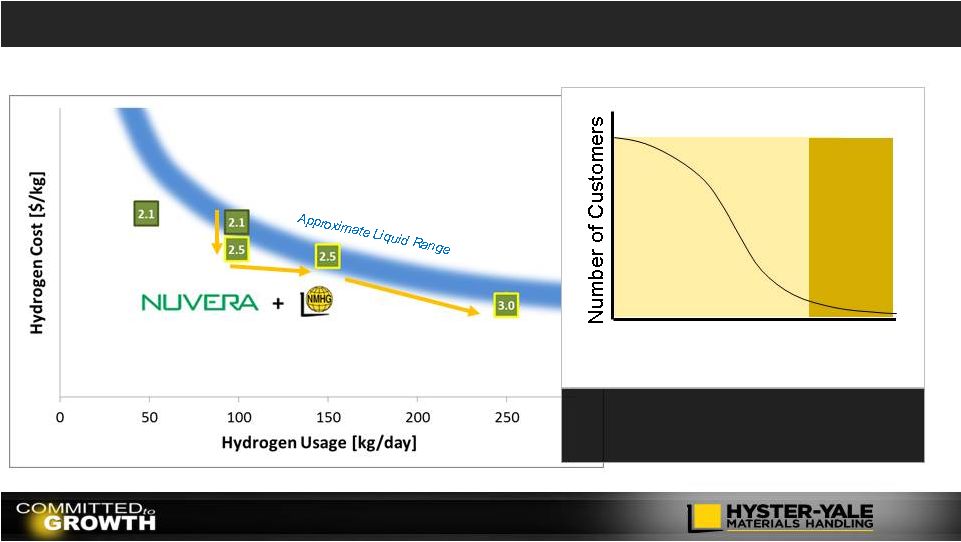 PowerTap
®
Competitive Advantage
136
PowerTap
®
Number of Lift Trucks
GEN2.x Capacity
GEN3
PowerTap 2.5+ competitive for
most lift-truck installations |
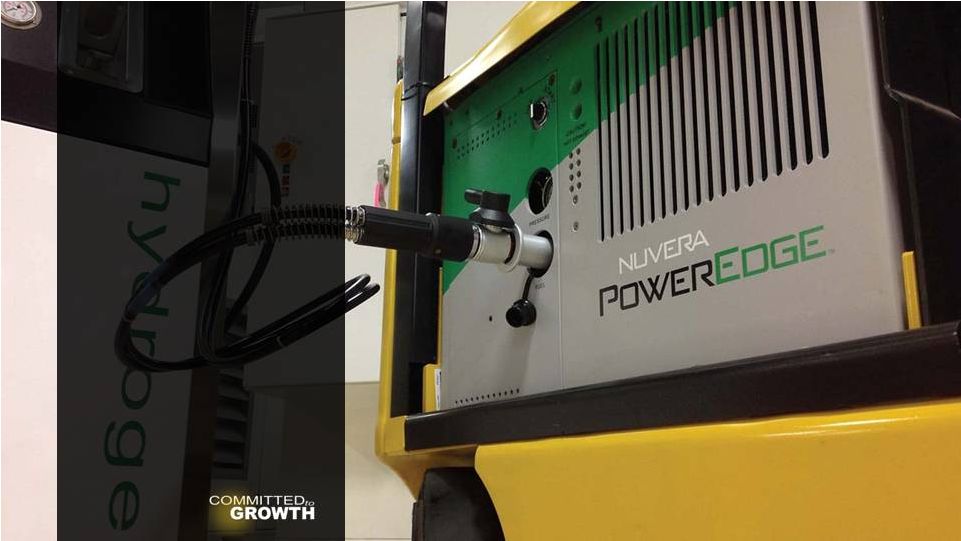 Nuvera
Business
Plan
Jon Taylor
CEO
Nuvera
Vice President, Business
Development and Financial
Planning and Analysis
NACCO Materials Handling Group |
 Complementary Strengths
Driven by Needs of
Customers
Focus on being a “Good
Partner”
Robust Product Designs
Warehouse Equipment
Low Cost of Ownership
Supply Chain Management
Understand Lift Truck
Requirements
Product Commercialization
Distribution Channels
Technology
Innovation
Patent Portfolio
Hydrogen Value Chain
Total Power Solution™
138 |
 Fuel Cell
Subsystem
Fuel Cell
Engine
Hybrid Vehicle
System
Hydrogen Mgmt.
SmartStack Control Logic
Voltage Monitoring
Electronic Control Unit
Air Mgmt. System
Cooling Pump
Water Filter
Heater
Valves/Sensors
Power Electronics
Fuel Supply System
Thermal Mgmt.
Battery
Energy Mgmt.
Traction Motor
Synergistic Experience
139 |
 TRANSPORTATION
INDUSTRIAL MOBILITY
Potential Orion
®
Markets
Fuel Cell Forklifts
Truck Auxiliary
Power Unit (APU)
& Reefer
Big Trucks/ Port
Equipment
Ground Support
Equipment
Light Duty Electric
Vehicle & Range
Extender
Fuel Cell Bus
Fuel Cell Vehicle
Aerospace
140 |
 Nuvera’s Products –
The Total Power Solution
™
141
GENERATION
DELIVERY
ELECTRIC
POWER
INDUSTRIAL
MOBILITY
NMHG + Nuvera: One stop for your hydrogen and fuel cell needs…
|
 Fuel
Cell System vs. Batteries 142
Productivity
Increase
Time saved refueling and
changing batteries
Constant Power
Power throughout shift and
improved truck electronic life
Environmentally
Clean
Minimal carbon footprint and
zero indoor emissions
Economics
Significant ROI*
Floorspace
Utilization
Recapture battery storage and
charging floor space
*Depending on application |
 Capturing More Lifecycle Value
Truck
Maint
PowerEdge
Maint
Truck
Lead Acid Battery*
PowerEdge Solution*
*Representative Total Cost of Operation based on NREL 2013 report
143
Eligible for
30% US Tax
Credit
(1)
Utility Company
NMHG/Dealer
Battery Supplier
NMHG
Utility Company
Nuvera/Dealer
NMHG/Dealer
Nuvera
NMHG
Batteries
& Charger
Energy
Fuel
(PowerTap)
Energy
(1)
Currently set to expire on 1/1/17 |
 Phase 1 –
Orion
®
1 Battery Replacement
2015
144
Expected late 2015
Gen1 |
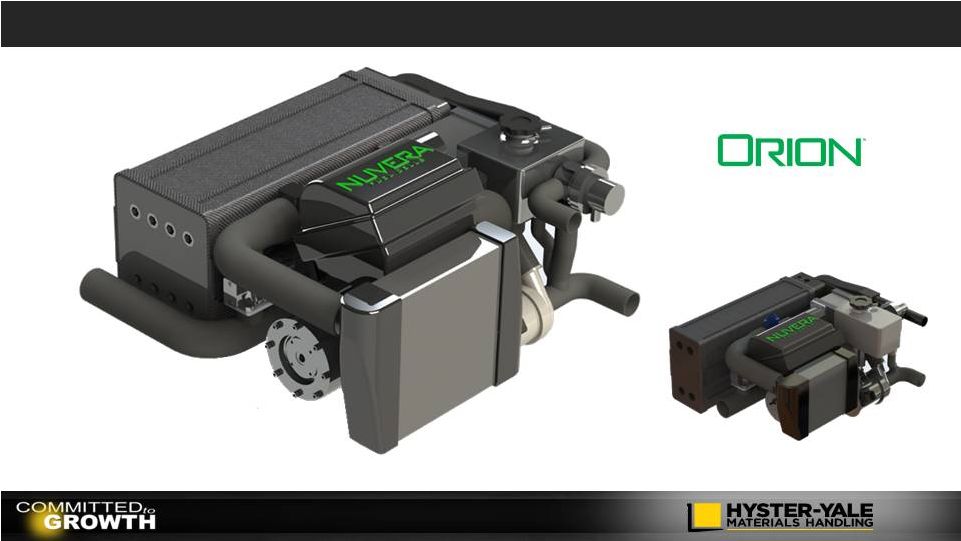 Phase 2 –
Orion
®
2 Integrated Engine
Expected Stack
Commercial Availability
2017
145
Power:
100 kW net
Weight:
110 kg
Volume:
110 liter
Power: 42 kW net
Weight: 60 kg
Volume: 82 liter
Gen2 |
 Near-Term Fuel Cell Opportunity
Market
Customer Targets
Existing Fuel Cell Users
Nuvera/ NMHG Customers
High productivity applications
Share Growth
Target Warehouse customers
Low cost of ownership
North America Market
135k units in 2014
750-1,000k unit Population
Battery replacement for
Class 1, 2, and 3 electric trucks
Economics
NMHG Revenue
Fuel Cell
Similar acquisition costs
Lower total cost of ownership
Incremental
revenue
with
H
2
fuel
Batteries
$18-20k lifetime spend
$12k for 3 batteries
$6-8k for 1 charger
Battery
Vendor
146
Conventional
Battery
Incremental
Truck Sales
Fuel cell
alternatives |
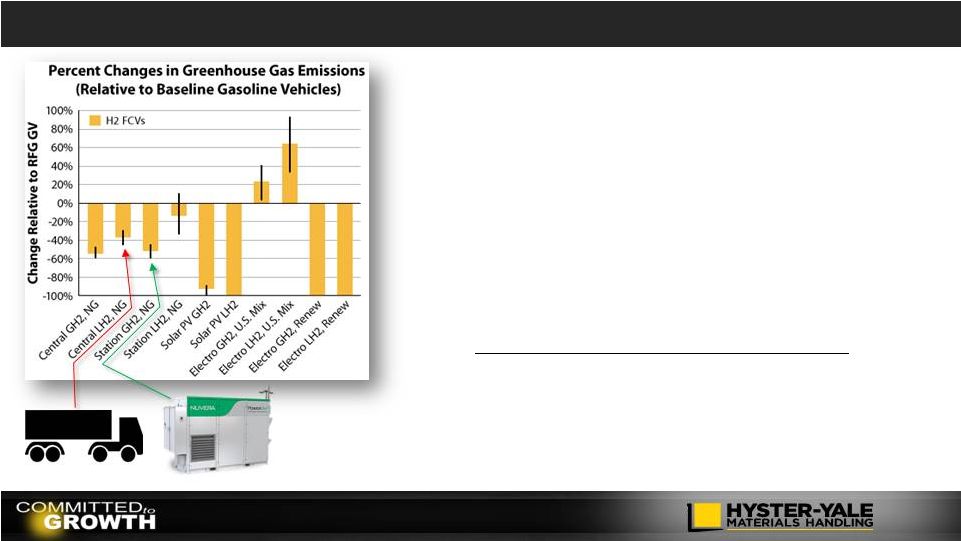 We
believe advantages of PowerTap over Competitive Hydrogen Supply are…
147
•
Low Fixed Infrastructure Cost
•
Local generation –
not dependent on deliveries
•
Modular/ Scalable to meet demand
•
Low total cost of Hydrogen for many applications
•
Delivered cost/ reliability dependent upon location
PowerTap Target Total cost per Kg
•
Near Term $10-12
•
Mid Term $8-10
•
Long Term $6-7
_____________________
Source: http://www.afdc.energy.gov/vehicles/emmisions_hydrogen.html
H
2 |
 PowerTap
®
Markets
Over
155,000
refueling events
Over
125,000 kg
produced
6
active sites
4
new sites
scheduled
INDUSTRIAL MOBILITY
148
Fuel Cell Forklifts
Package Delivery
Trucks
Truck APU & Reefer |
 Low
cost solution in heavy duty applications Increasing customer demand for
battery alternative Market
gaining
momentum
–
Improve
productivity
Incremental sales and service opportunities
Zero emissions alternative to ICE
Growing
demand
for
low
emissions
–
Australia,
Japan,
China
Complementing NMHG’s Strategic Initiatives
Low Cost of Ownership
Understanding Customer Needs
Improving Warehouse Position
Strong Independent Distribution
Big Truck Position
Succeed in Asia
149 |
 Financial
Overview and
the Importance
of Volume
Growth
Kenneth C.
Schilling
Senior Vice President
Chief Financial Officer
Hyster-Yale Materials Handling, Inc.
NACCO Materials Handling Group |
 2014
Fourth Quarter and Full Year Highlights Slight revenue decline driven by
unfavorable currency partially offset by higher unit shipments and mix shift
to higher priced units
Slight increase in operating results from forklift truck business:
+ Higher unit volume and parts sales, product margin mix,
lower material costs and incentives
Nuvera acquisition resulted in $2.4m in severance and
acquisition costs and $0.7m in operating expenses in Q4 2014.
2014 Fourth Quarter Highlights
2014 Full Year Highlights
FY revenue increase driven by sales of higher-priced units and
increased unit and parts volume, partially offset by unfavorable
currency
Comparable operating results for the forklift business:
+ Higher unit volume and parts sales, lower material and
SG&A costs and lower incentives
2014 Fourth Quarter
Full Year 2014
Revenue
$710.7
100.0%
$2,767.2
100.0%
Operating Profit
33.2
4.7%
148.8
5.4%
Net Income
26.4
3.7%
109.8
4.0%
EBITDA
$40.7
5.7%
$182.6
6.6%
($ in millions)
Unfavorable currency, declines in unit pricing and higher
employee related costs, particularly US healthcare
Nuvera acquisition resulted in $2.4m in severance and acquisition
costs and $0.7m in operating expenses in 2014. Brazil building gain
$17.7m pretax or $11.5m after tax gain.
Offset by currency, higher warranty and employee-related
costs, particularly US healthcare
151 |
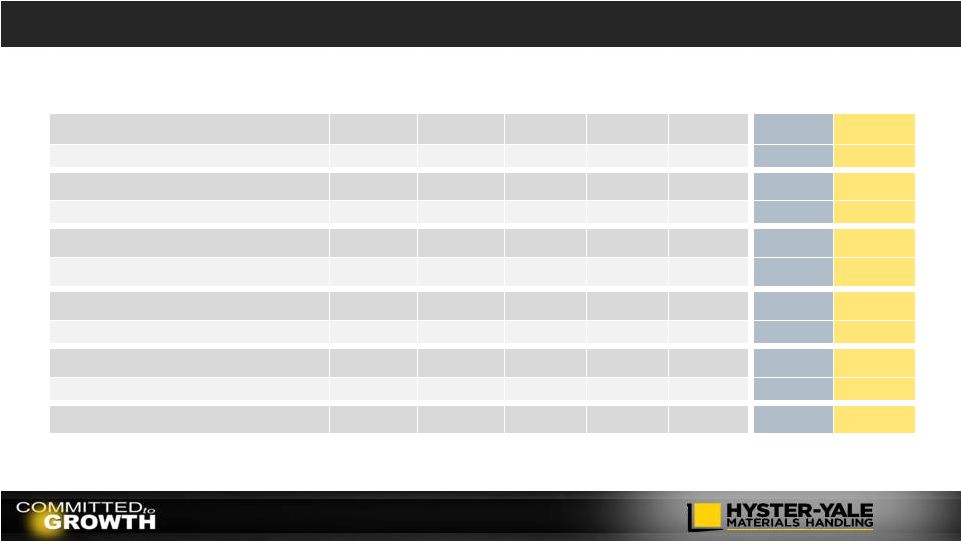 Earnings Summary 2010 -
2014
2010
2011
2012
2013
2014
Prior
Peak
2007
Variance
to Prior
Peak
Unit Shipments
60.0
79.7
76.9
85.5
87.6
90.9
(3.3)
YOY%
32.8%
(3.6)%
11.2%
2.5%
(3.6)%
Revenues
$1,801.9
$2,540.8
$2,469.1
$2,666.3
$2,767.2
$2,719.7
$47.5
YOY %
41.0%
(2.8)%
8.0%
3.8%
1.7%
Operating
Profit
(1)
$46.1
$110.0
$111.7
$134.3
$148.8
$57.3
$91.5
% of Revenues
2.6%
4.3%
4.5%
5.0%
5.4%
2.1%
3.3%
Adjusted
Operating
Profit
(2)
$50.3
$110.0
$111.7
$134.3
$134.2
$57.3
$76.9
Adjusted % of Revenues
2.8%
4.3%
4.5%
5.0%
4.8%
2.1%
2.7%
Net Income
(1)
$32.4
$82.6
$98.0
$110.0
$109.8
$39.3
$70.5
% of Revenues
1.8%
3.3%
4.0%
4.1%
4.0%
1.4%
2.6%
EBITDA
(1)
82.3
146.8
144.0
164.8
182.6
106.1
76.5
($ in millions)
_____________________
(1)
Operating
Profit,
Net
income
and
EBITDA
for
2014
include
a
$17.7
million
pre-tax
gain
on
the
sale
of
the
Brazil
land
and
facility.
(2)
Adjusted
Operating
Profit
and
EBITDA
are
non-GAAP
measures
and
should
not
be
considered
in
isolation
or
as
a
substitute
for
GAAP
measures.
For
discussion
of
non-GAAP
items
and
the
related
reconciliations
to
GAAP
measures,
see
information in
the Appendix at the end of this presentation.
152 |
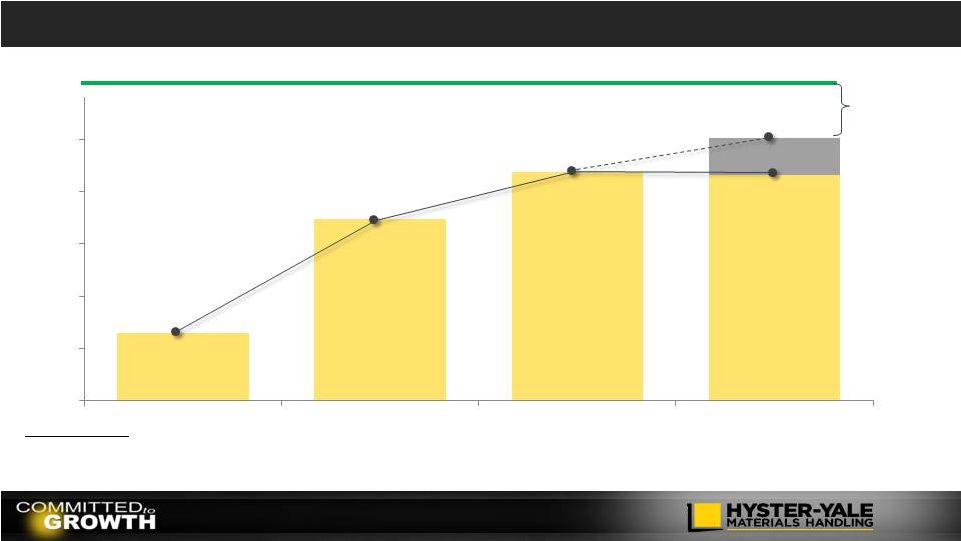 Operating Profit Trends and % of Sales
Prior Cycle Market Peak
Mid-Cycle Market
153
7% TARGET
2.1%
4.5%
4.8%
5.0%
5.4%
($ in millions)
1.6%
Gap Closure
$57.3
$111.7
$134.3
$134.2
(2)
$148.8
(1)
$25
$50
$75
$100
$125
$150
2007
2012
2013
2014
(1)
Operating Profit as reported
(2)
Adjusted Operating Profit, which excludes a $17.7 million pre-tax gain on the sale
of the Brazil land and facility and $3.1 million of expenses related to the Nuvera acquisition, is a non-GAAP measure and should not be
considered
in
isolation
or
as
a
substitute
for
the
GAAP
measure.
Management
believes
that
this
measure
assists
the
investor
in
understanding
the
results
of
operations.
For
discussion
of
non-GAAP
items
and
the
related
reconciliations to GAAP measures, see information in the Appendix at the end of this
presentation. |
 Working Capital, Cash Flow and
Capitalization
Year Ended December 31
2010
2011
2012
2013
2014
Working Capital
(1)
$285.9
$359.2
$331.3
$328.8
$350.2
Cash
Flow
before
Financing
(2)
$39.0
$38.7
$109.2
$126.8
$55.6
Cash
$169.5
$184.9
$151.3
$175.7
$111.4
Debt
234.5
226.0
142.2
69.5
31.5
Equity
231.5
297.1
342.2
450.9
456.0
Debt
to
Total
Capitalization
(3)
50.3%
43.2%
29.4%
13.4%
6.5%
ROTCE
(4)
14.9%
26.4%
30.5%
32.7%
28.3%
($ in millions)
(1) Working Capital is defined as Accounts Receivable plus Inventory less Accounts
Payable.
(2) Cash Flow before Financing is defined as cash from operating activities less cash
from investing activities.
(4) ROTCE is a non-GAAP measure and should not be considered in isolation or as a
substitute for the GAAP measure. For discussion of non-GAAP items and the related reconciliations to GAAP measures, see information in the Appendix at the end of this presentation.
(3) Debt to Total Capitalization is defined as Debt divided by the sum of Debt plus
Equity at December 31st. Key Financial Metrics
154 |
 Key
Capital Investments 155
0.0
10.0
20.0
30.0
40.0
50.0
60.0
2010
2011
2012
2013
2014
2015
New Brazil Plant
SAP Manufacturing
Nuvera Product
Forklift
-related
$31m of depreciation burn |
 Core
ERP system is
SAP
Used for all
financial systems
and purchasing
systems
Phased
implementation of
SAP Manufacturing
across key
Americas and
Europe Hyster-Yale
Plants over the
next 5-6 years.
Ramos Arizpé,
Mexico
Sulligent, Alabama
Berea,
Kentucky
Nijmegen,
Netherlands
Greenville,
NC
Masate,
Italy
Craigavon,
Northern
Ireland
Cavite,
Philippines
Obu, Japan
(JV)
Shanghai,
China
Itu, Brazil
SAP Manufacturing System Investment
156
Hanoi,
Vietnam
Implemented
Implementation in Process
Implementation Pending
No Implementation Planned |
 Key
Operating Expense Investments Strategic Programs
Understand the Needs of the Customer
Low Cost of Ownership
Crack the Code in Warehouse
Leader in Independent Distribution
Succeed in Asia
Big Truck
Sales Organization Enhancement
Nuvera Fuel Cells
PowerEdge
Battery box fuel cell replacements powered by
Orion
®
Fuel
Cells
New fuel cell stack for inclusion in new fuel cell
dedicated lift truck line
PowerTap
®
On-demand hydrogen generation and fuel
capability
1
Orion
®
2
Strategic Programs for the Forklift
Truck
Business
Nuvera Key Operating Expense
Investments
157 |
 2015
Earnings
Perspective
-
Forklift
Truck
Business
Markets
Global Growth
Rates to
Decelerate
Modest Growth
Western Europe,
Asia-Pacific, and
China
Broadly Flat
Americas, Eastern
Europe, Middle
East, Africa, and
Japan
Unit and
Parts
Volumes
Expects a modest
increase in Unit
Volume and Parts
Sales as a result
of Strategic
Initiatives driving
anticipated share
gain
Currency
Continued
Currency
Headwind from a
strong U.S. Dollar
Operating
Profit
Marginal
Commodity Cost
increases are
expected to offset
with price
increases.
Expect weak Q1
results due to
Brazil plant move
which will be
recovered in later
quarters of 2015.
Income
Taxes
Increase Global
Tax Rate as a
larger portion of
Pre-tax Earnings
are earned in the
Americas with
higher US and
Brazilian Tax
Rates than Global
Rate.
Net
Income/
EBITDA
Full Year Net
Income and
EBITDA
expected to
decline
moderately in
2015.
158 |
 2015
Earnings
Perspective
-
Nuvera
Fuel
Cell
Business
Revenues
PowerEdge
Battery Box
Replacement
Product Sales
begin at end of
2015.
Net Loss/
EBITDA
Income Taxes
Operating
Profit/(Loss)
Development
Expenses
Expenses for
key programs in
the $22m to
$25m range for
2015.
structure will incur
approximately 40%
tax benefit. Larger
benefit if Congress
renews the R&D
credit.
and margins to
begin to offset
development
expenses over
two to three
years resulting in
a net investment
of $40m to $50m
over the multi-
year period.
2015 Net Loss is
estimated to be
$13m to $15m.
EBITDA is
expected to be
slightly less than
development cost
investment due to
small levels of
D&A.
Increasing sales
US-based cost
159 |
 Target Economics Goal and Gap to Target
7% Goal
Achieve minimum
operating profit
margin of 7% at the
peak of the current
market cycle and
7% at mid-cycle of the
next market cycle
(1)
Gap excluding Brazil Gain of 0.6% is a non-GAAP measure and should not be
considered
in
isolation
or
as
a
substitute
for
the
GAAP
measure.
Management
believes
that
this
measure
assists
the
investor
in
understanding
the
results
of
operations.
2014 Gap to Target Economics
Actual Operating Profit Margin
5.4%
Margin Variances
0.3%
Unit margin
1.1%
Parts/other
(0.8%)
Volume Variances
1.9%
Manufacturing variances/other
1.2%
Operating Expenses
0.7%
Brazil Gain
(0.6%)
Operating Profit % Gap
1.6%
Gap Excluding Brazil Gain
2.2%
Operating Profit $ Opportunity
$61m
Target
Economics
gap closure
can be
achieved by…
Increased margin
on ICE trucks
Segmentation
Low Cost of Ownership
Unit volume
Stronger Industry
+ Share Growth
= Volume Leverage
(1)
(1)
160 |
 Historical Revenue
($ in millions)
161
$1,780
$2,057
$2,400
$2,489
$2,720
$2,824
$1,475
$1,802
$2,541
$2,469
$2,666
$2,767
$0
$1,000
$2,000
$3,000
2003
2004
2005
2006
2007
2008
2009
2010
2011
2012
2013
2014 |
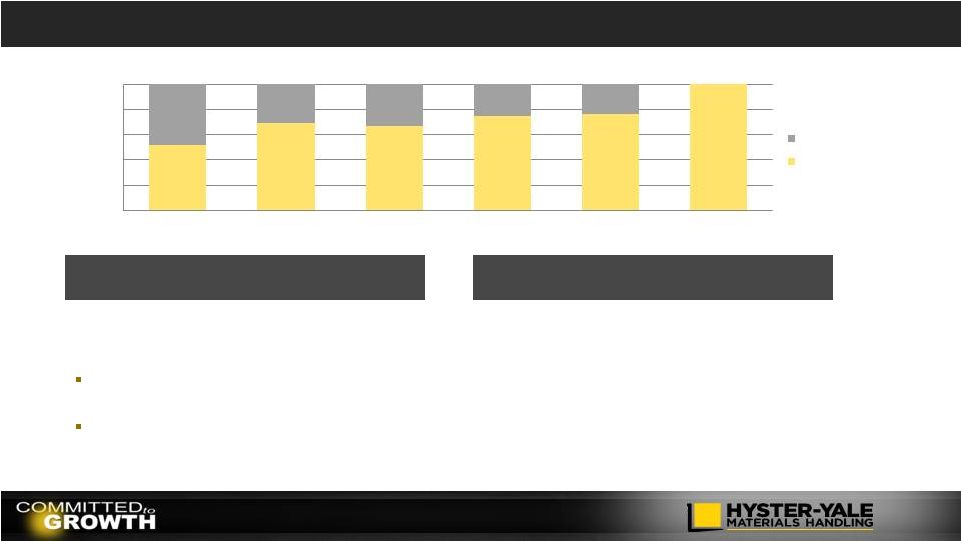 Leverage Gained from Moving Volume to Full Manufacturing Capacity
* Excludes Nuvera, UTILEV and SN products
Objective of minimum 25,000 unit volume
increase from 2014 levels
Approximately $125m manufacturing fixed cost
$600m additional revenue
$70m incremental operating profit
Ability to produce 115,000* units annually
At capacity:
Approximately $30m additional fixed cost
absorption
Operating costs aligned with targets at
increased sales volumes
162
48%
31%
33%
25%
24%
0%
20%
40%
60%
80%
100%
2010
2011
2012
2013
2014
2017-2018
Unused Capacity
Unit Volume |
 Substantial Cash Being Returned to Stockholders
Stockholder Returns
Quarterly dividend established in November 2012
$50 million stock repurchase program announced in December 2012
2013
2014
Annual Dividends
$16.7m
$1.00/share
$17.8m
$1.10/share
(1)
2012/2013
2014
Share Buyback
$5.2m
103,619 shares
(2)
$44.6m
591,034 shares
(2)
(1)
10% increase in May 2014 to an annualized rate of $1.10 per share
(2)
Class A common stock
163 |
 Our
Commitment
to Growth:
Our Products
Colin Wilson
President and Chief
Executive Officer
NACCO Materials Handling
Group |
 What
You Will See in the Yale Booth Financing
Telemetry
Fleet Management
Side-stance Reach
Enclosed End
Rider
Multi-Level Order
Selector
3-wheel Stand
featuring the Nuvera PowerEdge
fuel cell battery box replacement
Heavy Duty
Motorized Hand
Very Narrow Aisle
165 |
 166
Financing
Telemetry
Fleet Management
S120
H60FT
J80
S50FT
E50XN
featuring the Nuvera PowerEdge
fuel cell battery box replacement
What You Will See in the Hyster Booth |
 167
What You Will See in the Nuvera Booth
167 |
 Our Commitment
to Growth:
7% Target and
Substantial Cash
Generation
Alfred M.
Rankin, Jr.
Chairman, President and
Chief Executive Officer
Hyster-Yale Materials Handling
Chairman
NACCO Materials Handling Group |
 7%
Operating
Profit at the
mid-point of
the next cycle
Operating
Profit at the
peak of this
cycle
7%
With adequate
volume
growth we
can meet our
public
operating
profit
commitments
169
Commitment to 7% Operating Profit Margin |
 Hyster-Yale will look for opportunities that take
advantage of our skills and capabilities and
provide sound financial returns
Uses
of
Cash
-
Philosophy
170
As appropriate, to return capital to stockholders
through dividends and periodically through
share repurchases
Expects continued strong cash generation
Focus on utilizing cash to support strategic
initiatives |
 Uses
of Cash… Investments in our core business to
accelerate growth or enhance margins
Acquisitions of other forklift business,
based on fit and opportunity
Acquisitions of technologies that will
be accelerators of our business
Investments in the growth of our
independent and exclusive distribution
network
171 |
 Rationale for Investing in Hyster-Yale
•
Leading position in growing industry benefiting from globalization and worldwide
economic recovery and development
•
•
Strong economic engine driven by volume economies of scale
•
•
Strong balance sheet, financial flexibility and attractive returns on capital
employed •
High potential for partnership and consolidation opportunities
•
Focused investment in capital goods sector with growth opportunity:
–
In developed countries from exposure to goods movement, distribution and
warehousing –
•
Nuvera expected to provide significant future revenue streams and ROI
172
Premier brands, comprehensive global product line and exclusive, global independent distribution
network Focused strategic initiatives to gain market share and enhance margins over next 3
– 5 years In developing countries (Brazil, Eastern Europe, India and Asia) from exposure
to industrialization |
 Questions?
173 |
 Appendix
174 |
 Non-GAAP Disclosure
Adjusted Operating Profit is defined as Operating Profit, as reported, adjusted
for the pre-tax effect of certain one-time events and
transactions; EBITDA is defined as income before income taxes and
non-controlling interest income (loss) plus net interest expense and
depreciation and amortization expense; Return on total capital employed
(“ROTCE”) is defined as net income before interest expense, after
tax, divided by average capital employed. Average capital employed is defined as average
stockholders’
equity plus average debt less average cash.
Adjusted Operating Profit, EBITDA and return on total capital employed are not measurements
under U.S. GAAP, should not be considered in isolation or as a substitute for GAAP
measures, and are not necessarily comparable with similarly titled measures
of other companies. Hyster-Yale defines each as the
following: For reconciliations from GAAP measurements to non-GAAP
measurements, see the following pages. 175 |
 Non-GAAP Reconciliation
($ in millions)
Year Ended December 31
2007
2010
2011
2012
2013
2014
Reconciliation
of
Adjusted
Operating
Profit
Operating Profit, as reported
$57.3
$46.1
$110.0
$111.7
$134.3
$148.8
Sale of retail business
-
6.1
-
-
-
-
Restructuring charges
-
(1.9)
-
-
-
-
Product Liability change
-
-
-
-
-
-
Sale of Brazil plant
-
-
-
-
-
(17.7)
Impact of Nuvera
-
-
-
-
-
3.1
Adjusted Operating Profit
$57.3
$50.3
$110.0
$111.7
$134.3
$134.2
Note: Adjusted Operating Profit is a measure of income that differs from Operating Profit measured in
accordance with U.S. GAAP. Adjusted Operating Profit is Operating Profit, as reported,
adjusted for the pre-tax effect of certain one-time events and transactions. Management believes that Operating Profit and Adjusted Operating Profit assist the investor in
understanding the results of operations of Hyster-Yale. In addition, management evaluates
results using both Operating Profit and Adjusted Operating Profit.
176 |
 Non-GAAP Reconciliation (continued)
($ in millions)
Year Ended December 31
2010
2011
2012
2013
2014
(1)
Reconciliation of EBITDA
Net income
attributable to stockholders
$32.4
$82.6
$98.0
$110.0
$109.8
Noncontrolling interest income (loss)
(0.1)
–
0.1
0.2
0.4
Income taxes provision
1.8
18.9
7.0
17.2
39.9
Interest expense
16.6
15.8
12.4
9.0
3.9
Interest income
(2.3)
(1.8)
(1.5)
(1.8)
(1.1)
Depreciation and amortization expense
33.9
31.3
28.0
30.2
29.7
EBITDA
$82.3
$146.8
$144.0
$164.8
$182.6
Note: EBITDA in this investor presentation is provided solely as a supplemental disclosure with
respect to operating results. EBITDA does not represent net income, as defined by U.S. GAAP and
should not be considered as a substitute for net income or net loss, or as an indicator of operating performance. The Company defines EBITDA as income
before income taxes and non-controlling interest income (loss) plus net interest expense and
depreciation and amortization expense. EBITDA is not a measurement under U.S. GAAP and is not
necessarily comparable with similarly titled measures of other companies.
(1) EBITDA for 2014 includes a $17.7 million gain on the sale of the Brazil land and facility.
177 |
 Non-GAAP Reconciliation (continued)
($ in millions)
Return on Capital Employed –
2010 and 2011
2010
2010 Average
Stockholders’
Equity (12/31/2009 and each of 2010’s quarter ends)
$210.
0
Plus: 2010 Average Debt (12/31/2009 and each of 2010’s quarter ends)
239.9
Less: 2010 Average Cash (12/31/2009 and each of 2010’s quarter ends)
(164.3)
Total 2010 average
total capital employed
$285.6
2010 Net Income
$32.4
Plus: 2010 Interest Expense, net
14.3
Less: Income taxes on 2010 interest expense at 38%
(1)
(5.4)
Return on total capital employed = net income before after-tax interest
$41.3
total capital employed percentage
14.5
%
2011
2011 Average
Stockholders”
Equity (12/31/2010 and each of 2011’s quarter ends)
$271.7
Plus: 2011 Average Debt (12/31/2010 and each of 2011’s quarter ends)
229.1
Less: 2011 Average Cash (12/31/2010 and each of 2011’s quarter ends)
(152.2)
Total 2011 average total capital employed
$348.6
2011 Net Income
$82.6
Plus: 2011 Interest Expense, net
14.0
Less: Income taxes on 2011 interest expense at 38%
(2)
(5.3)
Return on total capital employed = net income before after-tax interest
$91.3
Return on total capital employed percentage
26.2
%
Return on capital employed is provided solely as a supplemental disclosure with respect
to income generation because management believes it provides useful information with respect to earnings in a form that is
comparable to the Company’s cost of capital employed, which includes both equity
and debt securities, net of cash.
(1)
Tax rate of 38% represents the Company's target marginal tax rate compared with 2010's
effective income tax rate of 5.3%.
(2)
Tax rate of 38% represents the Company's target marginal tax rate compared with 2011's
effective income tax rate of 18.6%.
Return on
178 |
 Non-GAAP Reconciliation (continued)
($ in millions)
Return on Capital Employed –
2012 & 2013
2012
2012 Average Stockholders’ Equity (12/31/2011 and each of 2012’s quarter
ends) $333.3
Plus: 2012 Average Debt (12/31/2011 and each of 2012’s quarter ends)
175.9
Less: 2012 Average Cash (12/31/2011 and each of 2012’s quarter ends)
(165.2)
Total 2012 average total capital employed
$344.0
2012 Net Income
$98.0
Plus: 2012 Interest Expense, net
10.9
Less: Income taxes on 2012 interest expense at 38%
(4.1)
Return on total capital employed = net income before after-tax interest expense
$104.8
Return on total capital employed percentage
30.5%
2013
2013 Average Stockholders’ Equity (12/31/2012 and each of 2013’s quarter
ends) $389.7
Plus: 2013 Average Debt (12/31/2012 and each of 2013’s quarter ends)
121.4
Less: 2013 Average Cash (12/31/2012 and each of 2013’s quarter ends)
(161.1)
Total 2013 average total capital employed
$350.0
2013 Net Income
$110.0
Plus: 2013 Interest Expense, net
7.2
Less: Income taxes on 2013 interest expense at 38%
(2.7)
Return on total capital employed = net income before after-tax interest expense
$114.5
Return on total capital employed percentage
32.7%
______________
Return
on
capital
employed
is
provided
solely
as
a
supplemental
disclosure
with
respect
to
income
generation
because
management
believes
it
provides
useful
information
with
respect
to
earnings
in
a
form
that
is
comparable to the Company’s cost of capital employed, which includes both equity
and debt securities, net of cash. (1)
Tax rate of 38% represents the Company's target marginal tax rate compared with 2012's
effective income tax rate of 6.7%. (2)
Tax rate of 38% represents the Company's target marginal tax rate compared with 2013's
effective income tax rate of 13.5%. (2)
(1)
179 |
 Non-GAAP Reconciliation (continued)
($ in millions)
Return on Capital Employed –
2014
_____________________
Return
on
capital
employed
is
provided
solely
as
a
supplemental
disclosure
with
respect
to
income
generation
because
management
believes
it
provides
useful
information
with
respect
to
earnings
in
a
form
that
is
comparable to the Company’s cost of capital employed, which includes both equity
and debt securities, net of cash. (1)
Tax rate of 38% represents the Company's target marginal tax rate compared with 2014's
effective income tax rate of 26.6%. 2014
2014 Average Stockholders’
Equity (12/31/2013 and each of 2014’s quarter ends)
$468.7
Plus: 2014 Average Debt (12/31/2013 and each of 2014’s quarter ends)
42.8
Less: 2014 Average Cash (12/31/2013 and each of 2014’s quarter ends)
(118.2)
Total 2014
average total capital employed
$393.3
2014 Net Income
$109.8
Plus: 2014 Interest Expense, net
2.8
Less:
Income
taxes
on
2014
interest
expense
at
38%
(1)
(1.1)
Return on total capital employed = net income before after-tax interest expense
$111.5
Return on total capital employed percentage
28.3%
180 |
 Cash
Flow before Financing and Net Working Capital Calculations ($ in millions)
Year Ended December 31
2010
2011
2012
2013
2014
Reconciliation of Cash Flow before Financing
Net cash provided by operations
$47.5
$54.6
$128.7
$152.9
$100.0
Net cash used for investing activities
(8.5)
(15.9)
(19.5)
(26.1)
(44.4)
Cash Flow before Financing
$39.0
$38.7
$109.2
$126.8
$55.6
December 31,
2010
2011
2012
2013
2014
Net Working Capital
Accounts receivable, net
$319.2
$368.3
$329.2
$359.3
$357.7
Inventories, net
281.1
309.0
308.6
330.6
342.5
Less: Accounts payable
(314.4)
(318.1)
(306.5)
(361.1)
(350.0)
Net Working Capital
$285.9
$359.2
$331.3
$328.8
$350.2
181 |
 Alfred M. Rankin, Jr.
Chairman, President and Chief Executive Officer of Hyster-Yale Materials
Handling Chairman,
NACCO Materials Handling Group
Mr. Rankin became Chairman, President and Chief Executive Officer of
Hyster-Yale in September 2012 and has been Chairman
of
NACCO
Materials
Handling
Group,
Inc.
since
October
2008.
Mr.
Rankin
has
also
guided
NACCO
Industries
since May 1994.
He joined NACCO as President and Chief Operating Officer in April 1989 and became
President and Chief Executive Officer in May 1991.
Prior to joining NACCO, he was Vice Chairman, Chief Operating Officer, and a
Director of Eaton Corporation, a position he had held since April 1986.
Previous to that, he had served successively as President of Eaton's
Materials
Handling
and
Industrial
Groups,
and
as
Executive
Vice
President
-
Operations.
Prior
to
his
fifteen
years
at
Eaton, Mr. Rankin worked for McKinsey and Company, a management consulting
firm. Mr. Rankin received a Bachelor of Arts degree, magna cum laude, in
Economics and a Juris Doctor degree from Yale University. Mr. Rankin is a
director of Hyster-Yale Materials Handing, NACCO Industries, and the National Association of
Manufacturers. He is a trustee and Chairman of the Board of University Hospitals
of Cleveland, Advisory Chairman of the Board
of
the
Cleveland
Museum
of
Art,
and
trustee
of
the
Musical
Arts
Association.
He
is
a
former
director
of
The
Vanguard
Group, Goodrich Corporation, Standard Products, and Reliance Electric and a former
director and Chairman of the Board of the Fourth District Federal Reserve
Bank. 182 |
 Colin Wilson
President
and
Chief
Executive
Officer,
NACCO
Materials
Handling
Group
As President and Chief Executive Officer of NACCO Materials Handling Group, Mr.
Wilson is charged with providing the strategic vision and global leadership
that keeps NMHG moving forward, a role for which he has spent much of his career
preparing.
Mr.
Wilson
has
over
40
years
of
experience
in
the
materials
handling
industry.
He
began
his
career
in
1970
with
Coles Cranes in Sunderland, England, where he worked in production engineering,
marketing, product management and overseas licensing. After time with a
compressor company and a European lift truck competitor, Mr. Wilson joined NACCO
Materials
Handling
Group
in
1988
as
European
Sales
and
Marketing
Director
for
the
Yale®
brand.
From
here,
he
moved
into
the role of Managing Director of Yale Europe before being named President of Yale
Materials Handling Corporation, based in Flemington, New Jersey, in
1995. In 2002, Mr. Wilson was appointed President of NMHG’s Americas
operations and three years
later
became
Vice
President
and
Chief
Operating
Officer
of
NMHG.
Most
recently,
prior
to
becoming
President
and
Chief Executive Officer, Mr. Wilson served as NMHG’s President and Chief
Operating Officer since November 2013. 183 |
 Victoria L. Rickey
Senior Vice President, Asia-Pacific and Brazil
Ms.
Rickey
joined
NACCO
Materials
Handling
Group
in
1995
as
Managing
Director
for
the
Europe,
Africa,
and
Middle
East
Division.
In
2002,
she
became
the
Corporate
Chief
Marketing
Officer,
a
role
she
held
until
2004.
In
2004,
Ms.
Rickey
resumed her role in operations as Vice President of NMHG’s Asia Pacific
region. Currently, she oversees NMHG businesses in Brazil, China and
Asia-Pacific, and serves as liaison with NMHG's joint venture with Sumitomo in Japan. Prior to joining
NMHG, Ms. Rickey spent two decades working in purchasing, distribution, business
development, international sales, and marketing management for J.I. Case
Corporation, a global manufacturer and marketer of agriculture and construction
equipment.
Ms.
Rickey
received
a
MIM
in
International
Management
from
the
American
Graduate
School
of
International
Management,
Arizona
and
a
BS
Degree
in
Marketing
and
German
from
Millikin
University
in
Illinois.
184 |
 Charles Pascarelli
Senior Vice President, President, Americas
Mr. Pascarelli is the Senior Vice President and President, Americas for NMHG. In
this role, Mr. Pascarelli oversees all sales, marketing,
manufacturing,
finance,
and
pricing
functions
for
the
Hyster®
and
Yale®
lines
of
products,
as
well
as
their
extensive distribution network. In addition, his responsibilities include all NMHG
products and lift truck services, financial services, fleet management,
national accounts and dealer relations for the Americas. Mr. Pascarelli also serves on the Board
of
GE
Capital;
an
instrumental
partner
to
NMHG.
Prior
to
joining
the
company,
he
successfully
functioned
as
the
President
of
Sales and Marketing for The Raymond Corporation. During this time, he also served
as Chairman of the Board for numerous dealer
partners,
and
as
a
Board
Member
at
Binghamton
University,
School
of
Management.
Previous
to
The
Raymond
Corporation,
Mr.
Pascarelli
was
employed
by
Fuji
Film,
Co,
Ltd.,
as
Vice
President
and
General
Manager,
where
he
was
accountable for distribution, sales and marketing and services for the company in
the Americas, and all Pacific Rim Countries. His
career
has
led
him
to
possess
nearly
three
decades
of
sales,
marketing
and
distribution
leadership
experience
in
the
materials handling, capital goods, consumables and electronics industries. Mr.
Pascarelli holds B.S. and master’s degrees from Northeastern
University, and an MBA from Fairleigh Dickinson University. 185
|
 Ralf A. Mock
Senior
Vice
President,
Managing
Director,
Europe,
Middle
East
and
Africa
Mr. Mock joined NACCO Materials Handling Group as Managing Director Europe, Middle
East and Africa in 2006. Prior to that, he was member of the executive
board of Villeroy and Boch AG, a leading manufacturer of ceramic products. There he
managed the global wholesale and retail distribution and manufacturing operations
for the Tableware Division. Mr. Mock began his career with Linde AG where
he served in a variety of capacities including finance, accounting/controlling, marketing
and
sales.
While
with
Linde
he
worked
in
the
Materials
Handling,
Refrigeration,
and
Technical
Gases
divisions,
as
well
as
the
company’s global headquarters. Later during his tenure at Linde he was
appointed Managing Director for the Linde Materials Handling division,
Aschaffenburg, Germany. Mr. Mock holds a Masters of Business Administration from the University of
Cologne, Germany.
186 |
 Rajiv K. Prasad
Senior
Vice
President,
Global
Product
Development,
Manufacturing
and
Supply
Chain
Strategy
As Senior Vice President, Global Product Development, Manufacturing and Supply
Chain Strategy, Mr. Prasad guides all aspects of the NMHG product
development, manufacturing and supply chain. His ultimate responsibility is to ensure that the
products and innovations introduced by NMHG address customer needs fully and
efficiently. His career in product development began in 1986 with Ford
Motor Company. In 1999, he joined Lear Corporation, taking on positions with greater
responsibility, before moving to International Truck and Engine Corporation where
he served as Vice President of Global Product
Development.
Mr.
Prasad
joined
NMHG
in
2007
where
he
has
guided
developments
that
have
included
introduction
of the new Electric Rider Platform. He holds a Bachelor’s Degree in
Electrical/Electronic Engineering and a Master’s Degree in Advanced
Vehicle Concepts from Loughborough University, in Leicestershire, UK.
187 |
 Scott Blanchet
Vice President of Product Management, Nuvera
Mr. Blanchet became Nuvera’s Vice President of Product Management in February
2015 and served as Nuvera’s Vice President of Technology Development
leading up to the acquisition by NMHG. In his former role, Scott was responsible for
developing core technologies for generating, delivering and converting hydrogen
into electricity for mobility applications. His new
role
in
product
management
will
focus
on
industrializing
and
commercializing
these
technologies
into
product
lines
that
deliver value to NMHG customers and shareholders. From 1994 to 2004 Scott held
various technical and leadership positions at FuelCell Energy in Danbury,
Connecticut and General Motors Corporation in Flint, Michigan. Scott’s personal mission is to
make an enduring contribution to human society and our environment by delivering
exceptional solutions to major energy problems. He’s been awarded 16
U.S. patents related to emissions control and hydrogen technologies. Scott holds a Master
of Science in Mechanical Engineering from Stanford University and a Bachelor of
Science in Mechanical Engineering from the University of Miami.
188 |
 Jon
Taylor Vice President Business Development, NMHG
CEO, Nuvera
Mr. Taylor became Chief Executive Officer of Nuvera Fuel Cells in December 2014
and continues to serve as Vice President, Business Development and
Financial Planning and Analysis. He previously served as Director Corporate Strategy, Financial
Planning
and
Analysis
since
2008.
Mr.
Taylor
also
serves
on
the
Board
of
Directors
for
the
company
joint
venture
in
Japan,
Sumitomo-NACCO
Material
Handling
Group.
From
1993
to
2008,
Mr.
Taylor
served
in
various
accounting,
finance
and
marketing
roles
at
NMHG
in
both
the
Corporate
and
European
Headquarters.
Mr.
Taylor
has
a
B.S.
in
Business
Finance
from
the
University
of
Utah
and
an
MBA
in
International
Business
from
the
University
of
Washington.
He
also
completed
international study programs at Cambridge University and the Cranfield Institute
of Technology in the U.K. He has represented NMHG on the Industry Trade
Advisory Committee for Automotive Equipment and Capital Goods, and is a
member
of
the
Pacific
Northwest
International
Trade
Association.
Mr.
Taylor
is
a
longtime
volunteer
classroom
teacher
for
Junior Achievement.
189 |
 Kenneth C. Schilling
Senior Vice President, Chief Financial Officer
Mr. Schilling oversees financial reporting, accounting, tax compliance, tax
strategies, financial analysis and financial planning at
Hyster-Yale
and
NACCO
Materials
Handling
Group.
Most
recently,
Mr.
Schilling
was
Vice
President
and
Chief
Financial
Officer of Hyster-Yale and NACCO Materials Handling Group, positions he held
from September 2012 and October 2008, respectively, to August 2014.
Previously, Mr. Schilling was Vice President and Controller of NACCO Industries
from May 1997
to
September
2012.
Mr.
Schilling
joined
NACCO
Industries
in
1991
as
Tax
Manager.
In
1995,
he
was
promoted
to
NACCO Industries Manager of Tax and Budgeting and became Controller in 1996. Prior
to joining NACCO Industries, Mr. Schilling
worked
at
Arthur
Anderson
LLP
as
Tax
Manager
from
1985
to
1991.
Mr.
Schilling
received
his
Bachelor
of
Science
degree in Accounting from Miami University in 1982 and obtained his Juris Doctor
degree from The Ohio State University School of Law in 1985. Mr. Schilling
is a Certified Public Accountant in the State of Ohio and was also admitted to the practice
of law in the State of Ohio in 1985. He is a member of the Cleveland Metropolitan
Bar Association, Financial Executives International
and
The
Manufacturers
Alliance
for
Productivity
and
Innovation
-
CFO
Council.
Mr.
Schilling
is
also
a
member
of
the Board of Trustees of the Cuyahoga County Public Library Foundation.
190 |
Serious News for Serious Traders! Try StreetInsider.com Premium Free!
You May Also Be Interested In
- Bill Negotiation Service For Unemployed Professionals With No Upfront Fee—Update
- Edge Impulse Brings Industrial Computer Vision Breakthroughs in Anomaly Detection to Any Edge Device for the First Time
- Form 8.5 (EPT/RI) - musicMagpie Plc
Create E-mail Alert Related Categories
SEC FilingsSign up for StreetInsider Free!
Receive full access to all new and archived articles, unlimited portfolio tracking, e-mail alerts, custom newswires and RSS feeds - and more!
