

Form 8-K HANCOCK HOLDING CO For: Jun 30
 Tweet
Tweet Share
ShareUNITED STATES
SECURITIES AND EXCHANGE COMMISSION
Washington, D.C. 20549
FORM 8-K
CURRENT REPORT
Pursuant to Section 13 or 15(d) of the Securities Exchange Act of 1934
Date of Report (Date of earliest event reported): July 20, 2016
HANCOCK HOLDING COMPANY
(Exact name of registrant as specified in its charter)
|
|
|
|
|
|
|
Mississippi
(State or other jurisdiction
of incorporation)
|
|
001-36872
(Commission
File Number)
|
|
64-0693170
(I.R.S. Employer
Identification No.)
|
|
One Hancock Plaza
2510 14th Street
Gulfport, Mississippi (Address of principal executive offices)
|
39501
(Zip Code)
|
(228) 868-4000
(Registrant's telephone number, including area code)
Not Applicable
(Former name or former address, if changed since last report)
Check the appropriate box below if the Form 8-K filing is intended to simultaneously satisfy the filing obligation of the registrant under any of the following provisions:
|
|
|
|
|
|
|
Written communications pursuant to Rule 425 under the Securities Act (17 CFR 230.425)
|
|
|
|
|
|
|
|
Soliciting material pursuant to Rule 14a-12 under the Exchange Act (17 CFR 240.14a-12)
|
|
|
|
|
|
|
|
Pre-commencement communications pursuant to Rule 14d-2(b) under the Exchange Act (17 CFR 240.14d-2(b))
|
|
|
|
|
|
|
|
Pre-commencement communications pursuant to Rule 13e-4(c) under the Exchange Act (17 CFR 240.13e-4(c))
|
| Item 2.02 | Results of Operations and Financial Condition. |
On July 20, 2016, Hancock Holding Company issued a press release reporting its second quarter earnings for the period ended June 30, 2016. A copy of this press release and the accompanying financial statements and slide presentation are attached hereto as Exhibit 99.1.
In accordance with General Instruction B.2. of Form 8-K, the information presented in this Item 2.02 shall not be deemed "filed" for purposes of Section 18 of the Securities Exchange Act of 1934, as amended, nor shall it be deemed incorporated by reference in any filing under the Securities Exchange Act of 1934, as amended, or the Securities Act of 1933, as amended, except as expressly set forth by specific reference in such a filing.
Item 9.01 Financial Statements and Exhibits.
(d) Exhibits.
|
Exhibit Number
|
Description |
|
99.1
|
Press Release dated July 20, 2016 for Quarter Ended June 30, 2016.
|
SIGNATURE
Pursuant to the requirements of the Securities Exchange Act of 1934, the Registrant has duly caused this report to be signed on its behalf by the undersigned hereunto duly authorized.
| HANCOCK HOLDING COMPANY | |||
|
July 20, 2016
|
By:
|
/s/ Michael M. Achary | |
| Michael M. Achary | |||
| Chief Financial Officer | |||
Exhibit 99.1

For Immediate Release
July 20, 2016
For More Information
Trisha Voltz Carlson
SVP, Investor Relations Manager
504.299.5208
Hancock reports second quarter 2016 E.P.S. of $.59
Results reflect continuing improvement in core pre-tax, pre-provision earnings
GULFPORT, Miss. (July 20, 2016) — Hancock Holding Company (Nasdaq: HBHC) today announced its financial results for the second quarter of 2016. Net income for the second quarter of 2016 was $46.9 million, or $.59 per diluted common share, compared to $3.8 million, or $.05 in the first quarter of 2016 and $34.8 million, or $.44, in the second quarter of 2015. The linked-quarter increase in earnings reflects improved revenue, a lower level of expenses and a sizeable decrease in the loan loss provision.
Highlights of the company's second quarter 2016 results (compared to first quarter 2016):
|
·
|
Core pre-tax, pre-provision (core PTPP) income of $85.2 million, up $8.8 million or 12% (up 30% year-over-year)
|
|
·
|
Total loans up $58 million, or 1% linked-quarter annualized (LQA); includes a decrease of approximately $153 million in energy loan outstandings
|
|
·
|
Energy loans declined to 9% of total loans
|
|
·
|
Loan loss provision of $17.2 million, down from $60.0 million
|
|
·
|
Allowance for the energy portfolio totals $111 million, or 7.5% of energy loans
|
|
·
|
Core net interest margin up 3 basis points (bps)
|
|
·
|
Noninterest expense down $5.1 million (first quarter expenses included $5.0 million of nonoperating items)
|
|
·
|
Tangible common equity (TCE) ratio up 12 bps to 7.81%
|
Pre-tax, pre-provision earnings (core) were $85.2 million for the second quarter of 2016, compared to $76.4 million in the first quarter of 2016 and $65.5 million in the second quarter of 2015.
"We are halfway through the year and exactly halfway to meeting our stated goal for 2016's core pre-tax, pre-provision earnings," said President and CEO John M. Hairston. "We are doing so by following basic fundamentals of expense management coupled with revenue growth that includes both margin expansion and improvement in many fee categories. As a result of this progress, we continue to build a stronger, more diversified balance sheet and income statement. I am also pleased to report, that after two consecutive quarters of significant reserve build for our energy portfolio, our provision expense for the quarter decreased to an amount in line with the lower end of our guidance, our reserve coverage of the energy portfolio improved to 7.5% and our energy portfolio as a percent of total loans continued its decline to a single digit percentage. I am extremely proud of all 3,805 members of our team and what they have accomplished, yet we remain focused on improving upon our results for the future."
1
Hancock reports second quarter 2016 financial results
July 20, 2016
Loans
Total loans at June 30, 2016 were $16.0 billion, up approximately $58 million from March 31, 2016. Many regions across the footprint reported net loan growth during the quarter (excluding the impact of energy payoffs and paydowns). Loans to energy-related companies declined approximately $153 million linked-quarter. Excluding the energy portfolio, loans would have increased 6% linked-quarter annualized. Management expects continued growth across the footprint to be partially offset by ongoing payoffs and paydowns in the energy portfolio. This is expected to result in year over year period-end loan growth of 5-7% in 2016.
Average loans totaled $16.1 billion for the second quarter of 2016, up $211 million, or 1%, linked-quarter.
Energy
At June 30, 2016, loans to the energy industry totaled $1.48 billion, or 9% of total loans. The energy portfolio decreased approximately $153 million linked-quarter and is comprised of credits to both the E&P and support sectors. Payoffs and paydowns of approximately $180 million, plus charge-offs of $4 million, were partially offset by approximately $31 million of draws on existing lines.
The impact and severity of future risk rating migration, as well as any associated provisions or net charge-offs, will depend on overall oil prices and the duration of the cycle. While we expect additional charge-offs in the portfolio, we continue to believe the impact on the company of the energy cycle will be manageable and our capital will remain solid. Management currently estimates that charge-offs from energy-related credits could approximate $65-$95 million over the duration of the cycle, of which approximately $25 million has been taken to-date.
Additional details of the energy portfolio are included in the presentation slides posted on our Investor Relations website.
Deposits
Total deposits at June 30, 2016 were $18.8 billion, up $161 million, or 1%, from March 31, 2016. Average deposits for the second quarter of 2016 were $18.7 billion, up $436 million, or 2%, linked-quarter.
Noninterest-bearing demand deposits (DDAs) totaled $7.2 billion at June 30, 2016, up $43 million from March 31, 2016. DDAs comprised 38% of total period-end deposits at June 30, 2016.
Interest-bearing transaction and savings deposits totaled $6.8 billion at the end of the second quarter of 2016, down $289 million, or 4%, from March 31, 2016. Time deposits of $2.6 billion increased $206 million, or 9%, while interest-bearing public fund deposits increased $201 million, or 9%, to $2.4 billion at June 30, 2016.
Asset Quality
Nonperforming assets (NPAs) totaled $325 million at June 30, 2016, up $18 million from March 31, 2016. During the second quarter of 2016, total nonperforming loans increased approximately $19 million while foreclosed and surplus real estate (ORE) and other foreclosed assets decreased approximately $1 million. The net increase in nonperforming loans was mainly related to the movement of several energy credits, totaling approximately $38 million, during the quarter. Nonperforming assets as a percent of total loans, ORE and other foreclosed assets was 2.02% at June 30, 2016, up 10 bps from March 31, 2016.
2
Hancock reports second quarter 2016 financial results
July 20, 2016
The total allowance for loan losses was $226.1 million at June 30, 2016, up $8.3 million from March 31, 2016. The ratio of the allowance for loan losses to period-end loans was 1.41% at June 30, 2016, up from 1.36% at March 31, 2016. The allowance maintained on the non-PCI (purchased credit impaired) portion of the loan portfolio increased $9.2 million linked-quarter, totaling $206.5 million, while the allowance on the FDIC acquired loan portfolio decreased $0.9 million linked-quarter.
Net charge-offs from the non-PCI loan portfolio were $7.8 million, or 0.20% of average total loans on an annualized basis in the second quarter of 2016, down from $21.3 million, or 0.54% of average total loans in the first quarter of 2016. Included in the second quarter's total are $4.0 million in charge-offs related to energy credits.
During the second quarter of 2016, Hancock recorded a total provision for loan losses of $17.2 million, down from $60.0 million in the first quarter of 2016. Based on information currently available, management expects the provision for loan losses could approximate $105 - $145 million for the full year of 2016.
Net Interest Income and Net Interest Margin
Net interest income (TE) for the second quarter of 2016 was $171.2 million, up $3.0 million from the first quarter of 2016. During the second quarter, the impact on net interest income from purchase accounting adjustments (PAAs) declined $0.4 million to $5.2 million. Excluding the impact from purchase accounting items, core net interest income increased $3.4 million linked-quarter. Average earning assets were $21.1 billion for the second quarter of 2016, up $236 million, or 1%, from the first quarter of 2016.
Net interest income (TE) for the second quarter of 2016 was $171.2 million, up $3.0 million from the first quarter of 2016. During the second quarter, the impact on net interest income from purchase accounting adjustments (PAAs) declined $0.4 million to $5.2 million. Excluding the impact from purchase accounting items, core net interest income increased $3.4 million linked-quarter. Average earning assets were $21.1 billion for the second quarter of 2016, up $236 million, or 1%, from the first quarter of 2016.
The reported net interest margin (TE) was 3.25% for the second quarter of 2016, up 2 bps from the first quarter of 2016. The core net interest margin (reported net interest income (TE) excluding total net purchase accounting adjustments, annualized, as a percent of average earning assets) increased 3 bps to 3.15% during the second quarter of 2016. The main drivers of the improvement were an increase in the core loan yield of 3 bps and an increase in the securities portfolio yield of 2 bps. This was slightly offset by an increase in the cost of funds of 1 basis point.
Noninterest Income
Noninterest income totaled $63.7 million for the second quarter of 2016, up $5.5 million, or 9%, from the first quarter of 2016. Included in the total is amortization of $1.5 million related to the FDIC indemnification asset, compared to amortization of $1.6 million in the first quarter of 2016. Excluding the impact of this item, core noninterest income totaled $65.2 million, up $5.4 million, or 9%, linked-quarter.
Service charges on deposits totaled $18.4 million for the second quarter of 2016, virtually unchanged from the first quarter of 2016. Bank card and ATM fees totaled $12.0 million, up $0.6 million, or 5%, from the first quarter of 2016.
Trust fees totaled $12.1 million, up $0.9 million, or 8% linked-quarter. Second quarter trends typically reflect seasonality related to annual tax season fee income. Investment and annuity income and insurance fees totaled $6.3 million, up slightly linked-quarter.
Fees from secondary mortgage operations totaled $4.2 million for the second quarter of 2016, up $1.3 million, or 43% linked quarter.
3
Hancock reports second quarter 2016 financial results
July 20, 2016
Other noninterest income (excluding the amortization of the FDIC indemnification asset noted above) totaled $12.3 million, up $2.6 million, or 27%, from the first quarter of 2016. The net increase during the quarter was related to other income sources which are unpredictable as to timing.
Noninterest Expense & Taxes
Noninterest expense for the second quarter of 2016 totaled $150.9 million, down $5.1 million, or 3%, from the first quarter of 2016. There were $5.0 million of nonoperating expenses in the first quarter of 2016. Excluding nonoperating items from the first quarter, operating expenses remained unchanged linked quarter.
Noninterest expense for the second quarter of 2016 totaled $150.9 million, down $5.1 million, or 3%, from the first quarter of 2016. There were $5.0 million of nonoperating expenses in the first quarter of 2016. Excluding nonoperating items from the first quarter, operating expenses remained unchanged linked quarter.
Total personnel expense was $84.2 million in the second quarter of 2016, down $0.5 million, or 1%, from the first quarter of 2016.
Occupancy and equipment expense totaled $13.5 million in the second quarter of 2016, down $0.7 million, or 5%, from the first quarter of 2016.
ORE expense totaled $0.4 million for the second quarter of 2016, down slightly from the first quarter of 2016.
Amortization of intangibles totaled $5.0 million for the second quarter of 2016, down $0.1 million, or 2%, linked-quarter. Other operating expense totaled $47.9 million in the second quarter of 2016, up $1.3 million, or 3%, from the first quarter of 2016.
The effective income tax rate for the second quarter of 2016 was 22.5%. Management expects the effective income tax rate to approximate 22-24% for the remainder of 2016. The effective
income tax rate continues to be less than the statutory rate of 35% due primarily to tax-exempt income and tax credits.
Capital
Common shareholders' equity at June 30, 2016 totaled $2.5 billion. The tangible common equity (TCE) ratio was 7.81%, up 12 bps from March 31, 2016. During the fourth quarter of 2015 the company placed its common stock buyback on hold in light of the current energy cycle. No shares were repurchased in the second quarter of 2016. Additional capital ratios are included in the financial tables.
Conference Call and Slide Presentation
Management will host a conference call for analysts and investors at 9:00 a.m. Central Time on Thursday, July 21, 2016 to review the results. A live listen-only webcast of the call will be available under the Investor Relations section of Hancock's website at www.hancockwhitney.com/investors. Additional financial tables and a slide presentation related to second quarter results are also posted as part of the webcast link. To participate in the Q&A portion of the call, dial (877) 564-1219 or (973) 638-3429. An audio archive of the conference call will be available under the Investor Relations section of our website. A replay of the call will also be available through July 28, 2016 by dialing (855) 859-2056 or (404) 537-3406, passcode 38311783.
About Hancock Holding Company
Hancock Holding Company is a financial services company with regional business headquarters and locations across the Gulf South. The company's banking subsidiary provides comprehensive financial products and services through Hancock Bank locations in Mississippi, Alabama, and Florida and Whitney Bank locations in Louisiana and Texas, including traditional, online, and mobile banking; commercial and
4
Hancock reports second quarter 2016 financial results
July 20, 2016
small business banking; private banking; trust and investment services; certain insurance services; and mortgage services. More information is available at www.hancockwhitney.com.
Forward-Looking Statements
This news release contains "forward-looking statements" within the meaning of section 27A of the Securities Act of 1933, as amended, and section 21E of the Securities Exchange Act of 1934, as amended, and we intend such forward-looking statements to be covered by the safe harbor provisions therein and are including this statement for purposes of invoking these safe-harbor provisions. Forward-looking statements provide projections of results of operations or of financial condition or state other forward-looking information, such as expectations about future conditions and descriptions of plans and strategies for the future. Forward-looking statements that we may make include, but may not be limited to, comments with respect to future levels of economic activity in our markets, including the impact of volatility of oil and gas prices on our energy portfolio and associated loan loss reserves and possible charge-offs, and the downstream impact on businesses that support the energy sector, especially in the Gulf Coast region, loan growth expectations, deposit trends, credit quality trends, net interest margin trends, future expense levels, success of revenue-generating initiatives, projected tax rates, future profitability, improvements in expense to revenue (efficiency) ratio, purchase accounting impacts such as accretion levels, possible repurchases of shares under stock buyback programs, and the financial impact of regulatory requirements. Hancock's ability to accurately project results, predict the effects of future plans or strategies, or predict market or economic developments is inherently limited. Although Hancock believes that the expectations reflected in its forward-looking statements are based on reasonable assumptions, actual results and performance could differ materially from those set forth in the forward-looking statements. Factors that could cause actual results to differ from those expressed in Hancock's forward-looking statements include, but are not limited to, those risk factors included in Hancock's public filings with the Securities and Exchange Commission, which are available at the SEC's internet site (http://www.sec.gov). You are cautioned not to place undue reliance on these forward-looking statements. Hancock does not intend, and undertakes no obligation, to update or revise any forward-looking statements, whether as a result of differences in actual results, changes in assumptions or changes in other factors affecting such statements, except as required by law.
This news release contains "forward-looking statements" within the meaning of section 27A of the Securities Act of 1933, as amended, and section 21E of the Securities Exchange Act of 1934, as amended, and we intend such forward-looking statements to be covered by the safe harbor provisions therein and are including this statement for purposes of invoking these safe-harbor provisions. Forward-looking statements provide projections of results of operations or of financial condition or state other forward-looking information, such as expectations about future conditions and descriptions of plans and strategies for the future. Forward-looking statements that we may make include, but may not be limited to, comments with respect to future levels of economic activity in our markets, including the impact of volatility of oil and gas prices on our energy portfolio and associated loan loss reserves and possible charge-offs, and the downstream impact on businesses that support the energy sector, especially in the Gulf Coast region, loan growth expectations, deposit trends, credit quality trends, net interest margin trends, future expense levels, success of revenue-generating initiatives, projected tax rates, future profitability, improvements in expense to revenue (efficiency) ratio, purchase accounting impacts such as accretion levels, possible repurchases of shares under stock buyback programs, and the financial impact of regulatory requirements. Hancock's ability to accurately project results, predict the effects of future plans or strategies, or predict market or economic developments is inherently limited. Although Hancock believes that the expectations reflected in its forward-looking statements are based on reasonable assumptions, actual results and performance could differ materially from those set forth in the forward-looking statements. Factors that could cause actual results to differ from those expressed in Hancock's forward-looking statements include, but are not limited to, those risk factors included in Hancock's public filings with the Securities and Exchange Commission, which are available at the SEC's internet site (http://www.sec.gov). You are cautioned not to place undue reliance on these forward-looking statements. Hancock does not intend, and undertakes no obligation, to update or revise any forward-looking statements, whether as a result of differences in actual results, changes in assumptions or changes in other factors affecting such statements, except as required by law.
|
HANCOCK HOLDING COMPANY
FINANCIAL HIGHLIGHTS
(Unaudited)
|
|||||||||||||||||||
|
|
|||||||||||||||||||
|
Three Months Ended
|
Six Months Ended
|
||||||||||||||||||
|
(amounts in thousands, except per share data)
|
6/30/2016
|
3/31/2016
|
6/30/2015
|
6/30/2016
|
6/30/2015
|
||||||||||||||
|
INCOME STATEMENT DATA
|
|||||||||||||||||||
|
Net interest income
|
$
|
164,969
|
$
|
162,836
|
$
|
151,791
|
$
|
327,805
|
$
|
309,949
|
|||||||||
|
Net interest income (TE) (a)
|
171,165
|
168,179
|
154,879
|
339,344
|
315,993
|
||||||||||||||
|
Provision for loan losses
|
17,196
|
60,036
|
6,608
|
77,232
|
12,762
|
||||||||||||||
|
Noninterest income
|
63,694
|
58,186
|
60,874
|
121,880
|
117,420
|
||||||||||||||
|
Noninterest expense
|
150,942
|
156,032
|
158,917
|
306,974
|
312,432
|
||||||||||||||
|
Net income
|
46,907
|
3,839
|
34,829
|
50,746
|
74,988
|
||||||||||||||
|
Nonoperating items - pre-tax (for informational purposes only)
|
-
|
4,978
|
8,927
|
4,978
|
15,908
|
||||||||||||||
|
PERIOD-END BALANCE SHEET DATA
|
|||||||||||||||||||
|
Loans
|
$
|
16,035,796
|
$
|
15,978,124
|
$
|
14,344,752
|
$
|
16,035,796
|
$
|
14,344,752
|
|||||||||
|
Securities
|
4,806,370
|
4,667,837
|
4,445,452
|
4,806,370
|
4,445,452
|
||||||||||||||
|
Earning assets
|
21,037,622
|
20,821,513
|
19,409,963
|
21,037,622
|
19,409,963
|
||||||||||||||
|
Total assets
|
23,063,790
|
22,809,370
|
21,532,824
|
23,063,790
|
21,532,824
|
||||||||||||||
|
Noninterest-bearing deposits
|
7,151,416
|
7,108,598
|
6,180,814
|
7,151,416
|
6,180,814
|
||||||||||||||
|
Total deposits
|
18,816,869
|
18,656,150
|
17,301,788
|
18,816,869
|
17,301,788
|
||||||||||||||
|
Common shareholders' equity
|
2,463,365
|
2,421,040
|
2,430,040
|
2,463,365
|
2,430,040
|
||||||||||||||
|
AVERAGE BALANCE SHEET DATA
|
|||||||||||||||||||
|
Loans
|
$
|
16,059,846
|
$
|
15,848,770
|
$
|
14,138,904
|
$
|
15,954,308
|
$
|
14,004,895
|
|||||||||
|
Securities (b)
|
4,648,807
|
4,528,090
|
4,143,097
|
4,588,449
|
3,959,069
|
||||||||||||||
|
Earning assets
|
21,147,029
|
20,910,668
|
18,780,771
|
21,028,849
|
18,549,589
|
||||||||||||||
|
Total assets
|
23,138,591
|
22,932,515
|
20,869,407
|
23,035,553
|
20,656,872
|
||||||||||||||
|
Noninterest-bearing deposits
|
7,079,426
|
7,033,680
|
6,107,900
|
7,056,553
|
6,016,623
|
||||||||||||||
|
Total deposits
|
18,717,755
|
18,281,754
|
16,862,088
|
18,499,755
|
16,674,782
|
||||||||||||||
|
Common shareholders' equity
|
2,430,005
|
2,431,747
|
2,430,710
|
2,430,876
|
2,439,242
|
||||||||||||||
|
COMMON SHARE DATA
|
|||||||||||||||||||
|
Earnings per share - diluted
|
$
|
0.59
|
$
|
0.05
|
$
|
0.44
|
$
|
0.64
|
$
|
0.93
|
|||||||||
|
Cash dividends per share
|
$
|
0.24
|
$
|
0.24
|
$
|
0.24
|
$
|
0.48
|
$
|
0.48
|
|||||||||
|
Book value per share (period-end)
|
$
|
31.77
|
$
|
31.24
|
$
|
31.12
|
$
|
31.77
|
$
|
31.12
|
|||||||||
|
Tangible book value per share (period-end)
|
22.50
|
21.90
|
21.63
|
22.50
|
21.63
|
||||||||||||||
|
Weighted average number of shares - diluted
|
77,680
|
77,672
|
78,115
|
77,676
|
78,881
|
||||||||||||||
|
Period-end number of shares
|
77,538
|
77,508
|
78,094
|
77,538
|
78,094
|
||||||||||||||
|
Market data
|
|||||||||||||||||||
|
High sales price
|
$
|
27.84
|
$
|
25.84
|
$
|
32.98
|
$
|
27.84
|
$
|
32.98
|
|||||||||
|
Low sales price
|
21.93
|
20.01
|
28.02
|
20.01
|
24.96
|
||||||||||||||
|
Period-end closing price
|
26.11
|
22.96
|
31.91
|
26.11
|
31.91
|
||||||||||||||
|
Trading volume
|
41,668
|
56,319
|
40,162
|
97,987
|
92,029
|
||||||||||||||
|
PERFORMANCE RATIOS
|
|||||||||||||||||||
|
Return on average assets
|
0.82
|
%
|
0.07
|
%
|
0.67
|
%
|
0.44
|
%
|
0.73
|
%
|
|||||||||
|
Return on average common equity
|
7.76
|
%
|
0.64
|
%
|
5.75
|
%
|
4.20
|
%
|
6.20
|
%
|
|||||||||
|
Return on average tangible common equity
|
11.04
|
%
|
0.91
|
%
|
8.28
|
%
|
5.98
|
%
|
8.94
|
%
|
|||||||||
|
Tangible common equity ratio (c)
|
7.81
|
%
|
7.69
|
%
|
8.13
|
%
|
7.81
|
%
|
8.13
|
%
|
|||||||||
|
Net interest margin (TE) (a)
|
3.25
|
%
|
3.23
|
%
|
3.30
|
%
|
3.24
|
%
|
3.43
|
%
|
|||||||||
|
Average loan/deposit ratio
|
85.80
|
%
|
86.69
|
%
|
83.85
|
%
|
86.24
|
%
|
83.99
|
%
|
|||||||||
|
Efficiency ratio (d)
|
62.14
|
%
|
64.47
|
%
|
66.67
|
%
|
63.28
|
%
|
65.46
|
%
|
|||||||||
|
Allowance for loan losses as a percent of period-end loans
|
1.41
|
%
|
1.36
|
%
|
0.91
|
%
|
1.41
|
%
|
0.91
|
%
|
|||||||||
|
Annualized net non-purchased credit impaired charge-offs to average loans
|
0.20
|
%
|
0.54
|
%
|
0.03
|
%
|
0.37
|
%
|
0.07
|
%
|
|||||||||
|
Allowance for loan losses to non-performing loans + accruing loans 90 days past due
|
73.01
|
%
|
74.55
|
%
|
100.92
|
%
|
73.01
|
%
|
100.92
|
%
|
|||||||||
|
Noninterest income as a percent of total revenue (TE) (a)
|
27.12
|
%
|
25.70
|
%
|
28.21
|
%
|
26.43
|
%
|
27.09
|
%
|
|||||||||
|
FTE headcount
|
3,723
|
3,819
|
3,825
|
3,723
|
3,825
|
||||||||||||||
|
(a) Tax-equivalent (TE) amounts are calculated using a federal income tax rate of 35%.
|
|||||||||||||||||||
|
(b) Average securities does not include unrealized holding gains/losses on available for sale securities.
|
|||||||||||||||||||
|
(c) The tangible common equity ratio is common shareholders' equity less intangible assets divided by total assets less intangible assets.
|
|||||||||||||||||||
|
(d) The efficiency ratio is noninterest expense to total net interest (TE) and noninterest income, excluding amortization of purchased intangibles and nonoperating expense.
|
|||||||||||||||||||
6
|
HANCOCK HOLDING COMPANY
QUARTERLY HIGHLIGHTS
(Unaudited)
|
||||||||||||||||||||
|
|
||||||||||||||||||||
|
Three Months Ended
|
||||||||||||||||||||
|
(dollars in thousands, except per share data)
|
6/30/2016
|
3/31/2016
|
12/31/2015
|
9/30/2015
|
6/30/2015
|
|||||||||||||||
|
INCOME STATEMENT DATA
|
||||||||||||||||||||
|
Net interest income
|
$
|
164,969
|
$
|
162,836
|
$
|
158,395
|
$
|
156,830
|
$
|
151,791
|
||||||||||
|
Net interest income (TE) (a)
|
171,165
|
168,179
|
162,635
|
160,134
|
154,879
|
|||||||||||||||
|
Provision for loan losses
|
17,196
|
60,036
|
50,196
|
10,080
|
6,608
|
|||||||||||||||
|
Noninterest income
|
63,694
|
58,186
|
59,653
|
60,211
|
60,874
|
|||||||||||||||
|
Noninterest expense
|
150,942
|
156,032
|
156,030
|
151,193
|
158,917
|
|||||||||||||||
|
Net income
|
46,907
|
3,839
|
15,307
|
41,166
|
34,829
|
|||||||||||||||
|
Nonoperating items - pre-tax (for informational purposes only)
|
-
|
4,978
|
-
|
-
|
8,927
|
|||||||||||||||
|
PERIOD-END BALANCE SHEET DATA
|
||||||||||||||||||||
|
Loans
|
$
|
16,035,796
|
$
|
15,978,124
|
$
|
15,703,314
|
$
|
14,763,050
|
$
|
14,344,752
|
||||||||||
|
Securities
|
4,806,370
|
4,667,837
|
4,463,792
|
4,548,922
|
4,445,452
|
|||||||||||||||
|
Earning assets
|
21,037,622
|
20,821,513
|
20,753,095
|
19,526,150
|
19,409,963
|
|||||||||||||||
|
Total assets
|
23,063,790
|
22,809,370
|
22,833,605
|
21,602,793
|
21,532,824
|
|||||||||||||||
|
Noninterest-bearing deposits
|
7,151,416
|
7,108,598
|
7,276,127
|
6,075,558
|
6,180,814
|
|||||||||||||||
|
Total deposits
|
18,816,869
|
18,656,150
|
18,348,912
|
17,439,948
|
17,301,788
|
|||||||||||||||
|
Common shareholders' equity
|
2,463,365
|
2,421,040
|
2,413,143
|
2,453,561
|
2,430,040
|
|||||||||||||||
|
AVERAGE BALANCE SHEET DATA
|
||||||||||||||||||||
|
Loans
|
$
|
16,059,846
|
$
|
15,848,770
|
$
|
15,198,232
|
$
|
14,511,474
|
$
|
14,138,904
|
||||||||||
|
Securities (b)
|
4,648,807
|
4,528,090
|
4,480,972
|
4,425,546
|
4,143,097
|
|||||||||||||||
|
Earning assets
|
21,147,029
|
20,910,668
|
20,140,432
|
19,433,337
|
18,780,771
|
|||||||||||||||
|
Total assets
|
23,138,591
|
22,932,515
|
22,171,216
|
21,475,943
|
20,869,407
|
|||||||||||||||
|
Noninterest-bearing deposits
|
7,079,426
|
7,033,680
|
6,709,188
|
6,032,680
|
6,107,900
|
|||||||||||||||
|
Total deposits
|
18,717,755
|
18,281,754
|
17,821,484
|
17,313,433
|
16,862,088
|
|||||||||||||||
|
Common shareholders' equity
|
2,430,005
|
2,431,747
|
2,453,480
|
2,439,068
|
2,430,710
|
|||||||||||||||
|
COMMON SHARE DATA
|
||||||||||||||||||||
|
Earnings per share - diluted
|
$
|
0.59
|
$
|
0.05
|
$
|
0.19
|
$
|
0.52
|
$
|
0.44
|
||||||||||
|
Cash dividends per share
|
0.24
|
0.24
|
0.24
|
0.24
|
0.24
|
|||||||||||||||
|
Book value per share (period-end)
|
31.77
|
31.24
|
31.14
|
31.65
|
31.12
|
|||||||||||||||
|
Tangible book value per share (period-end)
|
22.50
|
21.90
|
21.74
|
22.18
|
21.63
|
|||||||||||||||
|
Weighted average number of shares - diluted
|
77,680
|
77,672
|
77,544
|
78,075
|
78,115
|
|||||||||||||||
|
Period-end number of shares
|
77,538
|
77,508
|
77,496
|
77,519
|
78,094
|
|||||||||||||||
|
Market data
|
||||||||||||||||||||
|
High sales price
|
$
|
27.84
|
$
|
25.84
|
$
|
30.96
|
$
|
32.47
|
$
|
32.98
|
||||||||||
|
Low sales price
|
21.93
|
20.01
|
23.35
|
25.20
|
28.02
|
|||||||||||||||
|
Period-end closing price
|
26.11
|
22.96
|
25.17
|
27.05
|
31.91
|
|||||||||||||||
|
Trading volume
|
41,668
|
56,319
|
48,789
|
44,705
|
40,162
|
|||||||||||||||
|
PERFORMANCE RATIOS
|
||||||||||||||||||||
|
Return on average assets
|
0.82
|
%
|
0.07
|
%
|
0.27
|
%
|
0.76
|
%
|
0.67
|
%
|
||||||||||
|
Return on average common equity
|
7.76
|
%
|
0.64
|
%
|
2.48
|
%
|
6.70
|
%
|
5.75
|
%
|
||||||||||
|
Return on average tangible common equity
|
11.04
|
%
|
0.91
|
%
|
3.53
|
%
|
9.60
|
%
|
8.28
|
%
|
||||||||||
|
Tangible common equity ratio (c)
|
7.81
|
%
|
7.69
|
%
|
7.62
|
%
|
8.24
|
%
|
8.13
|
%
|
||||||||||
|
Net interest margin (TE) (a)
|
3.25
|
%
|
3.23
|
%
|
3.21
|
%
|
3.28
|
%
|
3.30
|
%
|
||||||||||
|
Average loan/deposit ratio
|
85.80
|
%
|
86.69
|
%
|
85.28
|
%
|
83.82
|
%
|
83.85
|
%
|
||||||||||
|
Efficiency ratio (d)
|
62.14
|
%
|
64.47
|
%
|
67.63
|
%
|
65.88
|
%
|
66.67
|
%
|
||||||||||
|
Allowance for loan losses as a percent of period-end loans
|
1.41
|
%
|
1.36
|
%
|
1.15
|
%
|
0.95
|
%
|
0.91
|
%
|
||||||||||
|
Annualized net non-purchased credit impaired charge-offs to average loans
|
0.20
|
%
|
0.54
|
%
|
0.21
|
%
|
0.09
|
%
|
0.03
|
%
|
||||||||||
|
Allowance for loan losses to non-performing loans + accruing loans 90 days past due
|
73.01
|
%
|
74.55
|
%
|
105.54
|
%
|
78.15
|
%
|
100.92
|
%
|
||||||||||
|
Noninterest income as a percent of total revenue (TE) (a)
|
27.12
|
%
|
25.70
|
%
|
26.84
|
%
|
27.32
|
%
|
28.21
|
%
|
||||||||||
|
FTE headcount
|
3,723
|
3,819
|
3,921
|
3,863
|
3,825
|
|||||||||||||||
|
(a) Tax-equivalent (TE) amounts are calculated using a federal income tax rate of 35%.
|
||||||||||||||||||||
|
(b) Average securities does not include unrealized holding gains/losses on available for sale securities.
|
||||||||||||||||||||
|
(c) The tangible common equity ratio is common shareholders' equity less intangible assets divided by total assets less intangible assets.
|
||||||||||||||||||||
|
(d) The efficiency ratio is noninterest expense to total net interest (TE) and noninterest income, excluding amortization of purchased intangibles and nonoperating expense.
|
||||||||||||||||||||
7
|
HANCOCK HOLDING COMPANY
INCOME STATEMENT
(Unaudited)
|
|||||||||||||||||||
|
|
|||||||||||||||||||
|
Three Months Ended
|
Six Months Ended
|
||||||||||||||||||
|
(dollars in thousands, except per share data)
|
6/30/2016
|
3/31/2016
|
6/30/2015
|
6/30/2016
|
6/30/2015
|
||||||||||||||
|
NET INCOME
|
|||||||||||||||||||
|
Interest income
|
$
|
183,506
|
$
|
180,641
|
$
|
164,920
|
$
|
364,147
|
$
|
334,007
|
|||||||||
|
Interest income (TE)
|
189,702
|
185,984
|
168,008
|
375,686
|
340,051
|
||||||||||||||
|
Interest expense
|
18,537
|
17,805
|
13,129
|
36,342
|
24,058
|
||||||||||||||
|
Net interest income (TE)
|
171,165
|
168,179
|
154,879
|
339,344
|
315,993
|
||||||||||||||
|
Provision for loan losses
|
17,196
|
60,036
|
6,608
|
77,232
|
12,762
|
||||||||||||||
|
Noninterest income
|
63,694
|
58,186
|
60,874
|
121,880
|
117,420
|
||||||||||||||
|
Noninterest expense
|
150,942
|
156,032
|
158,917
|
306,974
|
312,432
|
||||||||||||||
|
Income before income taxes
|
60,525
|
4,954
|
47,140
|
65,479
|
102,175
|
||||||||||||||
|
Income tax expense
|
13,618
|
1,115
|
12,311
|
14,733
|
27,187
|
||||||||||||||
|
Net income
|
$
|
46,907
|
$
|
3,839
|
$
|
34,829
|
$
|
50,746
|
$
|
74,988
|
|||||||||
|
NONINTEREST INCOME AND NONINTEREST EXPENSE
|
|||||||||||||||||||
|
Service charges on deposit accounts
|
$
|
18,394
|
$
|
18,383
|
$
|
17,908
|
$
|
36,777
|
$
|
35,223
|
|||||||||
|
Trust fees
|
12,089
|
11,224
|
11,795
|
23,313
|
22,995
|
||||||||||||||
|
Bank card and ATM fees
|
11,954
|
11,348
|
11,868
|
23,302
|
23,051
|
||||||||||||||
|
Investment & annuity fees
|
5,043
|
4,933
|
4,838
|
9,976
|
9,888
|
||||||||||||||
|
Secondary mortgage market operations
|
4,176
|
2,912
|
3,618
|
7,088
|
6,282
|
||||||||||||||
|
Insurance commissions and fees
|
1,240
|
1,307
|
2,595
|
2,547
|
4,349
|
||||||||||||||
|
Amortization of FDIC loss share receivable
|
(1,526
|
)
|
(1,613
|
)
|
(1,273
|
)
|
(3,139
|
)
|
(2,470)
|
||||||||||
|
Securities transactions, net
|
768
|
346
|
-
|
1,114
|
333
|
||||||||||||||
|
Other income
|
11,556
|
9,346
|
9,525
|
20,902
|
17,769
|
||||||||||||||
|
Total noninterest income
|
$
|
63,694
|
$
|
58,186
|
$
|
60,874
|
$
|
121,880
|
$
|
117,420
|
|||||||||
|
Personnel expense
|
$
|
84,237
|
$
|
84,741
|
$
|
82,533
|
$
|
168,978
|
$
|
162,650
|
|||||||||
|
Net occupancy expense
|
10,394
|
10,356
|
11,765
|
20,750
|
22,927
|
||||||||||||||
|
Equipment expense
|
3,080
|
3,774
|
4,079
|
6,854
|
8,012
|
||||||||||||||
|
Other real estate expense, net
|
350
|
445
|
501
|
795
|
957
|
||||||||||||||
|
Other operating expense
|
47,876
|
46,614
|
44,964
|
94,490
|
89,179
|
||||||||||||||
|
Amortization of intangibles
|
5,005
|
5,124
|
6,148
|
10,129
|
12,466
|
||||||||||||||
|
Total operating expense
|
150,942
|
151,054
|
149,990
|
301,996
|
296,191
|
||||||||||||||
|
Nonoperating expense
|
-
|
4,978
|
8,927
|
4,978
|
16,241
|
||||||||||||||
|
Total noninterest expense
|
$
|
150,942
|
$
|
156,032
|
$
|
158,917
|
$
|
306,974
|
$
|
312,432
|
|||||||||
|
COMMON SHARE DATA
|
|||||||||||||||||||
|
Earnings per share:
|
|||||||||||||||||||
|
Basic
|
$
|
0.59
|
$
|
0.05
|
$
|
0.44
|
$
|
0.64
|
$
|
0.93
|
|||||||||
|
Diluted
|
0.59
|
0.05
|
0.44
|
0.64
|
0.93
|
||||||||||||||
8
|
HANCOCK HOLDING COMPANY
INCOME STATEMENT
(Unaudited)
|
||||||||||||||
|
|
||||||||||||||
|
Three months ended
|
||||||||||||||
|
(dollars in thousands)
|
6/30/2016
|
3/31/2016
|
12/31/2015
|
9/30/2015
|
6/30/2015
|
|||||||||
|
Interest income
|
$
|
183,506
|
$
|
180,641
|
$
|
174,310
|
$
|
171,329
|
$
|
164,920
|
||||
|
Interest income (TE)
|
189,702
|
185,984
|
178,550
|
174,633
|
168,008
|
|||||||||
|
Interest expense
|
18,537
|
17,805
|
15,915
|
14,499
|
13,129
|
|||||||||
|
Net interest income (TE)
|
171,165
|
168,179
|
162,635
|
160,134
|
154,879
|
|||||||||
|
Provision for loan losses
|
17,196
|
60,036
|
50,196
|
10,080
|
6,608
|
|||||||||
|
Noninterest income
|
63,694
|
58,186
|
59,653
|
60,211
|
60,874
|
|||||||||
|
Noninterest expense
|
150,942
|
156,032
|
156,030
|
151,193
|
158,917
|
|||||||||
|
Income before income taxes
|
60,525
|
4,954
|
11,822
|
55,768
|
47,140
|
|||||||||
|
Income tax expense
|
13,618
|
1,115
|
(3,485)
|
14,602
|
12,311
|
|||||||||
|
Net income
|
$
|
46,907
|
$
|
3,839
|
$
|
15,307
|
$
|
41,166
|
$
|
34,829
|
||||
|
NONINTEREST INCOME AND NONINTEREST EXPENSE
|
||||||||||||||
|
Service charges on deposit accounts
|
$
|
18,394
|
$
|
18,383
|
$
|
18,971
|
$
|
18,619
|
$
|
17,908
|
||||
|
Trust fees
|
12,089
|
11,224
|
11,287
|
11,345
|
11,795
|
|||||||||
|
Bank card and ATM fees
|
11,954
|
11,348
|
11,792
|
11,637
|
11,868
|
|||||||||
|
Investment & annuity fees
|
5,043
|
4,933
|
4,632
|
6,149
|
4,838
|
|||||||||
|
Secondary mortgage market operations
|
4,176
|
2,912
|
2,884
|
3,413
|
3,618
|
|||||||||
|
Insurance commissions and fees
|
1,240
|
1,307
|
1,980
|
2,238
|
2,595
|
|||||||||
|
Amortization of FDIC loss share receivable
|
(1,526)
|
(1,613)
|
(1,713)
|
(1,564)
|
(1,273)
|
|||||||||
|
Securities transactions, net
|
768
|
346
|
(2)
|
4
|
-
|
|||||||||
|
Other income
|
11,556
|
9,346
|
9,822
|
8,370
|
9,525
|
|||||||||
|
Total noninterest income
|
$
|
63,694
|
$
|
58,186
|
$
|
59,653
|
$
|
60,211
|
$
|
60,874
|
||||
|
Personnel expense
|
$
|
84,237
|
$
|
84,741
|
$
|
85,315
|
$
|
84,155
|
$
|
82,533
|
||||
|
Net occupancy expense
|
10,394
|
10,356
|
10,639
|
11,222
|
11,765
|
|||||||||
|
Equipment expense
|
3,080
|
3,774
|
3,871
|
3,598
|
4,079
|
|||||||||
|
Other real estate expense, net
|
350
|
445
|
1,361
|
422
|
501
|
|||||||||
|
Other operating expense
|
47,876
|
46,614
|
49,153
|
45,769
|
44,964
|
|||||||||
|
Amortization of intangibles
|
5,005
|
5,124
|
5,691
|
6,027
|
6,148
|
|||||||||
|
Total operating expense
|
150,942
|
151,054
|
156,030
|
151,193
|
149,990
|
|||||||||
|
Nonoperating expense
|
-
|
4,978
|
-
|
-
|
8,927
|
|||||||||
|
Total noninterest expense
|
$
|
150,942
|
$
|
156,032
|
$
|
156,030
|
$
|
151,193
|
$
|
158,917
|
||||
9
|
HANCOCK HOLDING COMPANY
PERIOD-END BALANCE SHEET
(Unaudited)
|
|||||||||||||||
|
|
|||||||||||||||
|
Three Months Ended
|
|||||||||||||||
|
(dollars in thousands)
|
6/30/2016
|
3/31/2016
|
12/31/2015
|
9/30/2015
|
6/30/2015
|
||||||||||
|
ASSETS
|
|||||||||||||||
|
Commercial non-real estate loans
|
$
|
7,132,519
|
$
|
7,145,406
|
$
|
6,995,824
|
$
|
6,345,994
|
$
|
6,185,684
|
|||||
|
Commercial real estate - owner occupied
|
1,916,200
|
1,923,347
|
1,859,469
|
1,843,155
|
1,760,742
|
||||||||||
|
Total commercial and industrial loans
|
9,048,719
|
9,068,753
|
8,855,293
|
8,189,149
|
7,946,426
|
||||||||||
|
Commercial real estate - income producing
|
2,024,471
|
1,752,745
|
1,553,082
|
1,484,231
|
1,452,091
|
||||||||||
|
Construction and land development loans
|
880,588
|
1,095,414
|
1,151,950
|
1,085,585
|
1,120,947
|
||||||||||
|
Residential mortgage loans
|
2,017,650
|
2,000,967
|
2,049,524
|
2,013,789
|
1,955,837
|
||||||||||
|
Consumer loans
|
2,064,368
|
2,060,245
|
2,093,465
|
1,990,296
|
1,869,451
|
||||||||||
|
Total loans
|
16,035,796
|
15,978,124
|
15,703,314
|
14,763,050
|
14,344,752
|
||||||||||
|
Loans held for sale
|
42,297
|
24,001
|
20,434
|
19,764
|
21,304
|
||||||||||
|
Securities
|
4,806,370
|
4,667,837
|
4,463,792
|
4,548,922
|
4,445,452
|
||||||||||
|
Short-term investments
|
153,159
|
151,551
|
565,555
|
194,414
|
598,455
|
||||||||||
|
Earning assets
|
21,037,622
|
20,821,513
|
20,753,095
|
19,526,150
|
19,409,963
|
||||||||||
|
Allowance for loan losses
|
(226,086)
|
(217,794)
|
(181,179)
|
(139,576)
|
(131,087)
|
||||||||||
|
Goodwill
|
621,193
|
621,193
|
621,193
|
621,193
|
621,193
|
||||||||||
|
Other intangible assets, net
|
97,409
|
102,414
|
107,538
|
113,229
|
119,256
|
||||||||||
|
Other assets
|
1,533,652
|
1,482,044
|
1,532,958
|
1,481,797
|
1,513,499
|
||||||||||
|
Total assets
|
$
|
23,063,790
|
$
|
22,809,370
|
$
|
22,833,605
|
$
|
21,602,793
|
$
|
21,532,824
|
|||||
|
LIABILITIES
|
|||||||||||||||
|
Noninterest-bearing deposits
|
$
|
7,151,416
|
$
|
7,108,598
|
$
|
7,276,127
|
$
|
6,075,558
|
$
|
6,180,814
|
|||||
|
Interest-bearing transaction and savings deposits
|
6,754,513
|
7,043,484
|
6,767,881
|
7,360,677
|
6,994,603
|
||||||||||
|
Interest-bearing public fund deposits
|
2,354,234
|
2,152,903
|
2,253,645
|
1,768,133
|
1,962,589
|
||||||||||
|
Time deposits
|
2,556,706
|
2,351,165
|
2,051,259
|
2,235,580
|
2,163,782
|
||||||||||
|
Total interest-bearing deposits
|
11,665,453
|
11,547,552
|
11,072,785
|
11,364,390
|
11,120,974
|
||||||||||
|
Total deposits
|
18,816,869
|
18,656,150
|
18,348,912
|
17,439,948
|
17,301,788
|
||||||||||
|
Short-term borrowings
|
1,095,107
|
1,100,787
|
1,423,644
|
1,049,182
|
1,079,193
|
||||||||||
|
Long-term debt
|
468,028
|
471,245
|
490,145
|
491,820
|
501,760
|
||||||||||
|
Other liabilities
|
220,421
|
160,148
|
157,761
|
168,282
|
220,043
|
||||||||||
|
Total liabilities
|
20,600,425
|
20,388,330
|
20,420,462
|
19,149,232
|
19,102,784
|
||||||||||
|
COMMON SHAREHOLDERS' EQUITY
|
|||||||||||||||
|
Common stock net of treasury and capital surplus
|
1,722,454
|
1,719,454
|
1,715,794
|
1,717,959
|
1,730,344
|
||||||||||
|
Retained earnings
|
790,452
|
762,652
|
777,944
|
781,769
|
759,780
|
||||||||||
|
Accumulated other comprehensive income
|
(49,541)
|
(61,066)
|
(80,595)
|
(46,167)
|
(60,084)
|
||||||||||
|
Total common shareholders' equity
|
2,463,365
|
2,421,040
|
2,413,143
|
2,453,561
|
2,430,040
|
||||||||||
|
Total liabilities & shareholders' equity
|
$
|
23,063,790
|
$
|
22,809,370
|
$
|
22,833,605
|
$
|
21,602,793
|
$
|
21,532,824
|
|||||
|
CAPITAL RATIOS
|
|||||||||||||||
|
Tangible common equity
|
$
|
1,744,764
|
$
|
1,697,434
|
$
|
1,684,388
|
$
|
1,719,108
|
$
|
1,689,550
|
|||||
|
Tier 1 capital (e)
|
1,852,382
|
1,818,580
|
1,844,992
|
1,848,418
|
1,837,369
|
||||||||||
|
Common equity (period-end) as a percent of total assets (period-end)
|
10.68%
|
10.61%
|
10.57%
|
11.36%
|
11.29%
|
||||||||||
|
Tangible common equity ratio
|
7.81%
|
7.69%
|
7.62%
|
8.24%
|
8.13%
|
||||||||||
|
Leverage (Tier 1) ratio (e)
|
8.22%
|
8.14%
|
8.55%
|
8.85%
|
9.07%
|
||||||||||
|
Tier 1 risk-based capital ratio (e)
|
9.81%
|
9.69%
|
9.96%
|
10.56%
|
10.77%
|
||||||||||
|
Total risk-based capital ratio (e)
|
11.80%
|
11.75%
|
11.86%
|
12.32%
|
12.53%
|
||||||||||
|
(e) Estimated for most recent period-end.
|
|||||||||||||||
10
|
HANCOCK HOLDING COMPANY
AVERAGE BALANCE SHEET
(Unaudited)
|
||||||||||||||
|
|
||||||||||||||
|
Three Months Ended
|
Six Months Ended
|
|||||||||||||
|
(dollars in thousands)
|
6/30/2016
|
3/31/2016
|
6/30/2015
|
6/30/2016
|
6/30/2015
|
|||||||||
|
ASSETS
|
||||||||||||||
|
Commercial non-real estate loans
|
$
|
7,179,528
|
$
|
7,066,298
|
$
|
6,095,054
|
$
|
7,122,913
|
$
|
6,045,645
|
||||
|
Commercial real estate - owner occupied
|
1,912,983
|
1,866,132
|
1,771,147
|
1,889,714
|
1,744,100
|
|||||||||
|
Total commercial and industrial loans
|
9,092,511
|
8,932,430
|
7,866,201
|
9,012,627
|
7,789,745
|
|||||||||
|
Commercial real estate - income producing
|
1,777,667
|
1,632,788
|
1,447,767
|
1,705,071
|
1,424,896
|
|||||||||
|
Construction and land development loans
|
1,120,494
|
1,147,984
|
1,084,540
|
1,134,239
|
1,102,699
|
|||||||||
|
Residential mortgage loans
|
2,015,301
|
2,058,514
|
1,930,553
|
2,036,907
|
1,916,789
|
|||||||||
|
Consumer loans
|
2,053,873
|
2,077,054
|
1,809,843
|
2,065,464
|
1,770,766
|
|||||||||
|
Total loans
|
16,059,846
|
15,848,770
|
14,138,904
|
15,954,308
|
14,004,895
|
|||||||||
|
Loans held for sale
|
29,053
|
14,822
|
22,883
|
21,937
|
19,245
|
|||||||||
|
Securities (f)
|
4,648,807
|
4,528,090
|
4,143,097
|
4,588,449
|
3,959,069
|
|||||||||
|
Short-term investments
|
409,323
|
518,986
|
475,887
|
464,155
|
566,380
|
|||||||||
|
Earning assets
|
21,147,029
|
20,910,668
|
18,780,771
|
21,028,849
|
18,549,589
|
|||||||||
|
Allowance for loan losses
|
(220,679)
|
(183,264)
|
(130,124)
|
(201,971)
|
(130,170)
|
|||||||||
|
Goodwill and other intangible assets
|
721,031
|
726,094
|
743,435
|
723,563
|
747,050
|
|||||||||
|
Other assets
|
1,491,210
|
1,479,017
|
1,475,325
|
1,485,112
|
1,490,403
|
|||||||||
|
Total assets
|
$
|
23,138,591
|
$
|
22,932,515
|
$
|
20,869,407
|
$
|
23,035,553
|
$
|
20,656,872
|
||||
|
LIABILITIES AND SHAREHOLDERS' EQUITY
|
||||||||||||||
|
Noninterest-bearing deposits
|
$
|
7,079,426
|
$
|
7,033,680
|
$
|
6,107,900
|
$
|
7,056,553
|
$
|
6,016,623
|
||||
|
Interest-bearing transaction and savings deposits
|
6,779,565
|
6,815,703
|
6,656,911
|
6,797,634
|
6,582,277
|
|||||||||
|
Interest-bearing public fund deposits
|
2,302,096
|
2,173,435
|
1,890,364
|
2,237,766
|
1,853,111
|
|||||||||
|
Time deposits
|
2,556,668
|
2,258,936
|
2,206,913
|
2,407,802
|
2,222,771
|
|||||||||
|
Total interest-bearing deposits
|
11,638,329
|
11,248,074
|
10,754,188
|
11,443,202
|
10,658,159
|
|||||||||
|
Total deposits
|
18,717,755
|
18,281,754
|
16,862,088
|
18,499,755
|
16,674,782
|
|||||||||
|
Short-term borrowings
|
1,351,227
|
1,564,804
|
896,014
|
1,458,015
|
908,158
|
|||||||||
|
Long-term debt
|
471,924
|
483,348
|
510,314
|
477,636
|
460,958
|
|||||||||
|
Other liabilities
|
167,680
|
170,862
|
170,281
|
169,271
|
173,732
|
|||||||||
|
Common shareholders' equity
|
2,430,005
|
2,431,747
|
2,430,710
|
2,430,876
|
2,439,242
|
|||||||||
|
Total liabilities & shareholders' equity
|
$
|
23,138,591
|
$
|
22,932,515
|
$
|
20,869,407
|
$
|
23,035,553
|
$
|
20,656,872
|
||||
|
(f) Average securities does not include unrealized holding gains/losses on available for sale securities.
|
||||||||||||||
11
|
HANCOCK HOLDING COMPANY
AVERAGE BALANCE AND NET INTEREST MARGIN SUMMARY
(Unaudited)
|
||||||||||||||||||||||||||
|
|
||||||||||||||||||||||||||
|
Three Months Ended
|
||||||||||||||||||||||||||
|
6/30/2016
|
3/31/2016
|
6/30/2015
|
||||||||||||||||||||||||
|
(dollars in millions)
|
Volume
|
Interest
|
Rate
|
Volume
|
Interest
|
Rate
|
Volume
|
Interest
|
Rate
|
|||||||||||||||||
|
AVERAGE EARNING ASSETS
|
||||||||||||||||||||||||||
|
Commercial & real estate loans (TE) (h)
|
$
|
11,990.7
|
$
|
115.0
|
3.86
|
%
|
$
|
11,713.2
|
$
|
111.7
|
3.83
|
%
|
$
|
10,398.5
|
$
|
101.6
|
3.92
|
%
|
||||||||
|
Residential mortgage loans
|
2,015.3
|
20.7
|
4.12
|
%
|
2,058.5
|
21.3
|
4.13
|
%
|
1,930.6
|
19.9
|
4.13
|
%
|
||||||||||||||
|
Consumer loans
|
2,053.9
|
26.2
|
5.12
|
%
|
2,077.1
|
26.3
|
5.10
|
%
|
1,809.8
|
23.0
|
5.10
|
%
|
||||||||||||||
|
Loan fees & late charges
|
-
|
(0.6)
|
|
0.00
|
%
|
-
|
(0.8)
|
|
0.00
|
%
|
-
|
-
|
0.00
|
%
|
||||||||||||
|
Total loans (TE) (i)
|
16,059.9
|
161.3
|
4.03
|
%
|
15,848.8
|
158.5
|
4.02
|
%
|
14,138.9
|
144.5
|
4.10
|
%
|
||||||||||||||
|
Loans held for sale
|
29.1
|
0.2
|
3.43
|
%
|
14.8
|
0.2
|
4.28
|
%
|
22.9
|
0.2
|
3.88
|
%
|
||||||||||||||
|
US Treasury and government agency securities
|
50.0
|
0.2
|
1.68
|
%
|
50.1
|
0.2
|
1.67
|
%
|
300.0
|
1.2
|
1.54
|
%
|
||||||||||||||
|
CMOs and mortgage backed securities
|
4,062.3
|
22.0
|
2.16
|
%
|
4,132.8
|
22.9
|
2.21
|
%
|
3,641.6
|
19.6
|
2.15
|
%
|
||||||||||||||
|
Municipals (TE) (h)
|
531.4
|
5.5
|
4.13
|
%
|
339.1
|
3.6
|
4.27
|
%
|
195.5
|
2.2
|
4.54
|
%
|
||||||||||||||
|
Other securities
|
5.0
|
0.0
|
1.89
|
%
|
6.1
|
0.0
|
1.85
|
%
|
6.0
|
-
|
1.61
|
%
|
||||||||||||||
|
Total securities (TE) (g)
|
4,648.7
|
27.7
|
2.38
|
%
|
4,528.1
|
26.7
|
2.36
|
%
|
4,143.1
|
23.0
|
2.22
|
%
|
||||||||||||||
|
Total short-term investments
|
409.3
|
0.5
|
0.47
|
%
|
519.0
|
0.6
|
0.47
|
%
|
475.9
|
0.3
|
0.23
|
%
|
||||||||||||||
|
Average earning assets yield (TE)
|
$
|
21,147.0
|
189.7
|
3.60
|
%
|
$
|
20,910.7
|
186.0
|
3.57
|
%
|
$
|
18,780.8
|
168.0
|
3.58
|
%
|
|||||||||||
|
INTEREST-BEARING LIABILITIES
|
||||||||||||||||||||||||||
|
Interest-bearing transaction and savings deposits
|
$
|
6,779.6
|
4.7
|
0.28
|
%
|
$
|
6,815.7
|
4.7
|
0.28
|
%
|
$
|
6,656.9
|
2.5
|
0.15
|
%
|
|||||||||||
|
Time deposits
|
2,556.7
|
5.7
|
0.90
|
%
|
2,258.9
|
4.9
|
0.88
|
%
|
2,206.9
|
3.8
|
0.69
|
%
|
||||||||||||||
|
Public funds
|
2,302.1
|
2.2
|
0.39
|
%
|
2,173.5
|
2.1
|
0.38
|
%
|
1,890.4
|
1.3
|
0.28
|
%
|
||||||||||||||
|
Total interest-bearing deposits
|
11,638.4
|
12.6
|
0.44
|
%
|
11,248.1
|
11.7
|
0.42
|
%
|
10,754.2
|
7.6
|
0.28
|
%
|
||||||||||||||
|
Short-term borrowings
|
1,351.2
|
0.9
|
0.27
|
%
|
1,564.8
|
1.0
|
0.26
|
%
|
896.0
|
0.2
|
0.08
|
%
|
||||||||||||||
|
Long-term debt
|
471.9
|
5.0
|
4.26
|
%
|
483.3
|
5.1
|
4.20
|
%
|
510.3
|
5.3
|
4.18
|
%
|
||||||||||||||
|
Total borrowings
|
1,823.1
|
5.9
|
1.30
|
%
|
2,048.1
|
6.1
|
1.19
|
%
|
1,406.3
|
5.5
|
1.57
|
%
|
||||||||||||||
|
Total interest-bearing liabilities cost
|
13,461.5
|
18.5
|
0.55
|
%
|
13,296.2
|
17.8
|
0.54
|
%
|
12,160.5
|
13.1
|
0.43
|
%
|
||||||||||||||
|
Net interest-free funding sources
|
7,685.5
|
7,614.5
|
6,620.3
|
|||||||||||||||||||||||
|
Total cost of funds
|
21,147.0
|
18.5
|
0.35
|
%
|
20,910.7
|
17.8
|
0.34
|
%
|
18,780.8
|
13.1
|
0.28
|
%
|
||||||||||||||
|
Net Interest Spread (TE)
|
$
|
171.2
|
3.05
|
%
|
$
|
168.2
|
3.03
|
%
|
$
|
154.9
|
3.15
|
%
|
||||||||||||||
|
Net Interest Margin (TE)
|
$
|
21,147.0
|
$
|
171.2
|
3.25
|
%
|
$
|
20,910.7
|
$
|
168.2
|
3.23
|
%
|
$
|
18,780.8
|
$
|
154.9
|
3.30
|
%
|
||||||||
|
(g) Average securities does not include unrealized holding gains/losses on available for sale securities.
|
||||||||||||||||||||||||||
|
(h) Tax equivalent (te) amounts are calculated using a marginal federal tax rate of 35%.
|
||||||||||||||||||||||||||
|
(i) Includes nonaccrual loans.
|
||||||||||||||||||||||||||
12
|
HANCOCK HOLDING COMPANY
AVERAGE BALANCE AND NET INTEREST MARGIN SUMMARY
(Unaudited)
|
|||||||||||||||||
|
|
|||||||||||||||||
|
Six Months Ended
|
|||||||||||||||||
|
6/30/2016
|
6/30/2015
|
||||||||||||||||
|
(dollars in millions)
|
Volume
|
Interest
|
Rate
|
Volume
|
Interest
|
Rate
|
|||||||||||
|
AVERAGE EARNING ASSETS
|
|||||||||||||||||
|
Commercial & real estate loans (TE) (h)
|
$
|
11,851.9
|
$
|
226.7
|
3.84
|
%
|
$
|
10,317.3
|
$
|
208.4
|
4.07
|
%
|
|||||
|
Residential mortgage loans
|
2,036.9
|
42.0
|
4.12
|
%
|
1,916.8
|
40.4
|
4.21
|
%
|
|||||||||
|
Consumer loans
|
2,065.5
|
52.5
|
5.11
|
%
|
1,770.7
|
44.9
|
5.12
|
%
|
|||||||||
|
Loan fees & late charges
|
-
|
(1.4)
|
|
0.00
|
%
|
-
|
0.3
|
0.00
|
%
|
||||||||
|
Total loans (TE) (i)
|
15,954.3
|
319.8
|
4.03
|
%
|
14,004.8
|
294.0
|
4.23
|
%
|
|||||||||
|
Loans held for sale
|
21.9
|
0.4
|
3.72
|
%
|
19.2
|
0.3
|
3.30
|
%
|
|||||||||
|
US Treasury and government agency securities
|
50.0
|
0.4
|
1.68
|
%
|
287.6
|
2.2
|
1.56
|
%
|
|||||||||
|
CMOs and mortgage backed securities
|
4,097.6
|
44.8
|
2.19
|
%
|
3,467.1
|
38.2
|
2.21
|
%
|
|||||||||
|
Municipals (TE) (h)
|
435.3
|
9.1
|
4.18
|
%
|
195.7
|
4.5
|
4.58
|
%
|
|||||||||
|
Other securities
|
5.6
|
0.1
|
1.87
|
%
|
8.8
|
0.2
|
3.51
|
%
|
|||||||||
|
Total securities (TE) (g)
|
4,588.5
|
54.4
|
2.37
|
%
|
3,959.2
|
45.1
|
2.28
|
%
|
|||||||||
|
Total short-term investments
|
464.2
|
1.1
|
0.47
|
%
|
566.4
|
0.7
|
0.22
|
%
|
|||||||||
|
Average earning assets yield (TE)
|
$
|
21,028.9
|
375.7
|
3.59
|
%
|
$
|
18,549.6
|
340.1
|
3.69
|
%
|
|||||||
|
INTEREST-BEARING LIABILITIES
|
|||||||||||||||||
|
Interest-bearing transaction and savings deposits
|
$
|
6,797.6
|
9.4
|
0.28
|
%
|
$
|
6,582.3
|
4.7
|
0.14
|
%
|
|||||||
|
Time deposits
|
2,407.8
|
10.7
|
0.89
|
%
|
2,222.8
|
7.5
|
0.68
|
%
|
|||||||||
|
Public funds
|
2,237.8
|
4.3
|
0.38
|
%
|
1,853.1
|
2.5
|
0.28
|
%
|
|||||||||
|
Total interest-bearing deposits
|
11,443.2
|
24.4
|
0.43
|
%
|
10,658.2
|
14.7
|
0.28
|
%
|
|||||||||
|
Short-term borrowings
|
1,458.0
|
1.9
|
0.26
|
%
|
908.2
|
0.4
|
0.08
|
%
|
|||||||||
|
Long-term debt
|
477.6
|
10.1
|
4.23
|
%
|
461.0
|
9.0
|
3.92
|
%
|
|||||||||
|
Total borrowings
|
1,935.6
|
12.0
|
1.24
|
%
|
1,369.2
|
9.4
|
1.37
|
%
|
|||||||||
|
Total interest-bearing liabilities cost
|
13,378.8
|
36.4
|
0.55
|
%
|
12,027.4
|
24.1
|
0.40
|
%
|
|||||||||
|
Net interest-free funding sources
|
7,650.1
|
6,522.2
|
|||||||||||||||
|
Total cost of funds
|
21,028.9
|
36.4
|
0.35
|
%
|
18,549.6
|
24.1
|
0.26
|
%
|
|||||||||
|
Net Interest Spread (TE)
|
$
|
339.3
|
3.04
|
%
|
$
|
316.0
|
3.29
|
%
|
|||||||||
|
Net Interest Margin (TE)
|
$
|
21,028.9
|
$
|
339.3
|
3.24
|
%
|
$
|
18,549.6
|
$
|
316.0
|
3.43
|
%
|
|||||
|
(g) Average securities does not include unrealized holding gains/losses on available for sale securities.
|
|||||||||||||||||
|
(h) Tax equivalent (te) amounts are calculated using a marginal federal tax rate of 35%
|
|||||||||||||||||
|
(i) Includes nonaccrual loans.
|
|||||||||||||||||
13
|
HANCOCK HOLDING COMPANY
ASSET QUALITY INFORMATION
(Unaudited)
|
||||||||||||||
|
|
||||||||||||||
|
Three Months Ended
|
Six Months Ended
|
|||||||||||||
|
(dollars in thousands)
|
6/30/2016
|
3/31/2016
|
6/30/2015
|
6/30/2016
|
6/30/2015
|
|||||||||
|
Nonaccrual loans (j)
|
$
|
265,722
|
$
|
237,303
|
$
|
118,445
|
$
|
265,722
|
$
|
118,445
|
||||
|
Restructured loans - still accruing
|
35,974
|
45,620
|
7,966
|
35,974
|
7,966
|
|||||||||
|
Total nonperforming loans
|
301,696
|
282,923
|
126,411
|
301,696
|
126,411
|
|||||||||
|
ORE and foreclosed assets
|
23,374
|
24,032
|
38,630
|
23,374
|
38,630
|
|||||||||
|
Total nonperforming assets
|
$
|
325,070
|
$
|
306,955
|
$
|
165,041
|
$
|
325,070
|
$
|
165,041
|
||||
|
Nonperforming assets as a percent of loans, ORE and foreclosed assets
|
2.02%
|
1.92%
|
1.15%
|
2.02%
|
1.15%
|
|||||||||
|
Accruing loans 90 days past due
|
$
|
7,982
|
$
|
9,226
|
$
|
3,478
|
$
|
7,982
|
$
|
3,478
|
||||
|
Accruing loans 90 days past due as a percent of loans
|
0.05%
|
0.06%
|
0.02%
|
0.05%
|
0.02%
|
|||||||||
|
Nonperforming assets + accruing loans 90 days past dueto loans, ORE and foreclosed assets
|
2.07%
|
1.98%
|
1.17%
|
2.07%
|
1.17%
|
|||||||||
|
ALLOWANCE FOR LOAN LOSSES
|
||||||||||||||
|
Beginning Balance
|
$
|
217,794
|
$
|
181,179
|
$
|
128,386
|
$
|
181,179
|
$
|
128,762
|
||||
|
Net provision for loan losses - purchased credit impaired loans
|
189
|
(496)
|
(879)
|
(307)
|
(949)
|
|||||||||
|
Provision for loan losses - non-purchased credit impaired loans
|
17,007
|
60,532
|
7,487
|
77,539
|
13,711
|
|||||||||
|
Net provision for loan losses
|
17,196
|
60,036
|
6,608
|
77,232
|
12,762
|
|||||||||
|
(Decrease)increase in FDIC loss share receivable
|
(1,248)
|
(2,189)
|
(2,115)
|
(3,437)
|
(2,536)
|
|||||||||
|
Net charge-offs - purchased credit impaired
|
(147)
|
(67)
|
582
|
(214)
|
3,037
|
|||||||||
|
Charge-offs - non-purchased credit impaired
|
11,361
|
24,693
|
4,129
|
36,054
|
11,589
|
|||||||||
|
Recoveries - non-purchased credit impaired
|
(3,558)
|
(3,394)
|
(2,919)
|
(6,952)
|
(6,725)
|
|||||||||
|
Net charge-offs
|
7,656
|
21,232
|
1,792
|
28,888
|
7,901
|
|||||||||
|
Ending Balance
|
$
|
226,086
|
$
|
217,794
|
$
|
131,087
|
$
|
226,086
|
$
|
131,087
|
||||
|
Allowance for loan losses as a percent of period-end loans
|
1.41%
|
1.36%
|
0.91%
|
1.41%
|
0.91%
|
|||||||||
|
Allowance for loan losses to nonperforming loans + accruing loans90 days past due
|
73.01%
|
74.55%
|
100.92%
|
73.01%
|
100.92%
|
|||||||||
|
NET CHARGE-OFF INFORMATION
|
||||||||||||||
|
Net charge-offs - non-purchased credit impaired:
|
||||||||||||||
|
Commercial & real estate loans
|
$
|
3,685
|
$
|
17,076
|
$
|
(691)
|
$
|
20,761
|
$
|
(217)
|
||||
|
Residential mortgage loans
|
164
|
(126)
|
(61)
|
38
|
843
|
|||||||||
|
Consumer loans
|
3,954
|
4,349
|
1,962
|
8,303
|
4,238
|
|||||||||
|
Total net charge-offs - non-purchased credit impaired
|
$
|
7,803
|
$
|
21,299
|
$
|
1,210
|
$
|
29,102
|
$
|
4,864
|
||||
|
Net charge-offs - non-purchased credit impaired to average loans:
|
||||||||||||||
|
Commercial & real estate loans
|
0.12%
|
0.59%
|
(0.03)%
|
0.35%
|
(0.00)%
|
|||||||||
|
Residential mortgage loans
|
0.03%
|
(0.02)%
|
(0.01)%
|
0.00%
|
0.09%
|
|||||||||
|
Consumer loans
|
0.77%
|
0.84%
|
0.43%
|
0.81%
|
0.48%
|
|||||||||
|
Total net charge-offs - non-purchased credit impaired to average loans
|
0.20%
|
0.54%
|
0.03%
|
0.37%
|
0.07%
|
|||||||||
|
(j) Included in nonaccrual loans are nonaccruing restructured loans totaling $34.8 million, $18.3 million, and $4.9 million at 6/30/16, 3/31/16 and 6/30/15, respectively. Nonaccrual loans and accruing loans past due 90 days or more do not include purchased credit impaired loans which were written down to fair value upon acquisition and accrete interest income over the remaining life of the loan. Purchased credit impaired loans include loans covered by FDIC loss share agreement totaling $160.0 million, $168.1 million and $179.0 million as of 6/30/16, 3/31/16 and 6/30/15, respectively.
|
||||||||||||||
14
|
HANCOCK HOLDING COMPANY
ASSET QUALITY INFORMATION
(Unaudited)
|
||||||||||||||
|
|
||||||||||||||
|
Three months ended
|
||||||||||||||
|
(dollars in thousands)
|
6/30/2016
|
3/31/2016
|
12/31/2015
|
9/30/2015
|
6/30/2015
|
|||||||||
|
Nonaccrual loans (j)
|
$
|
265,722
|
$
|
237,303
|
$
|
159,713
|
$
|
166,945
|
$
|
118,445
|
||||
|
Restructured loans - still accruing
|
35,974
|
45,620
|
4,297
|
5,779
|
7,966
|
|||||||||
|
Total nonperforming loans
|
301,696
|
282,923
|
164,010
|
172,724
|
126,411
|
|||||||||
|
ORE and foreclosed assets
|
23,374
|
24,032
|
27,133
|
33,599
|
38,630
|
|||||||||
|
Total nonperforming assets
|
$
|
325,070
|
$
|
306,955
|
$
|
191,143
|
$
|
206,323
|
$
|
165,041
|
||||
|
Nonperforming assets as a percent of loans, ORE and foreclosed assets
|
2.02%
|
1.92%
|
1.22%
|
1.39%
|
1.15%
|
|||||||||
|
Accruing loans 90 days past due
|
$
|
7,982
|
$
|
9,226
|
$
|
7,653
|
$
|
5,876
|
$
|
3,478
|
||||
|
Accruing loans 90 days past due as a percent of loans
|
0.05%
|
0.06%
|
0.05%
|
0.04%
|
0.02%
|
|||||||||
|
Nonperforming assets + accruing loans 90 days past dueto loans, ORE and foreclosed assets
|
2.07%
|
1.98%
|
1.26%
|
1.43%
|
1.17%
|
|||||||||
|
Allowance for loan losses
|
$
|
226,086
|
$
|
217,794
|
$
|
181,179
|
$
|
139,576
|
$
|
131,087
|
||||
|
Allowance for loan losses as a percent of period-end loans
|
1.41%
|
1.36%
|
1.15%
|
0.95%
|
0.91%
|
|||||||||
|
Allowance for loan losses to nonperforming loans + accruing loans 90 days past due
|
73.01%
|
74.55%
|
105.54%
|
78.15%
|
100.92%
|
|||||||||
|
Provision for loan losses
|
$
|
17,196
|
$
|
60,036
|
$
|
50,196
|
$
|
10,080
|
$
|
6,608
|
||||
|
NET CHARGE-OFF INFORMATION
|
||||||||||||||
|
Net charge-offs - non-purchased credit impaired:
|
||||||||||||||
|
Commercial & real estate loans
|
$
|
3,685
|
$
|
17,076
|
$
|
2,465
|
$
|
666
|
$
|
(691)
|
||||
|
Residential mortgage loans
|
164
|
(126)
|
75
|
30
|
(61)
|
|||||||||
|
Consumer loans
|
3,954
|
4,349
|
5,337
|
2,775
|
1,962
|
|||||||||
|
Total net charge-offs - non-purchased credit impaired
|
$
|
7,803
|
$
|
21,299
|
$
|
7,877
|
$
|
3,471
|
$
|
1,210
|
||||
|
Net charge-offs - non-purchased credit impaired to average loans:
|
||||||||||||||
|
Commercial & real estate loans
|
0.12%
|
0.59%
|
0.09%
|
0.02%
|
(0.03)%
|
|||||||||
|
Residential mortgage loans
|
0.03%
|
(0.02)%
|
0.01%
|
0.01%
|
(0.01)%
|
|||||||||
|
Consumer loans
|
0.77%
|
0.84%
|
1.04%
|
0.57%
|
0.43%
|
|||||||||
|
Total net charge-offs - non-purchased credit impaired to average loans
|
0.20%
|
0.54%
|
0.21%
|
0.09%
|
0.03%
|
|||||||||
|
AVERAGE LOANS
|
||||||||||||||
|
Commercial & real estate loans
|
$
|
11,990,672
|
$
|
11,713,202
|
$
|
11,128,872
|
$
|
10,608,244
|
$
|
10,398,508
|
||||
|
Residential mortgage loans
|
2,015,301
|
2,058,514
|
2,028,688
|
1,977,990
|
1,930,553
|
|||||||||
|
Consumer loans
|
2,053,873
|
2,077,054
|
2,040,672
|
1,925,240
|
1,809,843
|
|||||||||
|
Total average loans
|
$
|
16,059,846
|
$
|
15,848,770
|
$
|
15,198,232
|
$
|
14,511,474
|
$
|
14,138,904
|
||||
|
(j) Included in nonaccrual loans are nonaccruing restructured loans totaling $34.8 million, $18.3 million, $8.8 million, $4.9 million, and $4.9 million at 6/30/16, 3/31/16, 12/31/15, 9/30/15, and 6/30/15, respectively. Nonaccrual loans and accruing loans past due 90 days or more do not include purchased credit-impaired loans which were written down to fair value upon acquisition and accrete interest income over the remaining life of the loan. Purchased credit impaired loans include loans covered by FDIC loss share agreement totaling $160.0 million, $168.1 million, $170.1 million, $177.5 million and $179.0 million as of 6/30/16, 3/31/16, 12/31/15, 9/30/15 and 6/30/15, respectively.
|
||||||||||||||
15

7/20/2016 Second Quarter 2016Financial Results
16

Forward Looking Statements Certain of the statements or information included in this presentation may constitute forward-looking statements. Forward-looking statements include projections of revenue, costs, results of operations or financial condition or statements regarding future market conditions or our potential plans and strategies for the future. Hancock’s ability to accurately project results, predict the effects of future plans or strategies, or predict market or economic developments is inherently limited. We believe that the expectations reflected or implied by any forward-looking statements are based on reasonable assumptions, but actual results and performance could differ materially from those set forth in the forward-looking statements. Factors that could cause actual results or outcomes to differ from those expressed in the Company's forward-looking statements include, but are not limited to, those outlined in Hancock's SEC filings, including the “Risk Factors” section of the Company’s 10-K for the year ended December 31, 2015, and as updated by the Company’s subsequent SEC filings. Hancock undertakes no obligation to update or revise any forward-looking statements, and you are cautioned not to place undue reliance on such forward-looking statements.
17

Corporate Profile (as of June 30, 2016) $23.1 billion in Total Assets$16.0 billion in Total Loans$18.8 billion in Total DepositsTangible Common Equity (TCE) 7.81%Nearly 200 banking locations and 275 ATMs across our footprintApproximately 3,800 employees corporate-wideRated among the strongest,safest financial institutions in the country by BauerFinancial,Inc.Earned top customer servicemarks with Greenwich Excellence Awards
18

(compared to first quarter 2016) Second Quarter 2016 Highlights Net income totaled $46.9 million or $.59 per diluted common shareCore pre-tax, pre-provision income $85.2 million, up $8.8 million or 12%Loans increased $58 million; energy loans decreased approximately $153 million linked-quarterEnergy loans 9% of total loansDeposits increased $161 millionCore revenue increased $8.8 million with flat operating expenses Core NIM up 3 bps Allowance for the energy portfolio unchanged at $111 million; 7.5% of energy loans Tangible common equity (TCE) ratio up 12 bps to 7.81% ** Efficiency Ratio is noninterest expense to total net interest (TE) and noninterest income, excluding amortization of purchased intangibles and nonoperating expense.
19

Linked-quarter growth in core PTPP income +12%Year-over-year growth in core PTPP income +30% $s in millions Growth in Core Pre-Tax Pre-Provision Income
20

Well-Diversified Loan Growth Loans totaled $16.0 billion at quarter-end, an increase of $58 millionReflects $153 million net decrease in energy-related loansManagement expects loan growth of 5-7% for the full year of 2016 (period-end)Additional data provided on breakout between owner-occupied CRE loans (C&I) and income-producing CRE loans $s in millions
21

Over Half Of Our Footprint Not Impacted By Energy Main markets impacted by energy
22

Energy Portfolio Overview Energy loans totaled $1.48 billion, or 9% of total loans, down $153 million linked-quarter and down $188 million from a year agoLinked-quarter change reflects approximately $180 million in payoffs and paydowns, plus $4 million in charge-offs, partially offset by approximately $31 million in draws on existing lines
23
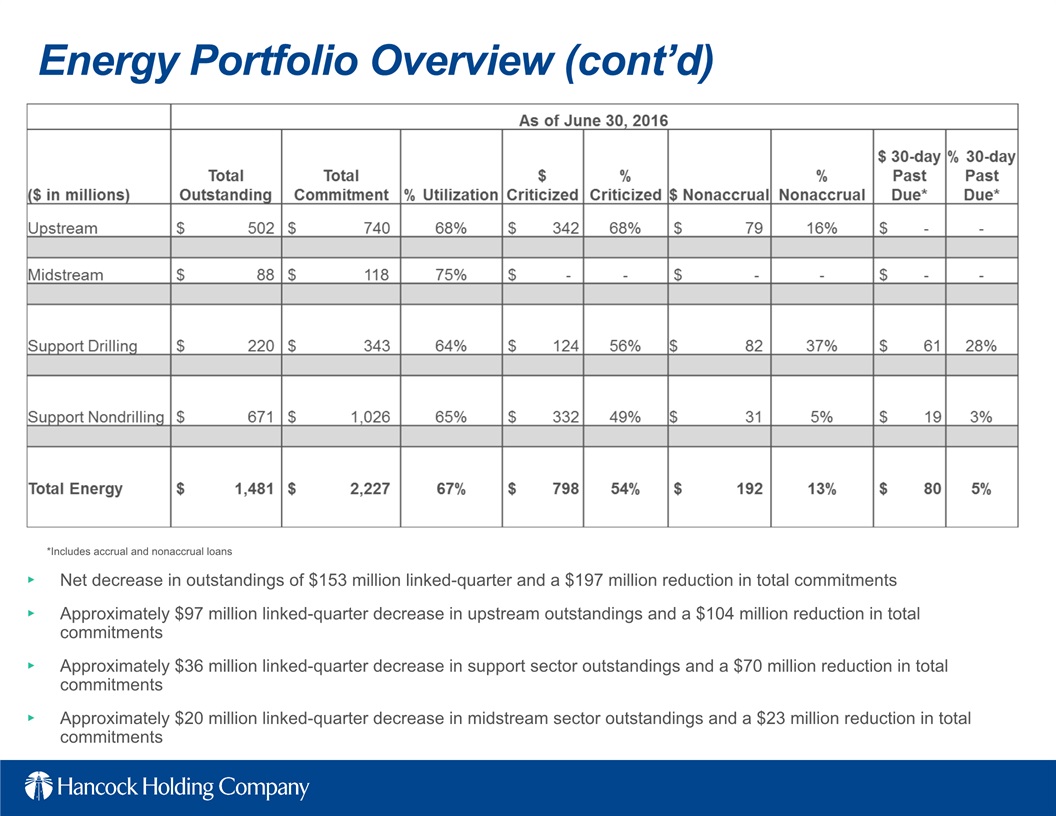
Energy Portfolio Overview (cont’d) Net decrease in outstandings of $153 million linked-quarter and a $197 million reduction in total commitmentsApproximately $97 million linked-quarter decrease in upstream outstandings and a $104 million reduction in total commitments Approximately $36 million linked-quarter decrease in support sector outstandings and a $70 million reduction in total commitmentsApproximately $20 million linked-quarter decrease in midstream sector outstandings and a $23 million reduction in total commitments *Includes accrual and nonaccrual loans
Energy Portfolio Overview (cont’d) Net decrease in outstandings of $153 million linked-quarter and a $197 million reduction in total commitmentsApproximately $97 million linked-quarter decrease in upstream outstandings and a $104 million reduction in total commitments Approximately $36 million linked-quarter decrease in support sector outstandings and a $70 million reduction in total commitmentsApproximately $20 million linked-quarter decrease in midstream sector outstandings and a $23 million reduction in total commitments *Includes accrual and nonaccrual loans
24

Energy Portfolio Overview (cont’d)
25

Energy Allowance and Category Trends Management currently estimates that charge-offs from energy-related credits could approximate $65-$95 million over the duration of the cycleCharge-offs to-date for current energy cycle (Nov ‘14 – June ‘16) total $25 million; includes $4.0 million in 2Q16A portion of the allowance for the upstream segment was reallocated to the support nondrilling segment in the second quarter
26
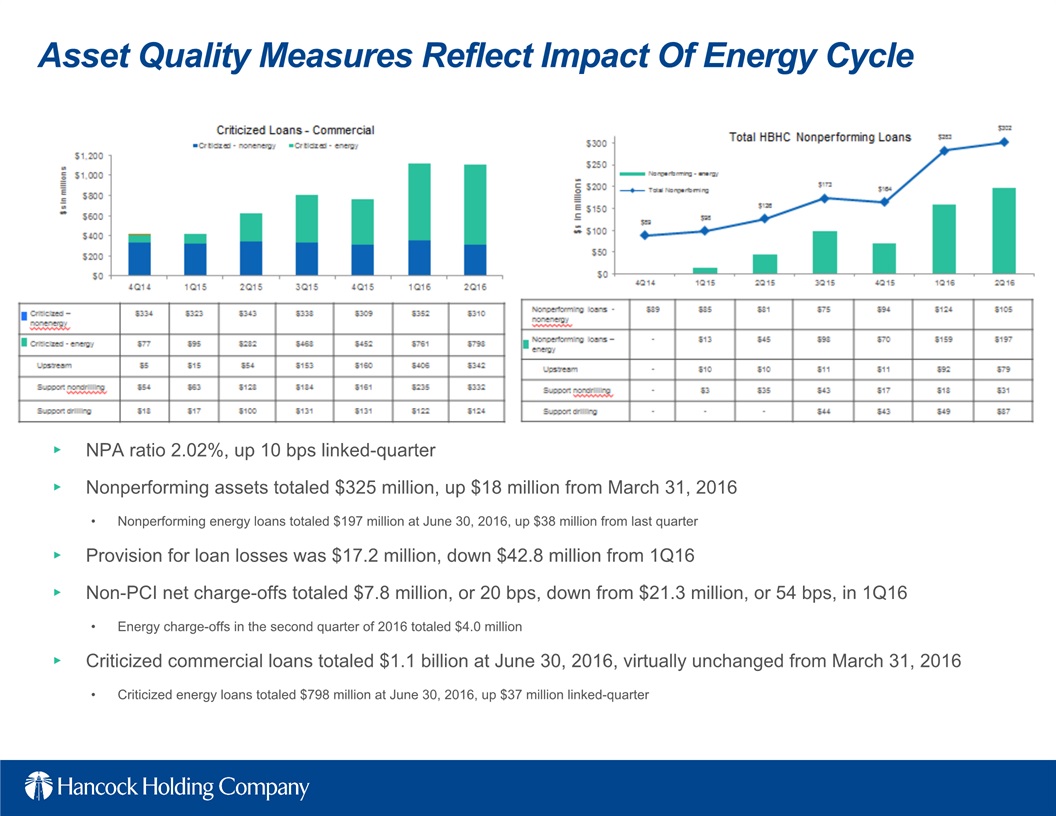
Asset Quality Measures Reflect Impact Of Energy Cycle NPA ratio 2.02%, up 10 bps linked-quarter Nonperforming assets totaled $325 million, up $18 million from March 31, 2016Nonperforming energy loans totaled $197 million at June 30, 2016, up $38 million from last quarterProvision for loan losses was $17.2 million, down $42.8 million from 1Q16Non-PCI net charge-offs totaled $7.8 million, or 20 bps, down from $21.3 million, or 54 bps, in 1Q16Energy charge-offs in the second quarter of 2016 totaled $4.0 millionCriticized commercial loans totaled $1.1 billion at June 30, 2016, virtually unchanged from March 31, 2016Criticized energy loans totaled $798 million at June 30, 2016, up $37 million linked-quarter
27

Allowance For Loan Losses The allowance for loan losses was $226.1 million (1.41%) up $8.3 million from $217.8 million (1.36%) linked-quarterThe allowance maintained on the non-PCI portion of the loan portfolio increased $9.2 million linked-quarter, totaling $206.5 million, while the allowance on the FDIC acquired loan portfolio decreased $0.9 million linked-quarterALLL for energy credits was $111.1 million, or 7.50%, at June 30, 2016, up 69 bps from March 31, 2016 Should pricing pressures on oil continue, we could continue to see downward pressure on risk ratings that could lead to additional provision expense in future quartersImpact and severity will depend on overall oil prices and the duration of the cycleNonenergy ALLL is approximately $115.0 million, or 0.79%, of nonenergy portfolio as of June 30, 2016, up from $106.7 million, or 0.74%, at March 31, 2016
28

Adequate Reserve Coverage Management believes the nonenergy allowance is adequate as: Net nonenergy charge-offs (excluding People’s First) averaged $17 million or 0.14% of related average loans over past 14 quarters; nonenergy ALLL represents 5.5x coverage of average annual charge-offsSensitivity testing used in our PLLL/ALLL forecasts included the consumer loans and CRE loans in the oil patchWe utilize robust and conservative ALLL modeling processALLL segmentation at a granular level by geography and productIncorporates both quantitative and qualitative components at each levelALLL model includes sensitivity testing
29
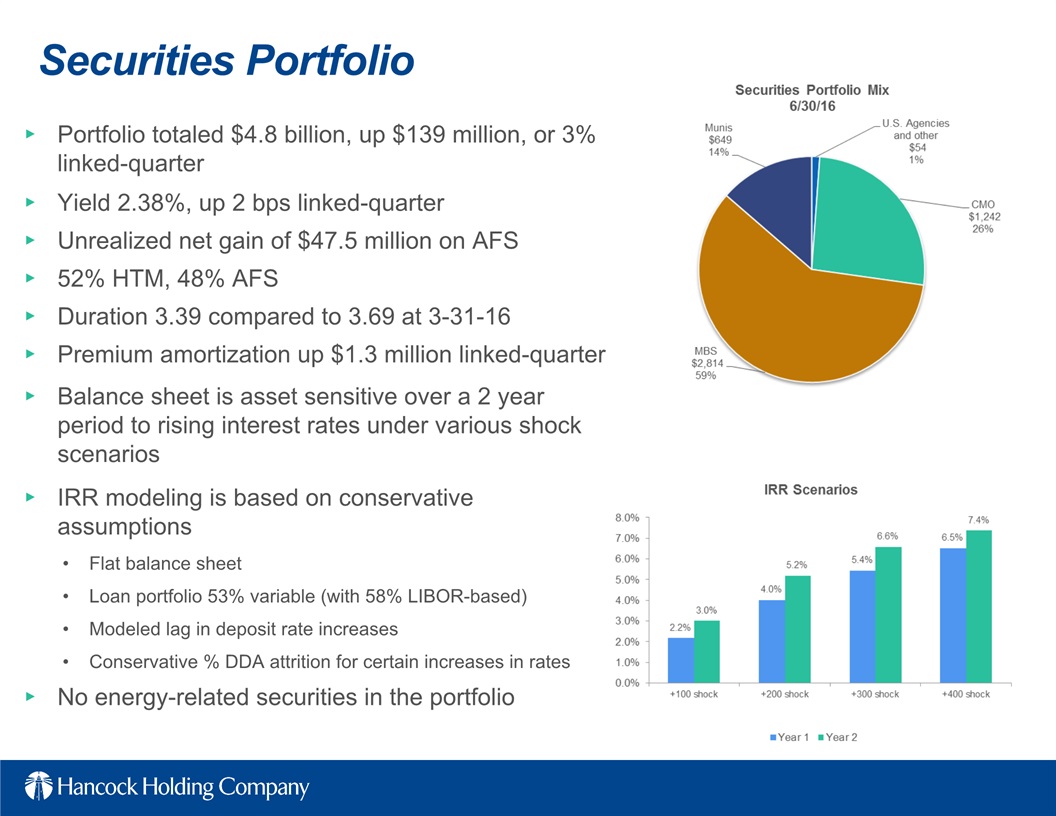
Securities Portfolio Portfolio totaled $4.8 billion, up $139 million, or 3% linked-quarter Yield 2.38%, up 2 bps linked-quarterUnrealized net gain of $47.5 million on AFS52% HTM, 48% AFSDuration 3.39 compared to 3.69 at 3-31-16Premium amortization up $1.3 million linked-quarterBalance sheet is asset sensitive over a 2 year period to rising interest rates under various shock scenariosIRR modeling is based on conservative assumptionsFlat balance sheetLoan portfolio 53% variable (with 58% LIBOR-based)Modeled lag in deposit rate increasesConservative % DDA attrition for certain increases in ratesNo energy-related securities in the portfolio
30

Solid Levels Of Core Deposit Funding Total deposits $18.8 billion, up $161 million, or 1%, linked-quarterNoninterest-bearing demand deposits (DDA) increased $43 millionInterest-bearing transaction and savings deposits decreased $289 millionTime deposits increased $206 million Public fund deposits increased $201 millionFunding mix remained strongDDA comprised 38% of total period-end depositsCost of funds increased 1 basis point to 35 bps $s in billions
31

Core NIM = reported net interest income (TE) excluding total net purchase accounting adjustments, annualized, as a percent of average earning assets. (See slide 27) Core NIM Reflects Improving Asset Yields Reported net interest margin (NIM) 3.25% up 2 bps linked-quarter Core NIM of 3.15% increased 3 bps linked-quarterCore loan yield +3 bps Yield on bond portfolio +2 bps Cost of funds +1 bp
32

Focus On Growing Core Noninterest Income Across Business Lines Noninterest income, including securities transactions, totaled $63.7 million, up $5.5 million, or 9%, linked-quarterAmortization of the indemnification asset for FDIC covered loans totaled $1.5 million, compared to $1.6 million in the first quarter of 2016; the amortization is a reduction to noninterest income and is a result of a lower level of expected future losses on covered loans (noncore)Excluding the impact of the indemnification asset, noninterest income was up $5.4 million linked-quarter $s in millions
33

Revenue Generating Initiatives - Fees $s in thousands
34

Quarterly Expenses Decreased; Remain Focused On Expense Control Operating expenses totaled $150.9 million in 2Q16, down $0.1 million linked quarterPersonnel expense totaled $84.2 million, down $0.5 million, or 1%, linked-quarterOccupancy and equipment totaled $13.5 million, down $0.7 million, or 5%, linked-quarterORE expense totaled $0.4 million, down $0.1 million linked-quarterAdvertising expense totaled $2.7 million, up $0.3 million, or 14%, linked-quarterOther operating expense increased $0.9 million, or 2%, linked-quarter $s in millions
35

TCE ratio 7.81%, up 12 bps linked-quarterBalance sheet change -9 bpsTangible earnings +23 bpsOCI & other, net +7 bpsDividends -9 bpsWill continue to manage capital in the best interest of the Company and its shareholders through the prolonged energy cycleTop priorities are funding organic growth and maintaining quarterly dividendsStock buyback on hold; no shares repurchased during the second quarter of 2016M&A on hold in light of current stock price Solid Capital Levels
36

Near-Term Outlook
37

2016 Strategic Objectives As we have previously noted, the company’s 2016 objectives are:Loan growth 5-7% (EOP)Fund loan growth primarily with depositsBias toward lower end of range should elevated levels of energy paydowns continueCore pre-tax, pre-provision growth of 25% compared to 2014Assumes no additional interest rate hikes in 2016Expect core revenue growth of 9-10%Expect expense growth of 2% or lessBased on management’s current outlook for the energy cycle, provision for loan losses in the range of $105 - $145 million for the full year of 2016 Bias toward lower end of range
38
Management Focus Points Simplification of structure; recent management streamlining and structure changes have yielded efficienciesExpense discipline; successfully reduced expenses in previous yearsEvaluating business lines for profitability; previously exited unprofitable business lines Revenue-generating initiatives; progress being made (see slide 19)Improving core NIM; 3 bps expansion in core NIM in 2Q16Balance sheet growth; growing balance sheet while improving mix and yield
39

Appendix
40

Appendix: EPS Calculation See Note 13 in the most recent 10K for more details on the two-class method for E.P.S. calculation.
41

Appendix: Purchase Accounting Adjustments Core NII & NIM Reconciliation
42
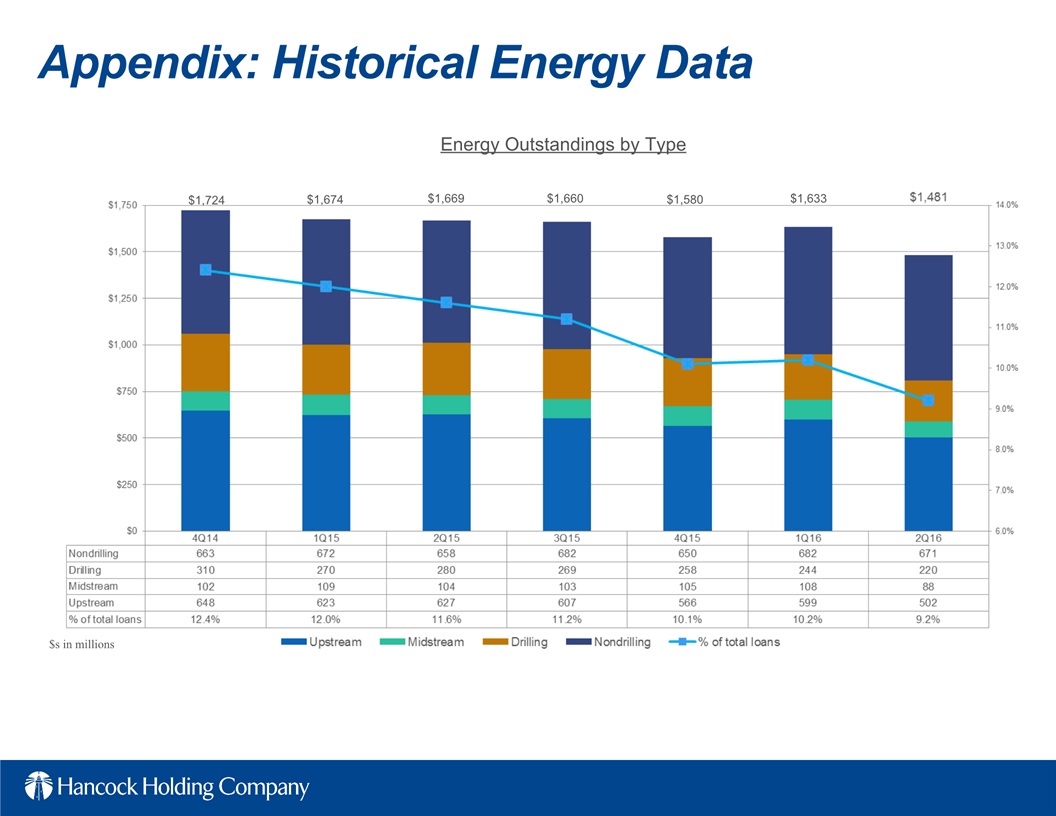
Appendix: Historical Energy Data $s in millions Energy Outstandings by Type $1,724 $1,674 $1,669 $1,660 $1,580 $1,633
43
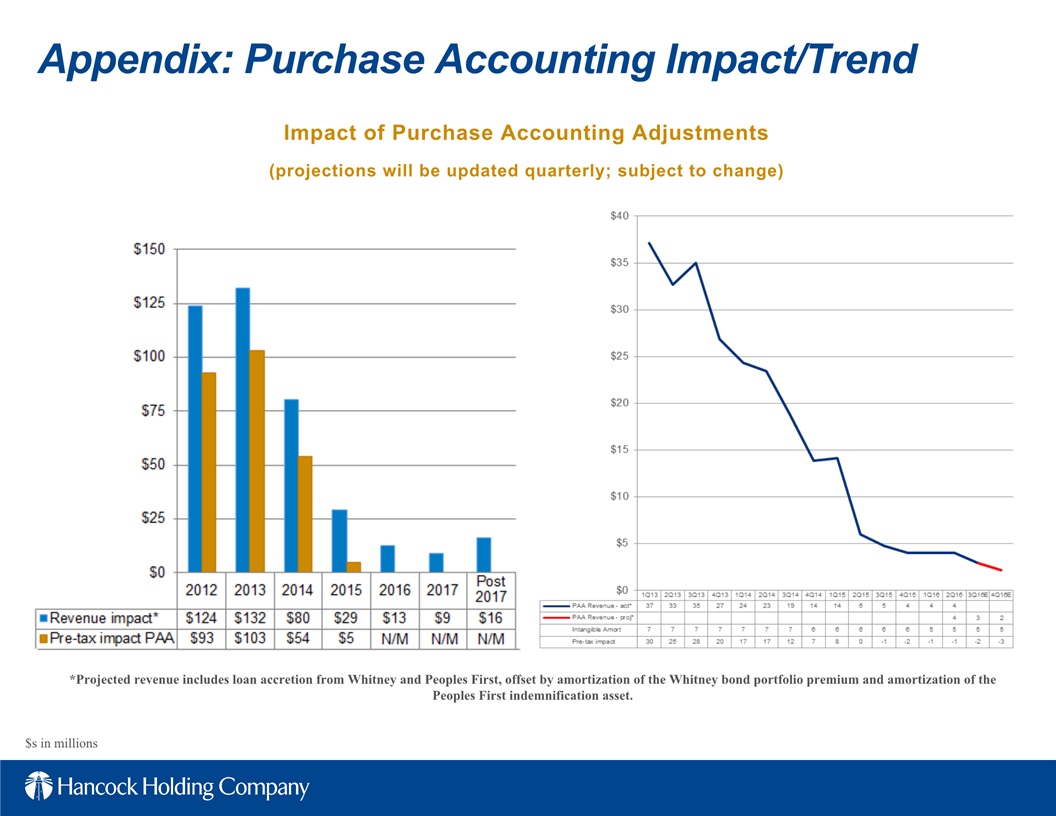
Impact of Purchase Accounting Adjustments(projections will be updated quarterly; subject to change) Appendix: Purchase Accounting Impact/Trend *Projected revenue includes loan accretion from Whitney and Peoples First, offset by amortization of the Whitney bond portfolio premium and amortization of the Peoples First indemnification asset. $s in millions
Impact of Purchase Accounting Adjustments(projections will be updated quarterly; subject to change) Appendix: Purchase Accounting Impact/Trend N/M N/M N/M *Projected revenue includes loan accretion from Whitney and Peoples First, offset by amortization of the Whitney bond portfolio premium and amortization of the Peoples First indemnification asset. $s in millions
44

Appendix: Core Pre-Tax, Pre-Provision Reconciliation
45

Appendix: Core Revenue
46

Appendix: Operating Expense (excl nonoperating items)
47
Appendix: Glossary of Terms LPO – Loan production officeLQA- Linked-quarter annualizedM&A – Mergers and acquisitionsNII – Net interest income NIM – Net interest marginNPA – Nonperforming assetsO&G – Oil and gasORE – Other real estatePAA – Purchase accounting adjustments, including loan accretion from Whitney and Peoples First, offset by amortization of the Whitney bond portfolio premium, amortization of the Peoples First indemnification asset and amortization of intangiblesPCI – Purchased credit impairedPTPP – Pre-tax, pre-provisionRBL – Reserve-based lendingROA – Return on average assetsRR – Risk ratingSNC – Shared National CreditTCE – Tangible common equity ratio (common shareholders’ equity less intangible assets divided by total assets less intangible assets)TE- Taxable equivalent (calculated using a federal income tax rate of 35%)Y-o-Y – Year over year 2Q16 – Second quarter of 20161Q16 – First quarter of 2016AFS – Available for saleALLL – Allowance for loan and lease lossesAnnualized – Calculated to reflect a rate based on a full yearCore – Excluding purchase accounting items and nonoperating itemsCore NIM – Reported net interest income (TE) excluding total net purchase accounting adjustments, annualized, as a percent of average earning assetsCore Revenue – Net interest income (TE) plus noninterest income excluding purchase accounting adjustments for both categoriesCurrent Energy Cycle – Refers to the energy cycle beginning in November of 2014 through the most recent quarter endDDA – Noninterest-bearing demands deposit accountsE&P – Exploration and Production (Oil & Gas)Efficiency ratio – noninterest expense to total net interest (TE) and noninterest income, excluding amortization of purchased intangibles and nonoperating expense.EOP- End of periodEPS – Earnings per shareHTM – Held to maturityIRR – Interest rate riskLinked-quarter – current quarter compared to previous quarter
48
7/20/2016 Second Quarter 2016Financial Results
49
Serious News for Serious Traders! Try StreetInsider.com Premium Free!
You May Also Be Interested In
- El Car Wash Partners With “CARD” to Support Neurodiversity in the Workplace
- Elemental Clean Fuels and Cariboo Low Carbon Fuels Partner to Advance Clean Fuels Hubs Across Western Canada
- L3Harris Announces Quarterly Dividend
Create E-mail Alert Related Categories
SEC FilingsSign up for StreetInsider Free!
Receive full access to all new and archived articles, unlimited portfolio tracking, e-mail alerts, custom newswires and RSS feeds - and more!
