

Form 8-K GLU MOBILE INC For: Feb 03
 Tweet
Tweet Share
Share
UNITED STATES
SECURITIES
AND EXCHANGE COMMISSION
WASHINGTON,
DC 20549
FORM 8-K
CURRENT REPORT PURSUANT TO
SECTION
13 OR 15(d) OF THE
SECURITIES
EXCHANGE ACT OF 1934
Date of
Report:
February
3, 2016
(Date
of earliest event reported)
Glu Mobile Inc.
(Exact
Name of Registrant as Specified in Its Charter)
Delaware
(State or Other Jurisdiction of Incorporation)
| 001-33368 | 91-2143667 | |
| (Commission File Number) | (IRS Employer Identification No.) |
|
500 Howard Street, Suite 300 San Francisco, California |
94105 |
|
|
(Address of Principal Executive Offices) |
(Zip Code) |
(415) 800-6100
(Registrant’s Telephone Number, Including Area
Code)
Not Applicable
(Former name or former address, if changed
since last report.)
Check the appropriate box below if the Form 8-K filing is intended to simultaneously satisfy the filing obligation of the registrant under any of the following provisions (see General Instruction A.2. below):
⃞ Written communications pursuant to Rule 425 under the Securities Act (17 CFR 230.425)
⃞ Soliciting material pursuant to Rule 14a-12 under the Exchange Act (17 CFR 240.14a-12)
⃞ Pre-commencement communications pursuant to Rule 14d-2(b) under the Exchange Act (17 CFR 240.14d-2(b))
⃞ Pre-commencement communications pursuant to Rule 13e-4(c) under the Exchange Act (17 CFR 240.13e-4(c))
Item 2.02 Results of Operations and Financial Condition.
On February 3, 2016, Glu Mobile Inc. (“Glu”) issued a press release announcing its financial results for the fourth quarter and full year ended December 31, 2015. A copy of the press release is attached as Exhibit 99.01 to this report. In addition, on February 3, 2016, Glu made available on its corporate website at www.glu.com/investors supplemental slides that were referenced during Glu’s earnings call to discuss its financial results for the fourth quarter and full year ended December 31, 2015. A copy of such supplemental slides is attached as Exhibit 99.02 to this report.
The information in this Item 2.02, including Exhibits 99.01 and 99.02 to this report, shall not be deemed to be “filed” for purposes of Section 18 of the Securities Exchange Act of 1934, as amended, or otherwise subject to the liabilities of that section or Sections 11 and 12(a)(2) of the Securities Act of 1933, as amended. The information contained in this Item 2.02 and in the accompanying Exhibits 99.01 and 99.02 shall not be incorporated by reference into any registration statement or other document filed by Glu with the Securities and Exchange Commission, whether made before or after the date of this report, regardless of any general incorporation language in such filing (or any reference to this Current Report on Form 8-K generally), except as shall be expressly set forth by specific reference in such filing.
Item 9.01 Financial Statements and Exhibits.
(d) Exhibits.
99.01 Press release issued by Glu regarding its financial results for the fourth quarter and full year ended December 31, 2015, dated February 3, 2016
99.02 Supplemental slides made available by Glu on its corporate website on February 3, 2016
SIGNATURES
Pursuant to the requirements of the Securities Exchange Act of 1934, the registrant has duly caused this report to be signed on its behalf by the undersigned hereunto duly authorized.
|
Glu Mobile Inc. |
||||
| Date: | February 3, 2016 | By: |
/s/ Scott J. Leichtner |
|
|
Name: Scott J. Leichtner |
||||
|
Title: Vice President and General Counsel |
||||
Exhibit 99.01
Glu Reports Fourth Quarter and Full Year 2015 Financial Results
- Q4 non-GAAP revenue of $57.9 million and Q4 GAAP revenue of $61.0 million
- Q4 Adjusted EBITDA of $2.8 million
- Announced exclusive partnerships with Taylor Swift and Gordon Ramsay
- Approximately 1.3 billion total social followers* of celebrities with whom the company has exclusive partnerships; titles featuring these celebrities expected live by end of 2017
- Investment in and option to acquire Plain Vanilla Corp., developer of hit trivia game QuizUp
- Approved a stock repurchase program to potentially repurchase up to $50 million of Glu’s common stock
SAN FRANCISCO--(BUSINESS WIRE)--February 3, 2016--Glu Mobile Inc. (NASDAQ: GLUU), a leading global developer and publisher of free-to-play games for smartphone and tablet devices, today announced financial results for its fourth quarter and full year ended December 31, 2015.
“Our ability to exceed revenue and EBITDA expectations in Q4 was driven by the ongoing traction of our catalog titles, including the continued solid performance of Kim Kardashian: Hollywood, Cooking Dash 2016, Racing Rivals and Deer Hunter 2016,” stated Niccolo de Masi, Chairman and Chief Executive Officer of Glu. “During the quarter we hired new studio leadership, with Tim Wilson joining as our Global CTO and Nick Earl as our President of Global Studios. Nick and Tim have hit the ground running and have already begun evolving our global studios. We anticipate that our global studio improvements will significantly enhance Glu’s product delivery on a go forward basis.”
de Masi continued, “I am pleased that Glu has extended our lead in building the premier celebrity gaming platform via a multi-year, exclusive gaming partnership with Taylor Swift. Swift is the most followed woman in the world with over 220 million social followers and a powerful addition to our celebrity gaming partnerships which now total approximately 1.3 billion social followers*. The strength of our catalog, new launch roadmap, and strong balance sheet, positions Glu for growth in 2016 and beyond.”
Fourth Quarter 2015 Financial Highlights:
- Revenue: Total GAAP revenue was $61.0 million in the fourth quarter of 2015 compared to $72.9 million in the fourth quarter of 2014. Total non-GAAP revenue was $57.9 million in the fourth quarter of 2015, compared to $76.2 million in the fourth quarter of 2014. Non-GAAP revenue excludes changes in deferred revenue and litigation settlement proceeds.
- Gross Margin: GAAP gross margin was 58% in the fourth quarter of 2015 compared to 56% in the fourth quarter of 2014. Non-GAAP gross margin was 63% in the fourth quarter of 2015 compared to 61% in the fourth quarter of 2014. Non-GAAP gross margin excludes changes in deferred revenue and litigation settlement proceeds, change in deferred cost of revenue, amortization of intangible assets and non-cash warrant expense.
- GAAP Operating Income/(Loss): GAAP operating loss was $(3.1) million in the fourth quarter of 2015 compared to income of $5.1 million in the fourth quarter of 2014.
- Non-GAAP Operating Income: Non-GAAP operating income was $2.1 million in the fourth quarter of 2015 compared to $13.5 million during the fourth quarter of 2014. Non-GAAP operating income excludes changes in deferred revenue and deferred cost of revenue, amortization of intangible assets, non-cash warrant expense, stock-based compensation expense, restructuring charges, change in fair value of the Blammo earnout, transitional costs and litigation costs and settlement proceeds.
- Adjusted EBITDA: Adjusted EBITDA was $2.8 million for the fourth quarter of 2015, compared to $14.1 million during the fourth quarter of 2014. Adjusted EBITDA is defined as non-GAAP operating income excluding depreciation.
- GAAP Net Income/(Loss) and EPS: GAAP net loss was $(3.0) million for the fourth quarter of 2015 compared to net income of $1.4 million for the fourth quarter of 2014. GAAP EPS loss was $(0.02) for the fourth quarter of 2015, based on 127.8 million weighted-average basic shares outstanding, compared to a GAAP diluted EPS of $0.01 for the fourth quarter of 2014, based on 107.0 million diluted weighted-average shares outstanding.
- Non-GAAP Net Income and EPS: Non-GAAP net income was $2.3 million for the fourth quarter of 2015 compared to $12.2 million for the fourth quarter of 2014. Non-GAAP diluted EPS was $0.02 for the fourth quarter of 2015 based on 129.4 million weighted-average diluted shares outstanding, compared to non-GAAP diluted EPS of $0.11 for the fourth quarter of 2014 based on 107.0 million weighted-average diluted shares outstanding.
- Cash and Cash Flows: As of December 31, 2015, Glu had cash and cash equivalents of $180.5 million compared to $182.3 million at the end of the prior quarter. The company continues to have no debt. Cash flows generated from operations were $139,000 for the fourth quarter of 2015 compared to $19.3 million for the fourth quarter of 2014.
A reconciliation of GAAP to non-GAAP results has been provided in the financial statement tables included in this press release. An explanation of these measures is also included below under the heading “Use of Non-GAAP Financial Measures.”
Recent Developments and Strategic Initiatives:
- Today, we announced a multi-year, exclusive mobile gaming partnership with Taylor Swift, an award-winning singer, musician and song writer.
- In January 2016, we announced the exclusive partnership with award-winning chef Gordon Ramsay on the development of a new mobile game that is currently slated for global release during the summer of 2016.
- In January 2016, we announced an investment in QuizUp developer Plain Vanilla Corp. We also have a call option to acquire Plain Vanilla Corp. for 15 months from the closing of the initial investment at a pre-agreed price.
- In January 2016, we acquired a minority equity stake and entered into a publishing agreement with Dairy Free Games.
In addition, our Board of Directors has formally approved a stock repurchase program under which we may repurchase up to $50 million of our outstanding common stock. We currently intend to enter into a Rule 10b5-1 trading plan in order to facilitate this program, under which we may repurchase shares without suspension for trading blackout periods. The repurchase program may be suspended, discontinued or modified in compliance with applicable securities laws.
“Our solid fourth quarter results were highlighted by our ability to exceed our revenue expectations,” stated Eric R. Ludwig, Chief Operating Officer and Chief Financial Officer. “Glu remains committed to enhancing the long-term value of the company through the ongoing investment in internal and external opportunities supported by our strong balance sheet.”
Fiscal 2015 Financial Highlights:
- Revenues: Total GAAP revenues were $249.9 million for the year ended December 31, 2015 compared to $223.1 million for the year ended December 31, 2014. Total non-GAAP revenues were $242.2 million for the year ended December 31, 2015 compared to $241.8 million for the year ended December 31, 2014.
- Gross Margin: GAAP gross margin was 57% for the year ended December 31, 2015 compared to 62% for the year ended December 31, 2014. Non-GAAP gross margin was 62% for the year ended December 31, 2015 compared to 63% for the year ended December 31, 2014.
- GAAP Operating Income/(Loss): GAAP operating loss was $(6.3) million for the year ended December 31, 2015 compared to operating income of $2.1 million for the year ended December 31, 2014.
- Non-GAAP Operating Income: Non-GAAP operating income was $13.9 million for the year ended December 31, 2015 compared to $32.6 million for the year ended December 31, 2014.
- Adjusted EBITDA: Adjusted EBITDA was $16.8 million for the year ended December 31, 2015 compared to $35.1 million for the year ended December 31, 2014.
- GAAP Net Income/(Loss) and EPS: GAAP net loss was $(7.2) million for the year ended December 31, 2015 compared to net income of $8.1 million for the year ended December 31, 2014. GAAP EPS loss was $(0.06) for the year ended December 31, 2015, based on 118.8 million weighted-average basic shares outstanding, compared to $0.08 for the year ended December 31, 2014, based on 96.9 million weighted-average diluted shares outstanding.
- Non-GAAP Net Income and EPS: Non-GAAP net income was $13.8 million for the year ended December 31, 2015 compared to $33.3 million for the year ended December 31, 2014. Non-GAAP EPS was $0.11 for the year ended December 31, 2015 based on 122.8 million weighted-average diluted shares outstanding, compared $0.34 for the year ended December 31, 2014 based on 96.9 million weighted-average diluted shares outstanding.
- Cash Flows Generated/(Used) from Operations: Cash flows used in operations were $(14.0) million for the year ended December 31, 2015 compared to cash flows generated from operations of $30.6 million for the year ended December 31, 2014.
A reconciliation of GAAP to non-GAAP results has been provided in the financial statement tables included in this press release. An explanation of these measures is also included below under the heading “Non-GAAP Financial Measures.”
Business Outlook as of February 3, 2016:
The following forward-looking statements reflect expectations as of February 3, 2016. Results may be materially different and are affected by many factors, such as: consumer demand for mobile entertainment and specifically Glu’s products; consumer demand for smartphones, tablets and next-generation platforms; our ability to improve the monetization of our titles and continue to successfully launch and update new games; development delays on Glu's products; continued uncertainty in the global economic environment; competition in the industry; storefront featuring; changes in foreign exchange rates; Glu's effective tax rate and other factors detailed in this release and in Glu's SEC filings.
First Quarter Expectations – Quarter Ending March 31, 2016:
- Non-GAAP revenue is expected to be between $46.0 million and $48.0 million.
- Non-GAAP gross margin is expected to be approximately 59.9%.
- Non-GAAP operating expenses are expected to be between $35.2 million and $35.4 million.
- Adjusted EBITDA, defined as non-GAAP operating income/(loss) excluding depreciation of approximately $0.6 million, is expected to range from a loss of $(6.0) million to $(7.0) million.
- Income tax is expected to be an expense of approximately $0.2 million.
- Non-GAAP net income/(loss) is expected to be between $(6.8) million and $(7.8) million, or between $(0.05) and $(0.06) per weighted-average basic share outstanding, which excludes approximately $4.1 million of anticipated stock-based compensation expense and $2.4 million for amortization of intangibles.
- Weighted-average common shares outstanding are expected to be approximately 129.5 million basic and 129.9 million diluted.
2016 Expectations – Full Year Ending December 31, 2016:
- Non-GAAP revenue is expected to be between $250.0 million and $275.0 million.
- Non-GAAP gross margin is expected to be approximately 56.2%.
- Adjusted EBITDA is expected to range from a loss of $(7.0) million to $(15.0) million.
- Non-GAAP net income/(loss) is expected to be between a loss of $(10.3) million and $(18.3) million, or between $(0.08) and $(0.14) per weighted-average basic share outstanding, which excludes approximately $17.7 million of anticipated stock-based compensation expense and $9.2 million for amortization of intangibles.
- Weighted-average common shares outstanding are expected to be approximately 132.2 million basic and 134.7 million diluted.
- We expect to have cash and short-term investments at December 31, 2016 of at least $140.0 million with no debt.
Quarterly Conference Call
Glu will discuss its quarterly results via teleconference today at 1:30 p.m. Pacific Time (4:30 p.m. Eastern Time). Please dial (866) 582-8907, or if outside the U.S., (760) 298-5046, with conference ID # 22306718 to access the conference call at least five minutes prior to the 1:30 p.m. Pacific Time start time. A live webcast and replay of the call will also be available on the investor relations portion of the company's website at www.glu.com/investors. An audio replay will be available between 4:30 p.m. Pacific Time, February 3, 2016, and 8:59 p.m. Pacific Time, February 10, 2016, by calling (855) 859-2056, or (404) 537-3406, with conference ID # 22306718.
Disclosure Using Social Media Channels and Calculation of Social Followers
Glu currently announces material information to its investors using SEC filings, press releases, public conference calls and webcasts. Glu uses these channels as well as social media channels to announce information about the company, games, employees and other issues. Given SEC guidance regarding the use of social media channels to announce material information to investors, Glu is notifying investors, the media, its players and others interested in the company that in the future, it might choose to communicate material information via social media channels or, it is possible that information it discloses through social media channels may be deemed to be material. Therefore, Glu encourages investors, the media, players and others interested in Glu to review the information posted on the company forum (http://ggnbb.glu.com/forum.php) and the company Facebook site (https://www.facebook.com/glumobile), the company twitter account (https://twitter.com/glumobile) and Mr. de Masi’s twitter account (https://twitter.com/niccolodemasi). Investors, the media, players or other interested parties can subscribe to the company blog and twitter feed and Mr. de Masi’s twitter feed at the addresses listed above. Any updates to the list of social media channels Glu will use to announce material information will be posted on the Investor Relations page of the company's website at www.glu.com/investors.
*Glu calculates the aggregate number of social followers of a particular celebrity licensor by adding the total followers on Facebook, Twitter, Instagram, Vevo and Vine for such celebrity. There is fan overlap among these social channels and among Glu’s various celebrity licensors, and such aggregate numbers have not been deduplicated.
The approximately 1.3 billion total social followers supporting celebrity titles that Glu expects to be live by the end of 2017 is based on the combined Facebook, Twitter, Instagram, Vevo, and Vine audiences of Taylor Swift, Gordon Ramsay, Katy Perry, Kim Kardashian West, Kendall and Kylie Jenner, Britney Spears, Nicki Minaj, Jason Statham and additional yet-to-be announced celebrities as of February 3, 2016.
Use of Non-GAAP Financial Measures
To supplement Glu's unaudited condensed consolidated financial data presented in accordance with GAAP, Glu uses certain non-GAAP measures of financial performance. The presentation of these non-GAAP financial measures is not intended to be considered in isolation from, as a substitute for, or superior to, the financial information prepared and presented in accordance with GAAP, and may be different from non-GAAP financial measures used by other companies. In addition, these non-GAAP measures have limitations in that they do not reflect all of the amounts associated with Glu's results of operations as determined in accordance with GAAP. The non-GAAP financial measures used by Glu include historical and estimated non-GAAP revenue, non-GAAP smartphone revenue, non-GAAP cost of revenue, non-GAAP operating expenses, non-GAAP gross profit, non-GAAP gross margin, non-GAAP operating income/(loss), non-GAAP net income/(loss) and non-GAAP basic and diluted net income/(loss) per share. These non-GAAP financial measures exclude the following items from Glu's unaudited consolidated statements of operations:
- Change in deferred revenue and deferred cost of revenue;
- Amortization of intangible assets;
- Non-cash warrant expense;
- Stock-based compensation expense;
- Restructuring charges;
- Change in fair value of Blammo earnout;
- Litigation settlement proceeds and costs;
- Transitional costs;
- Release of tax liabilities and valuation allowance; and
- Foreign currency exchange gains and losses primarily related to the revaluation of assets and liabilities.
In addition, Glu has included in this release “Adjusted EBITDA” figures which are used to evaluate Glu’s operating performance. Adjusted EBITDA is defined as non-GAAP operating income/(loss) excluding depreciation. Adjusted EBITDA margin is defined as Adjusted EBITDA divided by non-GAAP revenue.
Glu may consider whether significant non-recurring items that arise in the future should also be excluded in calculating the non-GAAP financial measures it uses.
Glu believes that these non-GAAP financial measures, when taken together with the corresponding GAAP financial measures, provide meaningful supplemental information regarding Glu's performance by excluding certain items that may not be indicative of Glu's core business, operating results or future outlook. Glu's management uses, and believes that investors benefit from referring to, these non-GAAP financial measures in assessing Glu's operating results, as well as when planning, forecasting and analyzing future periods. These non-GAAP financial measures also facilitate comparisons of Glu's performance to prior periods.
Cautions Regarding Forward-Looking Statements
This news release contains forward-looking statements, including those regarding our “Business Outlook as of February 3, 2016” (“First Quarter Expectations – Quarter Ending March 31, 2016” and “2016 Expectations – Full Year Ending December 31, 2016”), and the statements regarding that we have exclusive partnerships with celebrities with approximately 1.3 billion social followers and expect games featuring these celebrities to be live by the end of 2017; that we anticipate that our global studio improvements will significantly enhance our ability to deliver product quality on a go forward basis; that we extended our lead in building the premier celebrity gaming platform via a multi-year exclusive gaming partnership with a new celebrity partner that is a powerful addition to our celebrity gaming partnerships; that the strength of our catalog, new launch roadmap, and strong balance sheet, positions us for growth in 2016 and beyond; the expected launch date of the game we are developing featuring Gordon Ramsay; our intention to implement a stock repurchase program and to enter into a Rule 10b5-1 trading plan as part of such efforts; and that we remain committed to enhancing the long-term value of the company through the ongoing investment in internal and external opportunities supported by our strong balance sheet. These forward-looking statements are subject to material risks and uncertainties that could cause actual results to differ materially from those in the forward-looking statements. Investors should consider important risk factors, which include: the risks identified under "Business Outlook as of February 3, 2016"; the risk that our global studio improvements will not improve our ability to deliver to date and quality; the risk that Glu does not realize the anticipated strategic benefits from our celebrity partnerships, including our partnerships with our newly announced celebrity partners; the risk that the number of social followers of our celebrity partners does not correlate to strong performance for our celebrity titles; the risk that consumer demand for smartphones, tablets and next-generation platforms does not grow as significantly as we anticipate or that we will be unable to capitalize on any such growth; the risk that we do not realize a sufficient return on our investment with respect to our efforts to develop free-to-play games for smartphones, tablets and next-generation platforms, the risk that we will not be able to maintain our good relationships with Apple and Google; the risk that our development expenses for games for smartphones, tablets and next-generation platforms are greater than we anticipate; the risk that our recently and newly launched games are less popular than anticipated or decline in popularity and monetization rate more quickly than we anticipate; the risk that our newly released games will be of a quality less than desired by reviewers and consumers; the risk that the mobile games market, particularly with respect to free-to-play gaming, is smaller than anticipated; the risk that we may lose a key intellectual property license; the risk that we are unable to recruit and retain qualified personnel for developing and maintaining the games in our product pipeline resulting in reduced monetization of a game, product launch delays or games being eliminated from our pipeline altogether; the risk that the timing and amount of any shares repurchased by the company in its stock repurchase program will be determined by Glu’s management based on its evaluation of market conditions and other factors and, as a result, the company may determine to repurchase a smaller amount of shares than anticipated, or none at all; and other risks detailed under the caption "Risk Factors" in our Form 10-Q filed with the Securities and Exchange Commission on November 9, 2015 and our other SEC filings. You can locate these reports through our website at http://www.glu.com/investors. We are under no obligation, and expressly disclaim any obligation, to update or alter our forward-looking statements whether as a result of new information, future events or otherwise.
About Glu Mobile
Glu Mobile (NASDAQ: GLUU) is a leading global developer and publisher of free-to-play games for smartphone and tablet devices. Glu is focused on creating compelling original IP games such as CONTRACT KILLER, COOKING DASH, DEER HUNTER, DINER DASH, DINO HUNTER: DEADLY SHORES, ETERNITY WARRIORS, FRONTLINE COMMANDO, RACING RIVALS, TAP SPORTS BASEBALL, and TAP SPORTS FOOTBALL, and branded IP games including KIM KARDASHIAN: HOLLYWOOD, KATY PERRY POP, JAMES BOND: WORLD OF ESPIONAGE, MISSION IMPOSSIBLE: ROGUE NATION and SNIPER X WITH JASON STATHAM on the App Store, Google Play, Amazon Appstore, Facebook, Mac App Store, and Windows Phone. Glu’s unique technology platform enables its titles to be accessible to a broad audience of consumers globally. Founded in 2001, Glu is headquartered in San Francisco with major U.S. offices outside Seattle and in Long Beach, and international locations in Canada, China, India, Japan, Korea, and Russia. Consumers can find high-quality entertainment wherever they see the ‘g’ character logo or at www.glu.com.
For live updates, please follow Glu via Twitter at www.twitter.com/glumobile or become a Glu fan at www.facebook.com/glumobile.
CONTRACT KILLER, COOKING DASH, DEER HUNTER, DINER DASH, DINO HUNTER: DEADLY SHORES, ETERNITY WARRIORS, FRONTLINE COMMANDO, RACING RIVALS, TAP SPORTS BASEBALL, TAP SPORTS FOOTBALL, SNIPER X, GLU, GLU MOBILE, and the 'g' character logo are trademarks of Glu Mobile Inc.
| Glu Mobile Inc. | |||||||||
| Consolidated Balance Sheets | |||||||||
| (in thousands) | |||||||||
| (unaudited) | |||||||||
| December 31, | December 31, | ||||||||
| 2015 | 2014 | ||||||||
| ASSETS | |||||||||
| Cash and cash equivalents | $ | 180,542 | $ | 70,912 | |||||
| Accounts receivable, net | 17,956 | 32,231 | |||||||
| Prepaid royalties | 28,715 | 864 | |||||||
| Prepaid expenses and other current assets | 14,657 | 17,388 | |||||||
| Total current assets | 241,870 | 121,395 | |||||||
| Property and equipment, net | 5,447 | 6,116 | |||||||
| Restricted cash | 1,498 | 1,990 | |||||||
| Long-term prepaid royalties | 46,944 | 5,870 | |||||||
| Other long-term assets | 1,386 | 804 | |||||||
| Intangible assets, net | 17,767 | 27,524 | |||||||
| Goodwill | 87,890 | 87,964 | |||||||
| Total assets | $ | 402,802 | $ | 251,663 | |||||
| LIABILITIES AND STOCKHOLDERS' EQUITY | |||||||||
| Accounts payable | $ | 9,145 | $ | 11,685 | |||||
| Accrued liabilities | 1,654 | 3,812 | |||||||
| Accrued compensation | 7,100 | 10,751 | |||||||
| Accrued royalties | 21,032 | 12,440 | |||||||
| Accrued restructuring | 342 | - | |||||||
| Deferred revenue | 31,112 | 37,333 | |||||||
| Total current liabilities | 70,385 | 76,021 | |||||||
| Long-term accrued royalties | 24,347 | 870 | |||||||
| Other long-term liabilities | 1,642 | 3,066 | |||||||
| Total liabilities | 96,374 | 79,957 | |||||||
| Common stock | 13 | 11 | |||||||
| Additional paid-in capital | 557,748 | 415,766 | |||||||
| Accumulated other comprehensive loss | (85 | ) | (8 | ) | |||||
| Accumulated deficit | (251,248 | ) | (244,063 | ) | |||||
| Stockholders' equity | 306,428 | 171,706 | |||||||
| Total liabilities and stockholders' equity | $ | 402,802 | $ | 251,663 | |||||
| Glu Mobile Inc. | |||||||||||||||||
| Condensed Consolidated Statements of Operations | |||||||||||||||||
| (in thousands, except per share data) | |||||||||||||||||
| (unaudited) | |||||||||||||||||
| Three Months Ended | Twelve Months Ended | ||||||||||||||||
| December 31, | December 31, | December 31, | December 31, | ||||||||||||||
| 2015 | 2014 | 2015 | 2014 | ||||||||||||||
| Revenue | $ | 61,030 | $ | 72,865 | $ | 249,900 | $ | 223,146 | |||||||||
| Cost of revenue: | |||||||||||||||||
| Platform commissions, royalties and other | 23,109 | 29,625 | 98,184 | 80,992 | |||||||||||||
| Amortization of intangible assets | 2,325 | 2,434 | 9,553 | 4,767 | |||||||||||||
| Total cost of revenue | 25,434 | 32,059 | 107,737 | 85,759 | |||||||||||||
| Gross profit | 35,596 | 40,806 | 142,163 | 137,387 | |||||||||||||
| Operating expenses: | |||||||||||||||||
| Research and development | 20,001 | 16,053 | 72,856 | 64,284 | |||||||||||||
| Sales and marketing | 10,729 | 12,275 | 48,240 | 45,076 | |||||||||||||
| General and administrative | 6,838 | 7,154 | 26,092 | 25,019 | |||||||||||||
| Amortization of intangible assets | 11 | 127 | 201 | 508 | |||||||||||||
| Restructuring charge | 1,075 | 67 | 1,075 | 435 | |||||||||||||
| Total operating expenses | 38,654 | 35,676 | 148,464 | 135,322 | |||||||||||||
| Income/(loss) from operations | (3,058 | ) | 5,130 | (6,301 | ) | 2,065 | |||||||||||
| Interest income and other expense, net: | |||||||||||||||||
| Interest income | 15 | 10 | 49 | 30 | |||||||||||||
| Other expense | (149 | ) | (988 | ) | (792 | ) | (1,502 | ) | |||||||||
| Interest income and other expense, net | (134 | ) | (978 | ) | (743 | ) | (1,472 | ) | |||||||||
| Income/(loss) before income taxes | (3,192 | ) | 4,152 | (7,044 | ) | 593 | |||||||||||
| Income tax benefit/(provision) | 234 | (2,773 | ) | (141 | ) | 7,555 | |||||||||||
| Net income/(loss) | $ | (2,958 | ) | $ | 1,379 | $ | (7,185 | ) | $ | 8,148 | |||||||
| Net income/(loss) per share: | |||||||||||||||||
| Basic | $ | (0.02 | ) | $ | 0.01 | $ | (0.06 | ) | $ | 0.09 | |||||||
| Diluted | $ | (0.02 | ) | $ | 0.01 | $ | (0.06 | ) | $ | 0.08 | |||||||
| Weighted average common shares outstanding | |||||||||||||||||
| Basic | 127,775 | 103,406 | 118,775 | 91,826 | |||||||||||||
| Diluted | 127,775 | 106,954 | 118,775 | 96,922 | |||||||||||||
| Stock-based compensation expense included in: | |||||||||||||||||
| Research and development | $ | 1,099 | $ | 736 | $ | 3,563 | $ | 7,422 | |||||||||
| Sales and marketing | 305 | 209 | 1,082 | 701 | |||||||||||||
| General and administrative | 2,065 | 1,189 | 7,041 | 3,510 | |||||||||||||
| Total stock-based compensation expense | $ | 3,469 | $ | 2,134 | $ | 11,686 | $ | 11,633 | |||||||||
| Glu Mobile Inc. | |||||||||||||||||||||||||||||||||
| GAAP to Non-GAAP Reconciliation | |||||||||||||||||||||||||||||||||
| (in thousands, except per share data) | |||||||||||||||||||||||||||||||||
| (unaudited) | |||||||||||||||||||||||||||||||||
| For the Three Months Ended | |||||||||||||||||||||||||||||||||
| March 31, | June 30, | September 30, | December 31, | March 31, | June 30, | September 30, | December 31, | ||||||||||||||||||||||||||
| 2014 | 2014 | 2014 | 2014 | 2015 | 2015 | 2015 | 2015 | ||||||||||||||||||||||||||
| GAAP revenue | $ | 44,580 | $ | 40,910 | $ | 64,791 | $ | 72,865 | $ | 69,470 | $ | 56,150 | $ | 63,250 | $ | 61,030 | |||||||||||||||||
| Change in deferred revenue and litigation settlement proceeds | 2,377 | (5,874 | ) | 18,762 | 3,363 | (7,023 | ) | 1,329 | 1,174 | (3,135 | ) | ||||||||||||||||||||||
| Non-GAAP revenue | 46,957 | 35,036 | 83,553 | 76,228 | 62,447 | 57,479 | 64,424 | 57,895 | |||||||||||||||||||||||||
| GAAP gross profit | 30,824 | 28,037 | 37,720 | 40,806 | 40,726 | 32,396 | 33,445 | 35,596 | |||||||||||||||||||||||||
| Change in deferred revenue and litigation settlement proceeds | 2,377 | (5,874 | ) | 18,762 | 3,363 | (7,023 | ) | 1,329 | 1,174 | (3,135 | ) | ||||||||||||||||||||||
| Amortization of intangible assets | 554 | 441 | 1,338 | 2,434 | 2,434 | 2,434 | 2,360 | 2,325 | |||||||||||||||||||||||||
| Non-cash warrant expense | - | - | 1,126 | 66 | 93 | 135 | 1,896 | (116 | ) | ||||||||||||||||||||||||
| Change in deferred platform commissions and royalty expense | (1,209 | ) | 1,527 | (9,122 | ) | (108 | ) | 2,819 | (321 | ) | (780 | ) | 1,497 | ||||||||||||||||||||
| Non-GAAP gross profit | 32,546 | 24,131 | 49,824 | 46,561 | 39,049 | 35,973 | 38,095 | 36,167 | |||||||||||||||||||||||||
| GAAP operating expense | 30,117 | 31,703 | 37,826 | 35,676 | 38,214 | 38,540 | 33,056 | 38,654 | |||||||||||||||||||||||||
| Stock-based compensation | (2,979 | ) | (4,566 | ) | (1,954 | ) | (2,134 | ) | (2,129 | ) | (3,032 | ) | (3,056 | ) | (3,469 | ) | |||||||||||||||||
| Amortization of intangible assets | (127 | ) | (127 | ) | (127 | ) | (127 | ) | (127 | ) | (32 | ) | (31 | ) | (11 | ) | |||||||||||||||||
| Litigation costs and settlement proceeds | - | - | - | - | - | (476 | ) | 390 | - | ||||||||||||||||||||||||
| Transitional costs | - | (682 | ) | (493 | ) | (255 | ) | (72 | ) | - | - | - | |||||||||||||||||||||
| Change in fair value of Blammo earnout | (304 | ) | (531 | ) | - | - | - | - | - | - | |||||||||||||||||||||||
| Restructuring charge | - | (159 | ) | (209 | ) | (67 | ) | - | - | - | (1,075 | ) | |||||||||||||||||||||
| Non-GAAP operating expense | 26,707 | 25,638 | 35,043 | 33,093 | 35,886 | 35,000 | 30,359 | 34,099 | |||||||||||||||||||||||||
| GAAP operating income/(loss) | 707 | (3,666 | ) | (106 | ) | 5,130 | 2,512 | (6,144 | ) | 389 | (3,058 | ) | |||||||||||||||||||||
| Change in deferred revenue and litigation settlement proceeds | 2,377 | (5,874 | ) | 18,762 | 3,363 | (7,023 | ) | 1,329 | 1,174 | (3,135 | ) | ||||||||||||||||||||||
| Non-GAAP cost of revenue adjustment | (655 | ) | 1,968 | (6,658 | ) | 2,392 | 5,346 | 2,248 | 3,476 | 3,706 | |||||||||||||||||||||||
| Stock-based compensation | 2,979 | 4,566 | 1,954 | 2,134 | 2,129 | 3,032 | 3,056 | 3,469 | |||||||||||||||||||||||||
| Amortization of intangible assets | 127 | 127 | 127 | 127 | 127 | 32 | 31 | 11 | |||||||||||||||||||||||||
| Transitional costs | - | 682 | 493 | 255 | 72 | - | - | - | |||||||||||||||||||||||||
| Change in fair value of Blammo earnout | 304 | 531 | - | - | - | - | - | - | |||||||||||||||||||||||||
| Litigation costs and settlement proceeds | - | - | - | - | - | 476 | (390 | ) | - | ||||||||||||||||||||||||
| Restructuring charge | - | 159 | 209 | 67 | - | - | - | 1,075 | |||||||||||||||||||||||||
| Non-GAAP operating income/(loss) | 5,839 | (1,507 | ) | 14,781 | 13,468 | 3,163 | 973 | 7,736 | 2,068 | ||||||||||||||||||||||||
| GAAP net income/(loss) | 133 | (3,768 | ) | 10,404 | 1,379 | 1,124 | (5,509 | ) | 158 | (2,958 | ) | ||||||||||||||||||||||
| Change in deferred revenue and litigation settlement proceeds | 2,377 | (5,874 | ) | 18,762 | 3,363 | (7,023 | ) | 1,329 | 1,174 | (3,135 | ) | ||||||||||||||||||||||
| Non-GAAP cost of revenue adjustment | (655 | ) | 1,968 | (6,658 | ) | 2,392 | 5,346 | 2,248 | 3,476 | 3,706 | |||||||||||||||||||||||
| Non-GAAP operating expense adjustment | 3,410 | 6,065 | 2,783 | 2,583 | 2,328 | 3,540 | 2,697 | 4,555 | |||||||||||||||||||||||||
| Foreign currency exchange loss | 136 | 31 | 347 | 981 | 290 | 186 | 167 | 149 | |||||||||||||||||||||||||
| Release of tax liabilities and valuation allowance | - | - | (8,352 | ) | 1,531 | - | - | - | - | ||||||||||||||||||||||||
| Non-GAAP net income/(loss) | $ | 5,401 | $ | (1,578 | ) | $ | 17,286 | $ | 12,229 | $ | 2,065 | $ | 1,794 | $ | 7,672 | $ | 2,317 | ||||||||||||||||
| Reconciliation of net income/(loss) and net income/(loss) per share: | |||||||||||||||||||||||||||||||||
| GAAP net income/(loss) per share - basic | $ | 0.00 | $ | (0.04 | ) | $ | 0.11 | $ | 0.01 | $ | 0.01 | $ | (0.05 | ) | $ | 0.00 | $ | (0.02 | ) | ||||||||||||||
| GAAP net income/(loss) per share - diluted | $ | 0.00 | $ | (0.04 | ) | $ | 0.10 | $ | 0.01 | $ | 0.01 | $ | (0.05 | ) | $ | 0.00 | $ | (0.02 | ) | ||||||||||||||
| Non-GAAP net income/(loss) per share - basic | $ | 0.07 | $ | (0.02 | ) | $ | 0.18 | $ | 0.12 | $ | 0.02 | $ | 0.02 | $ | 0.06 | $ | 0.02 | ||||||||||||||||
| Non-GAAP net income/(loss) per share - diluted | $ | 0.06 | $ | (0.02 | ) | $ | 0.16 | $ | 0.11 | $ | 0.02 | $ | 0.01 | $ | 0.06 | $ | 0.02 | ||||||||||||||||
| Shares used in computing Non-GAAP basic net income/(loss) per share | 79,719 | 85,549 | 98,628 | 103,406 | 103,869 | 116,169 | 127,287 | 127,775 | |||||||||||||||||||||||||
| Shares used in computing Non-GAAP diluted net income/(loss) per share | 85,398 | 85,549 | 105,438 | 106,954 | 107,851 | 122,538 | 131,486 | 129,381 | |||||||||||||||||||||||||
| Non-GAAP operating expense break-out: | |||||||||||||||||||||||||||||||||
| GAAP research and development expense | $ | 15,579 | $ | 17,297 | $ | 15,355 | $ | 16,053 | $ | 18,243 | $ | 18,308 | $ | 16,304 | $ | 20,001 | |||||||||||||||||
| Transitional costs | - | (20 | ) | - | - | - | - | - | - | ||||||||||||||||||||||||
| Stock-based compensation | (2,317 | ) | (3,605 | ) | (764 | ) | (736 | ) | (760 | ) | (836 | ) | (868 | ) | (1,099 | ) | |||||||||||||||||
| Non-GAAP research and development expense | 13,262 | 13,672 | 14,591 | 15,317 | 17,483 | 17,472 | 15,436 | 18,902 | |||||||||||||||||||||||||
| GAAP sales and marketing expense | 9,485 | 7,989 | 15,327 | 12,275 | 12,438 | 12,771 | 12,302 | 10,729 | |||||||||||||||||||||||||
| Stock-based compensation | (101 | ) | (190 | ) | (201 | ) | (209 | ) | (218 | ) | (282 | ) | (277 | ) | (305 | ) | |||||||||||||||||
| Non-GAAP sales and marketing expense | 9,384 | 7,799 | 15,126 | 12,066 | 12,220 | 12,489 | 12,025 | 10,424 | |||||||||||||||||||||||||
| GAAP general & administrative expense | 4,926 | 6,131 | 6,808 | 7,154 | 7,406 | 7,429 | 4,419 | 6,838 | |||||||||||||||||||||||||
| Transitional costs | - | (662 | ) | (493 | ) | (255 | ) | (72 | ) | - | - | - | |||||||||||||||||||||
| Change in fair value of Blammo earnout | (304 | ) | (531 | ) | - | - | - | - | - | - | |||||||||||||||||||||||
| Stock-based compensation | (561 | ) | (771 | ) | (989 | ) | (1,189 | ) | (1,151 | ) | (1,914 | ) | (1,911 | ) | (2,065 | ) | |||||||||||||||||
| Litigation costs | - | - | - | - | - | (476 | ) | 390 | - | ||||||||||||||||||||||||
| Non-GAAP general and administrative expense | $ | 4,061 | $ | 4,167 | $ | 5,326 | $ | 5,710 | $ | 6,183 | $ | 5,039 | $ | 2,898 | $ | 4,773 | |||||||||||||||||
| Glu Mobile Inc. | |||||||||||||||||||||||||||||||||
| Non-GAAP Adjusted EBITDA | |||||||||||||||||||||||||||||||||
| (in thousands) | |||||||||||||||||||||||||||||||||
| (unaudited) | |||||||||||||||||||||||||||||||||
|
For the Three Months Ended |
|||||||||||||||||||||||||||||||||
| March 31, | June 30, | September 30, | December 31, | March 31, | June 30, | September 30, | December 31, | ||||||||||||||||||||||||||
| 2014 | 2014 | 2014 | 2014 | 2015 | 2015 | 2015 | 2015 | ||||||||||||||||||||||||||
| GAAP net income/(loss) | $ | 133 | $ | (3,768 | ) | $ | 10,404 | $ | 1,379 | $ | 1,124 | $ | (5,509 | ) | $ | 158 | $ | (2,958 | ) | ||||||||||||||
| Change in deferred revenue and litigation settlement proceeds | 2,377 | (5,874 | ) | 18,762 | 3,363 | (7,023 | ) | 1,329 | 1,174 | (3,135 | ) | ||||||||||||||||||||||
| Change in deferred platform commissions and royalty expense | (1,209 | ) | 1,527 | (9,122 | ) | (108 | ) | 2,819 | (321 | ) | (780 | ) | 1,497 | ||||||||||||||||||||
| Non-cash warrant expense | - | - | 1,126 | 66 | 93 | 135 | 1,896 | (116 | ) | ||||||||||||||||||||||||
| Amortization of intangible assets | 681 | 568 | 1,465 | 2,561 | 2,561 | 2,466 | 2,391 | 2,336 | |||||||||||||||||||||||||
| Depreciation | 620 | 607 | 617 | 669 | 706 | 732 | 718 | 706 | |||||||||||||||||||||||||
| Stock-based compensation | 2,979 | 4,566 | 1,954 | 2,134 | 2,129 | 3,032 | 3,056 | 3,469 | |||||||||||||||||||||||||
| Change in fair value of Blammo earnout | 304 | 531 | - | - | - | - | - | - | |||||||||||||||||||||||||
| Transitional costs | - | 682 | 493 | 255 | 72 | - | - | - | |||||||||||||||||||||||||
| Litigation costs and settlement proceeds | - | - | - | - | - | 476 | (390 | ) | - | ||||||||||||||||||||||||
| Restructuring charge | - | 159 | 209 | 67 | - | - | - | 1,075 | |||||||||||||||||||||||||
| Foreign currency exchange loss | 136 | 31 | 347 | 981 | 290 | 186 | 167 | 149 | |||||||||||||||||||||||||
| Interest income and other expense | (6 | ) | (7 | ) | (7 | ) | (3 | ) | (6 | ) | (12 | ) | (15 | ) | (15 | ) | |||||||||||||||||
| Income tax provision/(benefit) | 444 | 78 | (10,850 | ) | 2,773 | 1,104 | (809 | ) | 79 | (234 | ) | ||||||||||||||||||||||
| Total Non-GAAP Adjusted EBITDA | $ | 6,459 | $ | (900 | ) | $ | 15,398 | $ | 14,137 | $ | 3,869 | $ | 1,705 | $ | 8,454 | $ | 2,774 | ||||||||||||||||
In addition to the reasons stated above, which are generally applicable to each of the items Glu excludes from its non-GAAP financial measures, Glu believes it is appropriate to exclude certain items for the following reasons:
Change in Deferred Revenue and Deferred Cost of Revenue. At the date we sell certain premium games and micro-transactions, Glu has an obligation to provide additional services and incremental unspecified digital content in the future without an additional fee. In these cases, we recognize the revenue and any associated cost of revenue, including platform commissions and royalties, on a straight-line basis over the estimated life of the paying user. Internally, Glu’s management excludes the impact of the changes in deferred revenue and deferred cost of revenue related to its premium and free-to-play games in its non-GAAP financial measures when evaluating the company’s operating performance, when planning, forecasting and analyzing future periods, and when assessing the performance of its management team. Glu believes that excluding the impact of the changes in deferred revenue and deferred cost of revenue from its operating results is important to facilitate comparisons to prior periods and to understand Glu’s operations.
Amortization of Intangible Assets. When analyzing the operating performance of an acquired entity, Glu's management focuses on the total return provided by the investment (i.e., operating profit generated from the acquired entity as compared to the purchase price paid) without taking into consideration any allocations made for accounting purposes. Because the purchase price for an acquisition necessarily reflects the accounting value assigned to intangible assets (including acquired in-process technology and goodwill), when analyzing the operating performance of an acquisition in subsequent periods, Glu's management excludes the GAAP impact of acquired intangible assets to its financial results. Glu believes that such an approach is useful in understanding the long-term return provided by an acquisition and that investors benefit from a supplemental non-GAAP financial measure that excludes the accounting expense associated with acquired intangible assets.
Non-cash Warrant Expense. In the third and fourth quarters of 2014 and the full year of 2015, Glu recorded a non-cash charge related to the vesting of warrants to purchase shares of common stock issued to brand holders as part of fourth party licensing, development and publishing arrangements. These charges were computed using the Black-Scholes valuation model and were recorded in cost of revenue. When evaluating the performance of its consolidated results, Glu does not consider non-cash warrant expense as it places a greater emphasis on overall stockholder dilution rather than the accounting charges associated with the vesting of any warrants. As the non-cash warrant expense impacts comparability from period to period Glu believes that investors benefit from a supplemental non-GAAP financial measure that excludes these charges.
Stock-Based Compensation Expense. The Company applies the fair value provisions of ASC 718, Compensation-Stock Compensation (“ASC 718”). ASC 718 requires the recognition of compensation expense, using a fair-value based method, for costs related to all share-based payments. Included in the stock compensation expense was the contingent consideration that was subsequently issued to the Blammo employees who were former shareholders of Blammo, which was recorded as research and development expense over the term of the earn-out periods, since these employees were primarily employed in product development. Glu re-measured the fair value of the contingent consideration each reporting period and only recorded a compensation expense for the portion of the earn-out target which was achieved. When evaluating the performance of its consolidated results, Glu does not consider stock-based compensation charges. Likewise, Glu's management team excludes stock-based compensation expense from its short and long-term operating plans. In contrast, Glu's management team is held accountable for cash-based compensation and such amounts are included in its operating plans. Further, when considering the impact of equity award grants, Glu places a greater emphasis on overall stockholder dilution rather than the accounting charges associated with such grants. Glu believes it is useful to provide a non-GAAP financial measure that excludes stock-based compensation in order to better understand the long-term performance of its business.
Restructuring Charges. Glu undertook restructuring activities in the second, third and fourth quarters of 2014 and the fourth quarter of 2015 and recorded cash restructuring charges due to the termination of certain employees in its China, Europe and U.S. offices. Glu recorded the severance costs as an operating expense when it communicated the benefit arrangement to the employee and no significant future services, other than a minimum retention period, were required of the employee to earn the termination benefits. Glu believes that these restructuring charges do not reflect its ongoing operations and that investors benefit from a supplemental non-GAAP financial measure that excludes these charges.
Change in Fair Value of Blammo Earnout. As part of the acquisition of Blammo, Glu committed to issue additional consideration in the form of Glu’s common stock to the former, non-employee Blammo shareholders if certain revenue targets were achieved. Glu recorded the estimated contingent consideration liability at acquisition and adjusted the fair value of the liability each reporting period. When analyzing the operating performance of an acquired entity, Glu’s management focuses on the total return provided by the investment (i.e., operating profit generated from the acquired entity as compared to the purchase price paid including the final amounts paid for contingent consideration) without taking into consideration any expenses recognized post-acquisition related to the change in fair value of the contingent consideration. Because the final purchase price paid for an acquisition necessarily reflects the accounting value assigned to both the consideration, including the contingent consideration, paid and to the intangible assets (including goodwill) acquired, when analyzing the operating performance of an acquisition in subsequent periods, the Company’s management excludes the GAAP impact of any adjustments to the fair value of these acquisition-related balances to its financial results. Glu believes that the fair value adjustments affect comparability from period to period and that investors benefit from a supplemental non-GAAP financial measure that excludes these charges.
Litigation Settlement Proceeds and Costs. These proceeds and expenses consist primarily of one-time settlement payments received from, and legal fees incurred in connection with, intellectual property infringement matters. The Company has treated the settlement proceeds as a multiple element arrangement and has allocated a significant portion of the proceeds to revenue as deemed royalty revenue for the settlement of past infringement. The residual proceeds have been allocated to contra general and administrative expenses and offset legal fees incurred. The Company excludes these proceeds and costs from its non-GAAP measures as these proceeds and costs are isolated, unpredictable and not expected to recur regularly, and the Company believes that these non-recurring proceeds and costs have no direct correlation to the operation of the Company’s ongoing core business.
Transitional Costs. GAAP requires expenses to be recognized for various types of events associated with a business acquisition such as legal, accounting and other deal related expenses. Glu has incurred various costs related to the acquisition and integration of PlayFirst and Cie Games into Glu’s operations. Glu recorded these non-recurring acquisition and transitional costs as operating expenses when they were incurred. Glu believes that these acquisition and transitional costs affect comparability from period to period and that investors benefit from a supplemental non-GAAP financial measure that excludes these expenses.
Release of tax liabilities and valuation allowance. In the third and fourth quarters of 2014 Glu adjusted a portion of its deferred tax asset valuation allowance as a result of the deferred tax liabilities recorded in connection with the Cie Games acquisition. Glu believes that these non-recurring, one-time tax adjustments do not reflect its ongoing operations and that investors benefit from a supplemental non-GAAP financial measure that excludes these adjustments.
Foreign currency exchange gains and losses. Foreign currency exchange gains and losses represent the net gain or loss that Glu has recorded for the impact of currency exchange rate movements on cash and other assets and liabilities denominated in foreign currencies related to the revaluation of assets and liabilities. Accordingly, foreign currency exchange gains and losses are generally unpredictable and can cause Glu’s reported results to vary significantly. Due to the unusual magnitude of these gains and losses, and the fact that Glu has not engaged in hedging or taken other actions to reduce the likelihood of incurring a sizeable net gain or loss in future periods, Glu excludes foreign exchange gains and losses for comparability purposes. Glu believes that these gains and losses do not reflect its ongoing operations and that investors benefit from a supplemental non-GAAP financial measure that excludes these items, enabling investors to compare Glu’s core operating results in different periods without this variability. Foreign exchange losses recognized during 2014 and 2015 were as follows (in thousands):
| March 31, 2014 | $ | (136) | |
| June 30, 2014 | (31) | ||
| September 30, 2014 | (347) | ||
| December 31, 2014 | (981) | ||
| FY 2014 | $ | (1,495) | |
| March 31, 2015 | $ | (290) | |
| June 30, 2015 | (186) | ||
| September 30, 2015 | (167) | ||
| December 31, 2015 | (149) | ||
| FY 2015 | $ | (792) | |
CONTACT:
Investor Relations:
ICR, Inc.
Seth Potter,
646-277-1230
[email protected]
Exhibit 99.02

Mobile Q4 2015 Earnings © Glu Mobile Inc. – Proprietary Glu Mobile Inc. Q4 2015 Earnings Call February 3, 2016 Page 1
Glu Mobile Q4 2015 Earnings © Glu Mobile Inc. – Proprietary Safe Harbor Statement This presentation contains "forward-looking" statements including: that we intend to focus on “winner takes all” “blue ocean genres, and the four categories in which we are currently leaders are ones where we believe we can be the best in the world in 2016/2017; that we are minimally exposed to increases in CPI; that strong social features in a game will lead to long tail revenues; Glu’s expected approach to integrating social features in its games; Glu has multiple growth opportunities through wearables, the quad screen future, mobile ad spending and international expansion; the planned evolution of Glu’s business, including our intention to have our games function as platforms, our catalog cover fixed operating expenses and for new launches to account for less than 25% of revenues in a given year; the expected launch dates of Frontline Commando Rivals in various territories; that certain features in this game will be implemented in future updates; that the usage of chat and discussion boards in QuizUp drives much better retention; that there is an opportunity to create a primetime TV show featuring QuizUp; our expected title release slate for 2016, including that additional games may be launched if they pass our new central milestone process; the expected contribution margin flow through of our gross revenue; our Q1-2016 and full year 2016 guidance; our five year goals of annual revenue growth of 20% to 30%, $1 billion of non-GAAP revenue by 2020 and all quarters being Adjusted EBITDA profitable; and our long-term margin targets. These forward-looking statements are subject to material risks and uncertainties that could cause actual results to differ materially from those in the forward-looking statements. Investors should consider important risk factors, which include: consumer demand for smartphones, tablets and next-generation platforms does not grow as significantly as we anticipate or that we will be unable to capitalize on any such growth; the risk that we do not realize a sufficient return on our investment with respect to our efforts to develop free-to-play games for smartphones and tablets; the risk that we do not maintain our good relationships with Apple and Google; the risk that Glu does not realize the anticipated strategic benefits from its celebrity partnerships; the risk that our development expenses are greater than we anticipate or that we experience product delays; the risk that our recently and newly launched games are less popular than anticipated; the risk that our newly released games will be of a quality less than desired by reviewers and consumers; the risk that the mobile games market, particularly with respect to social, free-to-play gaming, is smaller than anticipated; risks related to the restatement of certain of our historical financial statements and other risks detailed under the caption "Risk Factors" in our Form 10-Q filed with the Securities and Exchange Commission on November 9, 2015 and our other SEC filings. You can locate these reports through our website at http://www.glu.com/investors. These "forward-looking" statements are based on estimates and information available to us on February 3, 2016 and we are under no obligation, and expressly disclaim any obligation, to update or alter our forward-looking statements whether as a result of new information, future events or otherwise.Page 2
Glu Mobile Q4 2015 Earnings © Glu Mobile Inc. – Proprietary Use of Non-GAAP Financial Measures Glu uses in this presentation certain non-GAAP measures of financial performance. The presentation of these non-GAAP financial measures is not intended to be considered in isolation from, as a substitute for, or superior to, the financial information prepared and presented in accordance with GAAP, and may be different from non-GAAP financial measures used by other companies. In addition, these non-GAAP measures have limitations in that they do not reflect all of the amounts associated with Glu's results of operations as determined in accordance with GAAP. The non-GAAP financial measures used by Glu include non-GAAP revenue, non-GAAP smartphone revenue, non-GAAP cost of revenue, non-GAAP gross profit, non-GAAP gross margin, non-GAAP operating expenses, non-GAAP operating margin, non-GAAP net income/(loss), non-GAAP net income/(loss) per share, Adjusted EBITDA and Adjusted EBITDA margin. These non-GAAP financial measures exclude the following items from Glu's unaudited consolidated statements of operations: Change in deferred revenue and deferred cost of revenue; Amortization of intangible assets; Non-cash warrant expense; Stock-based compensation expense; Restructuring charges; Change in fair value of Blammo earnout; Transitional costs; Litigation proceeds and costs; Release of tax liabilities and valuation allowance; and Foreign currency exchange gains and losses primarily related to the revaluation of assets and liabilities. In addition, Glu has included in this presentation “Adjusted EBITDA” figures which are used to evaluate Glu’s operating performance and is defined as non-GAAP operating income/(loss) excluding depreciation. Adjusted EBITDA margin is defined as Adjusted EBITDA divided by non-GAAP revenue. Glu believes that these non-GAAP financial measures, when taken together with the corresponding GAAP financial measures, provide meaningful supplemental information regarding Glu's performance by excluding certain items that may not be indicative of Glu's core business, operating results or future outlook. Glu's management uses, and believes that investors benefit from referring to, these non-GAAP financial measures in assessing Glu's operating results, as well as when planning, forecasting and analyzing future periods. These non-GAAP financial measures also facilitate comparisons of Glu's performance to prior periods. For a reconciliation of these non-GAAP financial measures to their most directly comparable GAAP financial measures, please refer to the tables at the end of this presentation. Page 3
Glu Mobile Q4 2015 Earnings © Glu Mobile Inc. – Proprietary Executive Summary Page 4

Executive SummaryGlu Mobile Q4 2015 Earnings © Glu Mobile Inc. – Proprietary Page 5

Glu Mobile Q4 2015 Earnings © Glu Mobile Inc. – Proprietary Strengthened Management Team Chris Akhavan Pres. of Publishing Eric R. Ludwig COO & CFO Niccolo de Masi Chairman & CEO Tim Wilson CTO Nick Earl Pres. of Studios Page 6
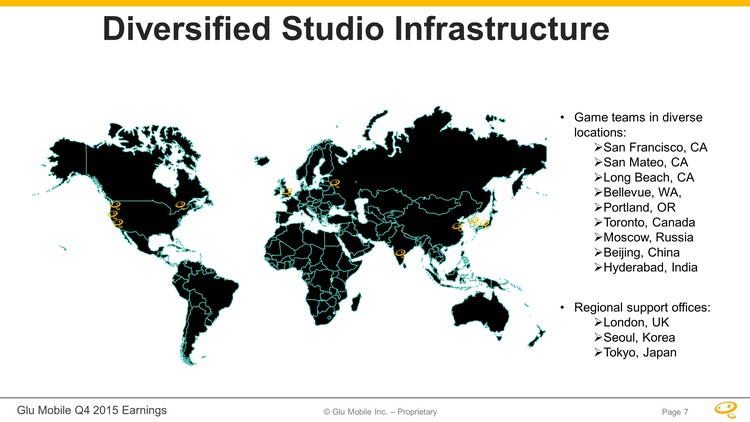
© Glu Mobile Inc. – Proprietary Glu Mobile Q4 2015 Earnings Diversified Studio Infrastructure Game teams in diverse locations: San Francisco, CA San Mateo, CA Long Beach, CA Bellevue, WA, Portland, OR Toronto, Canada Moscow, Russia Beijing, China Hyderabad, India Regional support offices: London, UK Seoul, Korea Tokyo, Japan Page 7
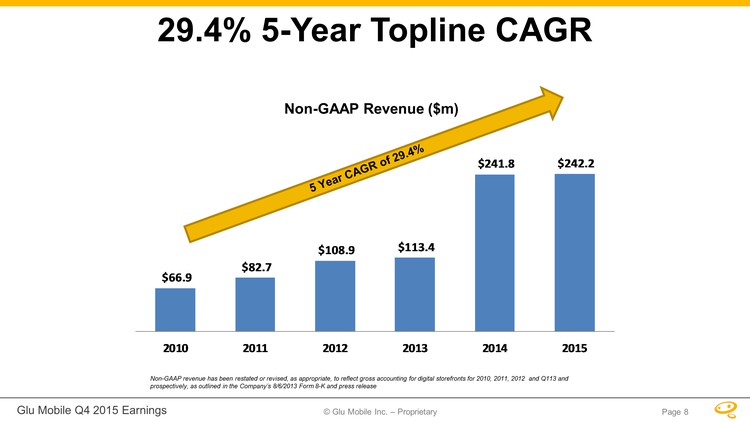
Glu Mobile Q4 2015 Earnings © Glu Mobile Inc. – Proprietary 29.4% 5-Year Topline CAGR $66.9 $82.7 $108.9 $113.4 $241.8 $242.2 201020112012201320142015 Non-GAAP revenue has been restated or revised, as appropriate, to reflect gross accounting for digital storefronts for 2010, 2011, 2012 and Q113 and prospectively, as outlined in the Company’s 8/6/2013 Form 8-K and press release Page 8
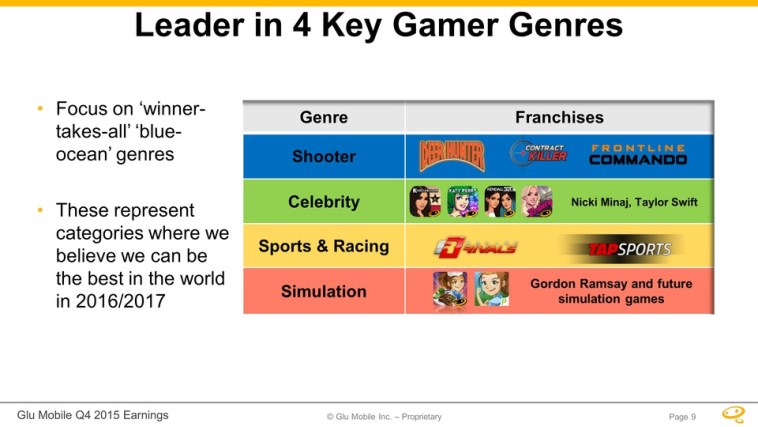
Focus on ‘winner-takes-all’ ‘blue-ocean’ genres Leader in 4 Key Gamer Genres These represent categories where we believe we can be the best in the world in 2016/2017 Glu Mobile Q4 2015 Earnings © Glu Mobile Inc. – Proprietary Page 9
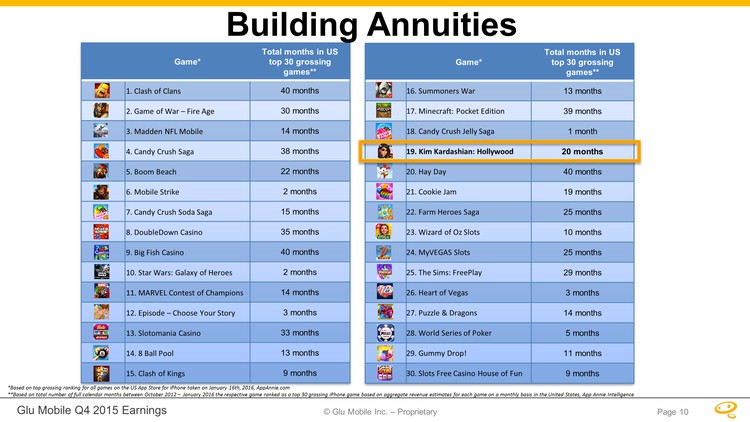
Building Annuities *Based on top grossing ranking for all games on the US App Store for iPhone taken on January 16th, 2016, AppAnnie.com **Based on total number of full calendar months between October 2012 – January 2016 the respective game ranked as a top 30 grossing iPhone game based on aggregate revenue estimates for each game on a monthly basis in the United States, App Annie Intelligence Page 10
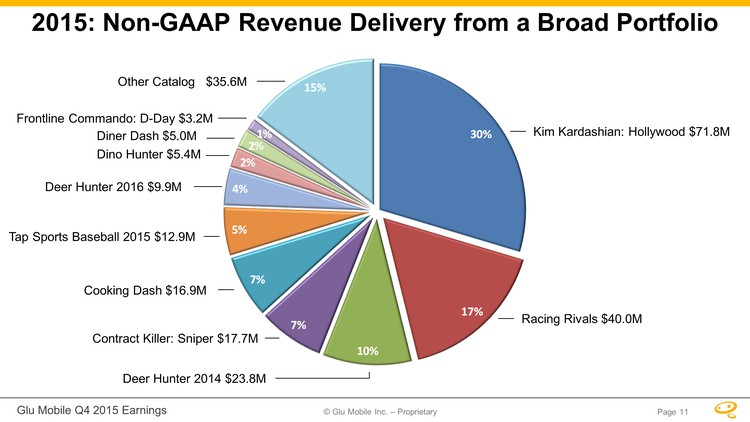
© Glu Mobile Inc. – Proprietary Glu Mobile Q4 2015 Earnings Deer Hunter 2016 $9.9M Kim Kardashian: Hollywood $71.8M Deer Hunter 2014 $23.8M Contract Killer: Sniper $17.7M Cooking Dash $16.9M Tap Sports Baseball 2015 $12.9M Dino Hunter $5.4M Diner Dash $5.0M Other Catalog $35.6M Frontline Commando: D-Day $3.2M 2015: Non-GAAP Revenue Delivery from a Broad Portfolio Racing Rivals $40.0M Page 11
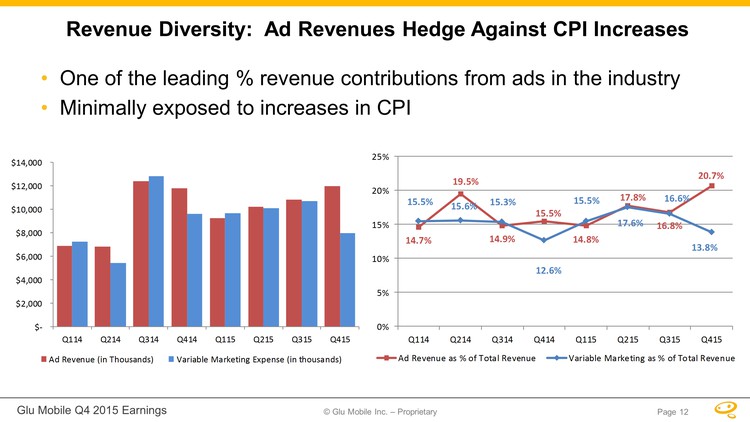
Glu Mobile Q4 2015 Earnings © Glu Mobile Inc. – Proprietary Revenue Diversity: Ad Revenues Hedge Against CPI Increases One of the leading % revenue contributions from ads in the industry Minimally exposed to increases in CPI $- $2,000 $4,000 $6,000 $8,000 $10,000 $12,000 $14,000Q114Q214Q314Q414Q115Q215Q315Q415Ad Revenue (in Thousands)Variable Marketing Expense (in thousands) 14.7 %19.5%14.9%15.5%14.8%17.8 %16.8%20.7%15.5%15. 6%15.3%12.6%15.5%17.6%16.6%13 .8%0%5%10%15 %20%25%Q 114Q214Q 314Q414Q115Q215Q315Q415 Ad Revenue as % of Total RevenueVariable Marketing as % of Total RevenuePage 12
Glu Mobile Q4 2015 Earnings © Glu Mobile Inc. – Proprietary Growth Landscape Page 13
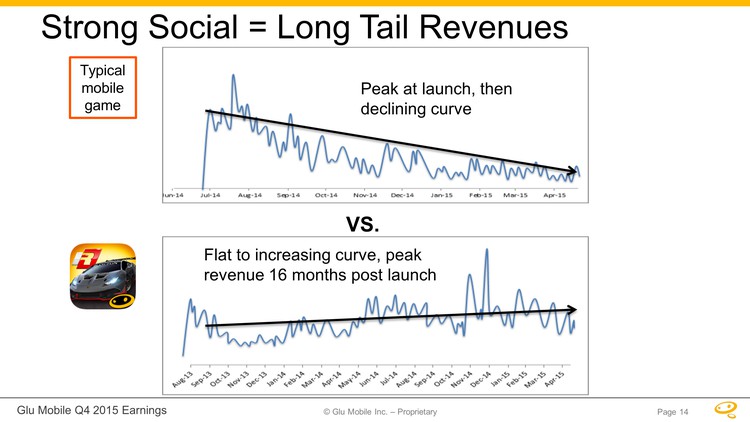
Glu Mobile Q4 2015 Earnings © Glu Mobile Inc. – Proprietary Strong Social = Long Tail Revenues Typical mobile game Peak at launch, then declining curve VS. Flat to increasing curve, peak revenue 16 months post launch Glu Mobile Q4 2015 Earnings © Glu Mobile Inc. – Proprietary Page 14
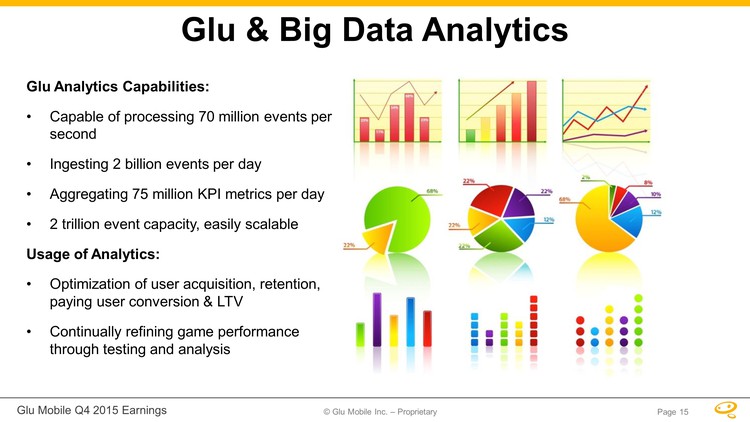
Glu Analytics Capabilities: Capable of processing 70 million events per second Ingesting 2 billion events per day Aggregating 75 million KPI metrics per day 2 trillion event capacity, easily scalable Usage of Analytics: Optimization of user acquisition, retention, paying user conversion & LTV Continually refining game performance through testing and analysis Glu & Big Data AnalyticsGlu Mobile Q4 2015 Earnings © Glu Mobile Inc. – Proprietary Page 15
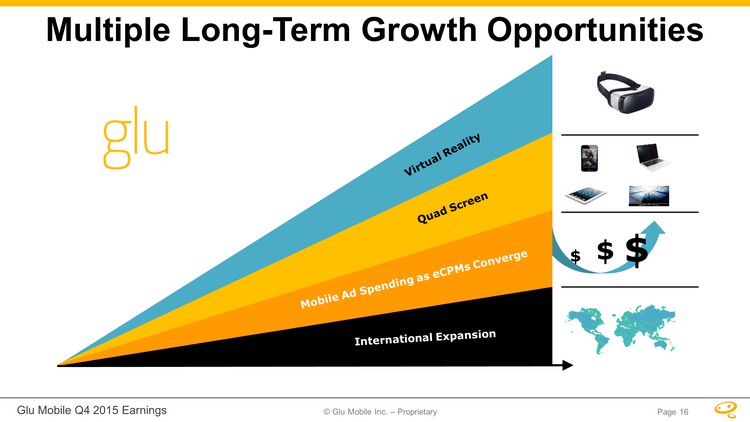
Multiple Long-Term Growth Opportunities $ $ $Glu Mobile Q4 2015 Earnings © Glu Mobile Inc. – Proprietary Page 16
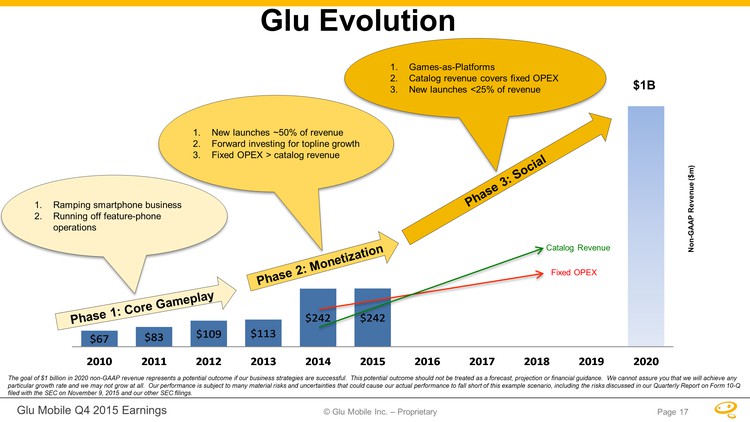
Glu Evolution 1. Ramping smartphone business 2. Running off feature-phone operations 1. New launches ~50% of revenue 2. Forward investing for topline growth 3. Fixed OPEX > catalog revenue 1. Games-as-Platforms 2. Catalog revenue covers fixed OPEX 3. New launches <25% of revenue $1BNon-GAAP Revenue ($m) The goal of $1 billion in 2020 non-GAAP revenue represents a potential outcome if our business strategies are successful. This potential outcome should not be treated as a forecast, projection or financial guidance. We cannot assure you that we will achieve any particular growth rate and we may not grow at all. Our performance is subject to many material risks and uncertainties that could cause our actual performance to fall short of this example scenario, including the risks discussed in our Quarterly Report on Form 10-Q filed with the SEC on November 9, 2015 and our other SEC filings. Fixed OPEX Catalog Revenue Page 17

Glu Mobile Q4 2015 Earnings © Glu Mobile Inc. – Proprietary Tencent ‘WeFire West’ Publishing Partnership Page 18

Glu Mobile Q4 2015 Earnings © Glu Mobile Inc. – Proprietary Publishing Partnership •Glu partnering with Tencent to westernize WeFire with Glu’s proven shooter IP Frontline Commando •We believe WeFire to be the biggest revenue mobile shooter ever •Sustained Top 10 grossing ranking in China and other territories in Asia •Highly social game with PvP and scaled backend •Expected to be live late Q2 2016 in North America, Australia and New Zealand with additional countries in South America and EMEA live in Q3 2016 Page 19

Glu Mobile Q4 2015 Earnings © Glu Mobile Inc. – Proprietary Product Overview COVER-BASED 3RD PERSON SHOOTER MULTIPLE GAME MODES SOCIAL FEATURES Page 20
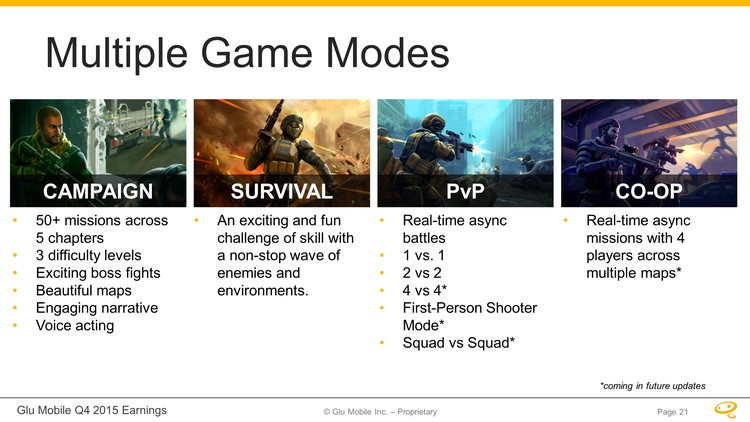
Glu Mobile Q4 2015 Earnings © Glu Mobile Inc. – Proprietary Multiple Game Modes . 50+ missions across 5 chapters . 3 difficulty levels . Exciting boss fights . Beautiful maps. Engaging narrative . Voice acting . An exciting and fun challenge of skill with a non-stop wave of enemies and environments. . Real-time async battles . 1 vs. 1 . 2 vs 2 . 4 vs 4*. First-Person Shooter Mode* . Squad vs Squad* . Real-time async missions with 4 players across multiple maps* *coming in future updates Page 21

QuizUP Investment + Option to Buy 100%

Glu Mobile Q4 2015 Earnings © Glu Mobile Inc. – Proprietary Trivia for the 21st Century . Over 40M registered users since Nov 2013 . 5 Billion online matches played . Average user spends 30 minutes on the app per day . Usage of chat and discussion boards drives much better retention . Monetization yet to begin Page 23
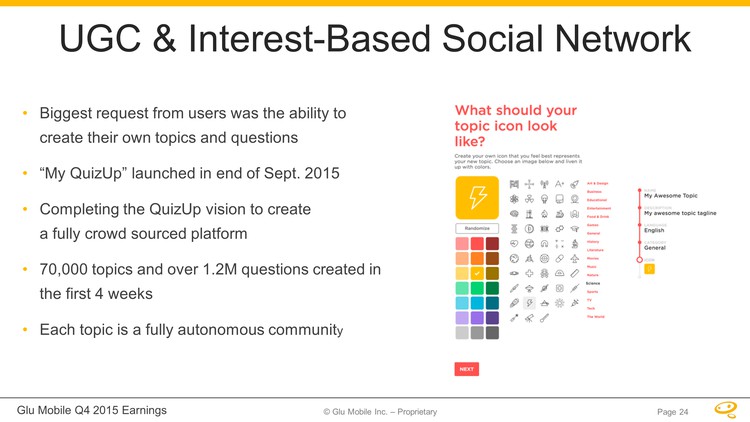
Glu Mobile Q4 2015 Earnings © Glu Mobile Inc. – Proprietary UGC & Interest-Based Social Network . Biggest request from users was the ability to create their own topics and questions . “My QuizUp” launched in end of Sept. 2015 . Completing the QuizUp vision to create a fully crowd sourced platform . 70,000 topics and over 1.2M questions created in the first 4 weeks . Each topic is a fully autonomous community Page 24

Glu Mobile Q4 2015 Earnings © Glu Mobile Inc. – Proprietary Opportunity for Primetime TV Page 25

Glu Mobile Q4 2015 Earnings © Glu Mobile Inc. – Proprietary Dairy Free Games Page 26

Glu Mobile Q4 2015 Earnings © Glu Mobile Inc. – Proprietary Investment & Publishing Partnership •Glu led the Series A Financing for Dairy Free Games, acquiring a minority stake in the company •Dairy Free is based in San Francisco, with development efforts taking place in Eastern Europe •The parties also entered into a commercial agreement pursuant to which Glu provided funding for a Dairy Free game under development, and received the exclusive right to publish the game and any sequels Page 27
Glu Mobile Q4 2015 Earnings © Glu Mobile Inc. – Proprietary User Engagement Page 28
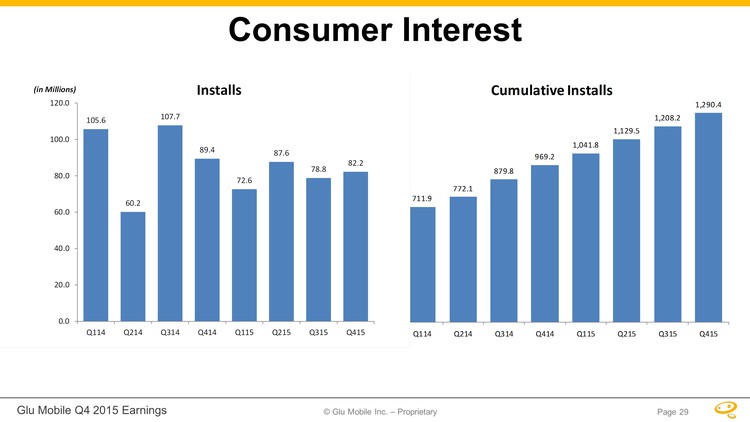
Glu Mobile Q4 2015 Earnings © Glu Mobile Inc. – Proprietary Consumer Interest 711.9772.1879.8969.21,041.81,129.5 1,208.21,290.40.0200.0400.0600.0800.0 1,000. 01, 200.01, 400.0Q11 4Q21 4Q314Q414Q115Q215Q315Q415(in Millions) Cumulative Installs105.660.2107.789.472.687.678.882.20.020. 040.060.080.0100.0120 .0Q11 4Q214Q31 4Q414Q115Q215Q3 15Q415(in Millions)In stalls Page 29
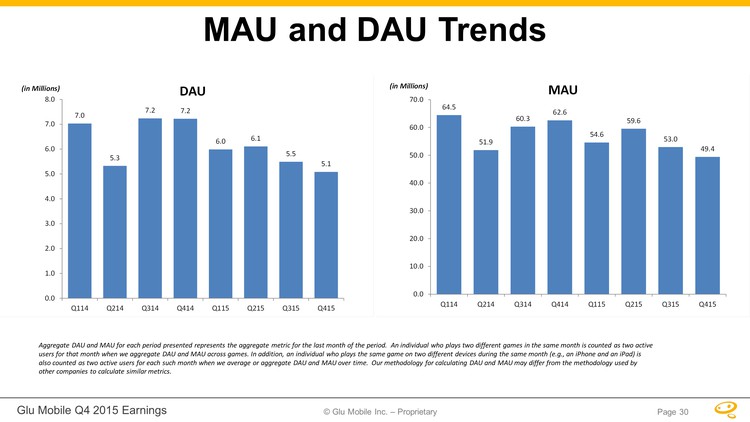
Glu Mobile Q4 2015 Earnings © Glu Mobile Inc. – Proprietary MAU and DAU Trends Aggregate DAU and MAU for each period presented represents the aggregate metric for the last month of the period. An individual who plays two different games in the same month is counted as two active users for that month when we aggregate DAU and MAU across games. In addition, an individual who plays the same game on two different devices during the same month (e.g., an iPhone and an iPad) is also counted as two active users for each such month when we average or aggregate DAU and MAU over time. Our methodology for calculating DAU and MAU may differ from the methodology used by other companies to calculate similar metrics. 7.05.37.27.26.06.15.55.10.01.02.03.04.05.0 6.07.08.0 Q11 4Q214 Q314Q414Q115Q215Q315Q415(in Milli ons)DAU6 4.551.960.362.654.659.653.0 49.40.01 0. 020.03 0.040 .050.060.070.0Q114 Q214Q314Q414 Q115Q215Q315Q415(in Millions)MAU Page 30

Glu Mobile Q4 2015 Earnings © Glu Mobile Inc. – Proprietary Social Power •~1.3 Billion* total social followers inked •Long-term partnerships •Strong pipeline of games to be released in 2016 through 2017 Page 31
Financial Overview Page 32
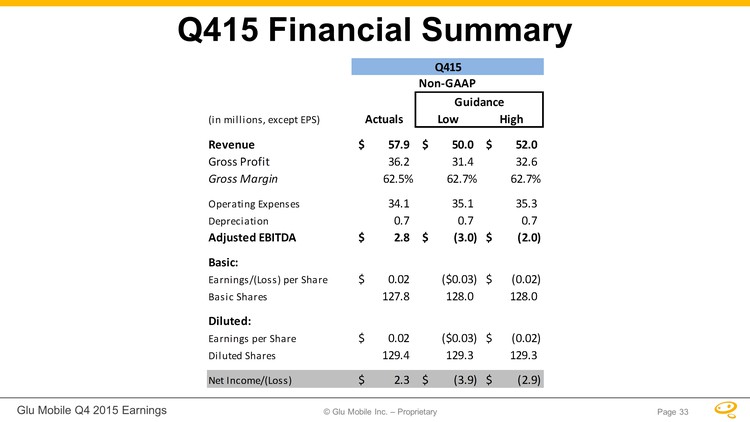
Glu Mobile Q4 2015 Earnings © Glu Mobile Inc. – Proprietary Page 33 Q415 Financial Summary Q415Non-GAAPGuidance(in millions, except EPS)ActualsLowHighRevenue57.9$ 50.0$ 52.0$ Gross Profit36.2 31.4 32.6 Gross Margin62.5%62.7%62.7%Operating Expenses34.1 35.1 35.3 Depreciation0.7 0.7 0.7 Adjusted EBITDA2.8$ (3.0)$ (2.0)$ Basic:Earnings/(Loss) per Share0.02$ ($0.03)(0.02)$ Basic Shares127.8 128.0 128.0 Diluted:Earnings per Share0.02$ ($0.03)(0.02)$ Diluted Shares129.4 129.3 129.3 Net Income/(Loss)2.3$ (3.9)$ (2.9)$
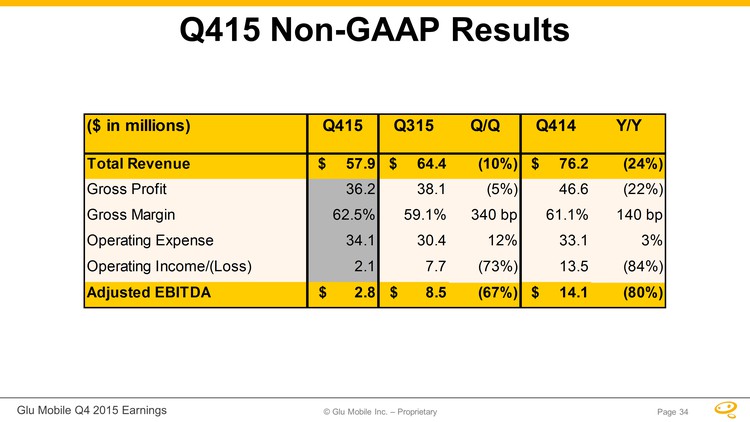
Glu Mobile Q4 2015 Earnings © Glu Mobile Inc. – Proprietary Page 34 Q415 Non-GAAP Results ($ in millions) Q415Q315Q/Q Q414Y/Y Total Revenue $ 57.9 $ 64.4 (10%) $ 76.2 (24%)Gross Profit36.238.1(5%)46.6(22%)Gross Margin62.5%59.1%340 bp61.1%140 bpOperating Expense 34.130.412%33.13%Operating Income/(Loss) 2.1 7.7 (73%) 13.5 (84%)Adjusted EBITDA $ 2.8 $ 8.5 (67%) $ 14.1 (80%)
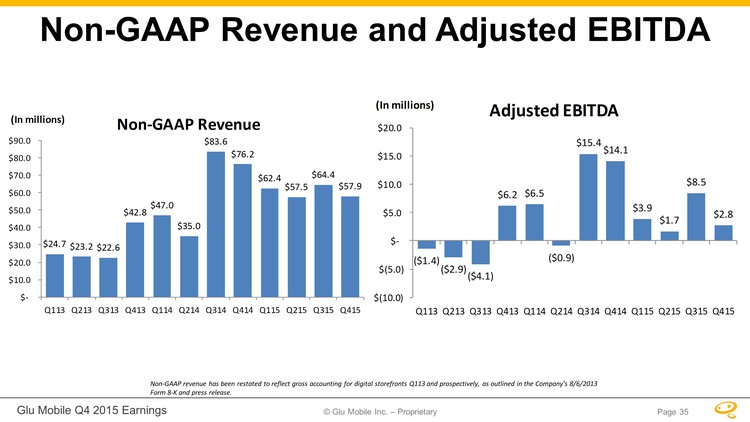
Glu Mobile Q4 2015 Earnings © Glu Mobile Inc. – Proprietary Page 35 Non-GAAP Revenue and Adjusted EBITDA Non-GAAP revenue has been restated to reflect gross accounting for digital storefronts Q113 and prospectively, as outlined in the Company’s 8/6/2013 Form 8-K and press release. $24.7$23.2$22.6$42.8$47.0$35.0$83.6$76.2$62.4$57.5$64.4$57.9 $- $10.0 $20.0 $30.0 $40.0 $50.0 $60.0 $70.0 $80.0 $90.0Q113Q213Q313Q413Q114Q214Q314Q414Q115Q215Q315Q415Non-GAAP Revenue(In millions)($1.4)($2.9)($4.1)$6.2 $6.5 ($0.9)$15.4 $14.1 $3.9 $1.7 $8.5 $2.8 $(10.0) $(5.0) $- $5.0 $10.0 $15.0 $20.0Q113Q213Q313Q413Q114Q214Q314Q414Q115Q215Q315Q415Adjusted EBITDA(In millions)
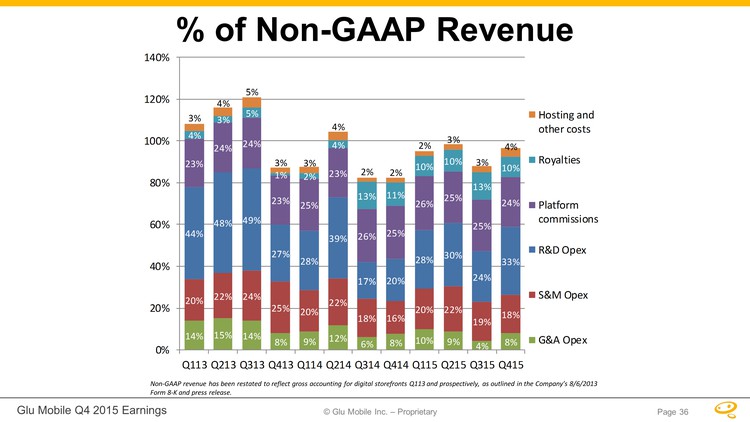
Glu Mobile Q4 2015 Earnings © Glu Mobile Inc. – Proprietary Page 36 % of Non-GAAP Revenue Non-GAAP revenue has been restated to reflect gross accounting for digital storefronts Q113 and prospectively, as outlined in the Company’s 8/6/2013 Form 8-K and press release. 3% 4% 5% 3% 3% 4% 2% 2% 2% 3% 3% 4% 0% 20 %4 0% 60 %8 0% 100 %1 20 % Q1 13Q 213 Q3 13Q 413 Q1 14Q 214 Q3 14Q414Q115Q215Q315Q415Hosting andother costsRoyaltiesPlatformcommissionsR&D OpexS&M OpexG&A Opex
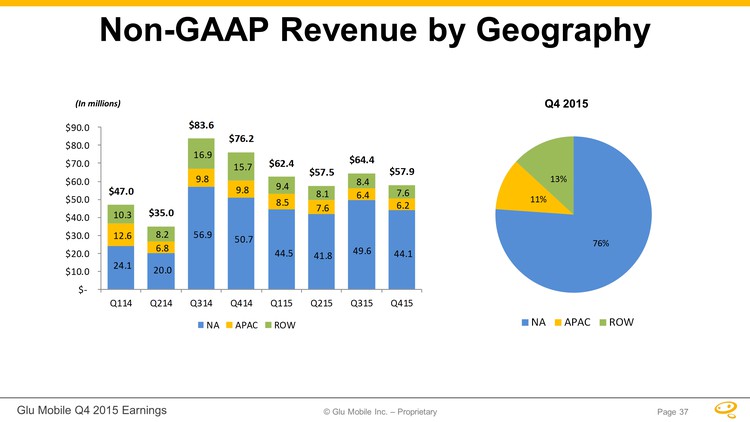
Glu Mobile Q4 2015 Earnings © Glu Mobile Inc. – Proprietary Page 37 Non-GAAP Revenue by Geography NAAPACROWQ4 2015 (In millions) 24.1 20.0 56.9 50.7 44.5 41.8 49.6 44.1 12.6 6.8 9.8 9.8 8.5 7.6 6.4 6.2 10.3 8.2 16.9 15.7 9.4 8.1 8.4 7.6 $47.0$35.0$83.6$76.2$62.4$57.5$64.4$57.9 $- $10.0 $20.0 $30.0 $40.0 $50.0 $60.0 $70.0 $80.0 $90.0 Q114 Q214 Q314 Q414 Q115 Q215 Q315 Q415 NAAP ACROW76%11%13%
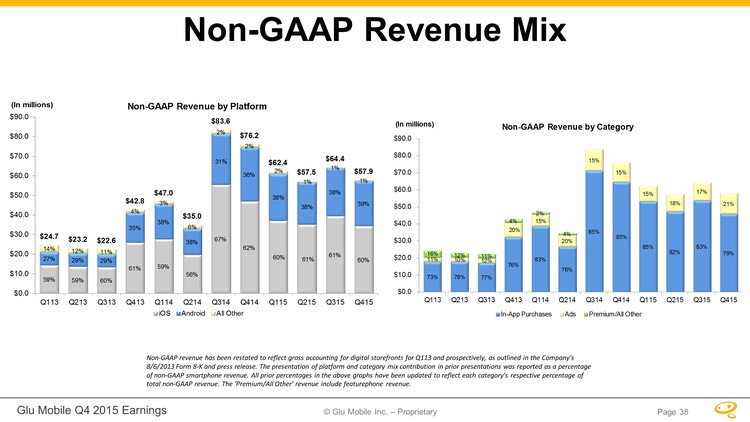
Glu Mobile Q4 2015 Earnings © Glu Mobile Inc. – Proprietary Page 38 Non-GAAP Revenue Mix Non-GAAP revenue has been restated to reflect gross accounting for digital storefronts for Q113 and prospectively, as outlined in the Company’s 8/6/2013 Form 8-K and press release. The presentation of platform and category mix contribution in prior presentations was reported as a percentage of non-GAAP smartphone revenue. All prior percentages in the above graphs have been updated to reflect each category’s respective percentage of total non-GAAP revenue. The ‘Premium/All Other’ revenue include featurephone revenue. 59% 59% 60% 61% 59% 56% 67% 62%60%61%61%60%27%29%29%35%38%38%31%36%38%38%38%39%14%12%11%4%3%6%2%2%2%1%1%1%$24.7 $23.2 $22.6 $42.8 $47.0 $35.0 $83.6 $76.2 $62.4 $57.5 $64.4 $57.9 $0.0 $10.0 $20.0 $30.0 $40.0 $50.0 $60.0 $70.0 $80.0 $90.0 Q113 Q213 Q313 Q413 Q114 Q214 Q314 Q414Q115Q215Q315Q415(In millions)Non-GAAP Revenue by PlatformiOSAndroidAll Other 73% 78% 77% 76% 83% 76% 85% 85% 85% 82% 83% 79% 11% 10% 12% 20% 15% 20% 15% 15% 15% 18% 17% 21% 16% 12% 11% 4% 2% 4% $0.0 $10.0$20.0$30.0$40.0$50.0$60.0$70.0$80.0$90.0Q113Q213Q313Q413Q114Q214Q314Q414Q115Q215Q315Q415(In millions)Non-GAAP Revenue by CategoryIn-App PurchasesAdsPremium/All Other
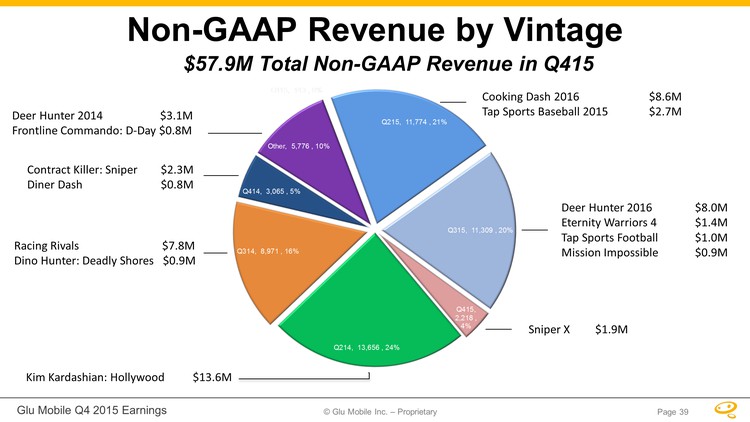
Glu Mobile Q4 2015 Earnings © Glu Mobile Inc. – Proprietary Non-GAAP Revenue by Vintage $57.9M Total Non-GAAP Revenue in Q415 Kim Kardashian: Hollywood $13.6M Racing Rivals $7.8M Dino Hunter: Deadly Shores $0.9M Contract Killer: Sniper $2.3M Diner Dash $0.8M Cooking Dash 2016 $8.6M Tap Sports Baseball 2015 $2.7M Deer Hunter 2016 $8.0M Eternity Warriors 4 $1.4M Tap Sports Football $1.0M Mission Impossible $0.9M Deer Hunter 2014 $3.1M Frontline Commando: D-Day $0.8M Sniper X $1.9M Page 39
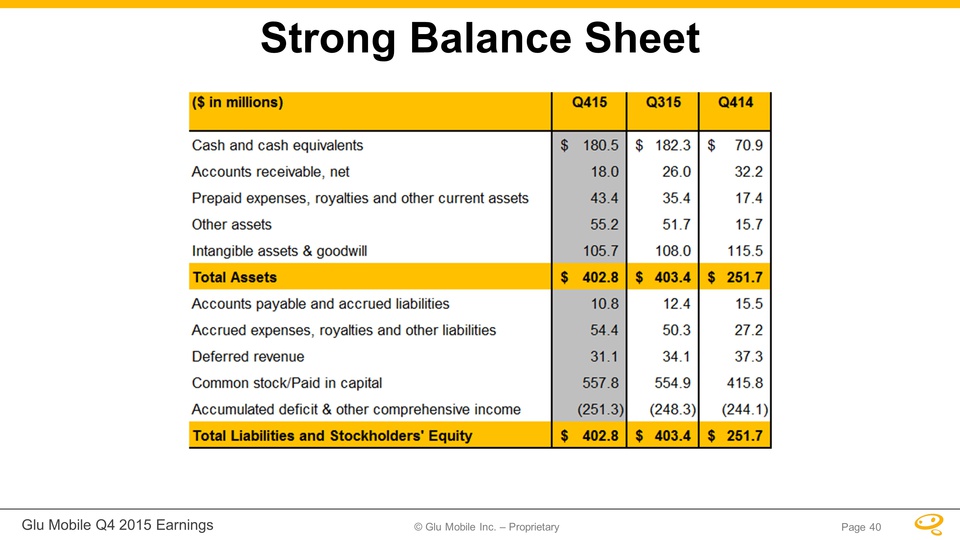
Glu Mobile Q4 2015 Earnings © Glu Mobile Inc. – Proprietary Page 40 Strong Balance Sheet ($ in millions)Q415Q315Q414Cash and cash equivalents180.5$ 182.3$ 70.9$ Accounts receivable, net18.0 26.0 32.2 Prepaid expenses, royalties and other current assets43.4 35.4 17.4 Other assets55.2 51.7 15.7 Intangible assets & goodwill105.7 108.0 115.5 Total Assets402.8$ 403.4$ 251.7$ Accounts payable and accrued liabilities10.8 12.4 15.5 Accrued expenses, royalties and other liabilities54.4 50.3 27.2 Deferred revenue31.1 34.1 37.3 Common stock/Paid in capital557.8 554.9 415.8 Accumulated deficit & other comprehensive income(251.3) (248.3) (244.1) Total Liabilities and Stockholders' Equity402.8$ 403.4$ 251.7$
© Glu Mobile Inc. – Proprietary Glu Mobile Q4 2015 Earnings Page 41 Guidance
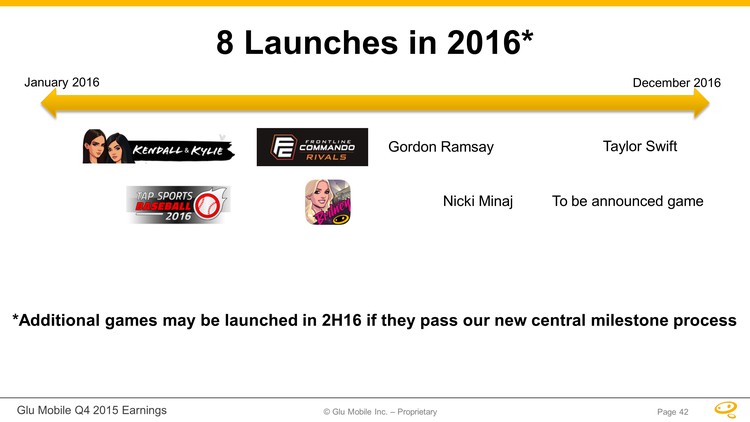
Glu Mobile Inc. – Proprietary Glu Mobile Q4 2015 Earnings 8 Launches in 2016* *Additional games may be launched in 2H16 if they pass our new central milestone process January 2016 December 2016 Gordon Ramsay Nicki Minaj Taylor Swift To be announced game Page 42
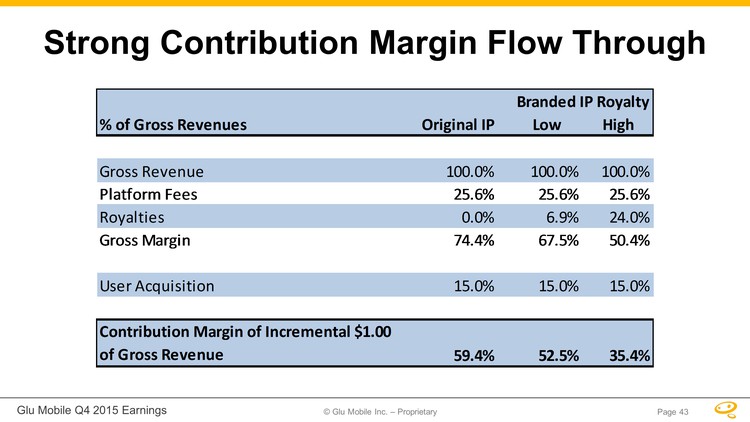
© Glu Mobile Inc. – Proprietary Glu Mobile Q4 2015 Earnings Strong Contribution Margin Flow Through % of Gross RevenuesOriginal IPLowHighGross Revenue100.0%100.0%100.0%Platform Fees25.6%25.6%25.6%Royalties0.0%6.9%24.0%Gross Margin74.4%67.5%50.4%User Acquisition15.0%15.0%15.0%Contribution Margin of Incremental $1.00 of Gross Revenue59.4%52.5%35.4%Branded IP Royalty Page 43
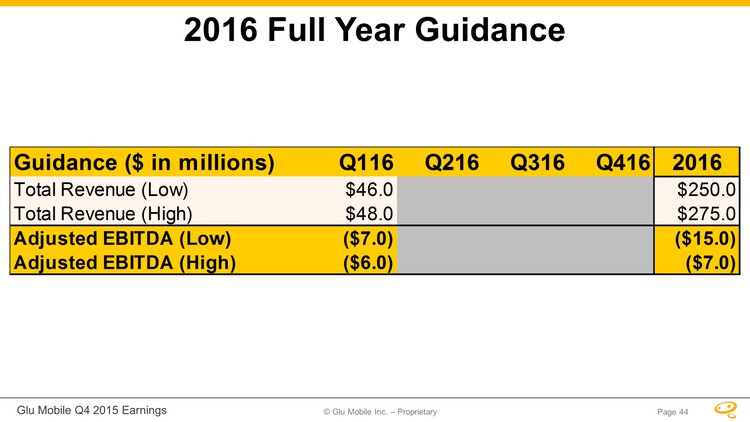
© Glu Mobile Inc. – Proprietary Glu Mobile Q4 2015 Earnings Page 44 2016 Full Year Guidance Guidance ($ in millions)Q116Q216Q316Q4162016Total Revenue (Low)$46.0 $250.0 Total Revenue (High)$48.0 $275.0 Adjusted EBITDA (Low)($7.0)($15.0)Adjusted EBITDA (High)($6.0)($7.0)
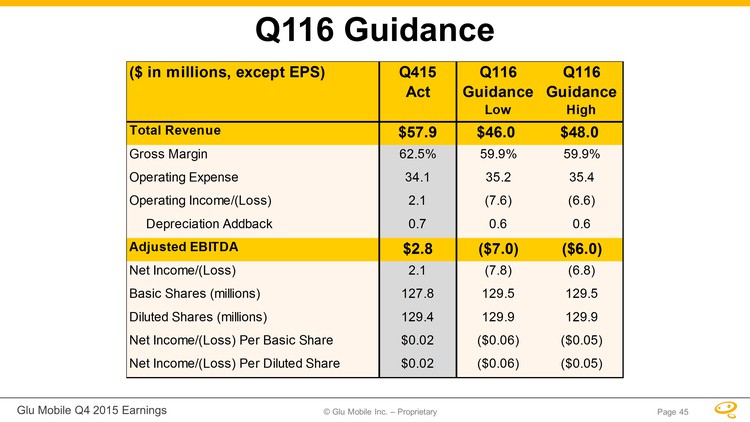
© Glu Mobile Inc. – Proprietary Glu Mobile Q4 2015 Earnings Page 45 Q116 Guidance ($ in millions, except EPS)Q415 ActQ116 GuidanceQ116 GuidanceLow HighTotal Revenue$57.9 $46.0$48.0Gross Margin 62.5%59.9%59.9%Operating Expense34.1 35.235.4Operating Income/(Loss) 2.1 (7.6)(6.6) Depreciation Addback 0.7 0.60.6Adjusted EBITDA$2.8 ($7.0)($6.0)Net Income/(Loss)2.1 (7.8)(6.8)Basic Shares (millions)127.8 129.5129.5Diluted Shares (millions)129.4 129.9129.9Net Income/(Loss) Per Basic Share $0.02 ($0.06)($0.05)Net Income/(Loss) Per Diluted Share $0.02 ($0.06)($0.05)

© Glu Mobile Inc. – Proprietary Glu Mobile Q4 2015 Earnings Page 46 Full Year Guidance ($ in millions, except EPS)2015ActLow HighTotal Revenue$242.2 $250.0 $275.0 Gross Margin 61.6%56.2%56.2% Operating Expense135.3 158.0164.0Operating Income/(Loss) 13.9 (17.5)(9.5) Depreciation Addback 2.9 2.52.5Adjusted EBITDA$16.8 ($15.0)($7.0)Net Income/(Loss)13.8 (18.3)(10.3) Basic Shares (millions) 118.8 132.2132.2Diluted Shares (millions)122.8 134.7134.7Net Income/(Loss) Per Basic Share $0.12 ($0.14)($0.08)Net Income/(Loss) Per Diluted Share $0.11 ($0.14)($0.08) Cash and ST Investments Balance$180.5 $140.0 2016 Guidance
© Glu Mobile Inc. – Proprietary Glu Mobile Q4 2015 Earnings Page 47 Long-Term Model
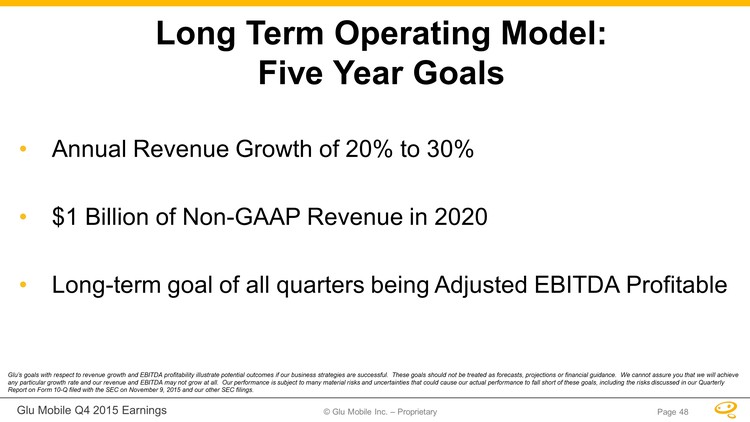
© Glu Mobile Inc. – Proprietary Glu Mobile Q4 2015 Earnings •Annual Revenue Growth of 20% to 30% •$1 Billion of Non-GAAP Revenue in 2020 •Long-term goal of all quarters being Adjusted EBITDA Profitable Long Term Operating Model: Five Year Goals Glu’s goals with respect to revenue growth and EBITDA profitability illustrate potential outcomes if our business strategies are successful. These goals should not be treated as forecasts, projections or financial guidance. We cannot assure you that we will achieve any particular growth rate and our revenue and EBITDA may not grow at all. Our performance is subject to many material risks and uncertainties that could cause our actual performance to fall short of these goals, including the risks discussed in our Quarterly Report on Form 10-Q filed with the SEC on November 9, 2015 and our other SEC filings. Page 48
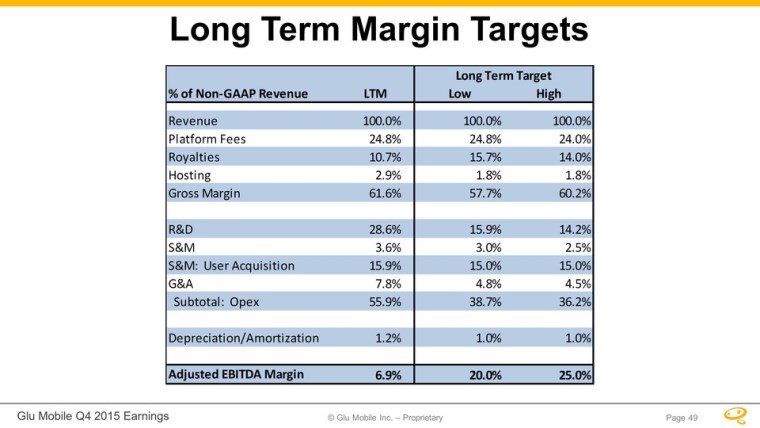
© Glu Mobile Inc. – Proprietary Glu Mobile Q4 2015 Earnings Long Term Margin Targets % of Non-GAAP RevenueLTMLowHighRevenue100.0%100.0%100.0%Platform Fees24.8%24.8%24.0% Royalties 10.7%15.7% 14.0%Hosting2.9%1.8%1.8%Gross Margin61.6%57.7%60.2%R&D28.6%15.9%14.2%S&M6.9%3.0%2.5%S&M: User Acquisition 15.9%15.0%15.0% G&A7.8%4.8%4.5% Subtotal: Opex 59.2%38.7%36.2% Depreciation/Amortization1.2%1.0%1.0%Adjusted EBITDA Margin3.6%20.0%25.0%Long Term Target Page 49
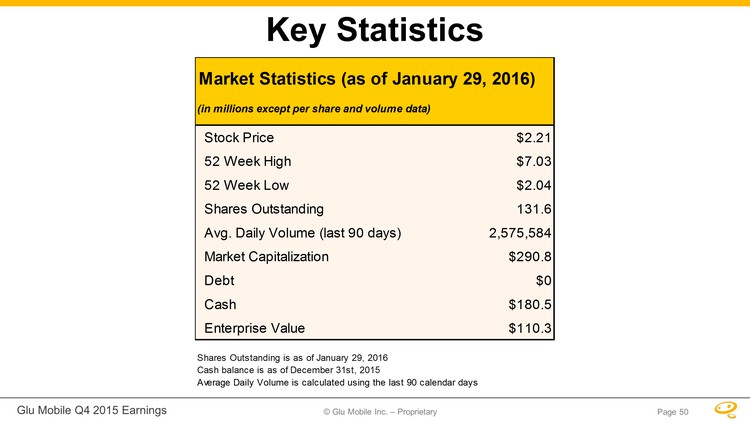
© Glu Mobile Inc. – Proprietary Glu Mobile Q4 2015 Earnings Page 50 Key Statistics Stock Price$2.21 52 Week High$7.03 52 Week Low$2.04 Shares Outstanding 131.6 Avg. Daily Volume (last 90 days)2,575,584 Market Capitalization$290.8 Debt$0 Cash$180.5 Enterprise Value$110.3 Shares Outstanding is as of January 29, 2016Cash balance is as of December 31st, 2015Average Daily Volume is calculated using the last 90 calendar daysMarket Statistics (as of January 29, 2016) (in millions except per share and volume data)Glu Mobile Q4 2015 Earnings
© Glu Mobile Inc. – Proprietary Page 51 Investment Highlights Diversified portfolio of franchises Cost-effective customer acquisition Long-tail social games provide significant visibility Added new studio and technology leadership Strong balance sheet with no debt
© Glu Mobile Inc. – Proprietary Glu Mobile Q4 2015 Earnings Page 52 Non-GAAP ReconciliationsGlu Mobile Q4 2015 Earnings
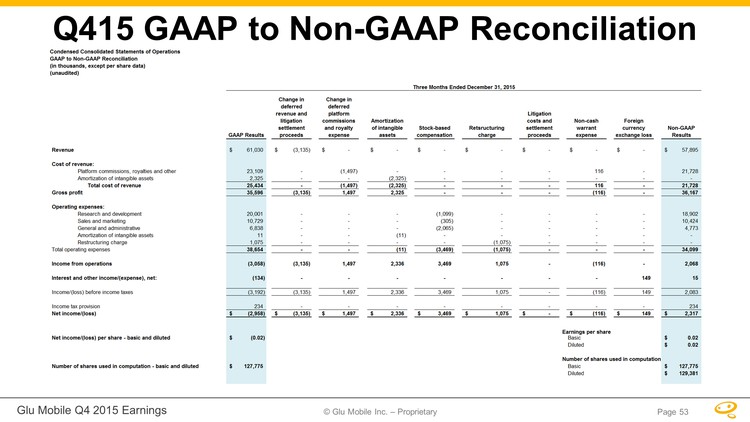
© Glu Mobile Inc. – Proprietary Page 53 Q415 GAAP to Non-GAAP ReconciliationGlu Mobile Q4 2015 Earnings
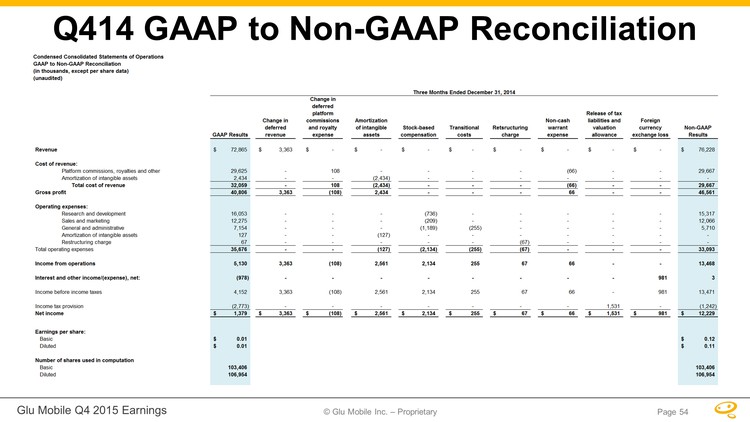
© Glu Mobile Inc. – Proprietary Page 54 Q414 GAAP to Non-GAAP ReconciliationGlu Mobile Q4 2015 Earnings

© Glu Mobile Inc. – Proprietary Page 55 FY 2015 GAAP to Non-GAAP ReconciliationGlu Mobile Q4 2015 Earnings
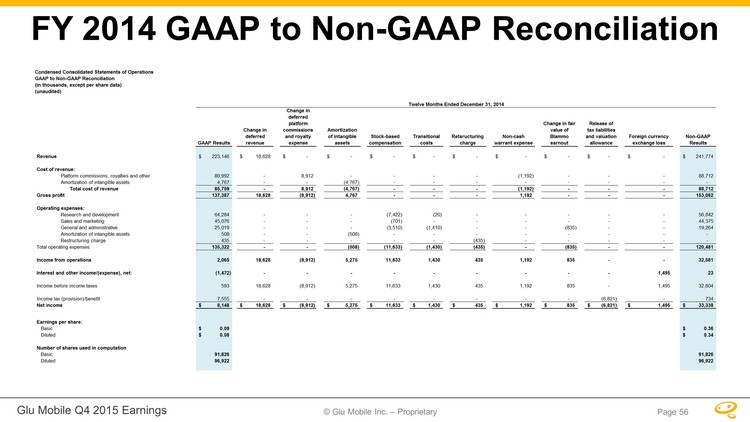
© Glu Mobile Inc. – Proprietary Page 56 FY 2014 GAAP to Non-GAAP ReconciliationGlu Mobile Q4 2015 Earnings
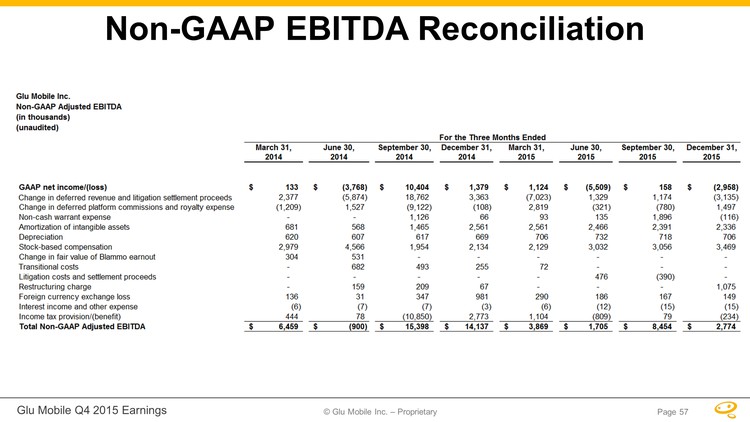
© Glu Mobile Inc. – Proprietary Page 57 Non-GAAP EBITDA Reconciliation
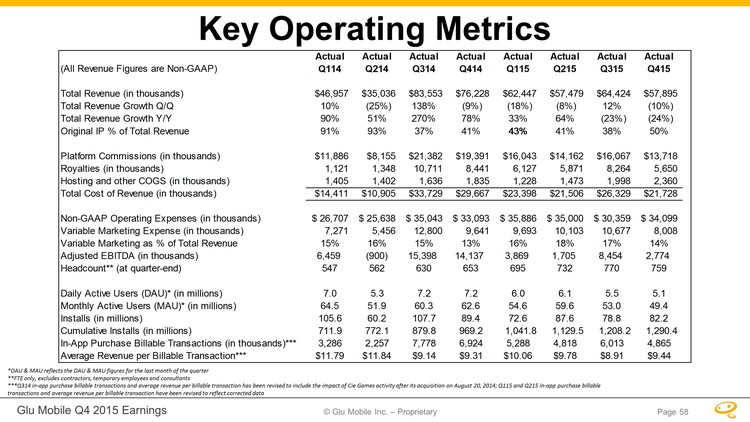
Glu Mobile Q4 2015 Earnings © Glu Mobile Inc. – Proprietary Key Operating Metrics Page 58
Serious News for Serious Traders! Try StreetInsider.com Premium Free!
You May Also Be Interested In
- Wawa Marks Official Entrance into Alabama with First Store Grand Opening in Fairhope
- Radiotherapy Market Size to Grow by USD 10.19 billion from 2024 to 2031- SNS Insider
- Predian Announces the Integration of Wholesale and Auction Pricing Into ValueVision®
Create E-mail Alert Related Categories
SEC FilingsSign up for StreetInsider Free!
Receive full access to all new and archived articles, unlimited portfolio tracking, e-mail alerts, custom newswires and RSS feeds - and more!
